Embed Size (px)
Citation preview
Methods of MR Fat Quantification and their Pros and Cons
International Workshop on NASH BiomarkersWashington, DC
April 29-30, 2016
Michael Middleton, MD PhDUCSD Department of Radiology
1

Disclosures
2
No personal financial or other disclosures
UCSD has had and has Lab Service Agreements with several CROs and pharmaceutical companies

Acknowledgements
3
Dr. Claude Sirlin (Director, Liver Imaging Group, UCSD)
Dr. Gavin Hamilton (PDFF MR Spectroscopy)
Dr. Mark Bydder (PDFF MR Imaging)
The many other previous and current members of the UCSD Liver Imaging Group

Aims of this talk
4
Background on history and principles of MR assessment of liver fat, including description of proton density fat fraction (PDFF)
Brief description of complex and magnitude MRI
Pros and Cons of MR fat assessment methods
PDFF vs. histologic steatosis grade
Possible contexts of use of MRI PDFF
Clinical trial considerations
Closing remarks
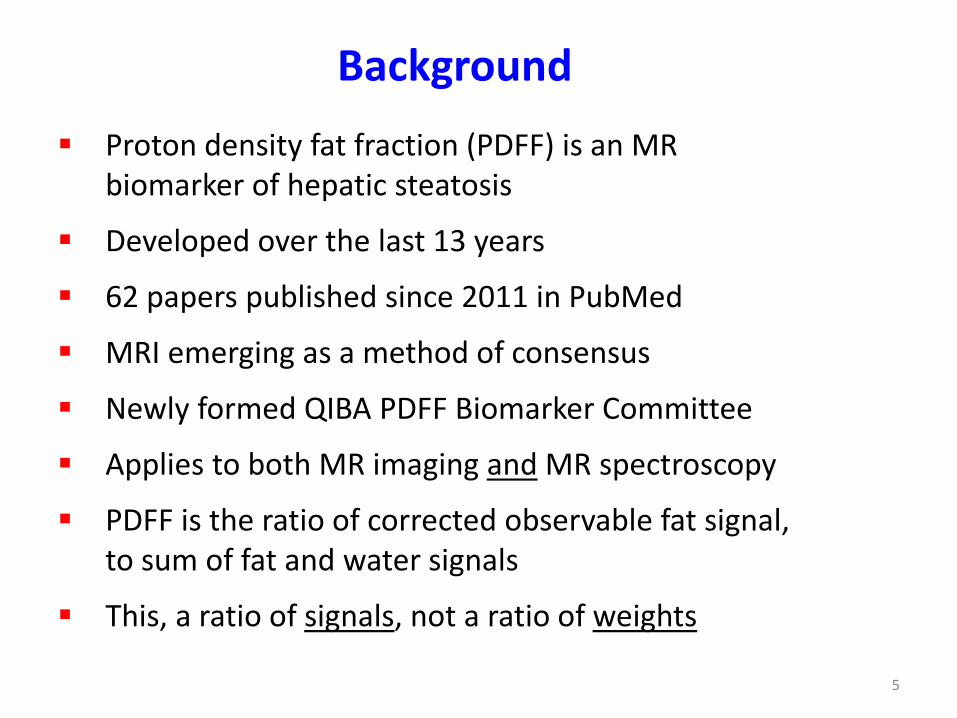
Background
5
Proton density fat fraction (PDFF) is an MR biomarker of hepatic steatosis
Developed over the last 13 years
62 papers published since 2011 in PubMed
MRI emerging as a method of consensus
Newly formed QIBA PDFF Biomarker Committee
Applies to both MR imaging and MR spectroscopy
PDFF is the ratio of corrected observable fat signal, to sum of fat and water signals
This, a ratio of signals, not a ratio of weights

Triglyceride proton environments1
61 - Hamilton et al, NMR Biomed 2011; 24:784-790

1H Spectrum of Fat and Water
7
One water peak, multiple fat peaks
Can be acquired at 1.5T and 3T (STEAM sequence)
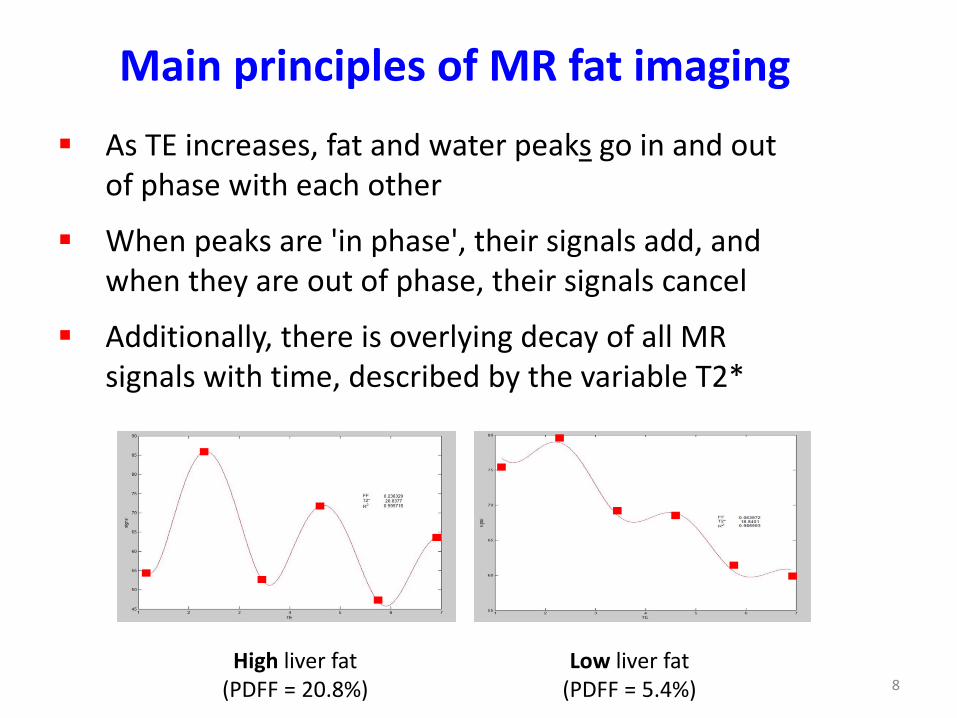
Main principles of MR fat imaging
8
As TE increases, fat and water peaks go in and out of phase with each other
When peaks are 'in phase', their signals add, and when they are out of phase, their signals cancel
Additionally, there is overlying decay of all MR signals with time, described by the variable T2*
High liver fat(PDFF = 20.8%)
Low liver fat(PDFF = 5.4%)

Methods of acquisition
9
Two main methods to estimate PDFF:• Complex MRI (IDEAL-IQ)2
• Magnitude MRI (LipoQuant)
Similarities:• Both typically acquire 6 echoes• Both are acquired avoiding T1 weighting• Both correct for T2* decay• Both acquired in a single breath-hold
Differences:Complex Magnitude
Type of acquisition 3D 2D
Type of data acquired Real and imaginary Magnitude
Range 0 to 100% 0 to 50%
2 - Liu et al, Magn Reson Med 2007; 58:354-364

Confounder correction/avoidance
10
T1 weighting avoided by using long TR values, and small flip angles
T2* decay corrected for by collecting images at multiple TE values, and then solving for T2* and PDFF simultaneously using custom MatLab algorithm
Multi-frequency interference amongst the water peak and the major fat peaks accounted for by 'including' the full, known spectrum of human liver fat in the analysis
Images at all TEs acquired in a single breath-hold to:• provide good co-localization between images• avoid possible differences in transmit and receive gain

11
Typical magnitude MRI acquisition
1.15 msec
2.30 msec
3.45 msec
4.60 msec
5.75 msec
6.90 msec
3.0 Tesla
6 echoes acquired at successive out-of-phase and in-phase TE values

12
Precision Magnitude MRI is precise (3 separate exams, same day)3
Inter-examination ICC for whole liver was 0.999 (95% CI: 0.998, 1.000)
3 - Negrete et al, JMRI 2014; 39:1265-1271

13
Accuracy: Regression Magnitude MRI is accurate compared to MR
spectroscopy as gold-standard
from:Heba et al, JMRI 2016: 43:398-406
506 adults subjects
all had MRI and MRS

14
Accuracy: Bland-Altman Magnitude MRI is accurate, compared to MR
spectroscopy as reference standard
from:Heba et al, JMRI 2016: 43:398-406
506 adults subjects
all had MRI and MRS

Complex MRI
15
Implemented now by GE, Siemens, and Philips as supported sequences
Comparable to magnitude MRI (200 children)4
0
5
10
15
20
25
30
35
40
45
0 20 40 60
MRS
F (%
)
M-MRI PDFF (%)
4 - Haufe et al, ESGAR 2015 Annual Meeting, abstract # 50082
0
5
10
15
20
25
30
35
40
45
0 20 40 60M
RS P
DFF
(%)
C-MRI PDFF (%)slope = 0.991 (0.934, 1.021)intercept = 0.729% (0.340, 1.237%)
slope = 0.981 (0.936, 1.022)intercept = -0.017% (-0.515, 0.510%)

Pros and Cons
16
Complex MRI Magnitude MRI MR Spectroscopy
Pros Supported by MR scanner manufacturers
Accurate and precise; requires no additional analysis for parametric maps
Range 0 to 100% PDFF
Sequences themselves availableon nearly all scanners as standard product
Validated as accurate and precise in many studies
Currently considered reference standard for PDFF
Offers additional capabilities over MRI
Cons Requires purchase of a software package
Not as widely available as magnitude MRI
Reproducibility across scanner types not yet fully validated for on-site results
Not supported per se by MR scanner manufacturers
Requires additional post-processing to produce parametric maps and/or to analyze by ROIs
Range 0 to 50% PDFF
Requires on-site acquisition and analysis expertise
Voxel placement only approximate
Typically only single-voxel
Most often only right lobe

PDFF vs. histologic steatosis grade
17
Not quantitatively the same
Steatosis grade is percentage of hepatocytes showing fat globules by visual inspection on H&E stained slides
PDFF is ratio of MRI signals from fat, compared to that from sum of fat and water
Consider case when all hepatocytes filled to about 50% of their volume with fat globules:• Histologic steatosis percentage would be 100%• PDFF (ignoring details) would be about 50%
Rule of thumb thus is that histologic steatosis percentage is about double PDFF

NASH CRN FLINT Trial Results5
18
Cross-sectional and longitudinal relationships between PDFF and histologic steatosis grade (113 subjects, 8 sites)
5 - Middleton et al, AASLD Annual Meeting 2015 poster # 2150 (a NASH CRN study)

Diagnostic accuracy of PDFF5
19
MRI PDFF thresholds and accuracy to classify histologic steatosis grades, and histologic steatosis grade change
Cross-sectional steatosis classification (n = 113)
MRI PDFF threshold (%) Sens(%)
Spec (%)
PPV(%)
NPV(%)
0-1 vs. 2-3 16.3 83 90 95 73
0-2 vs. 3 21.7 84 90 76 73
Longitudinal steatosis change classification
(n = 78)
ΔPDFFMean (SD) (%)
MRI PDFF cutoff at 90% specificity
Sens (%)
Spec(%)
PPV(%)
NPV(%)
Improvement (n = 42) -7.4 ± 8.7 - 5.1% 58 90 83 75
No change (n = 49) 0.3 ± 6.3 - - - - -
Worsening (n = 9) 7.7 ± 6.0 5.6% 57 90 36 96
5 - Middleton et al, AASLD Annual Meeting 2015 poster # 2150 (a NASH CRN study)

Possible PDFF contexts of use
20
Safety assessment in drug development related to hepatic steatosis, for any study where elevated hepatic steatosis is a concern
Accurate population enrichment to avoid unnecessary biopsies and reduce study costs
As a replacement for histologic steatosis grade (primary, secondary, and exploratory aims), whenever histologic steatosis grade is a biomarker of a clinical endpoint
Add-on to any liver MRI already being done (potentially high incremental value for relatively low additional incremental time and cost)

Clinical trial considerations
21
Magnitude MRI implemented at over 300 sites in over 3,000 subjects in pharmaceutical company studies
UCSD acted as Central Radiology Coordinating Center (RCC) for those studies
For PDFF, and by inference for any quantitative imaging biomarker:• Acquisition and intake QC is essential to study success• QC and analysis supervision by an expert is necessary
until validation and responsibility is assumed by MR manufacturers or others
MRI is strongly preferable to MRS if only estimation of hepatic PDFF is required

Closing remarks
22
MRI-estimated PDFF is a validated, accurate, and precise biomarker of hepatic steatosis
Magnitude MRI supported by a central expert currently allows more flexibility in site selection, but complex MRI will eventually take over that role when it is more widely available, and acquisition methods and results are fully harmonized across MR scanner types
For clinical trials where there is a need to evaluate hepatic steatosis:• central analysis is recommended with special
attention to site training and intake QC• MR imaging is strongly recommended over MR
spectroscopy


![Myocardial Extracellular Volume Quantification by ... · (thalassemia) or fat (Anderson Fabry disease) decrease T1 [10††, 11†, 12†]. The use of extracellular GBCAs in CMR](https://img.dokumen.tips/doc/110x75/606f34d45fa09733451182d3/myocardial-extracellular-volume-quantification-by-thalassemia-or-fat-anderson.jpg)
![Asbjørn Mohr Drewes, MD, PhD, DMSc, Professor, Diagnosis ...€¦ · fecal fat quantification and determination of the coef-ficient of fat absorption[17]. A major drawback of fecal](https://img.dokumen.tips/doc/110x75/6019cc1d947c3d23e23102d8/asbjrn-mohr-drewes-md-phd-dmsc-professor-diagnosis-fecal-fat-quantification.jpg)