Embed Size (px)
Citation preview

The program of research on building materials and structures, carried on by the
National Bureau of Standards, was undertaken with the assistance of the Central Hous-ing Committee, an informal organization of governmental agencies concerned withhousing construction and finance, which is cooperating in the investigations through acommittee of principal technicians.
CENTRAL HOUSING COMMITTEEON RESEARCH, DESIGN, AND CONSTRUCTION
A. C. Shire, Chairman.
United States Housing Authority.
Howard P. Vermilya, Vice Chairman.
Federal Housing Administration,
Sterling R. March, Secretary.
Pierre Blouke,Federal Home Loan Bank Board.
Hugh L. Dryden,National Bureau of Standards.
Louis A. Simon,
Public Buildings Administration.
Luther M. Leisenring,
Construction Division (War).
Edward A. Poynton,Office of Indian Affairs.
John S. Donovan,Farm Security Administration.
George W. Trayer,Forest Service (F. P. Laboratory).
Joseph M. DallaValle,Public Health Service.
George E. Knox,Yards and Docks (Navy).
William R. Talbott,
Veterans' Administration.
Wallace Ashby,Bureau of Agricultural Chemistry and Engineering.
NATIONAL BUREAU OF STANDARDSSTAFF COMMITTEE ON ADMINISTRATION AND COORDINATION
Hugh L. Dryden, Chairman.
Mechanics and Sound.
Phaon H. Bates, Gustav E. F. Lundell,
Clay and Silicate Products. Chemistry.
HoBART C. Dickinson, Addams S. McAllister,
Heat and Power. Codes and Specifications
Warren E. Emley, Henry S. Rawdon,Organic and Fibrous Materials. Metallurgy.
The Forest Products Laboratory of the Forest Service is cooperating with both
committees on investigations of wood constructions.
[For list of BMS publications and directions for purchasing, see cover page iii]

UNITED STATES DEPARTMENT OF COMMERCE • Jesse H. Jones, Secretary
\
NATIONAL BUREAU OF STANDARDS • Lyman J. Briggs, Director
BUILDING MATERIALS
and STRUCTURESREPORT BMS6S
1
Methods of Estimating Loads in Plumbing Systems
by
ROY B. HUNTER
ISSUED DECEMBER 16, 1940
The National Bureau ol Standards is a tact-finding organization;
it does not "approve" any particular material or method of con-
struction. The technical findings in this series of reports are to
be construed accordingly.
UNITED
FOR SALE
STATES GOVERNMENT PRINTING OFFICE • WASHINGTON
BY THE SUPERINTENDENT OF DOCUMENTS, WASHINGTON, D. C. • PRICE
• 1940
10 CENTS
ForewordFor many years, diflPerences in the plumbing regulations or pluiiibing-code require-
ments in different localities have been a source of annoyance to building owners, builders,
and public health officials and have hindered the standardiza tion, on a general or national
scale, of plumbing materials and equipment, and of construction design. The principal
reasons for the existence of phmrbing codes are the protection of the health of the
occupants of a building and of the inhabitants of the community or city in which the
building is located and the protection of property from damage by water or sewage.
The results sought by phmibing requirements and health regulations applying to
plumbing are or should be the same for low-cost or expensive and for small or large
buildings, and may be covered by general regulations applying to all plumbing. Any
simplified or standardized form of plumbing construction which gives these results
—
that is, which complies with necessary general regulations pertaining to sanitation or
health—cannot be prohibited without violating the inherent rights of building owners
and of the public.
Because of the above, this report has been written, as succeeding reports on plumb-
ing in the Building Materials and Structures series will be written, first from the stand-
point of essential general requirements and second from that of permissible construction
within the general requirements—both general requirements and permissible construction
being based on sound physical principles.
This report deals with one of the factors which must be considered in the selection
of adequate yet economical sizes of pipes for plumbing systems—namely, the load to
be expected from a given number and kind of plumbing fixtures. It is expected that it
will be followed by other reports in the Building Materials and Structures series dealing
with other aspects of plumbing problems.
Where the exercise of judgment is necessary in the choice of the numerical value of
factors used in developing and illustrating the application of the method of estimating
loads as described in this report, it will be understood that such numerical values, when
not the actual results of Bureau tests or experiments, represent the author's judgment in
regard to the most suitable factor to use in the application of the method, and that these
are not to be regarded as standard values, unless later approved as such by a repre-
sentative and authoritative body.
Lyman J. Briggs, Director.
[II]

Methods ot Estimating Loads in Plumbing Systems
by
ROY B. HUNTER
CONTENTSPage
Foreword ii
I. Introduction 1
II. Purpose 1
III. Definitions and symbols 2
IV. Basis of selection of pipe sizes 3
V. Character of flow in plumbing systems. 3
1. Cases of loading 5
VI. Statement of the problem 5
VII. Developmentof the probability function. 6
VIII. Interpretation of the probability func-
tion 7
IX Proposed uses of the probability func-
tion for making load estimates 7
1. Pertinent information obtainable
from the probability function^ _ 7
Page
IX. Proposed uses of the probability func-
tion for making load estimates—Con.
2. Values of i, T, t, and q 8
3. Presentation of probability data 11
4. Derivation of fixture weights (fix-
ture units) 13
5. Relative load weights for different
conditions of service 16
6. Application of load chart andweight table 18
X. Adequacy of the method 19
XI. Estimates of sewage loads 20
XII. Discussion 21
XIII. References 21
ABSTRACT
This report describes a method of estimating the
demand and sewage loads for which provision should be
made in designing plumbing systems in order that the
service may be satisfactorv. The characteristics of
flow through a plumbing system and of the operation of
supply valves and plumbing fixtures are described, and
their influence on the method of estimating the load to
be expected is discussed. The relative load-producing
values of different kinds of commonly used plumbing
fixtures are anah zed, and a table is developed giving
relative load weights in terms of a load factor called the
"fixture unit." An estimate curve developed by
means of the probability function is given, and its use
in conjunction with the table of fixture units is illus-
trated.
I. INTRODUCTION
Aside from the choice of materials and equip-
ment as regards quality, style, and quantity of
fixtures, simplification and standardization of
piping layouts offer the principal opportunities
for reduction in cost of plumbing systems.
Simplification and standardization in this
respect must comply with accepted health
regulations and minimum requirements for
plumbing, which in turn should be based on
scientific principles. This is true whether the
building is small and "'low-cost'' or large and
expensive. Few, if any, existing plumbingcodes are based entirely on scientific principles;
and they do not in general permit the simplifi-
cation of plumbing piping layouts that could
be accomplished well within the requirements
for sanitation, and in many cases with moresatisfactory operation than can be obtained byinstallations imder existing codes.
This report deals with one of the factors on
which minimum requirements should be based,
the maximum load to be provided for in plumb-ing systems. Other reports are planned, deal-
ing with the principles of water supply andwater distribution in buildings, the principles
of building drainage, and the principles of
venting.
II. PURPOSE
The purpose of this series of papers is to
collect in an organized form the mass of infor-
mation obtained by the author over a numberof years, beginning with the investigation in
1921 of plumbing of small dwellings, and includ-
ing the current research (1937-40) on plumbing
for low-cost housing, together with the results
of intervening experiments related to plumbing
requirements, and to interpret the results of
these investigations in a form suitable for direct
[1]

and practical application. It is hoped that
this series of papers will supply the logical
answer to many of the controversial questions
pertaining to pipe sizes and design of plumbing
construction.
III. DEFINITIONS AND SYMBOLS
A number of terms employed in the plumbing
industry, and a few that are now introduced
for the first time, are hei-e defined in the sense
in which they are to be used in this and later
papers of this series. Insofar as they are
adequate and applicable, the defuiitions from
Recommended Minimum Requirements for
Plumbing [1]^ will be utilized.
The plumhing system of a building includes
the water-supply distributing pipes, the fixtures
and fixture traps, the soil, waste, and vent
pipes, the building drain and building sewer,
and the storm-water drainage pipes, together
with their devices, appurtenances, and con-
nections within or adjacent to the building.
The building main is the pipe from the street
water main or other source of supply to the
building served.
The water-distributing system is the piping
by which the water is conducted from the
building main to its various places of use within
and adjacent to the building, consisting of
laterals, risers, and branches.
The sanitary system of a building is the piping
system, including soil, waste, and vent pipes,
that conducts waste water and water-borne
wastes from the plumbing fixtures to the street
sewer or other place of sewage disposal.
A plumbing fixture is any receptacle through
which waste water or water-borne waste is dis-
charged into the sanitary system.
A drain is any pipe that carries waste water
or water-borne waste in either the storm or
sanitary system.
A fixture drain is the single drain from a
fixture-trap outlet to its junction with another
drain.
A waste pipe is any drain that carries the
waste water from one or more fixtures other
than water closets.
> Figures in brackets indicate the literature references at the end of
this report.
A soil pipe is any drain that carries the waste
water from one or more water closets with or
without the waste water from other fixtures.
A stack is a vertical section of pipe extending
two or more stories with branches therefrom to
serve the stories through which it passes, as
waste stack, soil stack, or vent stack.
A horizontal branch is a drain, extending
laterally from a soil or waste stack, with or
without vertical sections, to which the fixture
drains in the same story are connected.
A building drain is that part of a sanitary
system which receives the sewage from soil
and waste stacks and conducts it to the building
sewer.
A building sewer is the main trunk of a sani-
tary, storm, or combined system from a point 5
feet outside the uiner face of the building waUto the street sewer.
A primary branch is the single drain line lead-
ing from the base of soil or waste stack to its
point of connection with the building drain or
another branch thereof.
A secondary branch is any branch of the build-
ing drain other than a primary branch.
A vent or vent pipe is any pipe installed ia aj
sanitary system for the pmpose of permitting a
circulation of air through or within the system.
A vent stack or main vent is a vent pipe parallel-
ing a soil or waste stack to which the branch
vents from the stack and its horizontal branches
are connected.
Demand load is the volume rate of demandfor water imposed on the water-distributing
system or any branch thereof by the use of
water, as by plumbing fixtures.
Sewage load is the load in volume or volume
rate imposed on the sanitary system or any
branch thereof by the use of plumbing fixtures.
Charging load is the volume inflow into the
sanitary system from one or more plumbing
fixtures, applicable when the capacity of the
pipe receiving the load depends mainly on the
mternal volmne (cross section times length) of
the pipe.
Receiving capacity is the internal volume of
a section (drain) of the sanitary system, appli-
cable when the total sewage load is an additive
fimction of the separate volumes but not of the
separate rates.
Terminal velocity is the constant velocity of
[2]
flow that exists under fixed conditions whenequihbrium between the forces (gravitational)
producing and the forces (frictional) opposing
flow has been estabhslied.
Design factor m is the particular value of r
out of n fixtm-es that will be found in operation
a selected fraction of the time under the as-
sumed conditions of use.
Fixture unit, or load factor, is a numerical
factor which measures on some arbitrary scale
the load-producing effect of a single plumbing
fixture of a given kind. The use of the fixture
unit makes it possible to reduce the load-
producing characteristics to a common basis.
n= the total number of fixtures or supply
openings of a given kind in the system.
7'=the number of fixtures out of a total of
n which at any given instant of ob-
servation are foimd operating to im-
pose a demand load on the supply
system, or a sewage load on the drain-
age system.
m=the design factor (see definition above).
g=the average volume rate of flow, in
gallons per minute, to or from a
plumbing fixture during actual opera-
tion.
Q=the total volume of water in gallons that
flows to or is discharged by a fixture
at each use.
t=the average duration of flow in seconds
for a given kind of fixture for one use.
7"= the average time in seconds between
successive operations of any given
fixture of a particular kind.
T= a time interval in seconds such that the
event in question (for example, ex-
actly r fixtures will be found operat-
ing) will occur for an aggregate of 1
second.
(7"= the number of combinations of n things
taken r at a time.
p"= the probability of exactly r fixtures out
of a total of n fixtures being found in
operation at an arbitraiy instant of
observation.r=n
y^,p "= the probability that some number of
fixtures between r=m and r=n, in-
clusive, will be found operating at an
arbitrary instant of observation.
IV. BASIS OF SELECTION OF PIPE SIZES
In order to select from a series of available or
stock sizes the minimum size of pipe adequate
to convey a given flow of a liquid, it is necessary
to know accurately the capacities of the differ-
ent sizes of pipe for the conditions under which
the pipe is to be used and to know accurately
the load the pipe will be called upon to carry,
capacity and load being expressed in the same
units or in convertible units.
Pipe formulas, given in terms of the velocity
of flow and factors on which the velocity de-
pends, are the usual means employed in esti-
mating capacities of pipes. It is an easy step
to convert a formula giving the velocity of flow
in a pipe into one giving the volume rate of flow.
As previously indicated, the applicability of
pipe formulas to the conditions existing in
plumbing systems in service will be treated in
other papers. However, since it is necessary to
express capacity and load in the same units in
selecting the proper size of pipe for a given use,
it becomes necessary to consider the units in
which both the expected load and the capacity
of the pipes involved can be expressed before
choosing the units in which load estimates
should be expressed. A pipe-flow formula is
merely an equation of dynamic equilibrium and,
as such, applies only to the particidar condi-
tions—namely, the condition of uniform con-
tinuous flow in the pipe. Hence the conven-
tional pipe formulas apply to the irregular and
intermittent flows that occur in plumbing sys-
tems only during that time (usually very short)
and in that section of pipe in which the variable
factors involved (velocity or volume rate of
flow, pressure or hydraulic gradient, and hy-
draulic radius) are constant.
V. CHARACTER OF FLOW INPLUMBING SYSTEMS
Probably the best conception of the limita-
tions of the applicability of a pipe formula for
adequately estimating the capacities of plumb-
ing pipes, and the best indication of the logical
units to apply in expressing capacity and load
in selecting the proper size of pipe to use in
particular parts of the system, will be given
by considering the changing character of flow
[3]
as the water passes through the system from
the som'ce of supply to the building sewer.
Water closets with flush-valve control of the
supply are chosen for this illustration of vary-
ing flow characteristics, partly because critical
loading conditions in the various parts of the
plumbing system are usually produced bythese fixtures and partly because the factors
that determine the load for an individual
fixture are more nearly constant and can be
more readily evaluated than for other fixtures.
Assume that each water closet demands for
each flush Q= 4 gallons in the average time
^=9 seconds, giving an average rate of supply
to the closet of approximately g=27 gpm, and
that each of these demands will occur on the
average of once in T=5 minutes= 300 seconds.
Since the water-supply pipes are flowing full
under pressure, there will be continuity of flow
in both time and quantity in any part of the
supply system through which water flows to
the water closet or to a group of closets; and
therefore the peak load at any time will be the
sum of the separate demands, r, occurring at
that time, or rq gpm, where g is the average
flow per fixture. In this case a pipe formula
is applicable for computing limiting capacities
on the basis of diameters, lengths, roughness,
and available head. The difficult part of the
problem is to estimate the maximum r out of a
total of n water closets supplied by the system
for which provision should be made.
In the drainage system the flow fi'om the
water closet through the fixture drain (closet
bend) into a horizontal branch will be at about
the average rate of 27 gpm for a period of from
8 to 10 seconds. However, the flow will be
less nearly uniform than the flow into the bowl,
rising to a rate of from 30 to 40 gpm temporarily,
as siphon or jet action comes into play in the
bowl, and dropping immediately following the
peak siphon action to a rate approximately
equal to that of the supply at the time.
In the horizontal branch the temporary peak
flow will flatten out, and the stream will tend
to assume the terminal velocity (see deflnition)
for the diameter and slope of the drain and the
existing volume rate of flow. As the stream
enters the vertical stack, the sudden change in
direction piles the water up, tending to form a
slug of water at the entrance. In fact, the
surge from a single water closet entering a 3- ,
or 4-inch vertical stack through a short hori-)
zontal branch of the same diameter will almostfill the stack at this point. Immediate accelera-
,
tion takes place in the vertical stack and con-'
tinues throughout the length of the stack or,
until the terminal velocity of the stack is ,
reached for the volume rate of flow.^
From the stack the stream will enter the,
sloping primary branch at a velocity muchj
greater than the terminal velocity for that\
branch (shooting flow) ^ and will be deceler-,
ated until the terminal velocity for that volumej
rate of flow is approximately reached. If the,
volume rate of flow, the entrance velocity, andthe slope, diameter, and roughness of the pri-
j
mary branch are in the proper relation, the ,
transition from shooting flow at the entrance\
to gravity flow will occur in a hydraulic jump,j
a phc>nomenon which frequently occurs in the\
primary branches of building drains.j
Throughout the drainage system in the direc-j
tion of flow there is a continuous decreasej
in the volume rate of flow from a single closet|
or a group of closets flushing at the same time,||
a corresponding increase in the time of flow,jj
and a continuous decrease in the peaks pro- i
duced by siphon or jet action in the bowl or|
by the overlapping of the flows from diflerent|
closets.
The conception of flow in plumbing drains as
described has been verified by numerous ex-
periments in the laboratory and by numerousobservations and depth measurements made onthe building drains of large systems in actual
service. In plumbing drains the peak rate of
flow from a water closet at the point of entrance
to the horizontal branch is usually reduced to I
about one-half that rate at the point of transi- e
tion from shooting flow to gravity flow in a j
primary branch, and the volume rate of flow e
continues to decrease from that point on. t
If a single water closet flushes on the average J
at intervals of 5 minutes and delivers 4 gallons i
for each flush, the stream in the drain tends i
toward a continuous flow of Q/T=4/5= 0.8 gpm|
as the distance from the water closet increases,ii
Likewise for a very large number of water
2 Shooting flow here refers to the high-velocity constantly decelerating
flow that occurs in the primary branch of a building drain between its
juncture with the soil stack and the hydraulic jump in the primarybranch. <
[4]

closets, /i, each used at that average rate, ami
a very long building drain, the flow tends
toward a uniform value 0.8 n gpm. If n is
greater than Tjt, it is obvious that flow in the
main building drain will be continuous for the
greater part of the time that each of the closets
is being used at the average rate of once in Tseconds, and that the tendency toward uniform
continuous flow will increase as the size of the
plumbing system increases—that is, as n and
the length of the drains increase. Hence in a
very large system in which all n closets are in
continuous use, the outflow will be continuous
and the rate will fluctuate around 0.8 n gpm.
Since the stream in the main building drain
and building sewer of large biiildings approaches
uniform flow, and since these drains are ordi-
narily laid with a uniform slope, load and
capacity can be most adequately expressed in
volume rate of flow and a pipe formula for
imiform flow may be used in estimating limits
of capacity for building drains. However, it
should be kept in mind that the volume rate of
flow in any particular section of the drainage
system is not an additive function of the separ-
ate volume rates of flow into the system.
There is another consideration that has a
direct beaiing on the method chosen for esti-
mating the loads to be provided for in a build-
ing drainage system and on the choice of units
such that load and capacity may be expressed in
the same units. The horizontal branches, the
entrance fittings to soil and waste stacks, and
primary branches are parts of the drainage
system in which critical loading or possible over-
loading are most likely to occur. In horizontal
branches which lie near the fixtures, and to a
lesser degree in the stack fittings and hori-
zontal branches, the determinate factors in the
selection of adequate drain pipes are the charg-
ing load and the receiving capacity. In esti-
mating the charging load to be provided for,
the problem is again to obtain a reasonable
estimate of the value of r to be provided for in
relation to n. The details of the method re-
lating to receiving capacity will be completed
in the papers dealing with capacities.
1. Cases of Loading
From the character of the flow in the water-
supply system and in the drainage system as
descj-ibed, it is obvious that there &vv, three
distinct cases of loading to be consideretl
:
(1) One applying to the supply (the demandload) which will be measui'cd by 2/(2, where r
is the number of separate like demands at the
time for one kind of fixture and g[ the average
volume rate of flow per demand, rq the total
flow for r fixtures of one kind, and Zrg the sumor total flow for fixtures of difl'erent kinds;
(2) one applying to hoi'izontal branches (the
charging load) which will be measured by 2rQ,
hi which r is the number of like fixtures flowing
at the time and Q is the average volume of
sewage per fixture introduced into the drain
within the time necessary to consider in relation
to a particular location of the drain; and (3) a
third case applying as a limit for building drains
and building sewers which will be measured in
terms of "LnQJT, in which n is the total numberof any one khid of fixtm-e installed in the system,
Q the average volume used per fixture, and Tthe average time between uses. In cases 1 and
2, the load rg to be expected and provided for in
the design of the plumbing system depends,
with a few exceptions, on approximately the
same time factors, t and T, and hence bears
approximately the same relation to the numberof fixtin-es, n. (See page 20.)
VI. STATEMENT OF THE PROBLEM
As stated in describing the conditions of
flow in plumbing systems for which load esti-
mates are sought, the most difficult part of the
problem is to estimate the proportional part of
the total possible load that should be provided
for—that is, the number of demand or charging
loads, r, bearing some logical relation to the
total number of fixtures, n. In an earlier
paper [1] the authors suggested the relation
between r and n expressed by a probability
function as a possible means of estimating
loads to be expected in plumbing systems and
developed the function applying to certain
special cases.
It now appears that the possibilities of the
pi'actical application of this function and the
limitations of the method under certain condi-
tions have not been understood clearly. It
seems advisable, therefore, to consider the
probability function in its more general form.
[5]

I
I
to explain more fully the suggested method of
employing the function in making the estimates
in question, and to point out certain limitations
in its practical application. The problem
may be stated as follows: Assuming that there
are n fixtures in a system, each operated once
in T seconds on the average, and that each
operation is of t seconds' average duration,
what is the probability that r fixtures will be
found operating simultaneously at any arbi-
trarily chosen instant of observation?
It is necessary to define the expression,
"operating simultaneously," in order to com-
pletely define a particular event of "r fixtures
operating simultaneously." In the following
development of the theory, this event will be
considered as occurring when r, and only r,
fixtures are found flowing at the instant of
observation; and hence the r fixtures found
flowing will include all those, and only those,
which began their operation during the f-second
interval immediately preceding the instant of
observation.
VII. DEVELOPMENT OF THE PROB-ABILITY FUNCTION
By the generally accepted concept of prob-
ability, the probability that a particular fix-
ture out of a number, n, will be found operating
at any arbitrarily chosen instant of observation
is tjT, where t has been defined as the duration
of each operation and T as the time between
operations of each fixture. In the same man-ner, the probability that the particular fixture
will not be in operation at the instant of obser-
vation is 1 — i /T or (T—t)/T.
A law of combinations that applies to the
composite event of which the probability is
sought in this problem may be stated as fol-
lows: The number of ways in which two or
more independent events can occur together is
the product of the ways each can occur sepa-
rately. A similar law of probability may be
stated as follows: The probability of two or
more independent events occurring together, in
this case at the same instant, is the product of
the probabilities of their separate occurrence.
By the law of combinations, the probability
that none of the remaining n—1 fixtures will
be operating at the instant of observation is
The probability that a particular
one of ?i fixtures and none of the remaining ?? — 1
fixtures will be operating at the instant is
But since there are n fixtures, there are n ways '
in which the event, one and only one fixture -
found flowing, can occur, and hence the proba-j
bility of this event being found occurring at
the instant of observation is
|
This can be generalized fox any group of r, j
and r only, constituting the particular event I
for which the probability is sought, by again t
applying the definitions and laws. 'i
In any group of r fixtures the probability a
that any particular one will begin to operate J
within a given t seconds is t/T, and since there i
are r cases in the group, the probability, that ^
all r fixtures will begin operation within the
same f seconds is (t/Ty. Also, of the n fix-'
tures, any one of
n{n—l) {n—2) to r factors_ nl,
different groups is equallj^ likely, and hence by '
the law of combinations the probability that'
some one of the equally likely groups of r fixtures
will be in operation at the instant of observa-
tion will be ^"(^Y'^r-As before, the proba-
bility that the remaining 71— r flows will fall
outside tins particidar t seconds is ( j, 1 • .
Therefore, the probability that exactly r fix-
tures will be operating at a particular instant^
of observation in the maiiner defined is
. . .
(2)
'
This is the general term of a series, expressing^
the probability that r out of n fixtures will be|
foimd flowing at any arbitrary instant of '
observation. This series may be represented|
as '
[6]

(3)r=(j r=0 J-
Equation 3 is equivalent to the binoniial
/ t T— 1\expansion of
( j""!" 7^ ) tlie
conventional expi'ession for certainty, since
either no fixtures, r— Q, or some niunber of
fixtures from r=f to r= n must be operating
at the instant of observation.^
VIII. INTERPRETATION OF THE PROB-ABILITY FUNCTION
As previously stated, the probability function,
Pr, eq 2, gives the probability that exactly r
fixtiires out of a total of n will be found operat-
ing at an arbitrary instant of observation, pro-
vided that all n fixtures are in continuous use
at the assumed rate. The probability, ^"i
may also be interpreted as the percentage or
fraction of the time in the long run that r flows
will occur in the manner defined, since the
fraction
time of r fixtures operating
total time
is also the probability of the occurrence.
Hence for any given values of n and r, if the
probability function as developed is multiplied
by a time t in seconds such that
rjp''=rC"l~^(^y-'=l second, ... (4)
or
T r
the equation signifies that / fixtures will be in
simultaneous operation for an aggregate of 1
second out of every r seconds that all n fixtures
are in use at the assumed rate. Likewise, the
condition that a chosen design factor, r=m,,
will not be exceeded more than a given fraction
of the time 1/r, is expressed by
r= 77!+l
(5)
• ' Equations 2 and 3 may be developed by other methods and in dif-
ferent forms. However, the results will be identical or may be reduced
to an identity, as evidenced by the function developed by Fry [2] for the
analogous problem of busy lines in telephone systems (see eq 156, p. 335,
of the reference), which differs from eq 2 only in the form to which it is
reduced and in the notation employed.
Equations 4 and 5 are based on the assump-
tion that all n fixtures will be in continuous
use over the entire time r at the average rate
of once in T seconds. The time r may be
reduced to days or years on the basis of the
daily period of peak use, by assuming or de-
termining this period and computing on the
basis of a day of that length.
IX. PROPOSED USES OF THE PROB-ABILITY FUNCTION FOR MAKINGLOAD ESTIMATES
1. Pertinent Information Obtainable FromTHE Probability Function
It may be helpful in judging the reasonable-
ness of the proposed application of the proba-
bility function to summarize the information
obtainable from the probability function before
proceeding with the selection of the time
factors applicable to practical cases.
The following pertinent information can be
obtained from the equations developed:
(a) The probability that a given number of
fixtures, m, out of a total of n, will be operating
at an arbitrary instant of observation, deter-
mined by eq 2.
(b) The fraction of the time that m and only
m fixtures will be operating at the same instant,
a second interpretation of eq 2.
(c) The fraction of the total time that anynumber of fixtures greater than the design
number, m, will be operating at the sameinstant, determined by eq 5.
(d) The ratio of any two successive terms in
the series of eq 2; for example, the ratio of the
fraction of the time r-|-l to the fraction of the
time r fixtures will be operating at the sameinstant, determined by
TJ \ T
(6)
There are certain characteristics of the
probability series given in eq 2 which will be of
material aid in determining the conditions onwhich the design factor m is based. In the
series, eq 2, the value of successive terms in-
creases as /' increases up to the most probable
272131°—40 2 [7]
value or values and then decreases. Also, the
ratio of any term to the preceding term of the
series decreases continuously as r increases
from r=l to r—n . These characteristics makeit possible to determine the value m that will
not be exceeded more than the fraction l/r of
the time without completing the entire summa-tion from the w + 1 to nth term.
If pm^'i-lT, and if the ratio (eq 6)
n— m t ^1
r= n
the summation y^,p" must be less tlian 1/t,r=m+l
because the finite series
which results from the series
pz+i+pm+2+ +p:,
by multiplying and dividing this last series by
Pm, substituting the value 1/2 for the ratio
Pm+i/Pm, and replacing the factor p^ by l/r, is
less, term by term, than the infinite series
e ••]
which is known to approach the value l/r as
the number of terms increases without limit.
When the series satisfies this condition, it can
be positively stated, without summation, that
a design factor r—m will be exceeded less than
l/r of the time.
ft— I' t
If —r—rXTfr—;~>l/2, sunnnatioii is necessarvr+ 1 i — t
in order to determine a value of r=m that will
not be exceeded more than l/r of the time, but
it is unnecessary to carry the summation beyond
n— T t
the term where —r^'Kyf—j<l/2.r+ 1 I —t
2. Values or ^ T, r, and q
In applying the probability fimction for
estimating the design load mq, it is necessary to
select values of t, T, and r from which to com-
pute the value of m and to select a value of q,
the factors excepting r pertaining to a particular
kind of fixture and service. The actual values
selected in any case are largely a matter of
engineering judgment. In this connection, it
is to be understood that in the following
development and illustrative examples, the
values selected represent the author's judgment
in regard to the appropriate values for pro-
ducing satisfactory service and are based on
the author's interpretation of the information
available.
For the purposes of this discussion satisfactory
service is defined in a relative sense as that in
which interruption in service because of con-
trollable factors, such as the sizes and arrange-
ment of pipes, is infrequent and is of sufficiently
short duration to cause no inconvenience in
the use of fixtures or any unsanitary condition
in the plumbing system. Attainment of satis-
factory service will depend on the selection of
the design factor m, or more specifically on the
value of r from which the value of m is com-
puted. The value of r selected for illustrating
the proposed application is 100 seconds, which
provides for wholly satisfactory service 99 per-
cent of the time and for reasonably satisfactory
service all of the time if the design load mq gpmis not greatly exceeded. In this connection,
it will be observed that if m is exceeded in
actual service it is most likely to be exceeded
by one fixture only and is progressively less
likely to be exceeded by two, by three, or more.
Obviously t and q bear a direct relation to Qin respect to the values necessary to provide
satisfactory service if m fixtures are in opera-
tion simultaneously. Since there is a consider-
able range in the values of t and Q on which
the value of q depends for any particular fixture,
it will be very helpful to the engineer in deter-
mining reasonable values to be used for a
particular kind of fixture to consider the charac-
teristics of operation of that kind of fixture.
It is a characteristic of water closets that
they will operate more or less effectively under
any average rate of supply from about 15 gpni
up to rates of about 30 gpm or more delivered
in any time ranging from about 6 seconds up.
For each type and design of water-closet bowl
there is an intermediate smaller range of aver-
age rate of supply within which there is no
detectable dift'erence in the effectiveness of
the flush in emptying the bowl of its contents.
There is likewise a range in time of flow within
[8]

which the bowl will he effectively emptied of
its contents with an average rate of supply
anywhere within the smaller range referred to.
From the evidence of experiments reported
in the earlier paper [1], the Subcommittee on
Plumbing of the United States Department of
Commerce Building Code Committee agreed
upon an average rate of 30 gpm for 10 seconds
as a reasonable and safe basis for estimating
loads to be expected in building drainage
systems. The experiments referred to were
designed to obtain the maximum loads per
closet that could be delivered to the drains
within the operational range of water closets,
and no attempt was made to determine either
the most effective rate of supply for a particular
type of bowl or an average rate that would pro-
duce a satisfactory flush in all types of closet
bowls. It is to be expected, as has been the
case, that overestimates would result when the
maximum values of all load factors involved
are employed in estimating. More recent ex-
periments [3] by Camp give rates of supply for
safe and economical flushes ranging from 20
gpm to 29 gpm for different types of closet
bowls and. times of flush ranging from 7.5 to 9
seconds, omitting data for one bowl with spiral
flow action. The averages for six difl'erent
bowls are 25.9 gpm and 8.2 seconds. Unpub-lished data from still more recent experiments
[4] at the National Bureau of Standards indi-
cate that the most effective removal of the
contents of a closet bowl occurs with rates of
supply ranging from about 20 to 24 gpm and
that the complete contents of the bowl are
removed, if removable by any rate of flow, in
times ranging from about 6 to about 10 seconds
for different types of bowls.
In both cases the data were obtained with
approximately uniform flow through the bowl,
and that average rate of flow which maintained
continuous siphon action through the bowl was
taken as the criterion for the most efl'ective
flushing rate. Considering the wide ranges in
rate and time of supply within which a closet
bowl will operate effectively, Camp's and
Golden 's data may be regarded as in sub-
stantial agreement. However, none of the
experiments cited closely simulates service
conditions, for the rate of supply in actual
service is not luiiform, whether supplied by
flush valve oi' flush tank: it I'iscs to ii mnxininiu
at or near the beginning iuid griiduiilly de-
creases as the valve closes or as the tank
empties. The characteristics of an effective
flush may be summarized as follows:
A quick priming of the siphon; a continuous
siphon action for sufficient time to clear the
bowl of its contents and carry them through
the trapway; and a breaking of the siphon
action before the flow ceases, in order to refill
the trap. Wliether by design or chance, the
characteristic operation of conventional supply
devices (flush valves and flush tanks), if pro-
perly adjusted for volume and time, controls
the rate of supply in a manner that meets
these flushing requirements admirably. In
figure 1, curve 1 is the reproduction from
Camp's report of a typical rate curve for a
flush valve, representing a flow of 3.8 gallons
in 8.5 seconds giving a peak rate at the end of
two seconds of approximately 37 gpm and an
average rate of 26.9 gpm over the time the
valve is in operation. Curve 2 is the rate
curve for a flush tank plotted from Golden 's
data for a flow of 4 gallons in 9.1 seconds giving
a peak rate about 31.5 gpm at the end of 1
second and an average rate of 26.4 gpm. In
both cases the flow reaches a rate within the
first second amply sufficient to prime the siphon
of any standaxd type of closet bowl and there-
after is maintained for 6 or 7 seconds within
the range required to produce continuous
40
<
/ // /
-Tf-1 /
+7—1/
li1. FLUSH VALVE
2. FLUSH TANK\
i;1
I
i
I
A—\
\ \0 2 4 6 8
TIME -SECONDS
Figure 1.
—
Typical time-supply m,rves for water-closet
bonds.
\9]
siphon action. The total volume, the average
rate of flow, and the duration of the flush in
these examples are all greater than necessary
for an effective flush in the types of bowls most
commonly used—washdown, reverse trap, and
siphon-jet bowls. It is impractical to attempt
to estimate individual variations either in
rates of supply or in rates of use of fixtures.
Hence, it is advisable to set the factors chosen
for making estimates high enough to allow
some leeway in adjusting down to the volume
and rate of supply needed for satisfactory
service in particular cases, since it is impossible
to adjust for greater rates of supply than the
supply pipes are capable of delivering.
Considering the problem of estimates from
all angles, an average rate of supply of 27 gpmfor a duration of 9 seconds, giving a volume of
approximately 4 gallons per flush, appears to
meet requirements generally as nearly as can
be done in round numbers and will be employed
for flush valves for water closets in evaluating
the probability function in the further develop-
ment of the methods of estimating demand
loads.
The rate of supply to flush tanks for water
closets is not related directly to the rate of
supply required by the closet for effective
operation. The only essential for operation
of the fixture is that the tank refill in the interim
between operations. A rate of 4 gpm is
ordinarily considered sufficient, which for a
volume of 4 gallons gives a value of 60 seconds
for f. The value of T should obviously be the
same for flush-valve and flush-tank supply.
In case of faucet-controlled supply for fix-
tures, it is not possible to base the time factors
or the quantity of water used on the character-
istic operation of the fixture as was done for
flush valves for water closets, because the
manner in which faucets are operated depends
largely on personal habits or preferences.
For such fixtures an arbitrary selection of
values, made from a consideration of relative
rates of supply and volumes used, appears to
be the only recourse.
An average rate of supply of 8 gpm would per-
mit the drawing of 8 gallons in 1 minute (60
seconds), 16 gallons in 2 minutes, 24 gallons in
3 minutes, etc. Bathtubs, depending on size
and style, hold from 25 to 40 gallons when filled
to the overflow. Ordinarily only a fraction,
possible % to H, of these volumes will be used for
a bath. The time, T, between uses will include
the time required to draw the water, the time
taken for bathing, the time required to emptythe tub, and any additional time consumed in
the complete bathing operation. This total
time, T, between operations of the fixture seemslikely to range from about 15 minutes for hur-
ried baths to about 30 minutes for baths taken
more leisurely. It also seems likely that
smaller quantities of water will be used under
the former than under the latter conditions.
Now, assume that 8 gpm is an ample average
rate of supply for a bathtub. This is 60 percent
higher than some [5] and 20 percent lower than
other [6] estimates of a satisfactory average rate
of supply for a bathtub. An average rate of
supply of 8 gpm, an assumed average time of
filling of t=60 seconds, and an assumed time
between operations of T=900 seconds (15
minutes) would provide for an average of 8
gallons per bath. For an average volume of 16
gallons per bath and the same rate of supply, 8
gpm, 120 seconds (t) will be required to drawthe bath. If the rate of operation (average
time taken per bath) is once in 30 minutes, giv-
ing 7"= 1,800 seconds, the ratio of t/T is the
same in both cases; 60/900=120/1,800=1/15.Since for a given value of n the value of p" for
any value of r is determined by the ratio t/ T, the
probability of a selected design load mq being
exceeded will be exactly the same for the two
cases cited or for any other case in which the
time T is proportional to the volume used and
the same basic rate q is employed. From these
considerations, a design load mq, for bathtubs
in congested service, based on an average rate
of supply of 8 gpm, and a ratio tfT=l/15 ap-
pears to insure fairly satisfactory service and is
used as the basis of the development and com-
parisons following.
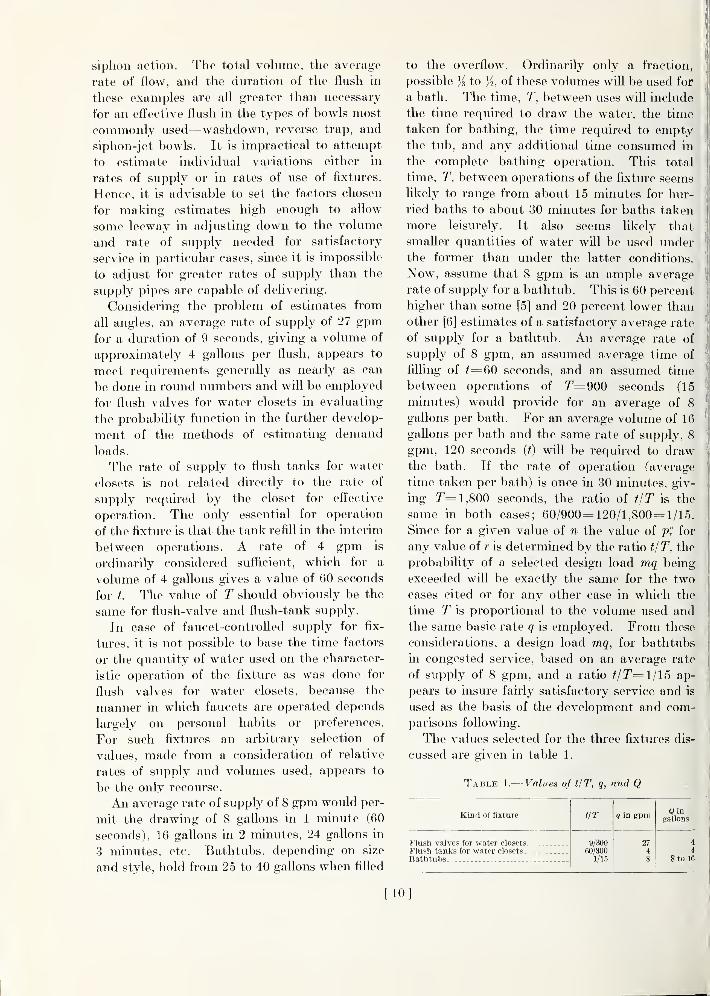
The values selected for the three fixtures dis-
cussed are given in table 1.
Table 1.— Values of t/T, g, and Q
Kind of fixture tIT q in gpm Q in
gallons
Flush valves for water closets ... 9/30060/300
1/15
27
4
8
44
8 to 16
Flush tanks tor water closets
Bathtubs
[10]
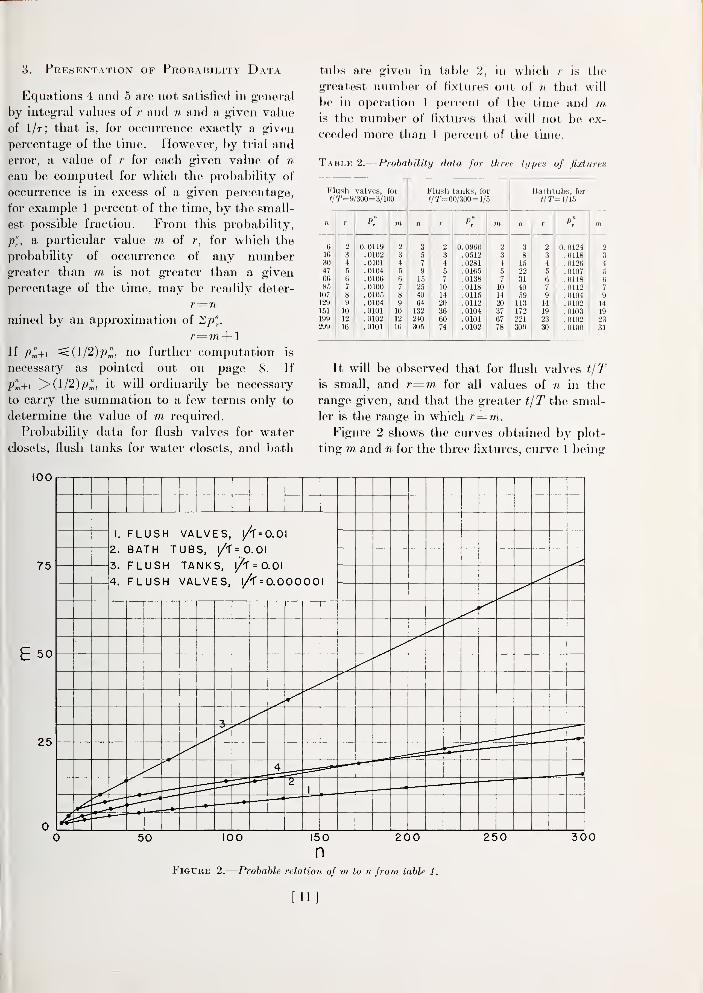
3. Presentation of Probability Data
Equations 4 and 5 are not satisfied in general
by integral values of r and n and a given value
of 1/t; that is, for occurrence exactly a given
percentage of the time. However, by trial and
error, a value of r for each given value of n
can be computed for which the probability of
occurrence is in excess of a given percentage,
for example 1 percent of the time, by the small-
est possible fraction. From this probability,
a particular value m of r, for which the
probability of occurrence of any numbergreater than m is not greater than a given
percentage of the time, may be readily deter-
mined by an approximation of 2^?".
r=m+
1
If ip1+x <{l/2)p^, no further computation is
necessary as pointed out on page 8. If
'^(l/2)p^, it will ordinarily be necessary
to carry the summation to a few terms only to
determine the value of m required.
Probability data for flush valves for water
closets, flush tanks for water closets, and bath
tubs are given in table 2, in which r is tlie
greatest number of fixtures out of n tliat will
be in operation 1 percent of the time and mis the number of fixtures that will not be ex-
ceeded more than 1 percent of the time.
Table 2.
—
Probability data for three types of fixtures
Flush valves, for
f/!r=9/300=3/100Flush tanks, for
t/T=60lm=H5
n r m n r P" m n r P" m
6 2 0. 0119 2 3 2 0. 0960 2 3 2 0. 0124 2
16 3 .0102 3 6 3 .0512 3 8 3 .0118 3
30 4 .0101 4 7 4 .0281 4 15 4 .0126 4
47 5 .0104 5 9 5 .0165 5 22 5 .0107 5
66 6 .0106 6 15 7 . 0138 7 31 6 .0118 685 7 .0100 7 25 10 .0118 10 40 7 .0112 7107 8 .0105 8 40 14 .0115 14 59 9 . 0104 9129 9 .0104 9 64 20 .0112 20 113 14 .0102 14151 10 .0101 10 132 36 .0104 37 172 19 .0103 19199 12 .0102 12 240 60 .0101 67 221 23 .0102 23299 16 .0101 16 305 74 .0102 78 309 30 .0100 31
Bathtubs, for
^/r=i/i5
It will be observed that for flush valves tjT
is small, and r=m for all values of n in the
range given, and that the greater tjT the smal-
ler is the range in which r= m.
Figure 2 shows the curves obtained by plot-
ting m and n for the three fixtures, curve 1 being
100
75
E 50
I. FLUSH VALVES, /'r=O.OI
2. BATH TUBS, 1/1'= 0.01
3. FLUSH TANKS, /'l' = 0.01
4. FLUSH VALVES, l/r = 0.000001
300
Figure 2.
—
Probable relation of m. to n from table 1.
fill

500
400
300
a.
200
100
I. FLUSH VALVES2. BATH TUBS3. FLUSH TANKS4. AVERAGE FLOW, FLUSH VALVES
AND FLUSH TANKS5. AVERAGE FLOW, BATH TUBS
300
Figure 3.
—
Prohahle flow in relation to n.
for flush valves, curve 2 for bathtubs, and
curve 3 for flush tanks. A value of m for flush
valves that would not be exceeded for morethan one-raillionth of the time was also com-
puted, and the results are represented in figure
2 by curve 4.
Estimates of pipe capacities will ordinarily
be obtained in flow units, for example in gallons
per minute. Hence it will be more convenient
in practice to have the demand load expressed
in the same imits. This may be obtained byplotting mc[ and n as shown by figure 3, in which
g is taken as 27 gpm for flush valves, 4 gpm for
flush tanks, and 8 gpm for bathtubs. Theaverage flow, nQjT, during the time the fixtures
are being used at the rate of once in the time Tis also represented in figure 3, for flush valves
and flush tanks by line 4 and for bathtubs byline 5.
Cm-ves 1,2, and 3, in figiu'e 3, show the rela-
tion of demand loads to number of fixtures,
based on estimated time factors representing
congested conditions of service—that is, the
maximum practical rate at which fixtures can
be used continuously in actual service. Assum-ing the correctness of the factors employed in
evaluating the probability functions, the curves
may be used for estimating the demand loads
for any particular number of fixtures of one
given kind. However, the design load for all
kinds of fixtures installed in one system should
not be the sum of the design loads computedseparately for each kind of fixture, even though
the individual curves may be correct. Simul-
taneous operation of difl^erent kinds of fixtures
is a chance occurrence which would have to be
evaluated by another probability function.
Although such an evaluation is possible on the
basis of the assumed average time factors, the
process is too complicated for convenient appli-
12]
I
cation in the field or office and, because the
time factors for faucet-supplied fixtures on
which the probability of simultaneous operation
depends cannot be determined in general,
would in the end lead to doubtful results. For
these reasons it is believed that reasonably
satisfactory results, which are much simpler to
apply, may be obtained by weighting each
kind of fixture and applying the weighted sumof the total numi)ers of fixtures of all kinds to a
load curve for flush valves or a load curve for
flush tanks, according to wliich type of supply
is to be used.
4. Derivation of Fixture Weights (Fixture
Units)
In Recommended Minimum Requirements
for Plumbing [1], fixtures were weighted in the
scale from 1 to 6, this scale being selected
largely because, of the fixtures installed in the
greatest numbers, the smallest load (lavatory)
was estimated to be about one-sixth of the
largest load (water closet). The scale chosen
is purely arbitrary, and it is now suggested
that a decimal scale, 1 to 10, would give a muchmore flexible system of estimating.
A comparison of the relative loading eft'ects
of the three kinds of fixtures may be made bymeans of the curves in figure 3. Obviously
there is no common exact ratio of the loading
effects of any two different kinds of fixtures,
each kind using water at dift'ei'ent volumes, Q,
volume rates, g, and different time intervals, T,
over any considerable range in number of
fixtures, n. For example, for a demand of
50 gpm, the number of fixtures from which this
load would be occurring not more than 1 percent
of the time is approximately (fig. 3) as 5:34:33,
respectively, for flush valves for water closets,
flush tanks for water closets, and bathtub
supply (total). The load-producing weights
are inversely as the number of fixtures pro-
ducing a given load; hence, on the basis of
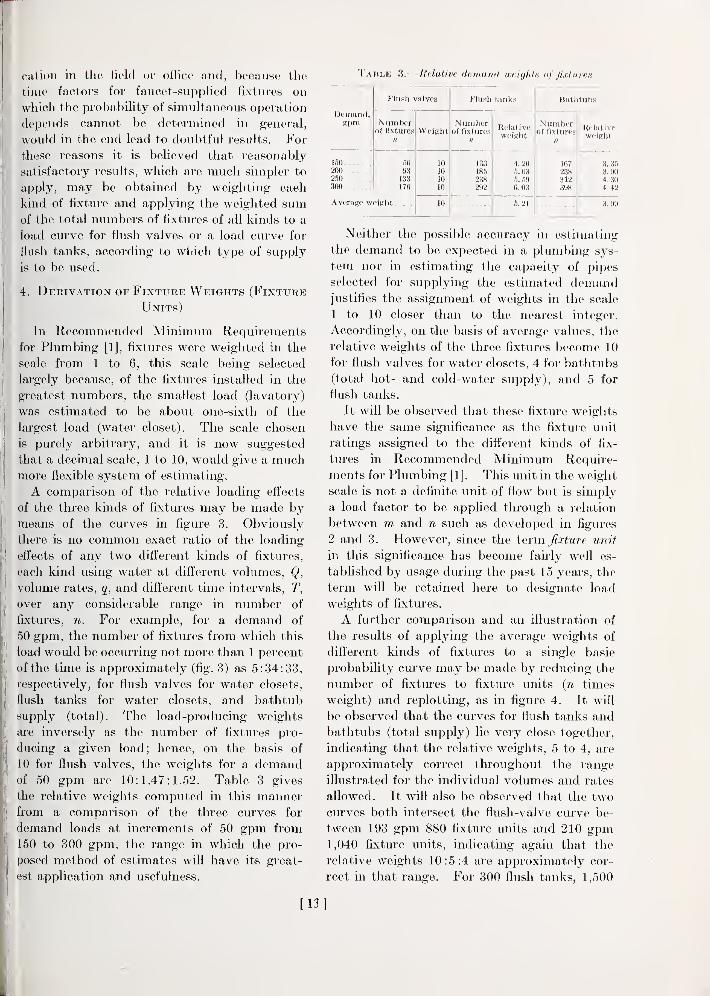
10 for flush valves, the weights for a demandof 50 gpm are 10:1.47:1.52. Table 3 gives
the relative weights computed in this mannerfrom a comparison of the three curves for
demand loads at increments of 50 gpm from
150 to 300 gpm, the range in which the pro-
posed method of estimates will have its great-
est application and usefulness.
Table 3.
—
Relative demand weigldis of fixtures
Demand,gpm
ISO200250300
Flush valves
Numberof fixtures
56
93133m
Average weight .
Weight
Fhish tanks
Numberof fixtures
133185238292
Relativeweight
4.205. 035.596.03
5. 21
Bathtubs
Numberof fixtures
1B7
238312398
Relativfweight
3. 353. 904. 304.42
3.99
Neither the possible accuracy in estimating
the demand to be expected in a plumbing sys-
tem nor in estimating the capacity of pii)es
selected for supplying the estimated demandjustifies the assignment of weights in the scale
1 to 10 closer than to the nearest integer.
Accordingly, on the basis of average values, the
relative weights of the three fixtures become 10
for flush valves for water closets, 4 for bathtubs
(total hot- and cold-water supply), and 5 for
flush tanks.
It will be observed that these fixture weights
have the same significance as the fixture unit
ratings assigned to the different kinds of fix-
tures in Recommended Minimum Require-
ments for Plumbing [1]. This unit in the weight
scale is not a definite unit of flow but is simply
a load factor to be applied through a relation
between m and n such as developed in figures
2 and 3. However, since the term fixture unit
in this significance has become fairly well es-
tablished by usage during the past 15 years, the
tei'm will be retained here to designate load
weights of fixtures.
A further comparison and an illustration of
the results of applying the average weights of
difl'erent kinds of fixtures to a single basic
probability curve may be made by reducing the
number of fixtures to fixture units (n times
weight) and replotting, as in figure 4. It will
be observed that the curves for flush tanks and
bathtubs (total supply) lie very close together,
indicating that the relative weights, 5 to 4, are
approximately correct throughout the range
illustrated for the individual volumes and rates
allowed. It will also be observed that the two
curves both intersect the flush-valve cm've be-
tween 193 gpm 880 fixture units and 210 gpm1,040 fixture units, indicating again that the
relative weights 10:5:4 are approximately cor-
rect in that range. For 300 flush tanks, 1,500
[13]

500
400
300
a.
200
100
I. FLUSH VALVES2. FLUSH TANKS3. BATH TUBS
1000 1500 2000FIXTURE UNITS
Figure 4.
—
Relation of demand to fixture units.
2500 3000
fixture units, referred separately to the flush-
valve curve for an estimate, the demand esti-
mate would be about f 5 percent lower than the
corresponding estimate made directly from the
flush-tank curve. The corresponding- error in
the estinuite for 300 l)athtubs made in the samemanner would be about 3)^ percent. These errors
are immateivial. for the only result, in case the
design load was exceeded in service by that
amoiuit, would be an increase in the time re-
quired to refill the fixtures by 15 percent and
3^2 percent, respectively, or, in case the sametime is occupied in refilling, a reduction by these
percentages in the volume of water used. Be-low the point of intersection, referring flush
tanks and bathtubs separately to the flush-
valve ciu-ve would result in overestimating the
demand by amounts varying from very small
percentages for 880 to 1,040 fixture units to
about 94 and 23 percent, respectively, for 100
fixture units. However, the error in an esti-
mate made from curve 1 for the total demandload for flush valves for water closets and for
bathtubs will be less than the error indicated
by an estimate made separately for the bath-
tubs from the same curve in all cases in which
the flush valves predominate, on the basis of
total fixture units of the two kinds of fixtures.
In cases where flush tanks for water closets are
used exclusively or predominaritly in the sys-
tem, a closer estimate could be made on the
basis of total weights, by using curve 2 and the
total fixture units for all kinds of fixtures in-
volved. Obviously the error made by using
curve 2 for both flush tanks and bathtubs for
any number of either up to 300 would be small.
Also, the demand load relative to the numberof fixture units may be approximately repre-
[14]

500
400
sented in this range by a smooth curve drawnabove the two probabihty curves and mergedwith cm*ve 1 as shown by the broken hne in
figure 4, thus giving estimates shghtly in excess
of the peak demands indicated by the separate
curves for flush tanks and bathtubs. The bro-
ken hne in figure 4 is reproduced in figure 5, to-
gether with curve 1. The ciu-ves in this figure
are proposed for estimating design loads for
water-supply lines in general, curve 1 to be
used when flush valves predominate in the sys-
tem and curve 2 to be used when flush tanks
predominate, the common curve above the
branch to be used for all weighted fixtm*es.
Of the fixtures commonly installed in the
greatest numbers, these three produce the majorpart of the peak demand. Lavatories are in-
stalled in most systems in as great numbers, and
frequently in greater numbers, but obviously
have a much smaller load-producing weight, andare frequently ignored in estimating demandand sewage loads. Because, as pointed out in
discussing supply demands for bathtubs, it is
impossible to estimate the values of t and Treliably for faucet-supplied fixtures, and because
of the relatively small effect on the total
demand, it is suggested that satisfactory
fixture-unit ratings may be assigned to irregu-
larly used faucet-supplied fixtures independ-
ently of the probability function from a
consideration of the sizes of the supply outlets
and the relative quantities of water used. Onthe basis of tliis reasoning, the relative weights
suggested for the kinds of fixtures most com-monly subjected to congested service are:
10:5:4:2 for flush valves for water closets.
[15]

flush tanks for -svater closets, bath tubs, andla V a tories . respeo t ively
.
5. Relative Load Weights foe DifferentCoxDiTioNS OF Service
I'p to this point the discussion has been con-
fined to four kuuls of tixtin-es under congested
conditions of service. There are several con-
siderations that slunild be taken into account in
determinmg load ratings for other fixtures andfor other conditions of serA'ice, amoui:- which
the following are especially important
:
{!) Fixtures that are relatively few in numberand unlikely to be used when the predominant
kinds are being used most frequently will addvery little to the demand or to the peak sewage
load and hence may be ignored, except in regard
to the branch supply lines and branch drain
pipes of these fixtures. Slop or service sinks in
ofhce building's, which are in use to any con-
siderable extent only before or after office hours,
add a negligible load to the peak loads of the
day. Kitchen sinks and laundry trays in
dwelling's and residential apartments may also
be placed in this category.
{2) Fixtures so installed that they cannot in
general be subject to congested conditions of
service in the same sense as fixtures installed in
public comfort stations, general toilet rooms in
office building's, and other buildings in which
each fixture is open and accessible for use at all
times, should be given a rating in accordance
with the possible extent or frequency of their
use. Bathi'ooms in private dwellings, resi-
dential apartments, and private bathrooms in
hotels may be considered m this class, and can
be rated advantageously as a group.
(3) Water services that demand a continuous
flow, such as la'Rm sprmklei'S. air-conditioning
equipment, gang showers m factories, andathletic dressing rooms, present no element of
chance in regard to overlapping and are not
susceptible of a logical weighting in relation to
water closets and other fixtures that use water
at high rates for comparatively short periods of
time. Hence the demand for this type of
supply should be considered separately and esti-
mated separately. If the use of these continu-
ous water supplies is such that they overlap the
rush period of the day for the weighted fixtm*es
in the system, the separate estimates for the
two classes of supply should be added to obtainthe estimate for total demand on any supply
;
pipe common to both services. If the two types ;
of demand do not come at the same time of day,^
the greater demand of the two may be taken as :
the peak demand, or design estimate.'
A bathroom group of fixtures can probably be !
more closely weighted to the selected scale of 1
to 10 by taking the three common bathroomfixtures—water closet, lavatory, and bathtub or
shower—as a unit thait by weighting each '
fixture separately. In hotels and apartmenthouses the bathrooms are not all in use at one I
time, and the loading weight of any fixture of
the group—for example, a water closet—will,
be much lower than for the same fixtiu'c in |
congested service, for which it has been assumed;
that all fixtures will be in continuous use during '
the period of congestion. One peak period
occiu's m hotels and apartments in the morning'
durmg the rismg hom- and another in the after-
noon durmg the preparations for dinner.
Probably the best mdication of the distribution )
of the use of the bathrooms in hotels and apart-
ment buildings obtainable will be given by i
records of the acti-s-ity dtu'ing the hours whenthe peak use of the plumbing fixttu'es occui-s,
Table 4 is a stunmary of recorded morning i
(rising) calls from the switchboard for two large
hotels in New York City for 7 consecutive daysm one case and 9 days in the other. Hotel 1 is t
a large hotel in which the guests were prmcipally
transient. Hotel 2 is a large apartment hotel i
in which the greater part of the guests were '
resident but which also received and accom- '
modated transients.
Table 4.— Distribution of morning calls in hotels\
Time of call
Place Be-fore6:S0
6:31) 7:00 7:15 7:30 7:45 S:0l)After'«:00
Totalcalls
Hotel 1
Hotel 2
Total calls
174
19S
372
22S212
9S133
4S6ci99
146176
7007S0
1S5176
463442
382341
2.S623.057
440 231 1,085 322 1.4ai 361 905 r23 .T,919
It will be observed that the time of rising I
in the two hotels is distributed m approximately <
the same manner, the greatest number of calls i
in any 15-minute period being for that follow-- ;
ing 7:30 a. m., and that slightly more than t
[16]

one-half of all calls fall within the hour from
7:00 to 8:00 a. m. This is significant, and
it may be assumed that the time of rising of
guests leaving no morning call will be similarly-
distributed in time.
Table 5.
—
Distrihidion of morning calls in apartments
for 9 days
Time of call
PeriodTotal
Be-fore 6:30 6:45 7:00 7:15 7:30 7:45 8:00
After8:00
calls
6:30
1st day.__ ... 3 2 7 11 3 6 3 1 1 37
2d day 8 4 8 12 2 9 3 1 2 49
3d day__ 6 2 9 12 3 9 3 2 2 48
4th day 4 3 9 12 3 8 3 1 1 44
5th day 3 2 9 12 2 8 3 1 1 41
lith day 5 4 7 11 2 8 2 1 1 41
7th day __- 8 4 7 13 3 11 4 2 1 53
8th day 4 4 9 11 4 11 2 2 3 50
9th day 4 3 10 12 4 10 3 1 1 48
Total calls 45 28 75 106 26 80 26 12 13 411
Table 6.
—
Distribution of morning exits in apartmentsfor 2 days
Period
Interval of time
Totalexits6:45
to7:00
7:00to
7:15
7:15
to
7:30
7:30to7:45
7:45to
8:00
8:00to
8:15
8:15to
8:30
8:30to8:45
8:45to
9:00
1st day2d day
Total exits
11
6
17
4
8
12
1815
3127
4749
96
7059
41
54
31
23
2621
279262
33 58 129 95 54 47 541
Table 5 gives the summarized record of
morning calls for a large apartment house in
Washington, D. C, for 9 different days other
than Sundays during a period of 22 days. Table
6 gives the summarized record of morning
exits from the same apartment house. Com-paring tables 4 and 5, it will be observed that
the number of morning calls in 15-minute
periods in hotels and apartments fluctuates in
about the same manner, the principal difference
being that the peak number of calls in any 15-
minute period is about 10 to 15 percent of the
total number higher for the apartment house
than for either the transient or apartment
hotel. Also comparing tables 5 and 6, it will
be observed that the peak of exits from the
apartment house, indicating the beginning of
the business or social activity of the day, occurs
approximately 1 hour later than the peak of
the rising activity. This indicates that ex-
tensive use of phMnl)ing fixtures in any single
apartment or in any gi'oup of apartments in
which the occupants rise at the same hour will
last for about an hour. The maximum number
of calls within any single hour ranges from 69
to 75 percent for different days. The corre-
sponding percentages for the hotels range from
47 to 62. It therefore seems reasonable to
assume that not more than 75 percent of the
bathrooms in an apartment house or in any
hotel will be occupied and in use at one time.
There may be exceptional apartment houses in
which the occupants are all engaged in the
same occupation that would show a higher con-
centration in rising time. However, it will be
the exception rather than the rule and
should be treated as an exception in estimating
water-supply demands and sewage loads.
There is another consideration that is impor-
tant in estimates of loads for bathrooms. In a
leisurely use of a bathroom, the fixtures will
ordinarily be used one at a time. In cases of
hurry or congestion, two fixtures may be in
use at the same time in a bathroom, in the sense
that water is being drawn for or is being dis-
charged from both at the same time. Hence
it seems reasonable to assume that, on the
average, not more than two-thirds of the total
number of fixtures in all occupied bathrooms
will be in use at the same time. The total
number in use at one time on this basis, will not
exceed two-thirds of 75 percent, or 50 percent,
of the total number of fixtures in bathrooms in
the building. Accordingly, it is suggested that
a bathroom group in a residence or apartment,
or a private bathroom in a hotel be given one-
half the total weight for the same fixtures in
public or congested service in estimating supply
demands.
The term "bathroom group" is here defined
as consisting of a water closet, a lavatory, and
a bathtub with or without a shower head, or of
a water closet, a lavatory, and a shower stall.
These suggested weights become (10+4+ 2)h-
2= 8. and (5-f 4+2)^2= 5.5, respectively, for
installations using flush valves and flush tanks.
Again, in accordance with the convention pre-
viously used in selecting fixture weights, the
nearest higher integral value will be assigned,
giving for a bathroom group using a flush tank
the weight of 6.
[17]

In suggesting- this rating for a bathroom
group, it is recognized that the condition of
service for which the rating is made does not
completely block out of use one-half of each
kind of fixture, as would be required for the
result obtained to be exact. What actually
occurs in the installations to which the proposed
rating would apply is that one-fourth or moreof the fixtures of each kind are not in service
during the time the other three-fourths or less
are in actual use, and that the ratio of tjT for
each kind of fixture is greatly decreased below
the ratio applying to congested conditions of
service. For example, if each of the water-
closet flush valves is operated twice dming the
hour in which it was assumed that two-thirds
of the bathrooms were in use, ^/J'=9/1800=1/200; if used four times, f/r=9/900= 1/100, as
compared to ^/T=9/300= 3/100 for congested
service. A similar relation will exist between
the ratios of tjT for flush tanks and bathtubs
under the conditions described and under
congested conditions. It may be noted in this
connection that assigning a bathroom group
one-half the rating that is given the same fixtures
in congested service would give an estimate of
the demand greater than one-half of that for
congested service. For example, 10 flush
valves for water closets, 10 bathtubs, and 10
lavatories in congested service total 160 fixture
units, which by curve 1 in figure 5 gives an
estimated demand of 81 gpm. The proposed
rating for 10 bathroom groups with flush valves,
80 fixture units, gives an estimated demand of
64 gpm.
Table 7 gives the fixture weights suggested in
accordance with the use to which the fixtures
are subjected and the manner in which they
are installed. The term "public" refers to fix-
tures which are individually open for use at all
times when the building is open, as in public
toilets or general toilets in office buildings.
"Private" refers to fixtures installed in groups
in such a manner that the entire group may be
and generally is confined to the use of one per-
son at a time, as in residences or private baths
of hotels. "Total" refers to hot and cold
supply combined. "Hot or cold" refers to hot
or cold water supply only.
Table 7.
—
Demand weights of plumbing fixtures
Fixture or group
Water closet
DoPedestal urinalStall or wall urinal _
DoLavatory
DoBathtubs
DoShower head
Do
?roup_BathroomDo.--DoDoDo- -
Bathroom group withseparate shower
.
Occu-pancy
Public-..-do.
.-do .-
_-do--..-do--,.-do..._-do---. do..--do....do--._-do..-
Private...do....--do.....-do ..---do......do...
Type of supply
Flush valveFlush tankFlush valve
doFlush tankTotalHot or coldTotalHot or coldTotalHot or cold
Flush valve (total)
Flush valve (cold only)Flush tank (total)
B'lush tank (cold only)
.
Hot water only - .
Add to correspondinggroup above tor total,
2; for cold or hot
Weightper fix-
ture or
group in
fixture
units
10
5
10
5
3
2
1.54
3
4
3
3
1.5
6. Application of Load Chart and WeightTable
In estimating the demand load for a supply
pipe in any building, the total number of each
kind of weighted fixtures or weighted groups of
fixtures will be multiplied by the weight of that
fixture or group (table 7) and the products added
to obtain the total number of fixture units.
The demand load is given by the corresponding
ordinate of the appropriate curve in figure 5.
For example, assume that an apartment house
or a hotel has 100 bathrooms with flush-tank
supply for all water closets and that any other
flxtures in the building are negligible * in rela-
tion to peak demand. The total number of
fixture units wiU be 100X6, or 600. The ordi-
nate on curve 2 of figure 5 corresponding to this
abscissa is 147 gpm. This estimate, of course,
applies only to the main supply or service pipe
for the building and does not include any con-
tinuous demand, such as that for lawn sprinklers
or air conditioning, etc. Again, assume that
an office building has 100 water closets with
flush-valve supply, 25 stall urinals with flush-
valve supply, and 100 lavatories, and that the
demand of other plumbing flxtures is negligible
in relation to these, but that the building has
an air-cooling system which demands a maxi-
mum rate of 225 gpm. By referring to table
' See discussion of negligible flxtures on page 16.
[18]
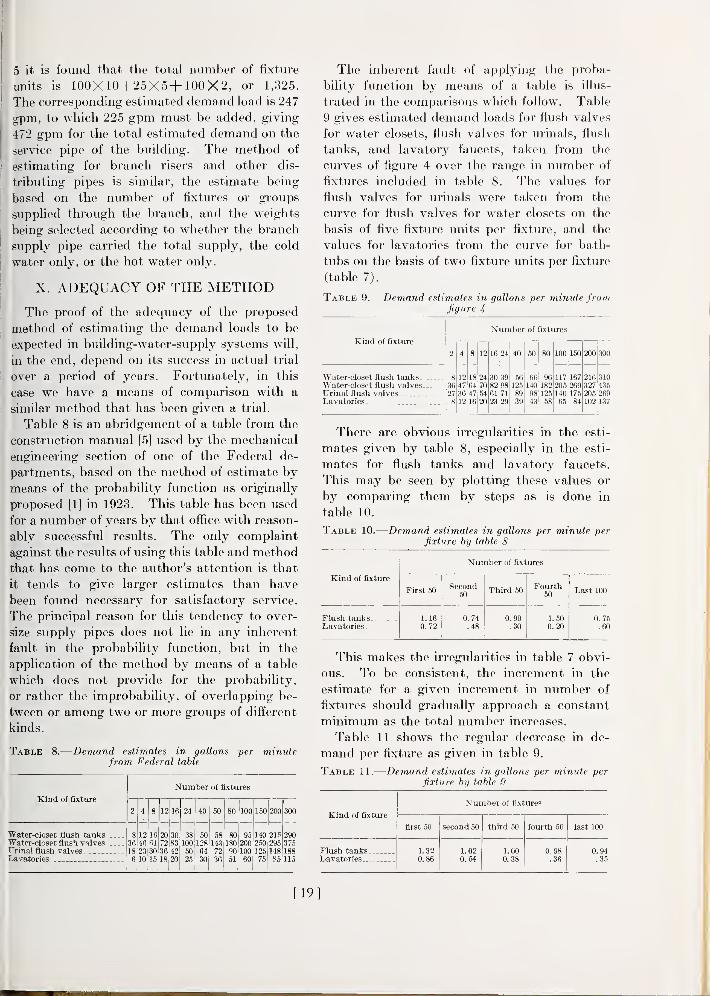
5 it is found that the total number of fixture
units is 100X10+25X5+100X2, or 1,325.
The corresponding estimated demand load is 247
gpm, to which 225 gpm must be added, giving
472 gpm for the total estimated demand on the
sei'vice pipe of the building. The method of
estimating for branch risers and other dis-
tributing pipes is similar, the estimate being
based on the number of fixtures or groups
supplied through the branch, and the weights
being selected according to whether the branch
supply pipe carried the total supply, the cold
water only, or the hot water only.
X. ADEQUACY OF THE METHOD
The proof of the adequacy of the proposed
method of estimating the demand loads to be
expected in building-water-supply systems will,
in the end, depend on its success in actual trial
over a period of years. Fortunately, in this
case we have a means of comparison with a
similar method that has been given a trial.
Table 8 is an abridgement of a table from the
construction manual [5] used by the mechanical
engineering section of one of the Federal de-
partments, based on the method of estimate bymeans of the probability function as originally
proposed [1] in 1923. This table has been used
for a number of years by that office with reason-
ably successful results. The only complaint
against the results of using this table and methodthat has come to the author's attention is that
it tends to give larger estimates than have
been found necessary for satisfactory service.
The principal reason for this tendency to over-
size supply pipes does not lie in any inherent
fault in the probability function, but in the
application of the method by means of a table
which does not provide for the probability,
or rather the improbability, of overlapping be-
tween or among two or more groups of different
kinds.
Table 8.
—
Demand estimates in gallons per minutefrom federal table
Number of fixtures
Kind of fixture
2 4 8 12 16 24 40 50 80 100 150 200 300
Water-closet flush tanks 8 12 16 20 30 38 50 58 80 95 140 21."; 290Water-closet flnsh valves 36 46 ni 72 83 100 128 143 180 200 2.50 295 375Urinal flush valves . 18 23 30 3R 42 50 64 72 W 100 125 148 188Lavatories . _ _ 6 10 1,5 IS 20 25 30 36 51 60 75 85 115
The inherent fault of applying the proba-
bility function by means of a table is illus-
trated in the comparisons which follow. Table
9 gives estimated demand loads for flush valves
for water closets, flush valves for urinals, flush
tanks, and lavatory faucets, taken from the
curves of figure 4 over the range in number of
fixtures included in table 8. The values for
flush valves for urinals were taken from the
curve for flush valves for water closets on the
basis of five fixture units per fixture, and the
values for lavatories from the curve for bath-
tubs on the basis of two fixture units per fixture
(table 7).
Table 9.
—
Demand estimates in gallons per minute fromfigure 4
Number of fixtures
Kmd of fixture
2 4 8 12 16 24 40 50 80 100 150 200 300
Water-closet flush tanks 8 12 18 24 30 39 56 66 96 117 167 216 310W ater-closet flush valves 36 47 64 70 82 98 125 140 182 205 269 327 435Urinal flush valves _ . 27 36 47 54 61 71 89 98 125 140 175 205 269Lavatories _ 8 12 16 20 23 29 39 43 58 65 84 102 1.37
There are obvious irregularities in the esti-
mates given by table 8, especially in the esti-
mates for flush tanks and lavatory faucets.
This may be seen by plotting these values or
by comparing them by steps as is done in
table 10.
Table 10.
—
Demand estimates in gallons per minute per
fixture by table 8
Number of fixtures
Kind of fixture
First 50Second
50Third 50
Fourth50
Last 100
Flush tanks 1. 16
0. 720. 74.48
0. 90.30
1.500.20
0. 75
.60Lavatories -
This makes the irregularities in table 7 obvi-
ous. To be consistent, the increment in the
estimate for a given increment in number of
fixtures should gradually approach a constant
minimum as the total number increases.
Table 11 shows the regular decrease in de-
mand per fixture as given in table 9.
Table 11.
—
Demand estimates in gallons per minute perfixture by table 9
Kind of fixture
Number of fixture?
first 50 second 50 third 50 fourth 50 last 100
Flush tanks 1.320.86
L020.54
1.000.38
0.98.36
0. 94.35I^avatories.-- ... .
[19]
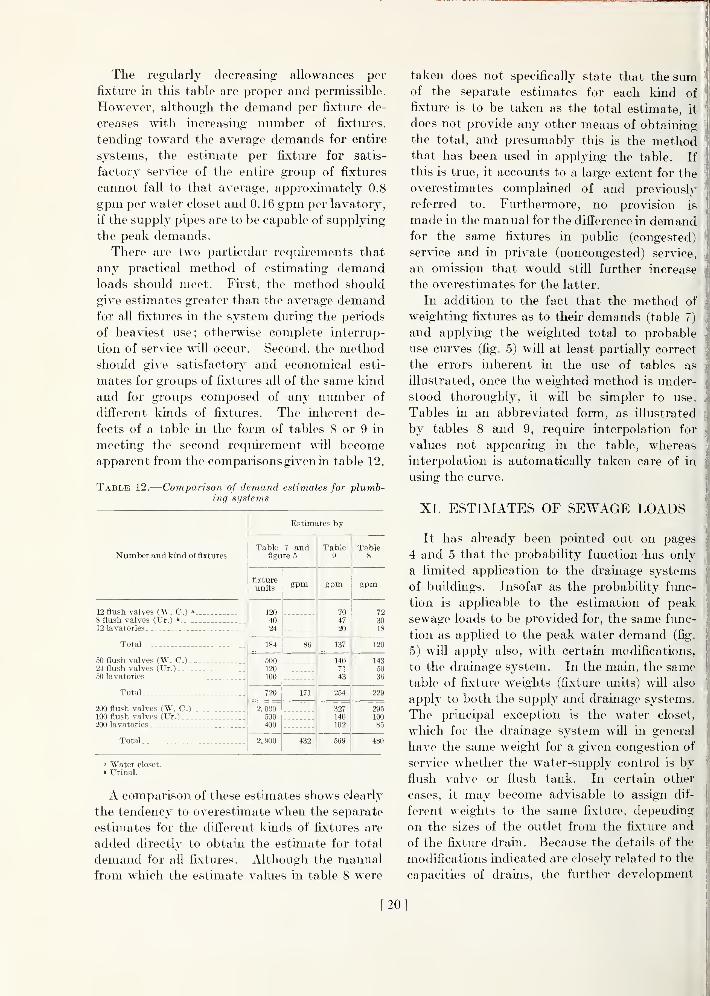
The regularly decreasing allowances per
fixture in this table are proper and permissible.
However, although the demand per fixture de-
creases with increasing number of fixtures,
tending toward the average demands for entu-e
systems, the estimate per fixture for satis-
factory service of the entire group of fixtures
cannot fall to that average, approximately 0.8
gpm per water closet and 0.16 gpm per lavatory,
if the supply pipes are to be capable of supplying
the peak demands.
There are two particular requirements that
any practical method of estimating demandloads should meet. First, the method should
give estimates greater than the average demandfor all fixtures in the system during the periods
of heaviest use; otherwise complete interrup-
tion of service will occur. Second, the methodshould give satisfactory and economical esti-
mates for groups of fixtures all of the same kind
and for groups composed of any number of
different kinds of fixtures. The inherent de-
fects of a table in the form of tables 8 or 9 in
meeting the second requirement will becomeapparent from the comparisons given in table 12.
Table 12.
—
Comparison of demand estimates for plumb-ing systems
Number and kind of fixtures
Estimates by
Table 7 andfigure 5
Table9
Table8
fixture
unitsgpm gpm gpm
12 flush valves (W. C.) » 120
4024
704720
72
3018
8 flush valves (XIr.) ^
12 lavatories
Total 184 86- 137 120
50 flush valves (W. C.) 500120
100
140
7143
143
50
36
24 flush valves (Ur.)
50 lavatories .. _
Total 720 171 264 229
200 flush valves (W. C.)100 flush valves (Ur.)
2. 000500400
327140
102
295100
85
Total 2,900 432 569 480
" Water closet,k Urinal.
A comparison of these estimates shows clearly
the tendency to overestimate when the separate
estimates for the different kinds of fixtures are
added directly to obtain the estimate for total
demand for all fixtures. Although the manual
from which the estimate values in table 8 were
taken does not specifically state that the sumof the separate estimates for each kind of
fixture is to be taken as the total estimate, it
does not provide any other means of obtaining
the total, and presumably this is the methodthat has been used in applying the table. If
this is true, it accoimts to a large extent for the
overestimates complained of and previously
referred to. Furthermore, no provision is
made in the manual for the difference in demandfor the same fixtures in public (congested)
service and in private (noncongested) service,
an omission that would still further increase
the overestimates for the latter.
In addition to the fact that the method of
weighting fixtures as to their demands (table 7)
and applying the weighted total to probable
use curves (fig. 5) will at least partially correct
the errors inherent in the use of tables as
illustrated, once the weighted method is under-
stood thoroughly, it will be simpler to use.
Tables in an abbreviated form, as illustrated
by tables 8 and 9, require interpolation for
values not appearing in the table, whereas
interpolation is automatically taken care of in
using the curve.
XI. ESTIMATES OF SEWAGE LOADS
It has already been pointed out on pages
4 and 5 that the probability function has only
a limited application to the drainage systems
of buildings. Insofar as the probability func-
tion is applicable to the estimation of peak
sewage loads to be provided for, the same func-
tion as applied to the peak water demand (fig.
5) will apply also, with certain modifications,
to the drainage system. In the main, the same
table of fixture weights (fixture units) will also
apply to both the supply and drainage systems.
The principal exception is the water closet,
which for the drainage system will in general
have the same weight for a given congestion of
service whether the water-supply control is by
flush valve or flush tank. In certain other
cases, it may become advisable to assign dif-
ferent weights to the same fixture, depending
on the sizes of the outlet from the fixture and
of the fixture drain. Because the details of the
modifications indicated are closely related to the
capacities of drains, the further development
[20]

of the method of estimating sewage load w ill
be treated in the paper dealing with capacities
of building drains. Also, before the method
can be successfully applied in practice, the
abbreviated table of fixture weights for demandloads will have to be ex[)anded and modified.
These modifications will also be developed in
the later paper.
XII. DISCUSSION
The principal purpose of this paper is to
present the fundamental principles and data on
which the proposed method of estimating
loads to be provided for in plumbing systems
is based. It has been pointed out that the
details of application of any method in practice
must be guided to a large extent by engineering
judgment in order that it may lead to satis-
factory results. The choice of values employed
in evaluating the probability function and in
converting estimates in number of fixtxu'es
flowing to estimates in gallons per minute rep-
resents the author's judgment.
It has also been pointed out that it is impos-
sible to determine or to estimate closely either
the maximum demand load or the maximumsewage load that will occur in service. It is
only possible to estimate the loads having a
certain probability of being exceeded in a given
system. In this respect, it is believed that
table 7 and figure 5 will enable the engineer to
obtain that estimate as closel}' as the varying
conditions encountered in phunbing .systems
permit, and that the results of applying the
data presented in that form will in general lead
to the selection of adequate sizes of sii])ply
pipes and as economical sizes as are consistent
with safety and satisfactory operation, pro-
vided the proper judgment is exercised in
estimating the capacity of the pipes under the
particular conditions of installation.
XIII. REFERENCES
[1] Recommended Minimum Requirements for Plumb-ing, Department of Commerce Building andHousing Series, BH13, 1924. Revised by addi-
tion of a supplement, 1932.
[2] Prohahility and Its Engineering Uses, by Thornton
C. Fry, (D. Van Nostrand and Co., Inc., 1928).
[3] The Hydraulics of Water Closet Bowls and Flushing
Devices, by Thomas R. Camp, associate professor
of Sanitary Engineering, Massachusetts Institute
of Technology. Published in mimeographedform in 1936 b.v the Massachusetts State Asso-
ciation of Master Plumbers.
[4] G. E. Golden, Research Associate at the National
Bureau of Standards for the Plumbing Manu-facturers Research Associateship. (Data un-
published.)
[5] Manual of Procedure for the Mechanical Section,
Public Works Branch, Procurement Division,
Treasury Department (Sept. 1935).
[6] Interior Water Supply Piping for Residential
Buildings, Bulletin of the University of Wiscon-
sin, Engineering Experiment Station Series, No.
77.
Washington, August 30, 1940.
[21]


BUILDING MATERIALS AND STRUCTURES REPORTS
On request, the Superintendent of Documents, U. S. Government Printing Office, Washington,
D. C, will place your name on a special mailing list to receive notices of new reports in this
series as soon as they are issued. There will be no charge for receiving such notices.
An alternative method is to deposit with the Superintendent of Documents the sum of $5,
with the request that the reports be sent to you as soon as issued, and that the cost thereof be
charged against your deposit. This will provide for the mailing of the publications without
delay. You will be notified when the amount of your deposit has become exhausted.
If 100 copies or more of any paper are ordered at one time, a discount of 25 percent is allowed.
Send all orders and remittances to the Superintendent of Documents, U. S. Government Printing
Office, Washington, D. C.
The following publications in this series are available by purchase from the Super-intendent of Documents at the prices indicated:
BMSl Research on Building Materials and Structures for Use in Low-Cost Housing 10(5
BMS2 Methods of Determining the Structural Properties of Low-Cost House Constructions. _ 10^5
BMS3 Suitability of Fiber Insulating Lath as a Plaster Base 10(4
BMS4 Accelerated Aging of Fiber Building Boards 10?i
BMS5 Structural Properties of Six Masonry Wall Constructions 150
BMS6 Survey of Roofing Materials in the Southeastern States 150
BMS7 Water Permeability of Masonry Walls 100
BMS8 Methods of Investigation of Surface Treatment for Corrosion Protection of Steel 100
BMS9 Structural Properties of the Insulated Steel Construction Co.'s "Frameless-Steel"Constructions for Walls, Partitions, Floors, and Roofs 100
BMSIO Structural Properties of One of the "Keystone Beam Steel Floor" Constructions Spon-sored by the H. H. Robertson Co 100
BMSll Structural Properties of the Curren Fabrihome Corporation's "Fabrihome" Construc-tions for Walls and Partitions 10^
BMS12 Structural Properties of "Steelox" Constructions for Walls, Partitions, Floors, and RoofsSponsored by Steel Buildings, Inc 150
BMS13 Properties of Some Fiber Building Boards of Current Manufacture 100
BMS14 Indentation and Recovery of Low-Cost Floor Coverings 100
BMS15 Structural Properties of "Wheeling Long-Span Steel Floor" Construction Sponsored bythe Wheeling Corrugating Co 100
BMS16 Structural Properties of a "Tilecrete" Floor Construction Sponsored by Tilecrete Floors,Inc 100
BMS17 Sound Insulation of Wall and Floor Constructions 100
BMS18 Structural Properties of "Pre-Fab" Constructions for Walls, Partitions, and FloorsSponsored by the Harnischfeger Corporation 100
BMS19 Preparation and Revision of Building Codes 150
BMS20 Structural Properties of "Twachtman" Constructions for Walls and Floors Sponsored byConnecticut Pre-Cast Buildings Corporation 10(4
BMS21 Structural Properties of a Concrete-Block Cavity-Wall Construction Sponsored by theNational Concrete Masonry Association lOj}
BMS22 Structural Properties of "Dun-Ti-Stone" Wall Construction Sponsored by the W. E.Dunn Manufacturing Co 100
BMS23 Structural Properties of a Brick Cavity-Wall Construction Sponsored by the BrickManufacturers Association of New York, Inc 100
BMS24 Structural Properties of a Reinforced-Brick Wall Construction and a Brick-Tile Cavity-Wall Construction Sponsored by the Structural Clay Products Institute 100
BMS25 Structural Properties of Conventional Wood-Frame Constructions for Walls, Partitions,
Floors, and Roofs 15(5
BMS26 Structural Properties of "Nelson Pre-Cast Concrete Foundation" Wall ConstructionSponsored by the Nelson Cement Stone Co., Inc 100
BMS27 Structural Properties of "Bender Steel Home" Wall Construction Sponsored by TheBender Body Co 100
BMS28 Backflow Prevention in Over-Rim Water Supplies 100
BMS29 Survey of Roofing Materials in the Northeastern States 100
[List continued on cover page ivl

BUILDING MATERIALS AND STRUCTURES REPORTS
[Continued from cover page iii]
BMS30 Structural Properties of a Wood-Frame Wall Construction Sponsored by the DouglasFir Plywood Association 10j5
BMS31 Structural Properties of "Insulite" Wall and "Insulite" Partition Constructions Spon-sored by The Insulite Co 15^
BMS32 Structural Properties of Two Brick-Concrete-Block Wall Constructions and a Concrete-Block Wall Construction Sponsored by the National Concrete Masonry Association. 10(§
BMS33 Plastic Calking Materials 10^
BMS34 Performance Test of Floor Coverings for Use in Low-Cost Housing: Part 1 lOi
BMS35 Stability of Sheathing Papers as Determined by Accelerated Aging 10^
BMS36 Structural Properties of Wood-Frame Wall, Partition, Floor, and Roof Constructions with"Red Stripe" Lath Sponsored by the Western Paper and Manufacturing Co 10^
BMS37 Structural Properties of "Palisade Homes" Constructions for Walls, Partitions, andFloors, Sponsored by Palisade Homes 10(t
BMS38 Structural Properties of Two "Dunstone" Wall Constructions Sponsored by the W. E.Dunn Manufacturing Co lOjS
BMS39 Structural Properties of a Wall Construction of "Pfeifer Units" Sponsored by the Wis-consin Units Co 10(i
BMS40 Structural Properties of a Wall Construction of "Knap Concrete Wall Units" Sponsoredby Knap America, Inc 10(4
BMS41 Effect of Heating and Cooling on the Permeability of Masonry Walls 10^
BMS42 Structural Properties of Wood-Frame Wall and Partition Constructions With "Celotex"Insulating Boards Sponsored by the Celotex Corporation 10^
BMS43 Performance Test of Floor Coverings for Use in Low-Cost Housing: Part 2 10^
BMS44 Surface Treatment of Steel Prior to Painting 10^
BMS45 Air Infiltration Through Windows 10^
BMS46 Structural Properties of "Scot-Bilt" Prefabricated Sheet-Steel Constructions for Walls,Floors, and Roofs Sponsored by The Globe-Wernicke Co 10^
BMS47 Structural Properties of Prefabricated Wood-Frame Constructions for Walls, Partitions,
and Floors Sponsored by American Houses, Inc 10^
BMS48 Structural Properties of "Precision-Built" Frame Wall and Partition ConstructionsSponsored by the Homasote Co 10^
BMS49 Metallic Roofing for Low-Cost House Construction 10^
BMS50 Stability of Fiber Building Boards as Determined by Accelerated Aging 10^
BMS51 Structural Properties of "Tilecrete Type A" Floor Construction Sponsored by the Tile-
crete Corporation 10^
BMS52 Effect of Ceiling Insulation upon Summer Comfort 10^
BMS53 Structural Properties of a Masonry Wall Construction of "Munlock Dry Wall Brick,"Sponsored by the Munlock Engineering Co 10(i
BMS54 Effect of Soot on the Rating of an Oil-Fired Heating Boiler 10^
BMS55 Effects of Wetting and Drying on the Permeability of Masonry Walls lOjS
BMS56 A Survey of Humidities in Residences 10^
BMS57 Roofing in the United States—Results of a Questionnaire 10^
BMS58 Strength of Soft-Soldered Joints in Copper Tubing 10^
BMS59 Properties of Adhesives for Floor Coverings 10^
BMS60 Strength, Absorption, and Resistance to Laboratory Freezing and Thawing of BuildingBricks Produced in the United States 15(6
BMS61 Structural Properties of Two Nonreinforced Monolithic Concrete Wall Constructions lOji
BMS62 Structural Properties of a Precast Joist Concrete Floor Construction Sponsored by thePortland Cement Association 10^
BMS63 Moisture Condensation in Building Walls 10^
BMS65 Methods of Estimating Loads in Plumbing Systems 10^
BMS66 Plumbing Manual 20^