Embed Size (px)
Citation preview

ACCOUNTING SEPARATION 2014
Page: 1
Date Stamp: 15 July 2014 Version 2014/2
Accounting Separation – Activity costing analysis (Water, Retail and Sewage) METHODOLOGY STATEMENT
As part of their regulatory accounts each company has to report the split of the costs, revenues, assets and liabilities for the different activities they carry out in delivering services. This is known as accounting separation. UNDERLYING BUSINESS STRUCTURE
Yorkshire Water Services Limited (YW) carries out both Wholesale and Retail activities, and Loop Customer Management (a separate group company) carries out Retail customer service activities for YW with a charge made via a contract fee. Related overheads are classed as General & Support and included in line 9 ‘other operating expenditure’ on tables A7 and A8. APPLICATION OF THE PRINCIPLES SET OUT IN RAG 4.04
In order to comply with Ofwat’s general cost allocation principles of Transparency, Causality, Non-discrimination, Objectivity and Consistency the accounting separation tables have been completed as follows:
Costs are allocated to cost centres within the company’s accounting system (SAP).
An alternate cost centre hierarchy is maintained within the SAP system. This assigns every cost centre to a ‘service level’ node allowing reports to be run in the required format for the tables in accordance with Ofwat’s Regulatory Accounting Guidelines. Checks are made to ensure all codes are included and that the balances reconcile to the financial statements.
Any changes as detailed in Information Notices issued by Ofwat are implemented.
Where possible costs are allocated directly to service (e.g. Water Treatment). If allocation of costs is required the allocation methods used were chosen from the suggested methods in the guidelines. If the suggested basis was not felt to be appropriate, the reason for this and the basis of allocation is described below. A management review has been undertaken to ensure consistency of approach across the varying business units and the reasonableness of the allocation and recharge methods, and assumptions used.
This document states any assumptions which have been made.
Wherever possible sampling has not been used to populate the tables. Where it has been used this is stated below.
FTE (full time equivalent) and head count information is obtained from the relevant Business Unit Finance section.
The Accounting Separation tables are prepared in the same way each year in order to enable meaningful comparison of information over time. Preparation takes into account any improvements in methodology. These are explained in the section below.

ACCOUNTING SEPARATION 2014
Page: 2
Date Stamp: 15 July 2014 Version 2014/2
IMPROVEMENTS TO METHODOLOGY IN THE YEAR
During 2013/14 the following improvements have been carried out:
A review of energy on Waste Water treatment sites has been carried out to improve allocation of cost across service. Review of allocations to be part of monthly discussions with budget managers for all large sites.
On Current Cost Depreciation there has been a change in process as this year YW moved from apportioning assets that are used by several business units, to allocating assets to the business unit of principal use and then calculating a recharge
The following changes have been made to categorisation of costs between the 2013 and 2014 return:
Developer Services - only salary costs associated with the administration of new connections are now booked to retail. All other salary costs in relation to managing developer queries and providing information to developers have been booked to Wholesale. In 2013 all salaries were booked to Retail.
Sampling at Customer’s Taps - scientific services costs in relation to sampling at customers’ taps have been booked to Wholesale – local treated water distribution as per OFWAT information Notice 13/10. This was booked to Retail in 2013.
All Regulation costs have been apportioned one ninth to each main service (e.g. Water Treatment).
Loop’s own overheads are included in the Loop contract price and have been apportioned to other direct cost using a cost driver of FTE’s to split between household and non-household. This is a change from the process used in 2012/13 and prior years where overheads were allocated to individual retail activities.
PLANNED IMPROVEMENTS TO METHODOLOGY
Whilst there are no specific areas to be looked at in the coming year, YW reviews its Accounting Separation process on an ongoing basis, making changes and improvements as required. There are no planned improvements at this time. SIGNIFICANT CHANGES IN THE COMPANY’S COSTS IN THE YEAR
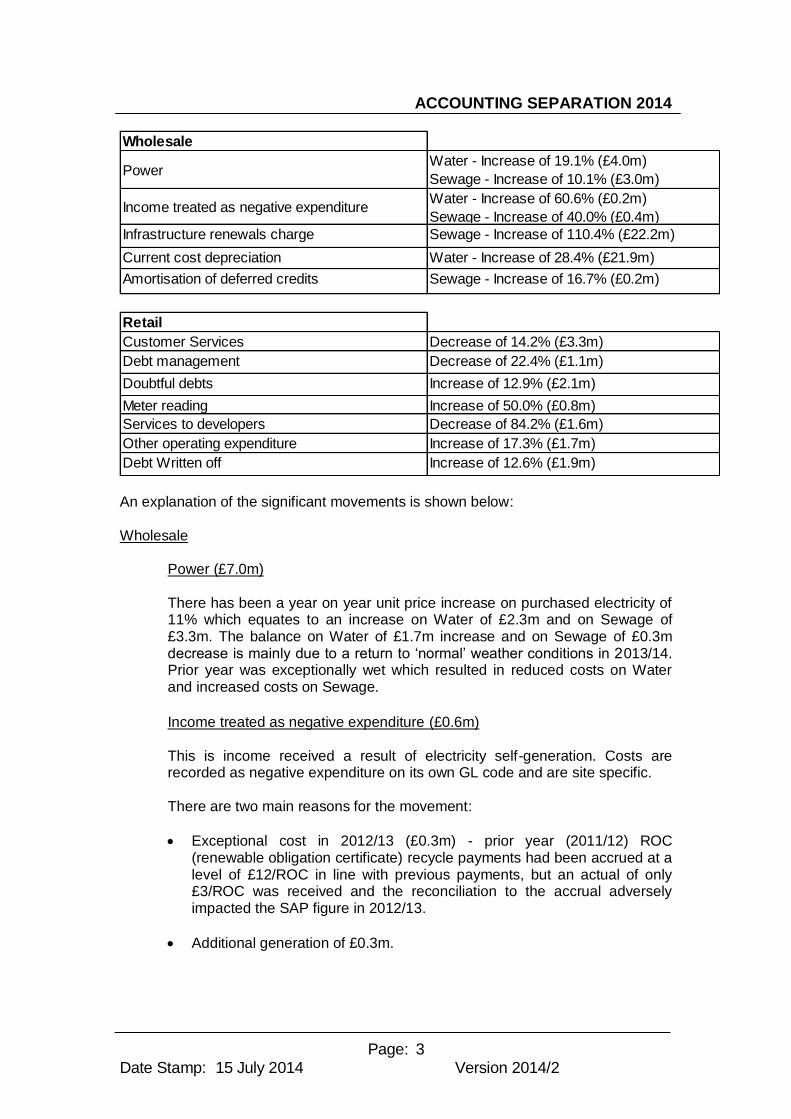
The following table shows the significant movements (in excess of 10%) in tables A7 and A8 from 2012/13 to 2013/14.
ACCOUNTING SEPARATION 2014
Page: 3
Date Stamp: 15 July 2014 Version 2014/2
An explanation of the significant movements is shown below: Wholesale
Power (£7.0m) There has been a year on year unit price increase on purchased electricity of 11% which equates to an increase on Water of £2.3m and on Sewage of £3.3m. The balance on Water of £1.7m increase and on Sewage of £0.3m decrease is mainly due to a return to ‘normal’ weather conditions in 2013/14. Prior year was exceptionally wet which resulted in reduced costs on Water and increased costs on Sewage.
Income treated as negative expenditure (£0.6m) This is income received a result of electricity self-generation. Costs are recorded as negative expenditure on its own GL code and are site specific. There are two main reasons for the movement:
Exceptional cost in 2012/13 (£0.3m) - prior year (2011/12) ROC (renewable obligation certificate) recycle payments had been accrued at a level of £12/ROC in line with previous payments, but an actual of only £3/ROC was received and the reconciliation to the accrual adversely impacted the SAP figure in 2012/13.
Additional generation of £0.3m.
Wholesale
PowerWater - Increase of 19.1% (£4.0m)
Sewage - Increase of 10.1% (£3.0m)
Income treated as negative expenditureWater - Increase of 60.6% (£0.2m)
Sewage - Increase of 40.0% (£0.4m)
Infrastructure renewals charge Sewage - Increase of 110.4% (£22.2m)
Current cost depreciation Water - Increase of 28.4% (£21.9m)
Amortisation of deferred credits Sewage - Increase of 16.7% (£0.2m)
Retail
Customer Services Decrease of 14.2% (£3.3m)
Debt management Decrease of 22.4% (£1.1m)
Doubtful debts Increase of 12.9% (£2.1m)
Meter reading Increase of 50.0% (£0.8m)
Services to developers Decrease of 84.2% (£1.6m)
Other operating expenditure Increase of 17.3% (£1.7m)
Debt Written off Increase of 12.6% (£1.9m)

ACCOUNTING SEPARATION 2014
Page: 4
Date Stamp: 15 July 2014 Version 2014/2
Infrastructure renewals charge (£22.2m)
The infrastructure renewals charge ("IRC") is a 15-year average of actual and forecast infrastructure renewals expenditure ("IRE") in the previous, current and next AMP periods. FRS 15 requires that forecast IRE should be calculated from an asset management plan that is certified by a person who is appropriately qualified and independent'. YW have interpreted this as being the IRE planned in the 5-year PR14 business plan submitted to Ofwat. YW submitted its business plan to Ofwat in late 2013, and at this point updated the AMP6 IRE figures in the IRC calculation with those in the new business plan. Prior to this, the AMP6 IRE figures were taken from the Ofwat Final Determination five years previous.
Due to a refocus on maintaining infrastructure assets in AMP6, the IRE has increased significantly in the new business plan from five years before. The effect of this is to increase the 15-year average IRC for the remaining 7 years from 1 April 2014. Current cost depreciation (£21.9m)
This increase is due to a change in process as this year YW moved from apportioning assets that are used by several business units, to allocating assets to the business unit of principal use and then calculating a recharge.
Amortisation of deferred credits (£0.2m)
This represents the amortisation of capital income relating to non-infrastructure assets. It has increased in 2013/14 due to the amortisation of new credits received in the year. This is a normal level of increase which we might expect to see year on year as new capital income is received and begins to be amortised.
Retail
Customer Services (-£3.3m)
a) Billing (-£0.7m)
Lower spend on commission paid for income generation leads due to it
being the end of the income generation project (-£0.4m).
Movement of overheads to other operating expenditure (-£0.2m).
There are other general cost savings (-£0.1m).
b) Network customer queries (-£0.5m)
Full year effect of Customer Experience being at Loop and injection of
funding to increase case management, proactive communication, and
project management (£0.7m).

ACCOUNTING SEPARATION 2014
Page: 5
Date Stamp: 15 July 2014 Version 2014/2
Movement of overheads to other operating expenditure to bring treatment
of overheads within Loop into line with that of YW (-£1.2m).
c) Non-network customer enquiries (-£2.1m)
Increase in answer rate and additional contact centre SIM funding
(£0.6m).
Movement of overheads to other operating expenditure (-£2.6m).
There are other general cost savings (-£0.1m).
Debt Management (-£1.1m)
Movement of overheads to other operating expenditure to bring treatment
of overheads within Loop into line with that of YW.
Doubtful Debts (£2.1m)
The bad debts charge has increased year on year due to an increase in
arrears and write offs.
Meter Reading (£0.8m)
Number of employees working on capital scheme for Automated Meter
Reading in 2013 now transferred back to normal duties.
Services to Developers (-£1.6m)
Movement of staff costs from retail in 2012/13 to wholesale in 2013/14 due to a change in allocation of Developer Services staff following a review of the guidelines. As a result of this review only salary costs associated with the administration of new connections are booked to retail. All other salaries costs in relation to managing developer queries
and providing information to developers have been booked to wholesale.
Other operating expenditure (£1.7m)
Movement of overheads from billing to other operating expenditure to
bring treatment of overheads within Loop into line with that of YW
(£0.2m).
Movement of overheads from network customer queries to other operating
expenditure to bring treatment of overheads within Loop into line with that
of YW (£1.2m).
Movement of overheads from non-network customer enquiries to other
operating expenditure to bring treatment of overheads within Loop into
line with that of YW direct costs (£2.6m).
ACCOUNTING SEPARATION 2014
Page: 6
Date Stamp: 15 July 2014 Version 2014/2
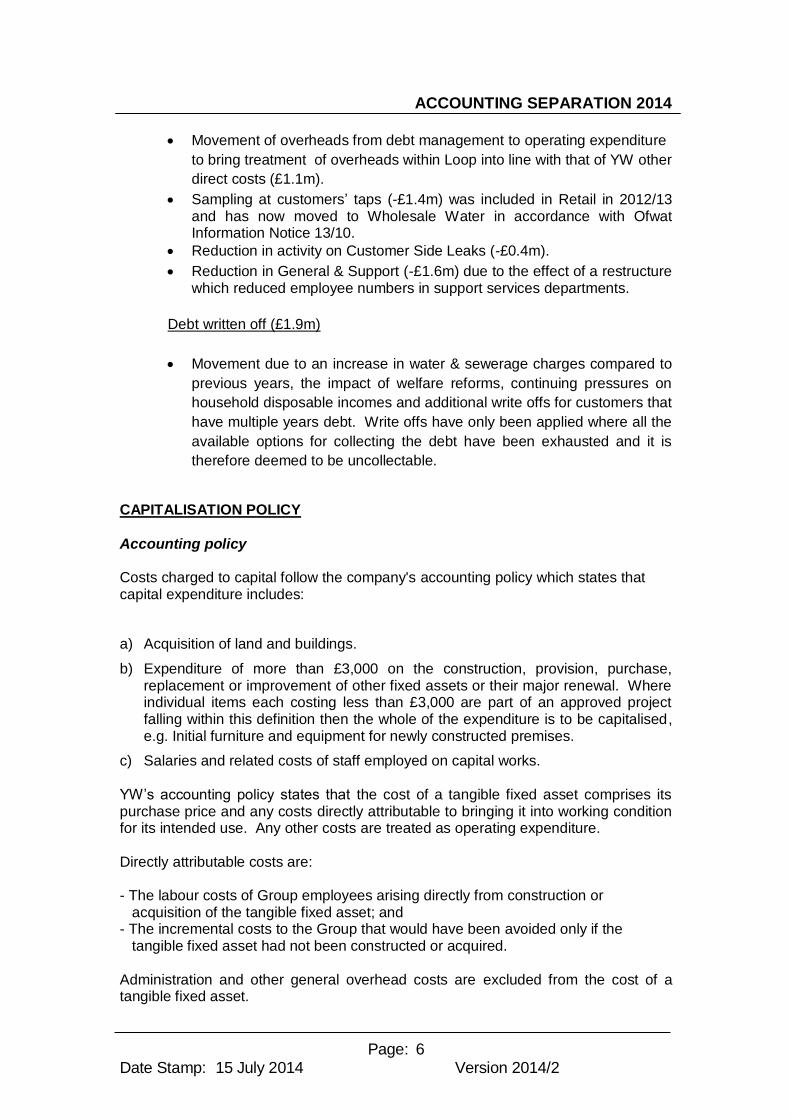
Movement of overheads from debt management to operating expenditure
to bring treatment of overheads within Loop into line with that of YW other
direct costs (£1.1m).
Sampling at customers’ taps (-£1.4m) was included in Retail in 2012/13 and has now moved to Wholesale Water in accordance with Ofwat Information Notice 13/10.
Reduction in activity on Customer Side Leaks (-£0.4m).
Reduction in General & Support (-£1.6m) due to the effect of a restructure which reduced employee numbers in support services departments.
Debt written off (£1.9m)
Movement due to an increase in water & sewerage charges compared to
previous years, the impact of welfare reforms, continuing pressures on
household disposable incomes and additional write offs for customers that
have multiple years debt. Write offs have only been applied where all the
available options for collecting the debt have been exhausted and it is
therefore deemed to be uncollectable.
CAPITALISATION POLICY
Accounting policy Costs charged to capital follow the company's accounting policy which states that capital expenditure includes:
a) Acquisition of land and buildings.
b) Expenditure of more than £3,000 on the construction, provision, purchase, replacement or improvement of other fixed assets or their major renewal. Where individual items each costing less than £3,000 are part of an approved project falling within this definition then the whole of the expenditure is to be capitalised, e.g. Initial furniture and equipment for newly constructed premises.
c) Salaries and related costs of staff employed on capital works.
YW’s accounting policy states that the cost of a tangible fixed asset comprises its purchase price and any costs directly attributable to bringing it into working condition for its intended use. Any other costs are treated as operating expenditure.
Directly attributable costs are: - The labour costs of Group employees arising directly from construction or
acquisition of the tangible fixed asset; and - The incremental costs to the Group that would have been avoided only if the
tangible fixed asset had not been constructed or acquired. Administration and other general overhead costs are excluded from the cost of a tangible fixed asset.

ACCOUNTING SEPARATION 2014
Page: 7
Date Stamp: 15 July 2014 Version 2014/2
All relevant colleagues are aware of the capitalisation policy and a note providing further guidance (including a decision tree) is available. Senior Finance Business Partners are responsible for ensuring the policy is complied with. Specific guidance has also been provided to managers responsible for R&D to ensure they comply with the accounting policy regarding R&D. Occasional internal audit checks are made on a sample of R&D schemes to ensure accounting treatment complies with guidelines. Capitalised salaries and overheads The cost of time completed on capital schemes by YW staff is recorded through the use of timesheets. In addition for certain management who spend time during the year on capital schemes a proportion of salary is allocated to capital and reviewed annually. The cost of staff employed on capital schemes is calculated based upon an hourly recharge rate, multiplied by the numbers of hours which they spend working on a scheme. The recharge rates are reviewed by management annually. Each set of rates is broken down by grade, based on an average salary for that grade. Recharge rates are calculated by taking an average salary, adding on incremental costs and dividing by the average number of working hours in a year. The incremental costs included are:
- NI and superannuation, based on average rates paid; - Bonus payments based upon band and HR policies - Car allowance based upon the band of employee - Mileage, mobile phone, PPE (personal protective equipment – not included in
office based worker rates) and training costs are included based upon a historic average cost per employee; and
- Overheads with the overhead absorption rate based on the percentage of overhead to direct costs from accounting separation.
Capital Retail allocation The assets included in the Retail table are allocated to the following categories:
Category Retail Household
Retail Non-Household
Retail Total
Current Cost Depreciation
Billing System 2.3 0.1 2.4
Other assets specifically allocated to the Retail table
2.7 - 2.7
Total 5.0 0.1 5.1
Closing Net Book Value
Billing System 7.6 2.3 9.9
Other assets specifically allocated to the Retail table
13.6 - 13.6
Total 21.2 2.3 23.5

ACCOUNTING SEPARATION 2014
Page: 8
Date Stamp: 15 July 2014 Version 2014/2
Other assets specifically allocated to the Retail table include telephony systems, as well as buildings and equipment used solely by the Retail business. No shared assets were allocated directly to the retail table, however a recharge is made for use of such assets by the Retail business units. Cost drivers used for shared assets & breakdown of recharges Assets which are used by more than one business unit are allocated to a single business unit and recharged to the relevant business units using a suitable cost driver, as below:
Assets used by
Allocated to Recharged to Recharge basis Total recharged in the year (£m)
Whole business
Treated Water Distribution
All business units Full-Time Equivalent employees, Headcount or Vehicle Recharges as appropriate
7.5
Wholesale only
Treated Water Distribution
Wholesale business units
Full-Time Equivalent employees, Headcount or Telemetry as appropriate
18.2
Water business
Treated Water Distribution
Water business units
Full-Time Equivalent employees in water business units
0.3
Sewerage business
Sewage collection
Sewerage business units
Full-Time Equivalent employees in sewerage business units
0.6
Above ground sites
Water Treatment
Water Resources, Water Treatment, Sewage Treatment, Sludge Treatment
Full-Time Equivalent employees in relevant business units
0.3
Below ground assets
Treated Water Distribution
Raw Water Distribution, Treated Water Distribution, Sewage Collection
Full-Time Equivalent employees in relevant business units
0.2
ACCOUNTING SEPARATION 2014
Page: 9
Date Stamp: 15 July 2014 Version 2014/2
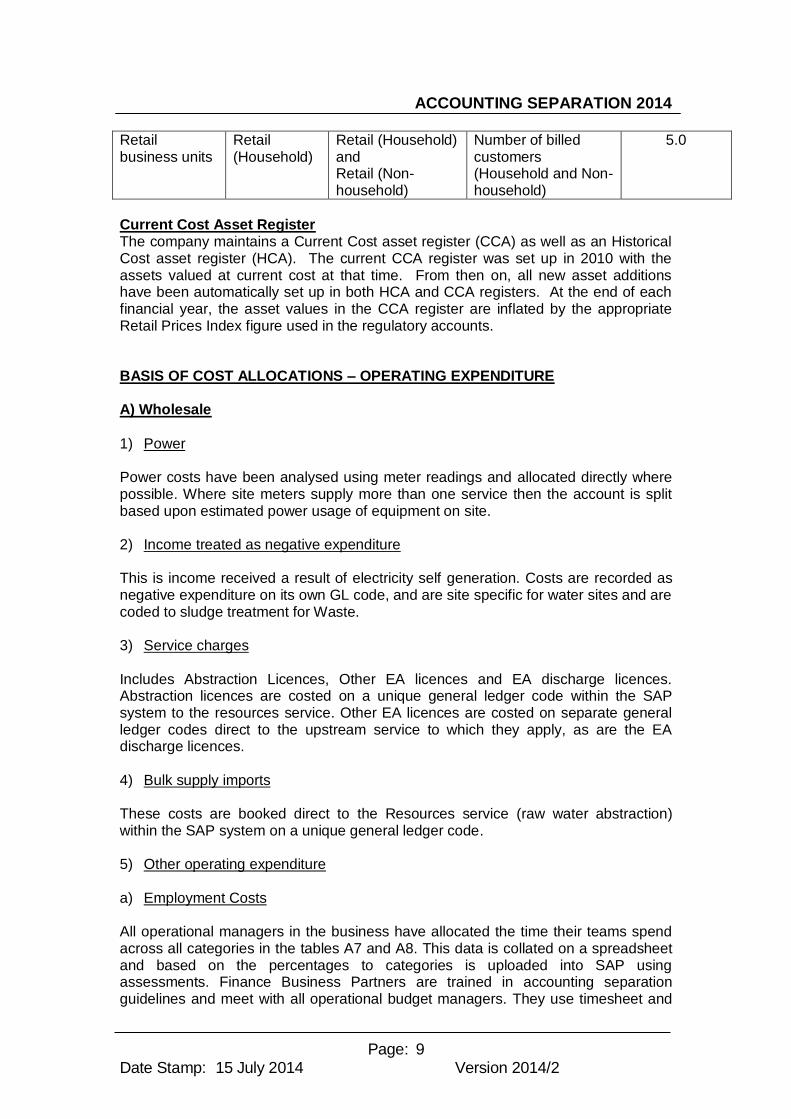
Retail business units
Retail (Household)
Retail (Household) and Retail (Non-household)
Number of billed customers (Household and Non-household)
5.0
Current Cost Asset Register The company maintains a Current Cost asset register (CCA) as well as an Historical Cost asset register (HCA). The current CCA register was set up in 2010 with the assets valued at current cost at that time. From then on, all new asset additions have been automatically set up in both HCA and CCA registers. At the end of each financial year, the asset values in the CCA register are inflated by the appropriate Retail Prices Index figure used in the regulatory accounts. BASIS OF COST ALLOCATIONS – OPERATING EXPENDITURE A) Wholesale
1) Power Power costs have been analysed using meter readings and allocated directly where possible. Where site meters supply more than one service then the account is split based upon estimated power usage of equipment on site. 2) Income treated as negative expenditure This is income received a result of electricity self generation. Costs are recorded as negative expenditure on its own GL code, and are site specific for water sites and are coded to sludge treatment for Waste. 3) Service charges
Includes Abstraction Licences, Other EA licences and EA discharge licences. Abstraction licences are costed on a unique general ledger code within the SAP system to the resources service. Other EA licences are costed on separate general ledger codes direct to the upstream service to which they apply, as are the EA discharge licences.
4) Bulk supply imports
These costs are booked direct to the Resources service (raw water abstraction) within the SAP system on a unique general ledger code. 5) Other operating expenditure
a) Employment Costs All operational managers in the business have allocated the time their teams spend across all categories in the tables A7 and A8. This data is collated on a spreadsheet and based on the percentages to categories is uploaded into SAP using assessments. Finance Business Partners are trained in accounting separation guidelines and meet with all operational budget managers. They use timesheet and
ACCOUNTING SEPARATION 2014
Page: 10
Date Stamp: 15 July 2014 Version 2014/2
Advantex information if available. Peer review of the data collected has occurred in the year. Centrally held employment costs include the pensions deficit, pensions levy, SAYE, share based payments and NI on company cars (P11d). These costs are allocated based on FTE’s over the whole company (so to support services as well as to water, sewerage and retail). Allocations to support services are then reallocated to water, sewerage, retail etc. Allocations that were originally made to support services are reallocated to the general and support line as an overhead. There have been no time and motion studies undertaken during the year but there have been extensive and detailed discussions with the operational department managers as to what activity / category the employees should be allocated to. This discussion usually now takes place monthly and changes are made as necessary before the assessments are run each month. However, for 2014 as a result of a mid-year restructure the monthly reviews did not take place and discussions were held with managers in the final months of the year. b) Hired and Contracted Services/Materials These costs are allocated direct to service. Electrical and Mechanical and Instrument Control and Automation maintenance costs (Engineering Reliability) are booked direct to category via the Work Management (job costing) System.
Overhead costs including consumables are allocated to service as direct costs based on value of work carried out as detailed by the Work Management (job costing) System.
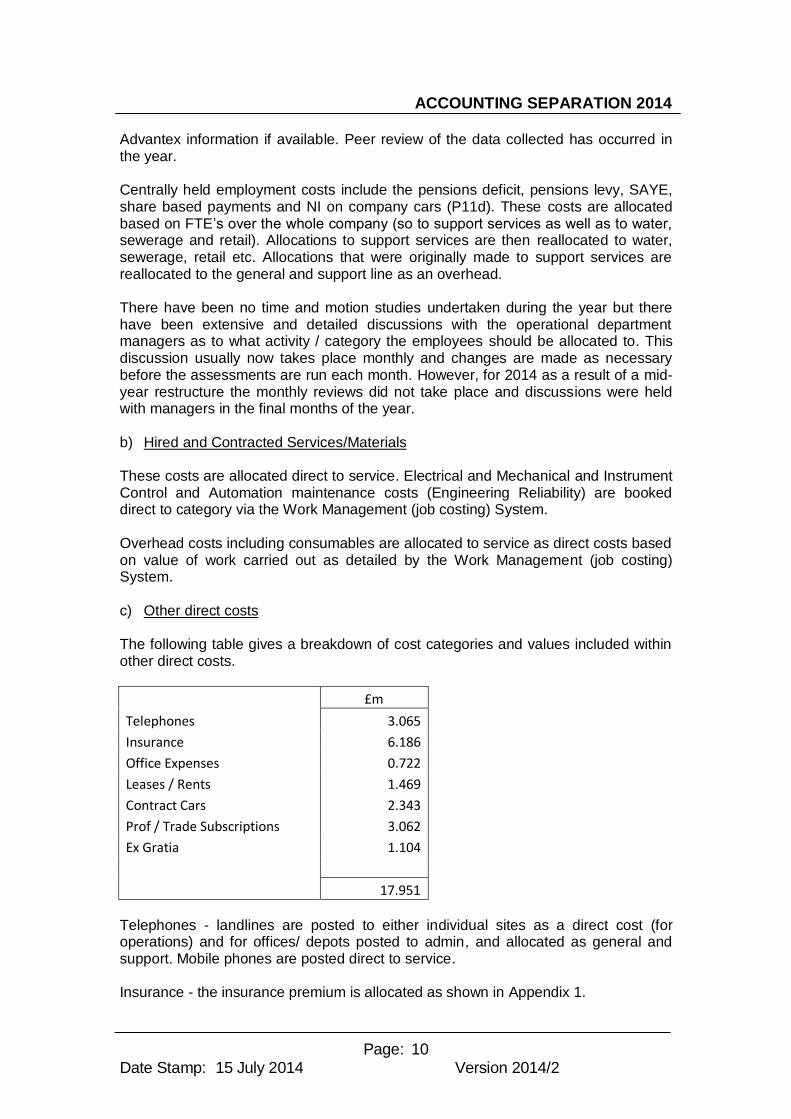
c) Other direct costs The following table gives a breakdown of cost categories and values included within other direct costs.
£m
Telephones 3.065
Insurance 6.186
Office Expenses 0.722
Leases / Rents 1.469
Contract Cars 2.343
Prof / Trade Subscriptions 3.062
Ex Gratia 1.104
17.951 Telephones - landlines are posted to either individual sites as a direct cost (for operations) and for offices/ depots posted to admin, and allocated as general and support. Mobile phones are posted direct to service. Insurance - the insurance premium is allocated as shown in Appendix 1.

ACCOUNTING SEPARATION 2014
Page: 11
Date Stamp: 15 July 2014 Version 2014/2
Office Expenses - costs are generally posted to admin and allocated as general and support. Leases / Rents - where possible these costs are booked direct to service. For rent at facilities sites costs are allocated as on overhead based on FTE and costs are assigned to both wholesale and retail as a general & support cost, FTE is used because when employees time is split between wholesale and retail activities it is not possible to use floor area as a basis of allocation. Contract Cars - costs are posted direct to service via the salary allocations exercise. Professional / Trade Subscriptions – the majority of this amount is the Ofwat licence fee which is allocated as Other Business Activities with one ninth allocated to each service as per Ofwat’s instructions. Ex Gratia - the cost of meeting GSS (Guarantee Standards Scheme) payments and associated remedial works has been included in the business unit where the activity that caused the failure lies. Ex gratia and customer charter payments are included within treated water distribution, sewerage or retail services depending on the type of claim.
d) General and Support Expenditure
The overriding principle is that any general and support costs are directly allocated where possible. Where this is not possible they should be allocated using a cost driver from Ofwat’s hierarchy of costs drivers, as below –
Administrative services Audit Services Electrical & Mechanical (Engineering Reliability) Facilities Financial Services Land and Property Legal & Property Planning Liaison Policy Determination Research & Development
1. Analysis of staff time determined by hierarchy detailed above under employment costs
2. Number of full time equivalents (FTEs)
YW Based on FTE output from ‘salaries allocation’ exercise.
Human resources and personnel services 1. Analysis of staff time determined by hierarchy detailed above under employment costs
2. Headcount of employees YW Based on Headcount output from ‘salaries allocation’ exercise.
IT and data processing 1. Usage of mainframe by system type
2. Number of computers 3. Number of full time equivalents
(FTEs) YW Based on Headcount output from ‘salaries allocation’ exercise.
ACCOUNTING SEPARATION 2014
Page: 12
Date Stamp: 15 July 2014 Version 2014/2
e) Scientific Services The allocation to service is based on a review of spend by treatment category by sample. The review has then established a proportion for each category which has been used for allocation purposes. This approach has been used due to significant variations in sample prices within the function and therefore using a number of samples approach would not produce an equitable split. This approach means that the allocation produces a more accurate result than would have been achieved by using the Ofwat guidance. No overhead has been allocated directly to Scientific Services. It has been treated as an overhead department. f) Other business activities The Ofwat licence fee and the salaries and related costs of the Regulation function have been allocated evenly to each of the four water, four sewerage and the retail business unit as per the guidance, so each unit has received one ninth of the fee. No overhead has been allocated directly to Regulation. It has been treated as an overhead department. 6) Local authority rates Cumulo rates (water only)
Cumulo rates have been allocated in accordance with the guidance and so this is based on the value of assets assigned to the Business Unit which are reported in the supplementary fixed asset tables. Sewerage Site - Non Domestic Rates
Rates for all waste water treatment works have been allocated based on the value of assets assigned to the Business Unit which are reported in the supplementary fixed asset tables. No non domestic rates are allocated to sewerage collection since sewers are not rated.
Office Buildings - Non Domestic Rates
These are allocated by using the number of FTE at each specific site. When employees’ time is split between wholesale and retail activities it is not possible to use floor area as a basis of allocation so a percentage split based on salary allocation is used.
7) Exceptional Items
There were no exceptional items in 2013/14. 8) Third Party Services

ACCOUNTING SEPARATION 2014
Page: 13
Date Stamp: 15 July 2014 Version 2014/2
Costs of third party damage and fire services costs are reported as Third Party Costs. B) Retail
A significant proportion of the activities identified within retail are performed by a separate company, Loop Customer Management, and are charged to YW via a contract fee. Where possible the costs are charged directly to the retail service activity that consumed the goods or service. The remainder of costs identified as Retail are incurred by YW and where possible are booked direct to activity. Costs not booked directly are allocated via management assessment.
1) Customer Services This includes the following activities - a) Billing and Collection We currently have billing and collection agreements with Local Authorities/Housing Associations for collection of water & sewerage charges in tenants rent. We also have reciprocal cross boundary billing agreements with Severn Trent and United Utilities for billing and collection of sewerage charges. The percentage of income outsourced for billing where the risk of collection is transferred to a third party is as follows
YW does not issue bills to ‘the occupier’ as all bills are raised to a named customer. b) Vulnerable customer schemes Includes all costs of administering the scheme. c) Network and Non Network customer enquiries and complaints These costs are incurred by YW directly or by Loop Customer Management and recharged to YW. Loop costs are for dealing with calls relating to non network and network queries. Costs are assigned based upon a combination of the team involved, physical data from the telephony system and management assessment. The customer case management team is assigned wholly to Network customer enquiries and complaints. YW costs are for initial investigation by a network technician and cost of schedulers.
£(m) % split
Main Charges Revenue 963.678
Local Authorities / Hosing Associations 31.247 3.2%
Sewerage charges billed by Severn Trent / UU 26.763 2.8%
2013/14

ACCOUNTING SEPARATION 2014
Page: 14
Date Stamp: 15 July 2014 Version 2014/2
These are salaries and related costs booked to retail based on management assessment. 2) Debt management / doubtful debts The company’s policy for treatment of doubtful debt where the customer has vacated a property leaving amounts unpaid is as follows. If the customer has absconded from the property leaving amounts unpaid we would begin a process of attempting to trace a forwarding address by, for example, 'in house' attempts by phone/text to contact the customer or by use of external data to verify a forwarding address. If unsuccessful, after a period of approximately three months, the debt would be written off and passed to an external Debt Collection Agency. Credit notes would only be applied if YW were made aware that the date of vacation was different to the one currently held on the customer's account. Due to data restraints we would be unable to identify the value of credit notes in such cases. YW uses the following approach to provisioning. The unmeasured provision (direct billing) is calculated using information based on the age of debts. Percentages are applied to each year's arrears, based on unmeasured tracked debts, to arrive at the provision figure. The measured provision for domestic customers is calculated using information based on the age of debts. Percentages are applied to each year’s arrears, based on measured tracked debts, to arrive at the provision figure. Commissions are included within the Loop contract price. All commissions are costed to the retail activity to which they relate. For Local Authority Bulk Owners and Water Company cross boundary commissions a management estimate has been made of the allocation of costs between billing and debt collection.
3) Meter reading
These costs are incurred by YW directly with no recharge from Loop Customer Management. The meter reading element of the team also carry out meter maintenance which is coded to wholesale. 4) Services to developers
Only salary costs associated with the administration of new connections are allocated to Retail based on management assessment. 5) Other operating expenditure This includes the following activities: a) Disconnections Loop Customer Management costs recharged to YW are for salaries allocated based on management assessment. YW costs are for salaries of staff supporting requests from developers / councils for disconnections required prior to redevelopment.

ACCOUNTING SEPARATION 2014
Page: 15
Date Stamp: 15 July 2014 Version 2014/2
b) Demand side water efficiency initiatives
Non salary costs are booked direct to service within the SAP system on a specific cost centre. Salaries are allocated here based on management assessment. c) Customer side leaks
Repair costs are booked direct via the Works Management (Job Costing) system. Salaries are allocated here based on management assessment. d) Other Direct Costs
Includes costs associated with external communications. e) General & Support As with Wholesale the overriding principle is that any general and support costs are directly allocated where possible. See Wholesale section above for details. f) Other business activities
The Ofwat licence fee and the salaries and related costs of the Regulation function have been allocated evenly to each of the four water, four sewerage and the retail business unit as per the guidance, so each unit has received one ninth of the fee. 6) Local authority rates
Non Domestic Rates are allocated by using the number of FTEs at each specific site. When employees time is split between wholesale and retail activities it is not possible to use floor area as a basis of allocation so a percentage split based on salary allocation is used. This means that rates are booked to individual retail activities and split between household on non household using that activities driver.
7) Exceptional items There were no exceptional items in 2013/14. 8) Third Party Services There were no third party services operating expenditure items in 2013/14. C) Household / Non Household splits Retail direct costs are allocated between household and non household as shown in the table below
Household
Non Household
Cost Driver
ACCOUNTING SEPARATION 2014
Page: 16
Date Stamp: 15 July 2014 Version 2014/2
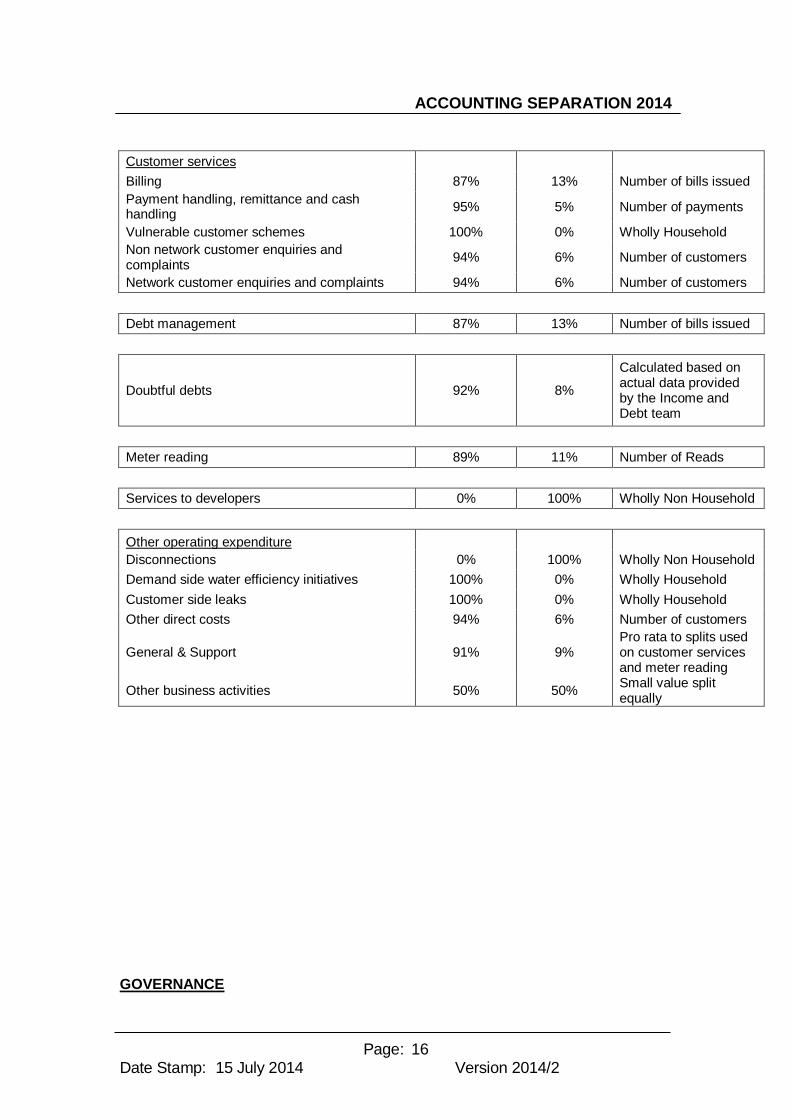
Customer services
Billing 87% 13% Number of bills issued
Payment handling, remittance and cash handling
95% 5% Number of payments
Vulnerable customer schemes 100% 0% Wholly Household
Non network customer enquiries and complaints
94% 6% Number of customers
Network customer enquiries and complaints 94% 6% Number of customers
Debt management 87% 13% Number of bills issued
Doubtful debts 92% 8%
Calculated based on actual data provided by the Income and Debt team
Meter reading 89% 11% Number of Reads
Services to developers 0% 100% Wholly Non Household
Other operating expenditure
Disconnections 0% 100% Wholly Non Household
Demand side water efficiency initiatives 100% 0% Wholly Household
Customer side leaks 100% 0% Wholly Household
Other direct costs 94% 6% Number of customers
General & Support 91% 9% Pro rata to splits used on customer services and meter reading
Other business activities 50% 50% Small value split equally
GOVERNANCE

ACCOUNTING SEPARATION 2014
Page: 17
Date Stamp: 15 July 2014 Version 2014/2
YW operates a multi-layer approach in its control of the accounting separation process. The layers of control are as shown below :-
Control Frequency Responsibility
Board sign off Annual Board
External audit Annual PwC
High level sign off Annual Head of Finance
Business unit sign off Annual Senior Finance Business Partners
Version control of methodology / procedure notes On going Governance / Reporting Accountant
Year on year analytical review Bi-Annual Governance / Reporting Accountant
Reconciliation of accounting separation actuals to financial statements Monthly Governance / Reporting Accountant Costing review using accounting separation alternate hierarchy Monthly Account to Report Team
Review of salary allocations Monthly Finance Business Partner / Budget Manager
Review of energy allocations Monthly Finance Business Partner / Budget Manager
Appendix 1
Allocation of Insurance Premium

ACCOUNTING SEPARATION 2014
Page: 18
Date Stamp: 15 July 2014 Version 2014/2
The various elements are allocated as below. Material Damage GMEA – insured assets Employers Liability FTE Personal Accident FTE Directors and Officers FTE Employment Practice FTE Fidelity (crime) FTE Public and Product Liability FTE Professional Indemnity FTE Tenanted Properties FTE Company Cars FTE Commercial Vehicles FTE Special Types FTE Insurance Premium Tax In proportion to all above Broker’s Fees In proportion to all above