Embed Size (px)
Citation preview

©FUNPEC-RP www.funpecrp.com.brGenetics and Molecular Research 12 (1): 256-269 (2013)
Methodology
Genetic diversity analysis in Opal cotton hybrids based on SSR, ISSR, and RAPD markers
Z. Noormohammadi1, Y. Hasheminejad-Ahangarani Farahani1, M. Sheidai2, S. Ghasemzadeh-Baraki2 and O. Alishah3
1Department of Biology, School of Basic Sciences, Science and Research Branch, Islamic Azad University, Tehran, Iran2Faculty of Biological Sciences, Shahid Beheshti University, Tehran, Iran3Cotton Research Center, Gorgan, Iran
Corresponding author: Z. NoormohammadiE-mail: [email protected] / [email protected]
Genet. Mol. Res. 12 (1): 256-269 (2013)Received May 14, 2012Accepted October 23, 2012Published January 30, 2013DOI http://dx.doi.org/10.4238/2013.January.30.12
ABSTRACT. Cotton is one of the most economically important crops in Iran; hybridization is a means to increase the genetic diversity and obtain new elite cultivars in this crop. We examined agronomic characteristics and molecular genetic diversity in the Opal cotton (Gossypium hirsutum) cultivar and in F2 progenies. Ten homo-primers and seven hetero-primers of 26 RAPD primers produced 261 reproducible bands, with an average of 4.18 bands per primer and 22% polymorphism. The OPB12/OPH08 primer gave the highest effective number of alleles (NE), and the largest Shannon index (I), Nei’s genetic diversity (H), and polymorphism information content (PIC) values. Some RAPD bands were present in the parental genotypes but were absent in their hybrids. Ten ISSR primers produced 206 reproducible bands, with 49.4% polymorphism. The UBC807 locus gave the highest NE, I, H, and PIC values. Some ISSR bands occurred only in the parental genotype, while others were

257
©FUNPEC-RP www.funpecrp.com.brGenetics and Molecular Research 12 (1): 256-269 (2013)
Genetic variation of intraspecific cotton hybrids
only present in the hybrid genotypes. Four microsatellite loci produced 12 alleles, ranging from 181 to 236 bp, with 54% polymorphism. The TMB1421 locus, with a monomorphic allele, was digested with three restriction enzymes (CAP-microsatellite) to evaluate sequence variations among samples. Association analysis between molecular markers and agronomic data revealed a significant correlation between ISSR-UBC807-1500 and yield. The Mantel test performed among the genetic distance matrices obtained from RAPD, ISSR and SSR showed a non-significant regression between RAPD versus ISSR and ISSR versus SSR, while RAPD versus SSR showed a significant regression; regression for ISSR and RAPD+ISSR+SSR combined data was also significant. Cluster analysis (UPGMA) based on these three types of molecular markers differentiated cotton genotypes and their progenies. Among the molecular markers, ISSR revealed more genetic variation among the genotypes. However, using all three types of molecular markers provided a better overall view of cotton genome polymorphism.
Key words: Agronomic traits; Genetic variation; ISSR; RAPD; SSR; Gossypium hirsutum L.
INTRODUCTION
Cotton with its diploid and tetraploid cultivars is cultivated in 17 of 30 provinces in Iran. Based on latest report issued by the Agriculture Ministry (Iran Cotton Report at the 68th Plenary Meeting of ICAO, Cape Town, South Africa, 2009), cotton is cultivated on 130,000 ha with a production of 85,000 tonnes during the 2008/09 season. Compared to the 2007/08 season, this shows an increase of 7.7% for the area. Meanwhile, continuous use of Gossypium hirsutum L. (AD1AD1) as the primary genetic stock for cotton breeding could be one of the limitations in breeding programs, as it may result in genetic erosion and uniformity of the genetic background (Kantartzi et al., 2009). Therefore, in the cotton breeding program of the country, hybridization is the main breeding strategy with the aim to broaden the genetic diver-sity available and produce a secondary germplasm pool in modern cotton production (Sheidai et al., 2007b; Kantartzi et al., 2009).
Recently, Iranian cotton breeders introduced intraspecific hybrids to control the loss of genetic diversity among cotton cultivars. Therefore, evaluation of genetic variations between parental and hybrid genotypes, as well as introducing cotton cultivars with improved agro-nomic traits, are one of the main considerations of cotton breeders.
Up to now, dominant molecular markers including random amplified polymorphic DNA (RAPD) and inter-simple sequence repeat (ISSR), as well as microsatellites of co-dom-inant nature, have been successfully used to evaluate genetic diversity among tetraploid and diploid cotton genotypes (Lu and Myers, 2002; Dongre et al., 2004; Rana and Bhat, 2005; Esmail et al., 2008; Maleia et al., 2010; Sapkal et al., 2011; Noormohammadi et al., 2011a; Ullah et al., 2012).
The present study aimed to evaluate the genetic diversity of intraspecific cotton hybrids and their parents by using RAPD, ISSR, simple sequence repeats (SSR) and CAP-

258
©FUNPEC-RP www.funpecrp.com.brGenetics and Molecular Research 12 (1): 256-269 (2013)
Z. Noormohammadi et al.
microsatellite (cleaved amplified polymorphic microsatellite) markers. Molecular tagging of agronomic traits was also attempted in this study.
MATERIAL AND METHODS
Plant materials
Eleven cotton genotypes (G. hirsutum L.) including 6 F2 progeny obtained by crossing Opal cultivar with 5 other cultivars, Bulgar539, No.200, V.S.O. (Varamin x Sahel x Okra leaf hybrid), Asj2.sealand (Acala-Sj2 x Sealand hybrid), and Cok.349 (Coker312 x L.349 hybrid), were used for morphologic and molecular studies. The cotton genotypes were cultivated in three rows 10 m long with a 20-cm interplant distance, in the experimental field of Gorgan Cotton Research Center of Iran, according to a completely randomized design (CRD) with 3 replications.
For the agronomy study, 5 plants were randomly selected from each genotype and 6 agronomic characters including lint percentage, micronaire (mg/inch), fiber length (mm), first yield, second yield, and total yield (kg/ha) were measured.
For molecular studies, fresh leaves were randomly collected from 3-5 plants in each genotype and dried on silica gel powder. Genomic DNA was extracted using the CTAB-activated charcoal protocol (Križman et al., 2006). The extraction procedure was based on activated charcoal and polyvinyl pyrrolidone (PVP) for binding of polyphenolics during extraction and on mild extraction and precipitation conditions, promoting a high-molecular weight DNA isolation without interfering contaminants. The quality of extracted DNA was examined by running on 0.8% agarose gel.
RAPD and ISSR amplification
Forty RAPD primers including 30 homo-RAPD primers of A, B, H, and R sets from the Operon Technologies (CA, USA) and 10 hetero-RAPD primers were used. RAPD reac-tions were performed in 20 µL containing 50 ng template DNA, 1X PCR buffer (10 mM Tris-HCl buffer, pH 8, 50 mM KCl), 1.5 mM Mg2+, 200 µM dNTP mix, 0.4 µM primer, and 0.4 U Taq polymerase (Bioron, Germany). Thermal program was carried out in thermocycler (Techne, UK). The profile used consisted of an initial denaturation for 3 min at 94°C, followed by 35 cycles in three segments: 1 min at 92°C, 1 min at 36°C and 1 min at 72°C, and a final extension for 10 min at 72°C.
Twenty ISSR primers including 10 homo-ISSR primers, namely UBC807, UBC810, UBC811, UBC823, UBC834, and UBC849, sold by UBC (University of British Columbia, Canada) and (GA)9A, (GA)9T, (GA)9C, (CA)9GT, as well as 10 combination ISSR primers, were used. PCR was performed in a 25-µL volume containing 10 mM Tris-HCl buffer, pH 8, 50 mM KCl, 1.5 mM MgCl2, 0.2 mM of each dNTP, 0.4 µM single primer, 20 ng genomic DNA, and 0.4 U Taq DNA polymerase (Bioron). Amplification reactions were performed in a Techne thermocycler with the following program: 3 min of an initial denaturation step at 94°C, followed by 35 cycles in three steps of 30 s at 94°C, 45 s at 52°C and 1 min at 72°C. The reaction was completed by a final extension step of 5 min at 72°C. Amplification products were visualized by running on a 2% agarose gel in 0.5X TBE buffer system, followed by 0.5

259
©FUNPEC-RP www.funpecrp.com.brGenetics and Molecular Research 12 (1): 256-269 (2013)
Genetic variation of intraspecific cotton hybrids
µg/mL ethidium bromide staining. Fragment size was estimated by using a 100-bp molecular size ladder (Fermentas, Germany).
Touchdown (Td) PCR-SSR and CAP-microsatellite amplification
Four cotton SSR loci including TMB1421 (accession No. BV679567), TMB1489 (ac-cession No. BV679585), Gh427 (accession No. DQ908366), and Nau2265 (accession No. DT048657) were used. Amplification of microsatellites was performed in PCRs in a total volume of 20 µL, containing 20 ng genomic DNA, supplied with 1X PCR buffer (Bioron), 2.2 mM MgCl2, 200 µM of each dNTP (Bioron), 1.5 U Taq DNA polymerase (Bioron), and 0.4 µM forward (fluorescently labeled) and reverse primers.
Td-PCR was carried out on a thermal cycler (Techne) programmed with denaturation at 94°C for 10 min, followed by 10 touchdown cycles of 1 min at 94°C, 1 min at 60°C (0.5°C lower per cycle) and 2 min at 72°C, and 33 cycles of 30 s at 94°C, 15 s at 55°C and 1 min at 72°C, with a final extension step of 6 min at 72°C.
Finally, the analysis was carried out on an automatic capillary sequencer ABI 3130 Genetic Analyzer (Applied Biosystems/Hitachi) using fluorescent dyes (FAM and HEX), and fragment sizes were determined using internal standards.
Monomorphic alleles obtained from the TMB1421 SSR locus were digested with three restriction enzymes: HindIII, EcoRI and MseI for CAP-microsatellite reaction. Brief-ly, 10 µL SSR-amplified products were separately digested with 3 U of the aforementioned restriction enzymes in a total volume of 40 µL, containing 4 µL 10X NEB#2 buffer (New England Biolabs), and 0.4 µL 10 mg/mL bovine serum albumin. The reaction mixtures were incubated at 37°C for 2 h. Products were run on a 2% agarose gel and visualized using an ultraviolet transilluminator.
Data analysis
Analysis of variance (ANOVA) and the least significance difference test (LSD) were performed to reveal significant differences in agronomic traits between the genotypes studied (Sheidai et al., 2004) by using SPSS version 16. For association between molecular markers and agronomic traits, stepwise regression was done by SPSS version 16. The reproducibility of amplified DNA fragments was examined by repeating PCR, as well as running samples on a gel 3 times. Reproducible bands (200 to 3000 bp) of each locus of RAPD and ISSR markers were scored as binary characters (present = 1, absent = 0). Combined data matrix obtained with two molecular markers was used for further analysis. In the Td-SSR study, the detection of amplification products was carried out with an automated sequencer (ABI PRISM 3130 DNA sequencer, Applied Biosystems, Foster City, CA, USA) at the Laboratory of Kowsar Biotech Co. (Tehran, Iran). Sizing was performed using the program Peak Scanner version 1.0 from Applied Biosystems.
For studying the informative potential of molecular markers and genetic diversity among genotypes, the effective number of alleles (NE), percentage of polymorphic loci, Shan-non index (I), polymorphic information content (PIC), and Nei’s genetic diversity (H) were calculated based on the frequency of alleles of each locus. POPGENE version 1.31 (Yeh et al., 1997) and GenAlex 6.4 (Peakall and Smouse, 2006) were used for these analyses.

260
©FUNPEC-RP www.funpecrp.com.brGenetics and Molecular Research 12 (1): 256-269 (2013)
Z. Noormohammadi et al.
UPGMA (unweighted pair group method with arithmetic mean) and neighbor joining (NJ) clustering based on different similarity matrices (Jaccard and simple matching coefficients) as well as ordination plot based on principal coordinate analysis (PCoA) for grouping of the cultivars were used. Cophenetic correlation was determined to check the fit of dendrograms ob-tained (Podani, 2000), while the Mantel test (Mantel, 1967) was performed for estimating corre-lation between RAPD, ISSR and SSR similarity matrices. NTSYS-pc version 2.02 (Rohlf, 1998) and GenAlex 6.4 (Peakall and Smouse, 2006) were used for tree construction and PCoA plots.
RESULTS
Agronomic traits
ANOVA and the LSD test of agronomic characteristics showed the presence of a significant difference (P < 0.05) in all characters except for micronaire among the cotton geno-types studied (Table 1). The LSD test performed between parental genotypes and their cross progeny showed that two parental genotypes, No.200 and Opal, did not significantly differ in second yield trait while their hybrid F2 plants (No.200 x Opal F2) showed significant increase in this trait compared to both parents. Similarly, fiber length significantly increased in Bul-gar539 x Opal hybrid compared with its parental genotypes (Bulgar539 and Opal).
Sum of squares Degrees of freedom Mean square F P
First yield Between groups 7,145,000 15 476,333 6.117 0.000 Within groups 2,491,666 32 77,864 Total 9,636,666 47 Second yield Between groups 4,412,864 15 294,190 3.222 0.003 Within groups 2,921,666 32 91,302 Total 7,334,531 47 Lint (%) Between groups 70.760 15 4.717 3.251 0.002 Within groups 46.427 32 1.451 Total 117.187 47 Total yield Between groups 6,142,031 15 409,468 3.258 0.002 Within groups 4,021,666 32 125,677 Total 10,163,697 47 Fiber length Between groups 85.398 15 5.693 7.315 0.000 Within groups 24.907 32 0.778 Total 110.305 47 Micronaire Between groups 0.993 15 0.066 1.159 0.350 Within groups 1.827 32 0.057 Total 2.819 47
Table 1. Analysis of variance of agronomic characters among the cotton genotypes studied.
Some agronomic traits showed significant difference between hybrid plants and one of their parental genotypes. For example, No.200 x Opal hybrid plants showed significant dif-ference between F2 hybrid plants and No.200 parental genotype only in the first yield trait (F = -583, P < 0.05).
Different clustering methods performed based on agronomic traits produced similar grouping (not provided here), and therefore, only the UPGMA dendrogram is discussed here (Figure 1), where cotton genotypes were grouped into 4 main clusters. The first cluster con-sisted of all parental cotton genotypes as well as F1 plants of Asj2.sealand x Opal, V.S.O. x Opal and both F1 and F2 plants of Bulgar539 x Opal.

261
©FUNPEC-RP www.funpecrp.com.brGenetics and Molecular Research 12 (1): 256-269 (2013)
Genetic variation of intraspecific cotton hybrids
Two genotypes, Opal and F1 plants of V.S.O. x Opal, showed more similarity than the other genotypes. The same was true for Asj2.sealand x Opal with one of its parents, i.e., Asj2.sealand. F1 plants of Cok.349 x Opal and No.200 x Opal formed the second major cluster, while the third major cluster included the F2 plants of No.200 x Opal, Cok.349 x Opal and V.S.O. x Opal. The F2 plants of Asj2.sealand x Opal formed the fourth major cluster, which was placed far from the other genotypes studied.
In PCoA based on agronomic traits, the first two components accounted for 65.73% of total variance. In the first component with about 38.69% of total variance, traits corresponding to second yield, lint% and total yield possessed the highest variance (>0.60) while fiber length showed a negative correlation (-0.68). The second factor comprised 27.14% of the total vari-ance, in which the trait first yield (>0.90) showed the highest correlation (Table 2).
Figure 1. UPGMA dendrogram based on agronomic characters.
Agronomic trait First component Second component
First yield 0.260 0.909Second yield 0.711 -0.648Lint (%) 0.625 0.568Total yield 0.946 0.037Fiber length -0.681 0.242Micronaire -0.007 0.007Individual percent 38.69% 27.14%Accumulative percent 38.69% 65.83%
Table 2. Variation of agronomic traits in the first two components extracted from principal coordinate analysis.
RAPD analysis
Ten of thirty homo-RAPD, as well as seven hetero-RAPD primers produced repro-ducible bands across 11 cotton genotypes studied. The number of bands varied from 7 in the
262
©FUNPEC-RP www.funpecrp.com.brGenetics and Molecular Research 12 (1): 256-269 (2013)
Z. Noormohammadi et al.
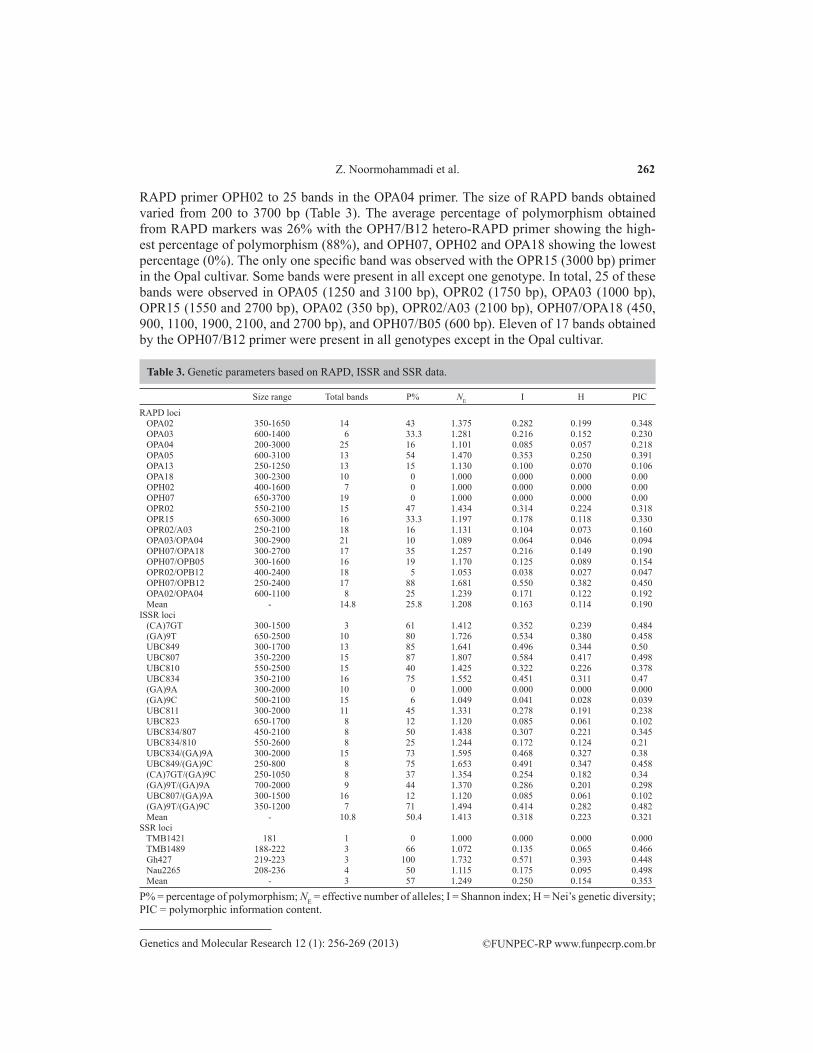
RAPD primer OPH02 to 25 bands in the OPA04 primer. The size of RAPD bands obtained varied from 200 to 3700 bp (Table 3). The average percentage of polymorphism obtained from RAPD markers was 26% with the OPH7/B12 hetero-RAPD primer showing the high-est percentage of polymorphism (88%), and OPH07, OPH02 and OPA18 showing the lowest percentage (0%). The only one specific band was observed with the OPR15 (3000 bp) primer in the Opal cultivar. Some bands were present in all except one genotype. In total, 25 of these bands were observed in OPA05 (1250 and 3100 bp), OPR02 (1750 bp), OPA03 (1000 bp), OPR15 (1550 and 2700 bp), OPA02 (350 bp), OPR02/A03 (2100 bp), OPH07/OPA18 (450, 900, 1100, 1900, 2100, and 2700 bp), and OPH07/B05 (600 bp). Eleven of 17 bands obtained by the OPH07/B12 primer were present in all genotypes except in the Opal cultivar.
Size range Total bands P% NE I H PIC
RAPD loci OPA02 350-1650 14 43 1.375 0.282 0.199 0.348 OPA03 600-1400 6 33.3 1.281 0.216 0.152 0.230 OPA04 200-3000 25 16 1.101 0.085 0.057 0.218 OPA05 600-3100 13 54 1.470 0.353 0.250 0.391 OPA13 250-1250 13 15 1.130 0.100 0.070 0.106 OPA18 300-2300 10 0 1.000 0.000 0.000 0.00 OPH02 400-1600 7 0 1.000 0.000 0.000 0.00 OPH07 650-3700 19 0 1.000 0.000 0.000 0.00 OPR02 550-2100 15 47 1.434 0.314 0.224 0.318 OPR15 650-3000 16 33.3 1.197 0.178 0.118 0.330 OPR02/A03 250-2100 18 16 1.131 0.104 0.073 0.160 OPA03/OPA04 300-2900 21 10 1.089 0.064 0.046 0.094 OPH07/OPA18 300-2700 17 35 1.257 0.216 0.149 0.190 OPH07/OPB05 300-1600 16 19 1.170 0.125 0.089 0.154 OPR02/OPB12 400-2400 18 5 1.053 0.038 0.027 0.047 OPH07/OPB12 250-2400 17 88 1.681 0.550 0.382 0.450 OPA02/OPA04 600-1100 8 25 1.239 0.171 0.122 0.192 Mean - 14.8 25.8 1.208 0.163 0.114 0.190ISSR loci (CA)7GT 300-1500 3 61 1.412 0.352 0.239 0.484 (GA)9T 650-2500 10 80 1.726 0.534 0.380 0.458 UBC849 300-1700 13 85 1.641 0.496 0.344 0.50 UBC807 350-2200 15 87 1.807 0.584 0.417 0.498 UBC810 550-2500 15 40 1.425 0.322 0.226 0.378 UBC834 350-2100 16 75 1.552 0.451 0.311 0.47 (GA)9A 300-2000 10 0 1.000 0.000 0.000 0.000 (GA)9C 500-2100 15 6 1.049 0.041 0.028 0.039 UBC811 300-2000 11 45 1.331 0.278 0.191 0.238 UBC823 650-1700 8 12 1.120 0.085 0.061 0.102 UBC834/807 450-2100 8 50 1.438 0.307 0.221 0.345 UBC834/810 550-2600 8 25 1.244 0.172 0.124 0.21 UBC834/(GA)9A 300-2000 15 73 1.595 0.468 0.327 0.38 UBC849/(GA)9C 250-800 8 75 1.653 0.491 0.347 0.458 (CA)7GT/(GA)9C 250-1050 8 37 1.354 0.254 0.182 0.34 (GA)9T/(GA)9A 700-2000 9 44 1.370 0.286 0.201 0.298 UBC807/(GA)9A 300-1500 16 12 1.120 0.085 0.061 0.102 (GA)9T/(GA)9C 350-1200 7 71 1.494 0.414 0.282 0.482 Mean - 10.8 50.4 1.413 0.318 0.223 0.321SSR loci TMB1421 181 1 0 1.000 0.000 0.000 0.000 TMB1489 188-222 3 66 1.072 0.135 0.065 0.466 Gh427 219-223 3 100 1.732 0.571 0.393 0.448 Nau2265 208-236 4 50 1.115 0.175 0.095 0.498 Mean - 3 57 1.249 0.250 0.154 0.353
P% = percentage of polymorphism; NE = effective number of alleles; I = Shannon index; H = Nei’s genetic diversity; PIC = polymorphic information content.
Table 3. Genetic parameters based on RAPD, ISSR and SSR data.

263
©FUNPEC-RP www.funpecrp.com.brGenetics and Molecular Research 12 (1): 256-269 (2013)
Genetic variation of intraspecific cotton hybrids
The highest mean values of NE, I, H, and PIC were observed with the OPAH07/B12 hetero-RAPD primer (1.681, 0.550, 0.382, and 0.450, respectively), while the lowest values of the same parameters occurred with the OPH07, OPH02 and OPA18 primers (Table 3).
ISSR analysis
Seventeen of twenty homo-ISSR and hetero-ISSR primers produced 206 reproducible fragments. The sizes of fragments obtained were from 250 to 2600 bp (Table 3). The num-ber of ISSR bands varied from 3 (CA)7GT to 16 (UBC807/GA9A and UBC834). Only one specific band was observed with the UBC807 (750 bp) primer in the V.S.O. x Opal genotype. Some bands were present in all except one genotype. In total, 22 of these bands were observed with (CA)7GT (850 bp), (GA)9T (1250 bp), (GA)9C (2100 bp), UBC811 (500 bp), UBC849 (400 and 550 bp), UBC810 (600 and 2000 bp), UBC849/(GA)9C (250 and 450 bp), (GA)9T/(GA)9A (750 and 1200 bp), UBC834 (1000, 1100 and 1200 bp), UBC834/(GA)9A (300, 650, 700, 800, 850, 1100, and 1200 bp).
The mean percentage of polymorphism obtained with ISSR markers was 50.49%, with a range of 0% with (GA)9A to 87% with UBC807. The highest values for NE, I, H, and PIC occurred with the UBC807 primer (1.807, 0.584, 0.417, and 0.498, respectively), while the lowest values for the same parameters were observed with the (GA)9A primer.
SSR and CAP-microsatellite analysis
Four SSR loci produced 12 different alleles by the Td-PCR-SSR analysis. All loci showed co-dominant behavior except for the Nau2265 locus in Cok.349 x Opal and No.200 genotypes with three alleles. The sizes of fragments obtained were from 181 to 236 bp (Table 3). The number of SSR bands varied from 1 (TMB1421) to 4 (Nau2265). Five specific alleles were observed in TMB1489 (222 and 225 bp), Gh427 (223 bp) and Nau2265 (235 and 236 bp). The mean percentage of polymorphism obtained in SSR markers was 57%, with a range of 0% with TMB1421 to 100% with Gh427. The highest NE, I, H, and PIC occurred with the Gh427 primer (1.732, 0.571, 0.393, and 0.448, respectively), while the lowest values for the same parameters were observed with the TMB1421 primer.
CAP-microsatellite was carried out on the TMB1421 locus with monomorphic al-lele (181 bp) to examine probable sequence polymorphisms in each genotype. RFLP prod-ucts using three restriction enzymes did not show sequence variations among the genotypes studied.
Informative markers
Association analysis between molecular markers and agronomy data is the best choice to find informative markers. In the present study, rare RAPD, ISSR and SSR markers (alleles with a frequency less than 5%) were used to identify genetic markers that were as-sumed to be close to genes involved with agronomic traits. The result of stepwise regression analysis showed significant positive correlation between ISSR-UBC807-1500 and second yield trait (adjusted R2 = 0.281, R2 = 0.346, P = 0.04). The other rare alleles showed no cor-relation.

264
©FUNPEC-RP www.funpecrp.com.brGenetics and Molecular Research 12 (1): 256-269 (2013)
Z. Noormohammadi et al.
Genetic relationships
Based on RAPD, ISSR and SSR data, different similarity coefficients were determined among the genotypes upon which UPGMA and NJ dendrograms were constructed. In RAPD, ISSR and SSR, the highest cophenetic correlation (r = 0.95, r = 0.94 and r = 0.87, respectively) was obtained for the UPGMA dendrogram constructed using the Jaccard similarity coefficient.
The similarity coefficient obtained in RAPD analysis ranged from 0.84 to 0.97 among the genotypes studied, while the ranges were 0.70 to 0.95 and 0.58 to 1.00 in ISSR and SSR analysis, respectively.
The Mantel test performed between the genetic distance matrices obtained from RAPD, ISSR and SSR showed a non-significant regression (P < 0.05) between RAPD and ISSR (R2 = 0.001, P = 0.50) and ISSR and SSR (R2 = 0.012, P = 0.32), while RAPD versus SSR showed significant regression (R2 = 0.21, P = 0.04). Meanwhile, regression for ISSR and RAPD+ISSR+SSR combined data was significant (R2 = 0.870, P = 0.01), and regressions for RAPD and RAPD+ISSR+SSR and for SSR and RAPD+ISSR+SSR combined data were not significant (R2 = 0.013, P = 0.30 and R2 = 0.032, P = 0.19, respectively; Figure 2).
Figure 2. Regression diagrams of the Mantel test between genetic distances (GD) of two molecular markers. A. Regression between RAPD (GD) and ISSR (GD); B. regression between SSR (GD) and RAPD (GD); C. regression between SSR (GD) and ISSR (GD); D. regression between SSR (GD) and RAPD+ISSR+SSR (GD); E. regression between RAPD (GD) and RAPD+ISSR+SSR (GD); F. regression between ISSR (GD) and RAPD+ISSR+SSR (GD).
The dendrograms obtained for RAPD, ISSR and SSR markers agreed in some parts with each other. The UPGMA dendrogram obtained from the pooled data of RAPD, ISSR

265
©FUNPEC-RP www.funpecrp.com.brGenetics and Molecular Research 12 (1): 256-269 (2013)
Genetic variation of intraspecific cotton hybrids
and SSR analyses (total of 472 amplicons) is depicted in Figure 3. The similarity coefficient values obtained in RAPD+ISSR+SSR analysis ranged from 0.54 for V.S.O. and Opal to 0.87 for the Bulgar539 and Asj2.sealand genotypes. Totally, the 11 genotypes were grouped into three major clusters.
Figure 3. UPGMA dendrogram of cotton genotypes based on RAPD, ISSR and SSR markers. N = No.200; V = V.S.O.; AsO = Asj2.sealand x Opal; BO = Bulgar539 x Opal; NO = No.200 x Opal; C = Cok.349; B = Bulgar539; As = Asj2.sealand; CO = Cok.349 x Opal; O = Opal; VO = V.S.O. x Opal.
Cluster A consisted of 8 cotton genotypes, including all hybrid genotypes (except Asj2.sealand x Opal) and 4 parental cultivars, namely Asj-2.sealand, Bulgar539, Cok.349, and Opal.
The cultivars Asj2.sealand and Bulgar539 showed the highest similarity (0.87) among the genotypes studied. Cok.349 x Opal hybrid showed more similarity to one of parental geno-type (Cok.349, 82%) than the other parent (Opal, 79%).
Although Bulgar539 x Opal and its parental genotypes were also grouped in cluster A along with others, they are placed far from their two parental genotypes, Opal and Bulgar539. The same held true for Asj2.sealand x Opal hybrid and its parental genotypes (Opal and Asj2.sealand). The Asj2.sealand and V.S.O. cultivars formed a second cluster (B), which showed low similarity to their hybrids (Asj2.sealand x Opal and V.S.O. x Opal genotypes) compared to their other parents. A third cluster (C) contained only one parental genotype, No.200. Simi-larly, No.200 parental genotype was more distant from hybrid progeny No.200 x Opal com-pared to the other parent.
PCoA based on the first two components (factors) confirmed cluster analysis (Figure 4) using combined molecular data when the eigenvalues for the first and second components were 27.37 and 21.23%, respectively. In the first component, No.200, V.S.O. and Opal x Ajs2.sealand attributed the highest eigenvectors and separated from other genotypes. The Opal x Bulgar539, No.200 and Opal x No.200 genotypes were placed separately by the second com-ponent with the highest eigenvectors.

266
©FUNPEC-RP www.funpecrp.com.brGenetics and Molecular Research 12 (1): 256-269 (2013)
Z. Noormohammadi et al.
DISCUSSION
In this study, all agronomic traits except for micronaire revealed significant differ-ences between cotton genotypes, indicating genetic variability among cotton cultivars. In our previous study, significant differences in morpho-agronomic traits were also reported among other Iranian intraspecific tetraploid (G. hirsutum) hybrids (Noormohammadi et al., 2011b). Esmail et al. (2008) also reported high variability among morphologic characters in tetraploid hybrids (G. barbadense).
Analysis of hybrids and their parental genotypes in pairs showed that the second yield trait increased significantly in No.200 x Opal hybrid in comparison to No.200 and Opal paren-tal genotypes. Opal is a Mediterranean imported cotton genotype, which has been cultivated in Iran for several years, and it is a suitable genotype for cotton breeding and hybridization pro-grams thanks to its desirable traits including earliness, relatively high yield and dense canopy. On the other hand, No.200 cultivar (imported from Greece) with relatively good earliness, high yield and tolerance to biotic and abiotic stresses is another genotype selected for breed-ing in Iran. No.200 x Opal F2 progeny, which was produced in the Gorgan Cotton Research Center, revealed significantly higher second yield trait compared to both parents.
The Bulgar539 x Opal hybrid showed significantly higher fiber length compared to its parents, which makes this cultivar a new elite cotton genotype for future breeding. Alishah et al. (2009) reported that No.200 had significant general combining ability (GCA) for yield while Bulgar539 showed significant GCA for earliness. All these data indicate that the agro-nomic traits studied here could be improved through hybridization. On the other hand, based on UPGMA clustering, F1 and F2 hybrid progenies were mostly separated from their respective parental genotypes and may therefore be useful candidates for future hybridization program.
Screening of 50 RAPD and ISSR primers for reproducible bands introduced 27 reli-able primers in the present study. RAPD markers showed low polymorphism (26%), support-
Figure 4. Principal coordinate analysis based on combined RAPD and ISSR data. N = No.200; V = V.S.O.; AsO = Asj2.sealand x Opal; BO = Bulgar539 x Opal; NO = No.200 x Opal; A = Asj2.sealand; C = Cok.349; B = Bulgar539; CO = Cok.349 x Opal; O = Opal; VO = V.S.O. x Opal.

267
©FUNPEC-RP www.funpecrp.com.brGenetics and Molecular Research 12 (1): 256-269 (2013)
Genetic variation of intraspecific cotton hybrids
ing results obtained by Noormohammadi et al. (2011a; 32%) and Sheidai et al. (2007a,b; 30 and 19%, respectively) in other tetraploid cotton genotypes cultivated in Iran. Lu and Myers (2002) also reported low polymorphism among influential upland cotton cultivars (13.5%), as did Multani and Lyon (1995) for some cotton genotypes studied (30%) and Amjad Ali et al. (2008) (14%). In contrast, Rahman et al. (2002), Iqbal et al. (1997), Maleia et al. (2010), and Rana and Baht (2005) observed high polymorphism among G. hirsutum cultivars (66, 89, 90, and 97%, respectively). Also, Tafvizi et al. (2010) and Noormohammadi et al. (2011b) with 45 and 80% polymorphism, respectively, reported higher variation among Iranian hybrid cotton genotypes.
RAPD and ISSR markers are dominant molecular markers, but ISSR markers in this study showed a higher mean incidence of polymorphism (50.49%), NE, I, H, and PIC, sup-porting Noormohammadi et al. (2011b) with regard to other Iranian cotton hybrid genotypes. Dongre et al. (2004) and Wei et al. (2008) reported similar levels of polymorphism (54 and 57%, respectively) among upland cotton genotypes.
In total, the results indicate more genetic variability among the genome regions that are amplified by ISSR markers in this study. Meanwhile, hetero-ISSR primers showed higher levels of genetic parameters compared to homo-ISSR primers in this study, supporting higher levels of polymorphism in sequences occurring between different ISSR primer sequences. This study also showed high variations in primers with GA repeated motif with one anchored nucleotide primer.
The controversial reports on the extent of observed polymorphism in cotton in differ-ent studies could stem either from the nature of the genetic material under investigation with different origins and hybridization and breeding programs or from different numbers and types of RAPD and ISSR markers in the aforementioned studies.
SSR markers with their co-dominant nature showed a high incidence of polymor-phism. It is in agreement with reports by Li et al. (2008) and Khan et al. (2009). Comparison of allelic patterns between parental and hybrid genotypes showed that some alleles are present in No.200 x Opal hybrid, while they are absent in one or both of its parental genotypes. The same is true for Cok.349 x Opal hybrid. For example, bands of 225 and 223 bp for TMB1489 and Gh427, respectively, occurred in No.200 x Opal hybrid but were absent in its parental genotypes. In contrast, some bands were present in parental genotypes but were absent in the hybrid plants. For example, the allele of 217 bp was absent in hybrid plants of No.200 x Opal but was present in both its parental genotypes. One of the reasons to be considered for differ-ent allelic patterns between parentals and hybrids is nucleotide changes in flanking regions, where SSR primers anneal. Chromosomal crossing over during meiosis and loss of primer attachment pair sites could be another reason for producing novel allelic patterns in genotypes (Sheidai et al., 2008). This phenomenon has also been reported in other plant species hybrids (Smith et al., 1996; Sushir et al., 2008).
Among 11 SSR alleles, TMB1489 showed monomorphic alleles in all genotypes (181 bp). Although CAP-microsatellite using three restriction enzymes could not find any sequence variation among the samples, using more restriction enzymes may reveal sequence differences at this locus. In total, digestion of SSR-PCR products by restriction enzymes (RFLP) could provide more information about polymorphism among the SSR loci studied.
Pairwise Mantel tests between the three molecular markers used produced significant regression values between RAPD and SSR data (P < 0.04), and ISSR and RAPD+ISSR+SSR

268
©FUNPEC-RP www.funpecrp.com.brGenetics and Molecular Research 12 (1): 256-269 (2013)
Z. Noormohammadi et al.
data (P < 0.01). This showed that RAPD data were closer to SSR data and ISSR data to RAPD+ISSR+SSR combined markers. No significance correlations were observed between RAPD and ISSR as well as RAPD and RAPD+ISSR+SSR data. The main reason might have been the different genome portions amplified by these different DNA markers.
The values of similarity coefficient obtained in RAPD+ISSR+SSR analysis showed high similarity between the cotton genotypes studied. A high similarity between tetraploid cotton genotypes has also been reported by Lu and Myers (2002), Rana and Bhat (2005), Esmail et al. (2008), and Sapkal et al. (2011) by using various molecular markers. The presence of genetic similarities between the cotton genotypes studied, partly indicate that due to rigorous selection practice performed during domestication and cultivation of cotton genotypes throughout the country, some degree of genetic diversity might have been lost in the cotton germplasm available.
The UPGMA cluster (Figure 2) constructed based on genetic distance matrix using three molecular markers partially differentiated parental and their hybrid genotypes. For ex-ample, V.S.O. and No.200 genotypes were located far from their hybrids, while another pa-rental genotype (Opal) showed more similarity to these hybrids (Opal x V.S.O. and Opal x No.200). Analysis of agronomic traits also supported the distinctness of these hybrids from their parents. These results indicate that via hybridization and possible genetic rearrange-ments, the hybrids have gained some genetic novelties not available in their parental genomes. A similar case existed for Opal x Asj2.sealand and Opal x Bulgar539 hybrids, which showed genetic differences compared to both parents. These results support cotton breeders’ aims to access more genetic variations.
In conclusion, correlation between agronomic traits with some molecular markers may provide tools for molecular tagging of agronomic traits. In another aspect of the pres-ent study, using different DNA markers of different nature could help in the differentiation of cotton genotypes and evaluation of their genetic variations. Combined molecular data can provide more information and clear discrimination of genotypes. In addition, intraspecific hybridization showed more diversity and distinctness in comparison to parental genotypes, giving great information to cotton breeding programs for achieving more genetic variations in cotton genotypes.
ACKNOWLEDGMENTS
Research supported by the Science and Research Branch, Islamic Azad University.
REFERENCES
Alishah O, Fahmideh L and Nasrollah Nejad S (2009). Genetic analysis of yield and some associated traits in upland cotton (Gossypium hirsutum L.) genotypes. J. Plant Production 16: 67-85.
Amjad Ali M, Seyal MT, Awan SI, Niaz S, et al. (2008). Hybrid authentication in upland cotton through RAPD analysis. Aust. J. Crop Sci. 2: 141-149.
Dongre A, Parkhi V and Gahukar S (2004). Characterization of cotton (Gossypium hirsutum) germplasm by ISSR, RAPD markers and agronomic values. Ind. J. Biotechnol. 3: 388-393.
Esmail RM, Zhang JF and Abdel-Hamid AM (2008). Genetic diversity in elite cotton germplasm lines using field performance and RAPD markers. World J. Agr. Sci. 4: 369-375.
Iqbal MJ, Aziz N, Saeed NA, Zafar Y, et al. (1997). Genetic diversity evaluation of some elite cotton varieties by RAPD analysis. Theor. Appl. Genet. 94: 139-144.

269
©FUNPEC-RP www.funpecrp.com.brGenetics and Molecular Research 12 (1): 256-269 (2013)
Genetic variation of intraspecific cotton hybrids
Kantartzi SK, Ulloa M, Sacks E and Stewart JM (2009). Assessing genetic diversity in Gossypium arboreum L. cultivars using genomic and EST-derived microsatellites. Genetica 136: 141-147.
Khan AI, Fu YB and Khan IA (2009). Genetic diversity of Pakistani cotton cultivars as revealed by simple sequence repeat markers. Comm. Biomet. Crop Sci. 4: 21-30.
Križman M, Jakse J, Baricevic D, Javornik B, et al. (2006). Robust CTAB-activated charcoal protocol for plant DNA extraction. Acta Agr. Slov. 87: 427-433.
Li Z, Wang X, Zhang Y, Zhang G, et al. (2008). Assessment of genetic diversity in glandless cotton germplasm resources by using agronomic traits and molecular markers. Front. Agr. China 2: 245-252.
Lu H and Myers G (2002). Genetic relationships and discrimination of ten influential upland cotton varieties using RAPD markers. Theor. Appl. Genet. 105: 325-331.
Maleia MP, Filho Vidigal PS, Gonçalves-Vidigal MC, Gonela A, et al. (2010). Genetic divergence among African and American cotton (Gossypium hirsutum L. race latifolium H.) cultivars and inbred lines through random amplification of polymorphic DNA (RAPD) markers. Afr. J. Biotechnol. 9: 8539-8548.
Mantel N (1967). The detection of disease clustering and a generalized regression approach. Cancer Res. 27: 209-220.Multani DS and Lyon BR (1995). Genetic fingerprinting of Australian cotton cultivars with RAPD markers. Genome 38:
1005-1008.Noormohammadi Z, Shawi Al-Rubaye MT, Sheidai M and Alishah O (2011a). ISSR, RAPD and agronomic study in some
F1 and F2 cotton genotypes. Acta Biol. Szeged. . 55: 219-225.Noormohammadi Z, Shojaei-Jeshvaghani F, Sheidai M, Farahani F, et al. (2011b). ISSR and RAPD analysis of genetic
diversity in Mehr cotton cultivar and its crossing progenies. Afr. J. Biotechnol. 10: 11839-11847.Peakall R and Smouse PE (2006). GENALEX 6: genetic analysis in Excel. Population genetic software for teaching and
research. Mol. Ecol. Notes 6: 288-295.Podani J (2000). Introduction to the Exploration of Multivariate Biological Data. Backhuy Publishers, Leiden.Rahman M, Hussain D and Zafar Y (2002). Estimation of divergence among elite cotton cultivars-genotypes by DNA
fingerprinting technology. Crop Sci. 42: 2137-2144.Rana MK and Bhat KV (2005). RAPD markers for genetic diversity study among Indian cotton cultivars. Curr. Sci. 88:
1956-1961.Rohlf FJ (1998). NTSYS-pc. Numerical Taxonomy and Multivariate Analysis System. Version 2.00. Exeter Software,
Setauket.Sapkal DP, Sutar SR, Thakre PB, Patil BR, et al. (2011). Genetic diversity analysis of maintainer and restorer accessions
in upland cotton (Gossypium hirsutum L.). J. Plant Biochem. Biotechnol. 20: 20-28.Sheidai M, Roohi R and Nematei N (2004). Cytogenetic and morphometric study of bakhtegan cultivar and its crossing
progenies with gamma irradiated cottons. The Nucleus 47: 107-116.Sheidai M, Dokhanchei A, Shahriari ZH, Noormohammadi Z, et al. (2007a). Study of genetic polymorphism in some
tetraploid cotton cultivars by using RAPD analysis. Pak. J. Biol. Sci. 10: 2748-2751.Sheidai M, Shahriari ZH, Roknizadeh H and Noormohammadi Z (2007b). RAPD and cytogenetic study of some tetraploid
cotton (Gossypium hirsutum L.) cultivars and their Hybrids. Cytologia 72: 77-82.Sheidai M, Dokhanchi A and Noormohammadi Z (2008). Karyotype and chromosome pairing analysis in some iranian
upland cotton (Gossypium hirsutum) cultivars. Cytologia 73: 275-281.Smith JF, Burke CC and Wogner WL (1996). Interspecific hybridization in natural populations of cyrtandra (Generiaceae)
on the Hawaiian Islands: evidence from RAPD markers. Plant Syst. Evol. 200: 61-77.Sushir KV, Mehetre SS, Patil SC and Kamdi SR (2008). RAPD and cytogenetic study in F1 and F2 of interspecific cross
between Gossypium arboreum x Gossypium anomalum. Cytologia 73: 213-219.Tafvizi F, Sheidai M, Noormohammadi Z and Alishah O (2010). Cytogenetic and RAPD analysis of cotton cultivars and
their F1 progenies. Caryologia 63: 73-81.Ullah I, Iram A, Iqbal MZ, Nawaz M, et al. (2012). Genetic diversity analysis of Bt cotton genotypes in Pakistan using
simple sequence repeat markers. Genet. Mol. Res. 11: 597-605.Wei J, Hong-bo Z and Jue-min H (2008). Genetic diversity in germplasm resources of cotton from different area based on
ISSR markers. Cotton Sci. 20: 348-353.Yeh FC, Yang RC and Boyle T (1997). Population Genetic Analysis (POPGENE 1.31). A Joint Project of University of
Alberta and Center for International Forestry Research, Edmonton.