Embed Size (px)
Citation preview

Methodology for Evaluating Security Controls Based on Key Performance Indicators and Stakeholder Mission
Frederick T. Sheldon Oak Ridge National Laboratory
Robert K. Abercrombie Oak Ridge National Laboratory
Ali Mili New Jersey Institute of Technology
Abstract Information security continues to evolve in
response to disruptive changes with a persistent focus on information-centric controls and a healthy debate about balancing endpoint and network protection, with a goal of improved enterprise/business risk management. Economic uncertainty, intensively collaborative styles of work, virtualization, increased outsourcing and ongoing compliance pressures require careful consideration and adaptation. This paper proposes a Cyberspace Security Econometrics System (CSES) that provides a measure (i.e., a quantitative indication) of reliability, performance and/or safety of a system that accounts for the criticality of each requirement as a function of one or more stakeholders’ interests in that requirement. For a given stakeholder, CSES accounts for the variance that may exist among the stakes one attaches to meeting each requirement. This paper introduces the basis, objectives and capabilities for the CSES including inputs/outputs as well as the structural and mathematical underpinnings. 1. Introduction
Good security metrics are required to make good decisions about how to design security counter-measures, to choose between alternative security architectures, and to improve security during operations. Therefore, in essence, measurement can be viewed as a decision aid. The lack of sound and practical security metrics is severely hampering progress in the development of secure systems.
Our Cyberspace Security Econometrics System (CSES) provides the following advantages over traditional measurement systems: (1) CSES accounts for the variances that exist among different stakeholders of the same system. Different stakeholders will typically attach different stakes to the This manuscript has been authored by a contractor of the U.S. Government under contract DE-AC05-00OR22725. Accordingly, the U.S. Government retains a nonexclusive, royalty-free license to publish or reproduce the published form of this contribution, or allow others to do so, for U.S. Government purposes.
same requirement or service (e.g., a service may be provided by an information technology system or process control system, etc.). (2) For a given stakeholder, CSES accounts for the variance that may exist among the stakes one attaches to meeting each requirement. The same stakeholder may attach different stakes to satisfying different requirements within the overall system specification. (3) For a given compound specification (e.g., combination(s) of commercial off the shelf software and/or hardware), CSES accounts for the variance that may exist among the levels of verification and validation (i.e., certification) performed on the various components of the specification. In other words, the certification activity may produce higher levels of assurance across different components of the specification than others.
The relations between value based quantitative systems, risk assessment and other cyberspace research and applications areas is well founded [1-3]. These relations, characterized by CSES, are unavoidably involved with software and information system product and process technology, and their interaction with human values. CSES's rationale is strongly empirical, but includes new concepts in need of stronger theory. CSES uses risk considerations to balance information assurance discipline and flexibility, and to answer other key “how much is enough?” questions [4]. CSES will help to illuminate information technology policy decisions by identifying the quantitative and qualitative sources of cost and value associated with candidate decisions. In this paper we introduce the basis, objectives and capabilities for the CSES including inputs/outputs and the basic structural and mathematical underpinnings. 1.1. Qualities of Security Metrics
Some qualities of a good metric include: (1) ability to measure the right thing (e.g., supports the decisions that need to be made), (2) quantifiable (e.g., damages in dollars of profit loss), (3) capability to be measured precisely and accurately, (4) ability to be validated against ground truth, and (5) confidence level one has in the assertions made within the framework of the

metric. To these criteria, one should add the following desirable properties: (1) inexpensive in time and cost to perform, (2) ability to be refereed independently, (3) repeatable so the outputs are independent of the analyst performing the measurement, and (4) scalable from small, single computer systems to large, nation-scale enterprise networks. 1.2. Quantifying Security Metrics
System security should be characterized, not by some abstract discrete scale, but rather by the very concrete determinant, mean failure cost (MFC) [5, 6]. MFC reveals how much each stakeholder stands to lose from mission value due to the lack of security. Subsequent use of this quantification enables us to derive an economic model that captures the tradeoffs involved in deploying security counter measures. Let us consider some fundamental pieces needed for evaluating security control.
1.3. Fundamental Concepts
Figure 1 shows essential input/output components and phases (i.e., discovery, evaluation and metrics)
including data collection/analysis and consisting of the following:
System Stakeholders refers to any person or organization that has a stake in the operation of the system (i.e., users, operators of the system, hosts of the systems, etc.).
Security Specification used in the same way that correctness is a relative attribute (a system is correct with respect to its functional specification) and refers to a representation of the security attributes that a system must satisfy to be deemed secure.
Security Requirement used in the same way that a complex functional specification is typically composed of simpler components (representing elementary functional properties), and is composed of simpler security requirements [5, 7].
Mean Failure Cost used in the operational sense because the lack of security within the system may cause damage, in terms of lost productivity, lost business, lost data, resulting in security violations. We represent this loss by a random variable, and define MFC as the mean of this random variable [5]. As discussed further, this quantity is not intrinsic to the system, but varies by stakeholder.
Figure 1. Cyber Security Econometrics System (CSES)

2. Step-Wise Process of CSES
To estimate the mean failure cost of a system for a set of stakeholders, we need to initially identify and then maintain the following information: (1) the set of stakeholders of the system, and (2) the set of security specifications and thus security requirements that are to be required/provided by the system. (3) For each stakeholder and each security requirement, the stake that the selected stakeholder attaches to the selected service (or conversely, the cost that the stakeholder incurs if the service is disrupted). This information is provided by stakeholders. (4) For each component of a specific security requirement, the likelihood that the system provides that service as specified. This information is computed in light of the V&V measures (inspection, verification, testing, security measures, firewalls, vulnerability removal, threat mitigation, etc) that the system has undergone. In particular, estimating the likelihood of delivering a service requires that we analyze to what degree the components that are involved in delivering this service have been validated. The CSES process proceeds in three steps (Generation of Stakes Matrix, Dependency Matrix, and Threat Matrix), discussed in the next subsections [8, 9]. CSES encompasses not only failure costs but also mitigation costs, specifically verification costs [8]. 2.1. Generation of Stakes Matrix
The MFC estimation depends on the following premises: (1) a stakeholder may have different stakes in different security requirements, and (2) a security requirement may carry different stakes for different stakeholders. The best way to represent this situation is through a two dimensional matrix, where the rows represent stakeholders, the columns represent security requirements and the entries represent stakes, as shown in Table 1.
The FC entry at row i, column j, represents the cost that stakeholder Si would lose if the system failed to meet the security requirement Rj (i.e., also represented as FC(Si,Rj)). The data in Table 1 is determined by
stakeholders. Each row is filled by the corresponding stakeholder, possibly in their own (possibly distinct) financial / economic terms (Dollars, Person Months, Euros, etc).
Using this computational infrastructure, we estimate the MFC of the system for a stakeholder i as the weighted sum of the stakes that he attaches to all
the services (security requirements) of interest, weighted by the probability of failing to deliver these services. Specifically,
).1(1
jji
n
ii PFCMFC −×=∑
=
We envision using this metric, not only off-line, to estimate the seaworthiness of the system for a particular stakeholder, but also for online monitoring of a real-time system. To the extent that the probabilities of service delivery (i.e., success of security requirement being met) may be profoundly altered by an ongoing attack or intrusion, this may adjust the calculations of the mean failure costs, and may push MFC for a particular stakeholder beyond
Table 1. Stakes (ST) Matrix: Cost of failing a security requirement
Security Requirements R1 R2 R3 … Rn
Stak
ehol
ders
S1 S2 S3
… jiFC
Sm
Probabilities of Security Requirements Delivery
jP
Table 2. Example of Stakes (ST) Matrix showing requirements
Stakeholder Requirements
Requirement 1: Safety Requirement
Requirement 2: Timeliness
Passengers Personal safety Convenience, Scheduling
Airline Company Liability for loss of life Reputation of airline
Reputation for timeliness / PR
Aircraft Manufacturer
Liability for loss of life Reputation of aircraft
Zero
Accident Insurance of Aircraft
Replacement Value of the Aircraft, Liability
Zero
Life Insurance of Passenger
Value of Life Insurance Zero

acceptable values, triggering an alarm. Recently, several techniques have emerged to
characterize stakeholders and their respective interests. A variety of approaches extend from mapping security threats applying Computer Emergency Readiness Team (CERT) taxonomy; to stakeholders in the automotive industry [10, 11]; to investigations to secure vehicles against cyber attacks using the Defense-in-Depth paradigm [12]; to physically embedding information and communications technology (ICT) security into vehicles themselves [13]. Applications further extend to checklists [14] and improving the cyber incident mission impact in the military [15] and evaluating damage from cyber attacks [16]. The long-standing question, therefore, is, “How much security is enough?” To address this question, the subject domain of risk management must be addressed [4, 17]. When risk management is factored into the equation, classical approaches can be of benefit [18-20]. To illustrate the relevance of this Stakes matrix, and the idea of requirement-dependent failure cost, let us consider the example of a flight control system on board a commercial aircraft as shown in Table 2.
Stakeholders: The aircraft pilot; the passengers; the airline company; the aircraft manufacturer; the FAA; the insurance company that insures the aircraft; the insurance company that insures a passenger (life insurance); the EPA; etc.
Requirements: Adhering to Safety Requirements (maintaining the aircraft above stalling speed, ensuring never to reverse thrust in mid-air, ensuring landing gears are out before landing, etc); Adhering to FAA flight vector; Ensuring timely response to autopilot parameter adjustments; Maximizing fuel efficiency;
Minimizing flight delay; Ensuring a smooth ride; Minimizing emission of greenhouse gases; etc.
Stakes: For the sake of illustration, we present below two sample columns of the Stakes table (Table
2), corresponding to two requirements: Safety and Timeliness.
All these stakes are typically well known, and can be quantified financially. Using the Stakes Matrix, we estimate the MFC of Stakeholder S as follows:
∑ ×=iR
ii RSFCRPSMFC ).,()()(
Where P(Ri) is the probability that the system fails to meet requirement Ri. In other words, the mean failure cost for stakeholder S is the sum, for all requirements, of the cost of failing these requirements weighted by the probability of failing them. We discussed above how to derive the Stakes table, that provide the terms FC(S,Ri). In the next subsection, we discuss how to derive the probability terms. 2.2. Generation of Dependency Matrix
The question we address in this section (Table 3) is how to estimate the probability that a particular security requirement is violated in the course of operating the system for some period of time. The idea that we pursue here is to link the probability of failing a particular requirement with the probability of failure
of a component of the system. The elucidation of this probabilistic link involves an analysis of the system’s architecture, to determine which component contributes to meeting which requirement. However, to
Table 4. Example of Dependency (DP) Matrix: Links requirements with components
Components Requirements
Processing Component
Login Component
Secure Storage Component
User Profile Analysis
Freedom from Insider Threats 0.01 0.6 0.2 0.98
Protection of Critical Data 0.01 0.2 0.98 0.2
Access Control 0.01 0.98 0.4 0.1
Table 3. Dependency (DP) Matrix: Links requirements with components
Components C1 C2 C3 … Ck
Req
uire
men
ts R1
R2 R3
… )|( ji ERπ
Rn
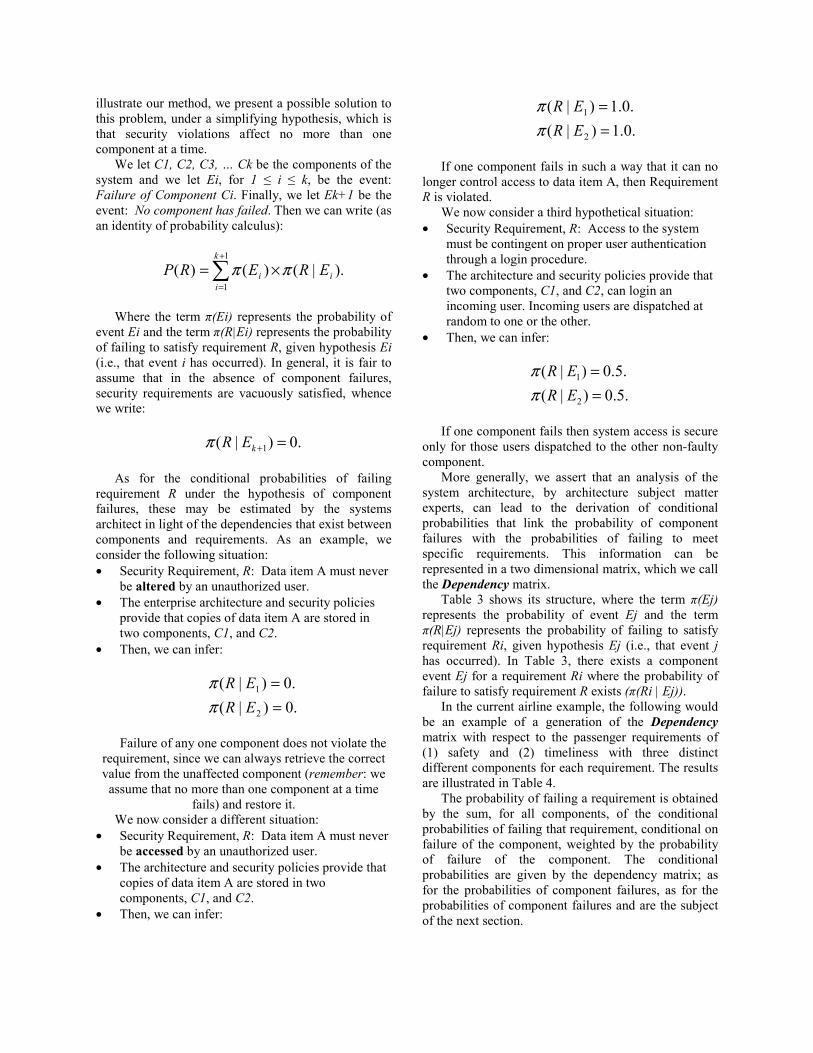
illustrate our method, we present a possible solution to this problem, under a simplifying hypothesis, which is that security violations affect no more than one component at a time.
We let C1, C2, C3, … Ck be the components of the system and we let Ei, for 1 ≤ i ≤ k, be the event: Failure of Component Ci. Finally, we let Ek+1 be the event: No component has failed. Then we can write (as an identity of probability calculus):
∑+
=
×=1
1).|()()(
k
iii ERERP ππ
Where the term π(Ei) represents the probability of
event Ei and the term π(R|Ei) represents the probability of failing to satisfy requirement R, given hypothesis Ei (i.e., that event i has occurred). In general, it is fair to assume that in the absence of component failures, security requirements are vacuously satisfied, whence we write:
.0)|( 1 =+kERπ
As for the conditional probabilities of failing
requirement R under the hypothesis of component failures, these may be estimated by the systems architect in light of the dependencies that exist between components and requirements. As an example, we consider the following situation: • Security Requirement, R: Data item A must never
be altered by an unauthorized user. • The enterprise architecture and security policies
provide that copies of data item A are stored in two components, C1, and C2.
• Then, we can infer:
.0)|(.0)|(
2
1
==
ERER
ππ
Failure of any one component does not violate the
requirement, since we can always retrieve the correct value from the unaffected component (remember: we
assume that no more than one component at a time fails) and restore it.
We now consider a different situation: • Security Requirement, R: Data item A must never
be accessed by an unauthorized user. • The architecture and security policies provide that
copies of data item A are stored in two components, C1, and C2.
• Then, we can infer:
.0.1)|(.0.1)|(
2
1
==
ERER
ππ
If one component fails in such a way that it can no
longer control access to data item A, then Requirement R is violated.
We now consider a third hypothetical situation: • Security Requirement, R: Access to the system
must be contingent on proper user authentication through a login procedure.
• The architecture and security policies provide that two components, C1, and C2, can login an incoming user. Incoming users are dispatched at random to one or the other.
• Then, we can infer:
.5.0)|(.5.0)|(
2
1
==
ERER
ππ
If one component fails then system access is secure
only for those users dispatched to the other non-faulty component.
More generally, we assert that an analysis of the system architecture, by architecture subject matter experts, can lead to the derivation of conditional probabilities that link the probability of component failures with the probabilities of failing to meet specific requirements. This information can be represented in a two dimensional matrix, which we call the Dependency matrix.
Table 3 shows its structure, where the term π(Ej) represents the probability of event Ej and the term π(R|Ej) represents the probability of failing to satisfy requirement Ri, given hypothesis Ej (i.e., that event j has occurred). In Table 3, there exists a component event Ej for a requirement Ri where the probability of failure to satisfy requirement R exists (π(Ri | Ej)).
In the current airline example, the following would be an example of a generation of the Dependency matrix with respect to the passenger requirements of (1) safety and (2) timeliness with three distinct different components for each requirement. The results are illustrated in Table 4.
The probability of failing a requirement is obtained by the sum, for all components, of the conditional probabilities of failing that requirement, conditional on failure of the component, weighted by the probability of failure of the component. The conditional probabilities are given by the dependency matrix; as for the probabilities of component failures, as for the probabilities of component failures and are the subject of the next section.

2.3. Generation of Impact Matrix
The Impact Matrix shows the Component Failure versus Threats Relationship Grouping (Table 5). The probability of component failure depends on three factors: (1) the armor (e.g., Technical Controls or mitigations) that the component is provided with to protect against threats and to mitigate damage in the case of successful attacks. (2) Pattern of threats that the component is subjected to. In the same way that researchers of reliability define fault models that catalog faults under consideration, we must define threat models that catalog what threats or families of threats we want to protect against. An example of classification may include: insider threats; intrusions; denial of service threats; authentication threats; etc. (3) the degree of verification and validation that the component has undergone, be it through testing, inspection, static analysis, etc.
To assess the likelihood that a particular threat leads to the failure of a component, we consider a set of cataloged threats (or families of threats with common attributes), say T1, T2, T3, … Th, and we consider the events V1, V2, V3, … Vh, Vh+1, where Vi, for 1 ≤ i ≤ h, stands for: Threat i has materialized, and Vh+1 stands for: No threat i has materialized. Because events Vi, for 1≤i≤h+1, are complementary (if we assume that no more than one threat materializes at a time), we can write:
∑+
=
×=1
1
).|()()(h
jjiji VEVE πππ
This equation links the probability of threat Tj (which is π(Vj)) to the probability of component failure for component Ci (which is π(Ei)). To apply this formula, we need to derive the conditional probabilities, which we propose to represent in a two dimensional matrix, that we call the Impact matrix in Table 5.
This Impact matrix is filled by component analysts and security experts, by assessing the impact that each
type of threat may have on the operation of the component. Automated (e.g., in the airline example or in the case of cyber security the Common Vulnerability Scoring System [CVSS]) or manual (e.g., Subject Matter Experts [SMEs]) mechanisms will be utilized, as the quantification of the asset is critical for the methodology as depicted in Table 6. 2.4. Generation of Mitigation Costs Matrix -
Our quantitative model CSES encompasses not only failure costs, but also mitigation costs – specifically verification costs. Each requirement fulfilled or service delivered by the system depends on the correct operation of one or more system components. This dependency can be quantified by the statistical correlation between the failure of the
Table 5. Impact (IM) Matrix: Links threat relationship groupings
Threats T1 T2 T3 … Th
Com
pone
nts
C1 C2 C3
… )|( ji VEπ
Ck
Table 6. Impact (IM) Matrix: Links components to threats
Threats Components
Insider Threats
Intrusions Denial of Service Threats
Authentication Threats
No Threat
Processing Component 0.2 0.4 0.8 0.8 0.0
Login Component 0.2 0.2 0.2 0.2 0.0
Secure Storage Component 0.2 0.4 0.2 0.2 0.0
User Profile Analysis 0.2 0.1 0.1 0.1 0.0

component and the failure to deliver the service or fulfill the requirement. If we combine this dependency with the cost of verifying each component of the system, we can maintain an estimate of the probabilities of service delivery (discussed above) as a function of the effort invested in enhancing the dependability of the individual components. Maintaining this information can serve two purposes: • First, to determine, at all times, which components
must be enhanced first to improve overall stakeholder satisfaction.
• Second, to charge verification costs according to stakeholder benefit. For any particular verification measure, we charge stakeholders according to the gains they have achieved as a result of this measure (which are quantified by the reduction of their mean failure cost).
Table 7 illustrates the dependency between verification costs per component and verification cost per service, and links to the table above, which illustrates the dependency between the probabilities of service delivery (resulting from enhanced verification) and mean failure costs.
The verification cost by service can be estimated by the following formula:
∑=
×=n
ij
jii VCDVS
1.
3. Estimating the Probability of Threats
If we review our discussions so far, we find many formulas of the form:
∑≤≤
≤≤×=mj
jjii niXAY
1
,1,
where Y is a vector of size n, X is a vector of size m,
and A is a n×m matrix. We write this formula compactly as:
.XAY =
Specifically, • The vector of mean failure costs (MFC, one entry
per stakeholder) is given by the following equation:
,PRSTMFC =
where ST is the Stakes matrix and PR is the vector of requirement failure probabilities (one entry per requirement),
• The vector of requirement failure probabilities is given by the following equation:
,PEDPPR =
where DP is the Dependency matrix and PE is the vector of component failure probabilities (one entry per component),
• The vector of components failure probabilities is given by the following equation:
,PVIMPE =
where IM is the Impact matrix and PV is the vector of threat emergence probabilities (one entry by type of threat).
By substitution, we find the equation that gives us vector of mean failure costs of all stakeholders as:
.PVIMDPSTMFC =
Utilizing a user interface, the Stakes matrix (ST) is filled by stakeholders according to the stakes they have in satisfying individual requirements; the Dependency matrix (DP) is filled in by the system architect (i.e.,
Table 7. Mitigation Costs (MC) Matrix: Links requirements and components mitigation costs
Components C1 C2 C3 C4 C5
Ser
vice
s
S1
Ver
ific
atio
n
Co
st b
y S
ervi
ce
VS1 S2 VS2 S3 VS3 S4 j
iD VS4
S5 VS5
Verification Cost by Component VC1 VC2 VC3 VC4 VC5

cyber security operations and system administrators) according to how each component contributes to meet each requirement; the Impact matrix (IM) is filled by analysts according to how each component is affected by each threat.
The remaining question is how to fill the vector PV that represents the probability of emergence of the various threats that are under consideration? This is done empirically, by simulating and/or operating the system for some length of time and estimating the number of threats that have emerged during that time and continue to be refined as the system evolves. From these numbers, we infer the probability of emergence of all the threats during one hour of operation. 4. Application of CSES
In this section, we provide a general set of guidelines for using the CSES. 4.1. Online Security Monitoring
In the MFC equation given above, the matrices ST, DP, and IM are static, and vector PV accounts for the analysts’ estimate of threat emergence in the absence of any specific situational information. When this tool is coupled with sensors that detect anomalies or security violations, then it can dynamically re-compute the mean failure costs of stakeholders provided we know how new situational information impacts the vector PV. As an extreme example, if a threat of type T1 has been confirmed, then vector PV is assigned the value (1, 0, 0, 0, 0 …) and the new values of MFC are recomputed, giving stakeholders an estimate of their current mean failure cost if the system continues to operate. In this way, stakeholders may place the systems in the cone (i.e., protection/operating envelope) and changing its position dynamically, to meet mission requirements and to certify operational capability as shown in Figure 2 [21, 22]. 4.2. Charging Verification & Mitigation Costs
Imagine that the custodian of the system wishes to submit a given component, say C1, to further verification and validation (V&V) or Information Assurance (IA) controls, and wishes to charge stakeholders for the V&V or modification of mitigation effort. As a matter of fairness, we wish to charge
stakeholders according to how much a better quality component impacts their bottom line. We argue that one way to do that is to estimate, for each stakeholder, the difference between the MFC under the current situation and the MFC after integration of mitigation technologies or V&V. How is this difference calculated? By considering how the modified IA controls or verification and validation of the component reduces the values of the failure probabilities in the row corresponding to that component in the impact matrix. 4.3. Integrating Quality Costs
From the standpoint of each stakeholder, the mean failure cost (which is the cost we expect to incur as a result of the lack of security) must be balanced against the cost of improving system security. Our mean failure cost model allows us to formulate the tradeoff of quality versus cost in terms of a return on investment equation. Specifically, a return on investment model is defined by the following parameters: • An initial investment cost, say IC, • An investment cycle (duration), say T, • An return over the investment cycle, say B(t), for 1
≤ t ≤ T, and • A discount rate, say d. Then the return on investment is given by the following formula:
.)1(
)(11∑
= +×+−=
T
ttdIC
tBROI
Performance
Confidentiality Availability Integrity
Goal: Placing a System in the Cone (operating envelope) and changing its position dynamically
to meet mission requirements (certify operational capability)
Functionality
Survivability
Figure 2. Representation of Interdependent Entities

The formula identified in section 2.4 can be used to compute IC. We can estimate the benefit gained by stakeholder S during time period t by computing the difference between the mean failure cost with the current component and the mean failure cost (hopefully lower) with the validated component. 5. Summary
The CSES follows a defined process. The initial inputs (1) organization mission (and components thereof), (2) value of its objectives and assets if uninterrupted, and (3) the components of the enterprise system that support each mission component, are determined by stakeholders.
The customer, with assistance from SMEs, defines the criteria of a quantitative value of an asset. For example, the criteria may include: • Financial basis (e.g., operational cost of downtime
per unit of time defined with hardware/software costs, HVAC, staffing, etc versus profit); which is the quantitative measurement to be used within the CSES.
• Federal Information Security Management Act (FISMA) of 2002, customer derived value of assets per NIST 800-60, and/or FIPS 199/200 (February 2004, Standards for Security Categorization of Federal Information and Information Systems) dictated requirements.
• Customer defined requirements; acceptable and unacceptable impact levels against the value related to IA tenets of confidentiality, availability and integrity may also be examined in further program contract options to supplement the prototype.
The CSES process proceeds in three steps (Generation of Stakes Matrix, Dependency Matrix, and Threat Matrix). CSES encompasses not only failure costs but also mitigation costs, specifically verification costs. CSES provides: • A framework for measuring the appropriate
attributes that support the decisions necessary to (1) design security countermeasures, (2) choose between alternative security architectures, (3) respond to events such as intrusions or attacks and (4) improve security (including reliability and safety) during both design and operational phases.
• A comprehensive basis for choosing courses of action that have the highest risk reduction return on investment, i.e., reduce the most risks for the lowest cost.
The basis of CSES stems from and is consistent with the spirit of Value Based Software Engineering. CSES comprehends the different organizational
mission needs for all stakeholders, including reliability and safety. CSES identifies information assurance controls and mitigation costs as an investment toward assuring mission success. 6. Future Work
Our future plans will draw from our experience to provide a good example of a system with credible and distinct stakeholders, a rich security requirements structure (i.e., set of), a non-trivial architecture with intertwined security components and functional (processing) components as well as a rich catalog of families of threats. 7. References [1] B. W. Boehm and L. Huang, "Value Based
Software Engineering: Reinventing Earned Value Monitoring and Control," ACM Software Engineering Notes, vol. 28(2), 2003.
[2] B. W. Boehm and L. G. Huang, "Value-Based Software Engineering: A Case Study," Computer, vol. 36, pp. 33-41, 2003.
[3] S. Biffl, A. Aurum, B. W. Boehm, H. Erdogmus, and P. Gruenbacher, "Value Based Software Engineering," Springer Verlag, 2006.
[4] K. J. Soo-Hoo, "How Much is Enough? A Risk Management Approach to Computer Security," in Consortium for Research on Information Security and Policy (CRISP): Stanford University, 2000.
[5] A. Mili and F. T. Sheldon, "Measuring Reliability as a Mean Failure Cost," in Proceedings of the 10th IEEE High Assurance Systems Engineering Symposium Dallas, TX: IEEE, 2007, pp. 403-404.
[6] A. Mili and F. T. Sheldon, "Challenging the Mean Time to Failure: Measuring Dependability as a Mean Failure Cost," in Proceedings of 42nd Hawaii International Conference on System Sciences. vol. 42 Waikoloa, HI: IEEE, 2009.
[7] A. Mili, A. Vinokurov, L. L. Jilani, F. T. Sheldon, A. Thomasian, and R. B. Ayed, "Modeling Security as a Dependability Attribute: A Refinement Based Approach," Innovations in Systems and Software Engineering, A NASA Journal, vol. 2(1), pp. 39-48, 2006.
[8] R. K. Abercrombie, F. T. Sheldon, and A. Mili, "System and Method for Implementing and Monitoring a Cyberspace Security Econometrics System and Other Complex Systems," in US Patent Office US Patent Pending, 2008, pp. 1-95.
[9] F. T. Sheldon, R. K. Abercrombie, and A. Mili, "Evaluating Security Controls Based on Key Performance Indicators and Stakeholder Mission," in Proceedings of the 4th Annual Cyber Security and Information Intelligence Research Workshop Oak Ridge, TN: ACM, 2008.

[10] R. R. Brooks, S. Sander, J. Deng, and J. Taiber, "Automotive System Security: Challenges and State-of-the-Art," in Proceedings of the 4th Annual Cyber Security and Information Intelligence Research Workshop, Oak Ridge, TN, 2008.
[11] R. R. Brooks, Disruptive Security Technologies with Mobile Code and Peer-to-Peer Networks. Boca Raton, FL: CRC Press, 2005.
[12] U. E. Larson and D. K. Nilsson, "Securing Vehicles against Cyber Attacks," in Proceedings of the 4th Annual Cyber Security and Information Intelligence Research Workshop Oak Ridge, TN: ACM, 2008.
[13] K. Lemke, C. Paar, and M. Wolf, "Embedded Security in Cars, Securing Current and Future Automotive IT Applications," Berlin: Springer-Verag, 2006.
[14] J. M. Abeles, "NIST Program Review for Information Security Management Assistance (PRIMSA) Enhancement," in Proceedings of the 4th Annual Cyber Security and Information Intelligence Research Workshop Oak Ridge, TN: ACM, 2008.
[15] M. R. Grimaila, R. F. Mills, and L. W. Fortson, "Improving the Cyber Incident Mission Impact Assessment (CIMIA) Process," in Proceedings of the 4th Annual Cyber Security and Information Intelligence Research Workshop Oak Ridge, TN: ACM, 2008.
[16] C. Lala and B. Panda, "Evaluating Damage from Cyber Attacks," IEEE Transactions on Systems, Man and Cybernetics, vol. 31(4), pp. 300-310, 2000.
[17] E. Al-Shaer, L. Khan, and M. S. Ahmed, "A Comprehensive Objective Network Security Metric Framework for Proactive Security Configuration," in Proceedings of the 4th Annual Cyber Security and Information Intelligence Research Workshop Oak Ridge, TN: ACM, 2008.
[18] B. W. Boehm and T. DeMarco, "Software Risk Management," IEEE Software, vol. 14(3), pp. 17-19, 1997.
[19] B. W. Boehm, "Software Risk Management: Principles and Practices," IEEE Software, vol. 8, pp. 31-41, 1991.
[20] S. Myagmar, A. J. Lee, and W. Yurcik, "Threat Modeling as a Basis for Security Requirements," in Symposium on Requirements Engineering for Information Security (SREIS) in conjunction with 13th IEEE International Requirements Engineering Conference (RE) Paris, France: IEEE, 2005.
[21] W. H. Sanders, "Probabilistic Validation of Computer System Survivability," in Oak Ridge National Laboratory's Computational Sciences and Engineering Division Distinguished Lecture Series Oak Ridge, TN: Oak Ridge National Laboratory, 2005.
[22] F. Stevens, T. Courtney, S. Singh, A. Agbaria, J. F. Meyer, W. H. Sanders, and P. Pal, "Model Based Validation of an Intrusion Tolerant Information System," in 23rd IEEE International Symposium
on Reliable Distributed Systems (SRDS'04), 2004, pp. 184-194.