Embed Size (px)
Citation preview

Wu, Jin, Horowitz
1
Methodologies for Estimating Metered On-ramp Vehicle Queue Length
Corresponding Author: Jingcheng Wu, P.E., PTOE Principal Engineer TransCore ITS, LLC. 253 West 35th Street, 3rd Floor New York, NY 10001 Voice: (212) 629-8380 x235 Fax: (212) 629-6369 E-mail: [email protected] Xia Jin, Ph.D. Cambridge Systematics, Inc. 199 Water Street, 22nd Floor New York, NY 10038 Voice: (212) 383-7227 Fax: (212) 383-2418 E-Mail: [email protected] Alan J. Horowitz Professor of Civil Engineering University of Wisconsin – Milwaukee PO Box 784 Milwaukee, WI 53201-0784 Voice: (414) 229-6685 Fax: (414) 229-6958 E-mail: [email protected] Submission Date: 11/15/2007 Note: Abstract + Text + Reference = 4335 words Figures + Tables = 2250 words
TRB 2008 Annual Meeting CD-ROM Paper revised from original submittal.

Wu, Jin, Horowitz
2
ABSTRACT The ability to monitor metered on-ramp vehicle queue length accurately can improve ramp meter performance and help to create improved ramp metering algorithms. Queue length distribution can be considered as a continuous analog signal, which consists of both deterministic and stochastic components. Three types of methods for the estimation of on-ramp queue length are discussed. They are Kalman filter, linear occupancy and Highway Capacity Manual (HCM) back of queue. Estimated queue data using these methods are compared with field observed queue data and random number sample. The comparisons indicate that Kalman filter and linear occupancy are usable for the real world operations, but both of them have limitations. HCM back of queue does not produce reliable estimates for on-ramp queue length.
TRB 2008 Annual Meeting CD-ROM Paper revised from original submittal.

Wu, Jin, Horowitz
3
INTRODUCTION Ramp metering has been proved as an effective tool for managing freeway congestion. A critical component of ramp meter effectiveness relates to its ability to prevent metered on-ramp vehicles from spilling back to arterial streets. Vehicles waiting to enter metered on-ramps may form queues on arterial streets, which can have significant negative impacts on arterial traffic, especially increase the chances for rear-end collisions. In addition, long on-ramp vehicle queues are always accompanied with long delays, which has frequently been used as a reason against ramp metering. The ability to monitor metered on-ramp vehicle queue length accurately in real time and adjust metering rate correspondingly will improve ramp meter performance at the system level and help to create new ramp metering algorithms, such as minimum on-ramp queue or minimum on-ramp delay operations.
Although ramp metering algorithms with queue override modules have been deployed extensively throughout the world, carefully controlled simulation and empirical studies of methodologies for estimating metered on-ramp vehicle queue length are very rare. Most queue override algorithms need various preset thresholds related to the queue length, such as occupancy and speed. When real time operational parameters exceed these preset thresholds, a spillback will be predicted and the ramp metering rate will be adjusted to allow more vehicles to enter the freeway. Because there are virtually no methods available to accurately estimate on-ramp vehicle queue length in the real world operations, queue override thresholds are often set by using experiential numbers. The inability to respond to real queue length sometimes prevents the queue override function from activating even if a severe spillback has happened, or some other times vehicles are flushed onto freeways when there is a small on-ramp vehicle queue.
One model (1) was developed to analyze diamond interchanges operations with the consideration of on-ramp queues resulting from ramp metering. It was found that on-ramp queue spillback would directly reduce capacity and increase delay for the diamond interchange traffic, though no queue length estimation methodologies were provided in the study. A diamond interchange with sufficient capacity would become oversaturated due to queue spillback and intersection blockage. Smaragdis and Papageorgiou (2) proposed a number of modifications and extensions to ALINEA, which is a local ramp metering algorithm. X-ALINEA/Q was one of the improved algorithms and included an on-ramp queue regulator. X-ALINEA/Q intends to improve the utilization of the on-ramp vehicle storage space, and reduce the queue override oscillatory operation behavior and disturbance to surface street traffic. However, X-ALINEA/Q depends on either an estimation algorithm of the queue length or a device capable of directly measuring the queue length, such as a video detector.
Sun and Horowitz (3) designed an on-ramp vehicle queue length regulator to prevent queue spillback to surface streets from ramp meters. To provide input to the queue length regulator, a queue length estimator was designed, which was based on kinematical theories and used the queue loop detector speed data to estimate the on-ramp vehicle queue length. Because a majority of current on-ramp queue detectors are single inductive loop detectors, it is almost impossible to directly measure speeds of vehicles waiting in the queue. Generally, single loop detector speed data is estimated based on fundamental traffic flow theories, which involve variables like loop length, average vehicle length, occupancy, and traffic volume. Gordon (4) studied an on-ramp queue spillback control algorithm through a simple simulation. This algorithm used a first-order linear filter to compute the queue detector’s future occupancy with a
TRB 2008 Annual Meeting CD-ROM Paper revised from original submittal.
Wu, Jin, Horowitz
4
time interval of 10 seconds. It was found that the performance of ramp meters was improved when the vehicle arrival rate was greater than the metering rate and the queue had backed up beyond the queue detector. This algorithm provided a more robust control with a 10-second computation interval than that with a 60-second interval. Gordon recommended that a distance of 60 feet from the position of the queue detector to the surface street would result in good performance when vehicle arrival was not controlled by an upstream traffic signal or 116 feet when there was an upstream signal. A linear filter applies a linear operator to a time-varying input signal and is often used to eliminate unwanted frequencies from an input signal or to select a wanted frequency amongst many others. Originated from linear filter theories, Gordon’s algorithm could only reduce the maximum oscillation amplitude of the on-ramp vehicle queue length instead of predicting the actual queue length.
Vigos et al. (5) developed an improved algorithm to estimate the number of on-ramp queued vehicles by employing a Kalman Filter and using data from queue loop detectors. Time occupancy data collected by loop detectors is translated into space occupancy data, which is directly related to the number of on-ramp vehicles. The following two formulas are simplified versions of a set of formulas developed by them.
)()( 111 −−− −+−+= nnoutinnn QqKVVTQQ (1)
where
nQ = predicted number of on-ramp queued vehicles in the next time period (veh),
1−nQ = number of on-ramp queued vehicles in the current time period (veh), T = time interval for number of queued vehicles calculation (second),
inV = flow rate entering the on-ramp (veh/h),
outV = flow rate exiting the on-ramp (veh/h), K = 0.22 recommended for one detector and 0.5 recommended for all other detector
numbers, generally, 10 ≤≤ K , and 1−nq = number of on-ramp queued vehicles calculated from detector occupancy data
(veh).
11 −− ×+×
= nn ODlnLq (2)
where
1−nq = number of on-ramp queued vehicles calculated from detector occupancy data (veh),
L = length of the on-ramp (ft), n = number of lanes, l = average physical vehicle length (ft), D = safety distance between vehicles (ft), and
1−nO = occupancy data collected by loop detectors.
TRB 2008 Annual Meeting CD-ROM Paper revised from original submittal.

Wu, Jin, Horowitz
5
The literature reveals that there are two major methodologies available to estimate the length of the metered on-ramp vehicle queue: signal processing theories and traffic flow theories. This paper attempts to estimate the queue length with these two methodologies and make comparisons between the estimation results and the actual queue data collected from the field. A simple linear method is also included in the discussion, which translates the loop detector time occupancy data to the on-ramp vehicle space occupancy data.
ON-RAMP QUEUE LENGTH ESTIMATING METHODOLOGIES
Signal Processing Theories Signal processing is concerned with the representation, measurement, estimation, and validation of patterns and structures in a signal process. On-ramp queue length distribution along the time axis can be considered as a signal process, which consists of both deterministic components and stochastic components. Deterministic signals can be described by a mathematical expression, rule, or table. As a result, future values of any deterministic signal can be calculated from past values. Unlike deterministic signals, stochastic signals, or random signals, can only be analyzed through probability and statistics, and their future values cannot be predicted because knowledge about them is incomplete. Because of their randomness, average values from a collection of signals are usually studied rather than analyzing one individual signal (6).
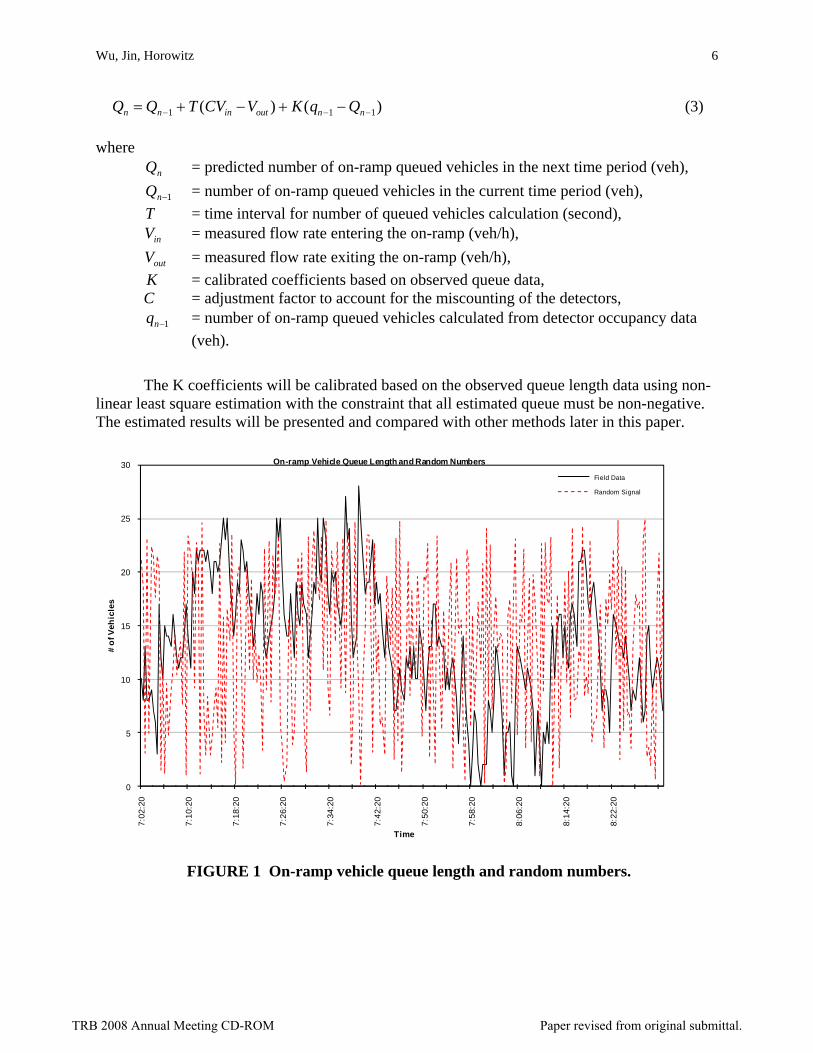
FIGURE 1 shows a sample of metered on-ramp queue data from the field for the morning peak period. In comparison, there is a set of random numbers with uniform distribution between 0 and the maximum queue length. The queue length distribution reveals random variation at some level since the vehicle queuing behavior is affected by various random factors. However, the queue length data shows a certain trend that cannot be appropriately represented by random numbers. The randomness in the queue length signal determines that the on-ramp queue length can only be predicted to a certain extent and when this randomness dominates, the prediction is not able to reflect the real field ramp metering operations.
In signal processing, a filter is applied to remove unwanted parts of the signal, such as random noise, or to extract wanted parts of the signal, such as the components lying within a certain frequency range. The Kalman filter implements a predictor-corrector type estimator that is optimal in the sense that it minimizes the estimated error covariance, when some presumed conditions are met. The Kalman filter consists of two sets of equations, time update equations and measurement update equations. The time update equations are responsible for projecting forward the current state and error covariance estimates to obtain the estimate for the next time step. The measurement update equations are responsible for the feedback, incorporating a new measurement into the estimate to obtain an improved estimate. Formulas 1 and 2 developed by Vigos et al. (5) employ a Kalman Filter and use inputs from queue loop detectors to estimate on-ramp queue length.
Field collected loop detector data including volume and occupancy data, and ramp geometry will be fed into these two formulas to estimate the queue length. An adjustment constant is also introduced to balance the volume in and volume out, in order to account for the miscounting effects of the loop detectors. The formula used in this study is shown in Formula 3 as a modification to Formula 1.
TRB 2008 Annual Meeting CD-ROM Paper revised from original submittal.
Wu, Jin, Horowitz
6
)()( 111 −−− −+−+= nnoutinnn QqKVCVTQQ (3)
where nQ = predicted number of on-ramp queued vehicles in the next time period (veh),
1−nQ = number of on-ramp queued vehicles in the current time period (veh), T = time interval for number of queued vehicles calculation (second),
inV = measured flow rate entering the on-ramp (veh/h),
outV = measured flow rate exiting the on-ramp (veh/h), K = calibrated coefficients based on observed queue data, C = adjustment factor to account for the miscounting of the detectors,
1−nq = number of on-ramp queued vehicles calculated from detector occupancy data (veh).
The K coefficients will be calibrated based on the observed queue length data using non-linear least square estimation with the constraint that all estimated queue must be non-negative. The estimated results will be presented and compared with other methods later in this paper.
0
5
10
15
20
25
30
7:02
:20
7:10
:20
7:18
:20
7:26
:20
7:34
:20
7:42
:20
7:50
:20
7:58
:20
8:06
:20
8:14
:20
8:22
:20
# of
Veh
icle
s
Time
On-ramp Vehicle Queue Length and Random Numbers
Field Data
Random Signal
FIGURE 1 On-ramp vehicle queue length and random numbers.
TRB 2008 Annual Meeting CD-ROM Paper revised from original submittal.

Wu, Jin, Horowitz
7
Traffic Flow Theories The on-ramp queue length can also be estimated using the queue loop detector speed data based on kinematical theories. Because the field data in this paper was collected from single inductive loop detectors, there is no speed data directly collected from the field. The speed has to be estimated based on fundamental traffic flow theories, which involve variables like loop length, average vehicle length, occupancy, and traffic volume. This process will introduce more randomness to the on-ramp queue signal. Furthermore, the vehicle speed is unpredictable and immeasurable by queue loop detectors, when the vehicle queue has reached or gone beyond the queue loop location, which is the situation when data for this paper was collected.
Highway Capacity Manual (HCM) 2000 Chapter 16 Appendix G provides a procedure to calculate the back of queue at signalized intersections. The back of queue is the number of vehicles that are queued depending on arrival patterns of vehicles and vehicles that do not clear the intersection during a given green phase (7). Theoretically, ramp meters can be considered as two-phase intersection signals. Therefore, the HCM back of queue method can be used to estimate the on-ramp vehicle queue length. Field collected loop detector data (number of vehicles enter the ramp), and ramp geometry and ramp meter timing will be fed into the HCM back of queue formulas. The estimated results will be compared with the field observed queue data later in this paper.
Simplified Linear Methods Because of the inevitable miscounting behavior of loop detectors, more variables involved in the queue length estimation process will introduce more uncertain factors and result in more unreliable predictions. When it is proven that one or two types of loop detector data collected are relatively accurate, a simple linear method can be deployed to estimate the on-ramp queue length. In this study, a simplified equation is developed to interpret the linear relationship between the number of queued vehicles and the time occupancy data directly collected by loop detectors.
Occupancy data collected by loop detectors is time occupancy data and represents the percentage of time that loop detectors are occupied by vehicles. With the assumption that queue loop detectors are only occupied by vehicles when the ramp meter signal is red, the following formula shows that the maximum time occupancy is the effective red time percentage.
CgOt −= 1(max) (4)
where (max)tO = maximum time occupancy data,
g = effective green time (s), and C = cycle length (s).
Space occupancy data is directly related to the number of on-ramp vehicles, which
indicates how much on-ramp storage space has been occupied by vehicles. The following formula shows the maximum space occupancy, when all on-ramp storage space has been utilized.
TRB 2008 Annual Meeting CD-ROM Paper revised from original submittal.

Wu, Jin, Horowitz
8
DllOs +
=(max) (5)
where (max)sO = maximum space occupancy data,
l = average physical vehicle length (ft), and D = safety distance between vehicles (ft).
Assuming there is a linear connection between the time occupancy and the space
occupancy, the relationship can be expressed as Formula 6.
baOO ntns += −− )1()1( (6) where
)1( −nsO = space occupancy data,
)1( −ntO = time occupancy data collected by loop detectors, and a and b = coefficients.
With the assumptions that both time and space occupancy data will be zero when there is
no vehicle on the on-ramp, and the maximum time and space occupancies happen at the same time, a and b can be resolved as Formula 7.
cgDl
l
a−
+=1
b = 0 (7)
Formula 8 shows that the on-ramp vehicle queue length equals to the space occupied divided by average physical vehicle length plus safety distance between vehicles.
DlLkOQ nsn +
= − )1( (8)
Where nQ = predicted number of on-ramp queued vehicles in the next time period (veh),
)1( −nsO = space occupancy data in the current time period, L = length of the on-ramp (ft), k = coefficient.
Replacing the space occupancy in Formula 8 with the time occupancy as shown in Formula 6 and 7, the number of queued vehicles can be directly derived as
)1(2 )1()(
−
−+
×= ntn O
CgDl
LlkQ (9)
Field collected loop detector time occupancy data and ramp geometry will be fed into Formula 9, and be calibrated against the field observed queue data. The estimated results will be presented and compared with other methods in the following section.
TRB 2008 Annual Meeting CD-ROM Paper revised from original submittal.

Wu, Jin, Horowitz
9
COMPARISON OF ESTIMATING METHODOLOGIES
Field Data
Data used in this paper were collected as a part of a large project that identified methods for evaluating the effectiveness of ramp meters on Wisconsin freeways (8). The purpose of this larger study was to determine the benefits of ramp meters in the Milwaukee area freeway system, to determine underlying relationships that permit evaluation of new ramp meters or ramp meter systems elsewhere, and to develop a coherent framework for performing evaluation of ramp meter effectiveness on a whole system. Data collected included floating car runs, queue length counts, tube counts, origin-destination studies, questionnaires and archiving of a variety of loop detector data (volumes, speeds and occupancies). Queue length data used in this paper were collected from two locations, US 45 southbound on-ramps at Capitol Drive and North Avenue. There was an observer physically presented at each location. The observer manually counted the total number of on-ramp queue vehicles and recorded the number on a data collection sheet every 20 seconds, throughout the 1.5 hour morning and afternoon peak periods. Volume and occupancy data used in this study were raw loop detector data recorded every 20 seconds.
Data for one morning peak period and one afternoon peak period at each location are used in this paper at this stage of study. As a result, there are four sets of completed field data used in the analysis. This paper is trying to present the concept and methodologies for on-ramp vehicle queue length estimation rather than establish statistical significant results for any method. Therefore, four sets of data can demonstrate a pattern, if there is any pattern existing.
Estimating Results FIGURE 2 to FIGURE 7 present graphical comparisons between the estimated results and the field observed queue length data.
FIGURE 2 Kalman Filter estimation and field queue data at Capitol Dr. for AM peak.
TRB 2008 Annual Meeting CD-ROM Paper revised from original submittal.

Wu, Jin, Horowitz
10
FIGURE 3 Linear Occupancy estimation and field queue data at Capitol Dr. for AM peak.
FIGURE 4 HCM back of queue estimation and field queue data at Capitol Dr. for AM
peak.
TRB 2008 Annual Meeting CD-ROM Paper revised from original submittal.

Wu, Jin, Horowitz
11
FIGURE 5 Kalman Filter estimation and field queue data at North Ave. for AM peak.
FIGURE 6 Linear Occupancy estimation and field queue data at North Ave. for AM peak.
TRB 2008 Annual Meeting CD-ROM Paper revised from original submittal.

Wu, Jin, Horowitz
12
FIGURE 7 HCM back of queue estimation and field queue data at North Ave. for AM
peak. Kalman filter estimated data shown in FIGURE 2 and FIGURE 5 is close to the field
observed queue data, which is reasonable enough to be used for the real world operations. Kalman filter estimation is able to predict the fluctuation, though it tends to smooth the oscillation. When on-ramp queues are reasonably long, the estimated queue length is closer to the field observed queue data. When on-ramp queues are short, less than five vehicles, the estimated queue length is off from the field observed queue data. It should be noted that the ramp meter queue override was activated around 7:30 AM in FIGURE 5. The On-ramp queue was flushed to zero and Kalman filter estimation performed very well during this process.
Capitol Drive on-ramp is about 440 feet long and is a slip ramp. North Avenue on-ramp is about 770 feet long and is a loop ramp. By cross-checking volume data between different loop detectors, it is found that Capital Drive on-ramp data seems to be more reliable than North Avenue on-ramp data. This explains the reason that Kalman filter estimated data is closer to the field observed queue data in FIGURE 2 than in FIGURE 5. In the next phase of this study, more locations and more time periods will be analyzed to understand the sensitivity of Kalman filter method to ramp volume data.
TABLE 1 lists the calibrated Kalman filter coefficients and the adjustment factors used for the calculation. These K values are not consistent with, but close to the findings suggested by Vigos et al (5). In their study, 0.22 is recommended for one detector and 0.5 is recommended for all other detector numbers. In this study, both Capitol Drive on-ramp and North Avenue on-ramp has one queue loop detector used for the calculation. Kalman filter coefficients for Capitol Drive on-ramp are around 0.14. Kalman filter coefficients for North Avenue on-ramp are very different between the morning and afternoon peak hours. The possible reason is that inV and outV
TRB 2008 Annual Meeting CD-ROM Paper revised from original submittal.

Wu, Jin, Horowitz
13
for Capitol Drive on-ramp are close to balanced. However, North Avenue on-ramp doesn’t have balanced inV and outV .
The results suggest that the Kalman filter coefficient would have different values for different locations or different values for different time periods at the same location. In order to be used for the real world operations, Kalman filter coefficient would need extensive calibration for each ramp metering location, and for both the morning and afternoon peak hours. Reliable loop detector data is also necessary. In future study, the sensitivity of Kalman filter method with respect to Kalman filter coefficient will be tested.
TABLE 1 Coefficients for Different Data Samples Data Sample Kalman Filter
Coefficient (K) Kalman Filter
Adjustment Factor (C) Linear Occupancy
Coefficient (k) Capitol Dr. AM 0.147 1.028 0.078 Capitol Dr. PM 0.130 0.793 0.084 North Ave. AM 0.009 0.557 0.043 North Ave. PM 0.183 1.331 0.042
FIGURE 3 and FIGURE 6 display estimated data from the simple linear occupancy method. The estimated queue length provides a decent prediction for most of the spikes, where the queue length has a much higher value than adjacent values. However, the estimation results introduce unrealistic amount of randomness, which causes more fluctuation than actual. This is a situation that should be avoided during ramp metering operations. Other than spikes, the simple linear occupancy method cannot provide reasonable predictions. This method requires little calibration and is able to predict critical queue length values (the spikes). When field observed queue data is difficult to collect and detector occupancy data is dependable, this method is better than experiential numbers. TABLE 1 lists the calibrated linear occupancy coefficients used in the calculation and the coefficients for the same location tend to be consistent.
Estimated queues by HCM back of queue method deviate substantially from the field data for most of the time. This method should not be used for on-ramp queue length estimation. Although ramp meters can be considered as special signals, they do have some unique characteristics that intersection signals don’t have.
TABLE 2 presents the Root Mean Squared Errors (RMSE) of the above three methods and the random number sample. The RMSE measures the average magnitude of the error. The RMSE is calculated as the square root of the sample average of the squared difference between the estimated and the observed values. The RMSE value ranges between 0 and positive infinite; the smaller the value is, the better the estimation is. It is worth mentioning that the errors are squared before they are averaged, which gives a relatively high weight to large errors. This means the RMSE is most useful when large errors are particularly undesirable, which is the case in queue length estimation. It is interesting to see that the uniform distribution random number sample does not always have the largest errors, which indicates that an inappropriate method would make worse prediction than random guess. TABLE 2 Root Mean Squared Errors
TRB 2008 Annual Meeting CD-ROM Paper revised from original submittal.

Wu, Jin, Horowitz
14
Data Sample Kalman Filter Linear Occupancy
HCM Back of Queue
Random Numbers
Capitol Dr. AM 4.334 9.836 13.144 9.320 Capitol Dr. PM 3.163 5.200 4.957 10.397 North Ave. AM 3.641 7.500 11.386 11.142 North Ave. PM 5.456 8.200 16.031 9.962
CONCLUSIONS Queue override is a very good supplement to ramp metering technology. Long on-ramp vehicle queues might be the most negative impact of ramp metering, which could result in negative impacts, such as excessive delay, more pollution, and driver frustration. Having control of on-ramp vehicle queues will mean having control over the most negative aspect of ramp metering. However, carefully controlled simulation and empirical studies of methodologies for estimating metered on-ramp vehicle queue length are very rare, so we do not yet have an existing reliable methodology to predict on-ramp vehicle queue length.
Three methods in estimating on-ramp queue length are discussed in this paper. They are Kalman filter, linear occupancy and HCM back of queue. The first two methods give reasonable estimates of queue length and are usable for the real world operations, but both of them have their own limitations. The HCM method is not able to produce estimates that are better than random guesses; thus, is not recommended for use in estimating on-ramp queue length. All three methods require extensive field data collection for calibration and verification. However, even with careful calibration, it is still possible that the prediction is not reliable. In the real world, driver behaviors have dominant effects on loop detector data. Any unusual reaction from drivers can have significant impacts on the detected data, and consequently on the on-ramp queue length prediction. In addition, the randomness in the queue length signal determines that the on-ramp queue length can only be predicted to a certain extent and when this randomness dominates, the prediction is not able to reflect the real field ramp metering operations.
The best way to obtain on-ramp vehicle queue length is to directly physically measure, using vehicle existence detection like video image detection equipment installed close to the end of on-ramps. Direct physical measurement will not be affected by any random factors and the collected data is accurate. At spillback sensitive locations, direct physical measurement should be the first alternative to consider. Detection technology deployment costs are getting lower and field queue data collection could be time and cost consuming, plus the estimation results might be unusable.
When direct measurement is not an option, the Kalman filter method can be used and field observed queue data should be collected for careful calibration and operator verification. However, the current Kalman filter methods available for ramp meters still need to be improved. More emphasis needs to be placed on volume detector data, which is considered more reliable than occupancy data in practice. With large vehicle speed variations, volume data is not affected, but occupancy data can change dramatically. When field observed queue data is difficult to collect and detector data is known dependable, a simple linear method can be implemented temporarily.
TRB 2008 Annual Meeting CD-ROM Paper revised from original submittal.

Wu, Jin, Horowitz
15
REFERENCES
1. Tian, Z., Messer, C. and Balke, K. Modeling Impact of Ramp Metering Queues on Diamond Interchange Operations. In Transportation Research Record: Journal of the Transportation Research Board, No. 1867, TRB, National Research Council, Washington, D.C., 2004, pp. 172-182.
2. Smaragdis, E. and Papageorgiou, M. Series of New Local Ramp Metering Strategies. In Transportation Research Record: Journal of the Transportation Research Board, No. 1856, TRB, National Research Council, Washington, D.C., 2004, pp. 74-86.
3. Sun, X. and Horowitz, R. A Set of New Traffic-Responsive Ramp-Metering Algorithms and Microscopic Simulation Results. In the 85th Annual Meeting of the Transportation Research Board. CD-ROM. TRB, National Research Council, Washington, D.C., January 2006.
4. Gordon, R. L. Algorithm for Controlling Spillback from Ramp Meters. In Transportation Research Record: Journal of the Transportation Research Board, No. 1554, TRB, National Research Council, Washington, D.C., 1996, pp. 162-171.
5. Vigos, G. Papageorgiou, M. and Yibing W. A Ramp Queue Length Estimation Algorithm. In 2006 IEEE Intelligent Transportation Systems Proceedings, Toronto, October 2006, pp. 418-425.
6. Vaseghi, S. V. Advanced Digital Signal Processing and Noise Reduction, Second Edition. John Wiley and Sons, Ltd., Chichester, England, 2000.
7. Highway Capacity Manual (HCM) 2000. Transportation Research Board, National Research Council, Washington, D.C., 2000, Chapter 16, Appendix G.
8. Evaluation of Ramp Meter Effectiveness for Wisconsin Freeways, A Milwaukee Case Study. Report No. 0092-45-17. http://www.dot.wisconsin.gov/library/research/docs/finalreports/45-17rampmeters.pdf. Accessed July 2007.
TRB 2008 Annual Meeting CD-ROM Paper revised from original submittal.