Embed Size (px)
Citation preview

Zentrales Prüfungsamt Für Sozial- und Geisteswissenschaften Promotionsausschuss Dr. rer. pol.
Postfach 330440, 28334 Bremen Bibliothekstraße, 28359 Bremen Tel: 0421/218-2177 – Fax: 218-7518 eMail: [email protected] Gebäude GW 2, Raum B 2325 Sachbearbeitung: Carmen Ohlsen Gesch.-Z.: 62-10
Fachbereich Wirtschaftswissenschaft
Methodological Options in International Market Segmentation
Dissertation zur Erlangung der Doktorwürde
durch den Promotionsausschuss Dr. rer. pol.
der Universität Bremen
Vorgelegt von Iryna Bastian
Bremen, den 1.11.2006 Erstgutachter: Prof. Dr. Erich Bauer
Zweitgutachter: Prof. Dr. Martin Missong
Contents
I
Contents List of Figures.......................................................................................................... V
List of Tables .........................................................................................................VII
List of Abbreviations ............................................................................................... X
1 Introduction ...................................................................................................... 1
1.1 Problematic Issues .................................................................................... 1
1.2 Research Objectives ................................................................................. 3
1.3 Thesis Structure ........................................................................................ 5
2 International Business and Market Segmentation ............................................ 8
2.1 Internationalization of Business – International Management –
International Marketing ........................................................................................ 8
2.2 Standardization and Differentiation in the Context of International
Marketing ........................................................................................................... 11
2.3 International Market Segmentation ........................................................ 18
2.3.1 Concept of Market Segmentation................................................... 18
2.3.1.1 Market Segmentation Analysis............................................... 21
2.3.1.2 Market Segmentation Strategy ............................................... 25
2.3.2 Segmenting International Markets.................................................. 27
2.3.2.1 Exclusively Country-Related Market Segmentation .............. 28
2.3.2.2 Country- and Consumer-Related Market Segmentation ........ 30
2.3.2.3 Exclusively Consumer-Related Market Segmentation........... 37
3 Steps and Methodologies of International Market Segmentation Analysis ... 39
3.1 Defining Relevant Market ...................................................................... 40
3.2 Deciding on Segmentation Approach and Methodology ....................... 40
3.3 Procuring Data........................................................................................ 41
3.4 Selecting Basis and Descriptor Variables............................................... 48
3.4.1 Choice of Basis Variables .............................................................. 48
3.4.1.1 Study Goals ............................................................................ 49
3.4.1.2 Quality of Basis Variables...................................................... 50
3.4.2 Choice of Descriptor Variables ...................................................... 53
3.5 Conducting Analysis .............................................................................. 54
3.5.1 Data Preparation ............................................................................. 54
3.5.1.1 Preliminary Data Standardization........................................... 54

Contents
II
3.5.1.2 Data Preprocessing Using Factor Analysis ............................ 55
3.5.1.2.1 Constructing Correlation Matrix......................................... 56
3.5.1.2.2 Extracting Factors ............................................................... 58
3.5.1.2.3 Rotating and Interpreting Factors ....................................... 65
3.5.1.2.4 Calculating Factor Values................................................... 67
3.5.2 Finding Cluster Solution................................................................. 68
3.5.2.1 Cluster Analysis...................................................................... 69
3.5.2.1.1 Proximity Measures ............................................................ 70
3.5.2.1.2 Grouping Methods .............................................................. 76
3.5.2.1.2.1 Ward’s Method ............................................................ 77
3.5.2.1.2.2 K-means Method ......................................................... 82
3.5.2.2 Self-Organizing Map .............................................................. 85
3.5.2.2.1 Biological Origin ................................................................ 86
3.5.2.2.2 Theoretical Model ............................................................... 89
3.5.2.2.3 Visualization of Results ...................................................... 99
3.5.2.2.4 Assessment of Topology-Preserving Map ........................ 102
3.5.3 Validation of Cluster Solution...................................................... 104
3.5.3.1 Assessment of Cluster Solution’s Stability Using Results of
Several Clustering Methods ..................................................................... 104
3.5.3.2 Assessment of Homogeneity within Clusters Using F-Values...
.............................................................................................. 104
3.5.3.3 Assessment of Heterogeneity between Clusters Using t-Values
.............................................................................................. 105
3.5.3.4 Assessment of Heterogeneity between Clusters and of Cluster
Solution Reliability Using Discriminant Analysis ................................... 106
3.5.3.4.1 Derivation of Discriminant Functions............................... 106
3.5.3.4.2 Testing Performance of Discriminant Functions .............. 110
3.5.4 Description and Interpretation of Cluster Solution ...................... 114
4 International Market Segmentation Study.................................................... 116
4.1 Study Purpose and Design.................................................................... 116
4.2 Defining Relevant Market .................................................................... 116
4.2.1 Essence of Study Initiator’s Business........................................... 117
4.2.1.1 Portrayal of Beiersdorf ......................................................... 117
4.2.1.2 Portrayal of Umbrella Brand NIVEA................................... 119

Contents
III
4.2.2 Skin and Body Care Product Categories ...................................... 120
4.2.3 Geographical and Temporal Market Boundaries ......................... 121
4.3 Deciding on Segmentation Approach and Methodology ..................... 123
4.4 Procuring Data...................................................................................... 123
4.4.1 Fieldwork Dates............................................................................ 124
4.4.2 Fieldwork Locations ..................................................................... 125
4.4.3 Fieldwork Methodology, Sample Definition, and Questionnaire
Contents ...................................................................................................... 127
4.5 Selecting Basis and Descriptor Variables............................................. 130
4.6 Conducting Analysis ............................................................................ 135
4.6.1 Additive Intranational Market Segmentation ............................... 135
4.6.1.1 Data Preparation Using Factor Analysis .............................. 135
4.6.1.2 Finding Cluster Solutions ..................................................... 138
4.6.1.2.1 Segmentation Approach Based on Ward’s Method.......... 138
4.6.1.2.2 Segmentation Approach Based on K-means Method ....... 140
4.6.1.2.3 Segmentation Approach Based on Self-Organizing Map. 142
4.6.1.3 Validation of Cluster Solutions ............................................ 145
4.6.1.4 Description and Interpretation of Cluster Solutions ............. 148
4.6.1.5 Finding Transnational Segments .......................................... 149
4.6.1.5.1 Identification of Common Features .................................. 149
4.6.1.5.2 Examples of Regional/Country-Specific Peculiarities...... 173
4.6.1.5.2.1 Differences in Demographic Characteristics, Brand
Assessments, and Behavioral Characteristics................................... 173
4.6.1.5.2.2 Differences in Character/Structure of Cluster Solution...
................................................................................... 174
4.6.1.6 Assessment of Segmentation Approaches............................ 176
4.6.1.6.1 Application Convenience.................................................. 176
4.6.1.6.2 Structure, Meaningfulness and Coherency of Cluster
Solution ........................................................................................... 177
4.6.1.6.3 Basis for International Market Segmentation Strategies .. 178
4.6.2 Integral Market Segmentation ...................................................... 180
4.6.2.1 Data Preparation ................................................................... 180
4.6.2.1.1 Defining Sample Size ....................................................... 180
4.6.2.1.2 Factor Analysis ................................................................. 184

Contents
IV
4.6.2.1.3 Data Unification................................................................ 186
4.6.2.2 Finding Cluster Solutions ..................................................... 187
4.6.2.2.1 Segmentation Approach Based on Ward’s Method.......... 187
4.6.2.2.2 Segmentation Approach Based on K-means Method ....... 188
4.6.2.2.3 Segmentation Approach Based on Self-Organizing Map. 189
4.6.2.3 Validation of Cluster Solutions ............................................ 192
4.6.2.4 Description and Interpretation of Cluster Solutions ............. 193
4.6.2.5 Results of Cluster Interpretation........................................... 194
4.6.2.6 Assessment of Segmentation Approaches............................ 198
4.6.2.6.1 Application Convenience.................................................. 198
4.6.2.6.2 Structure, Meaningfulness and Coherency of Cluster
Solution ........................................................................................... 198
4.6.2.6.3 Basis for International Market Segmentation Strategies .. 199
4.6.3 Contrasting Additive Intranational Market Segmentation and
Integral Market Segmentation ...................................................................... 200
4.6.3.1 Preparation of Data for Analysis .......................................... 200
4.6.3.2 Effort- and Time-Costs of Analysis ..................................... 202
4.6.3.3 Description and Interpretation of Segments ......................... 203
4.6.3.4 Conduction of International Market Segmentation Strategies ...
.............................................................................................. 203
5 Conclusions and Outlook ............................................................................. 205
5.1 Additive Intranational Market Segmentation vs. Integral Market
Segmentation: Conclusions .............................................................................. 205
5.2 Statistical-Mathematical Segmentation Methods: Conclusions ........... 206
5.3 Recommendations for Future Research................................................ 207
References ............................................................................................................ 208
Appendix A-1: Statement Compositions of Factors............................................. 221
Appendix A-2: Increases in Values of Error Sum of Squares (the Last Ten Fusion
Steps) .................................................................................................................... 232
Appendix A-3: Values of Within-Groups Sum of Squares Plotted against
Corresponding Quantities of Clusters .................................................................. 239
Appendix A-4: Cluster Names and Sizes ............................................................. 250

List of Figures
V
List of Figures
Figure 1-1 Structure of the thesis ............................................................................. 7
Figure 2-1 Schematic presentation of internal and external interaction partners of a
company operating internationally ................................................................... 9
Figure 2-2 Market segmentation analysis............................................................... 22
Figure 2-3 Market segmentation strategy............................................................... 27
Figure 2-4 Exclusively country-related market segmentation................................ 28
Figure 2-5 International market segmentation at the macro-level.......................... 31
Figure 2-6 International market segmentation at the micro-level .......................... 34
Figure 2-7 Exclusively consumer-related market segmentation ............................ 38
Figure 3-1 Choice dimensions considered while deciding on the segmentation
approach and methodology............................................................................. 41
Figure 3-2 Forms of written surveys ...................................................................... 44
Figure 3-3 Forms of verbal surveys........................................................................ 45
Figure 3-4 Forms of computer surveys .................................................................. 46
Figure 3-5 Matrix of factor loadings ...................................................................... 63
Figure 3-6 Illustration of a scree-test...................................................................... 64
Figure 3-7 Two-dimensional factor space .............................................................. 66
Figure 3-8 Similarity and distance matrices ........................................................... 70
Figure 3-9 Euclidean distance in a two-dimensional space.................................... 73
Figure 3-10 Profiles of individuals j and i.............................................................. 76
Figure 3-11 Example of a dendrogram (the Ward’s method) ................................ 80
Figure 3-12 Scree-diagram and elbow-criterion (the Ward’s method) .................. 81
Figure 3-13 Components of a biological nerve cell (neuron)................................. 87
Figure 3-14 Schematic illustration of an artificial neuron...................................... 88
Figure 3-15 “Mexican-hat function” of a lateral interaction .................................. 89
Figure 3-16 Feedforward and feedback ANN ........................................................ 90
Figure 3-17 Schematic illustration of SOM ........................................................... 91
Figure 3-18 Neighborhood function of a Gaussian form ....................................... 98
Figure 3-19 Example of the U-matrix .................................................................. 100
Figure 3-20 Example of the hit histogram of input vectors.................................. 101
Figure 3-21 Example of the component plane...................................................... 102
List of Figures
VI
Figure 3-22 Graphical representation of a discriminant function......................... 108
Figure 3-23 Classification matrix for a two-group case ....................................... 113
Figure 3-24 Profiles of cluster A and cluster B.................................................... 114
Figure 4-1 Establishment of the Beiersdorf company.......................................... 117
Figure 4-2 Core brands of the Beiersdorf company ............................................. 118
Figure 4-3 World of NIVEA ................................................................................ 120
Figure 4-4 Assessment scales ............................................................................... 131
Figure 4-5 Cluster regions (example of the U-matrix) ......................................... 145
Figure 4-6 Number of countries, where a transnational segment was found (the
Ward’s method) ............................................................................................ 169
Figure 4-7 Number of countries, where a transnational segment was found (the K-
means method).............................................................................................. 170
Figure 4-8 Number of countries, where a transnational segment was found (SOM)
...................................................................................................................... 171
Figure 4-9 Percentages of black and white females in a social class ................... 174
Figure 4-10 Percentages for a point on a rating scale........................................... 176
Figure 4-11 Values of the within-groups sum of squares plotted against
corresponding quantities of clusters ............................................................. 189
Figure 4-12 Cluster regions (the U-matrix).......................................................... 191
Figure 4-13 Preparation of data for analysis ........................................................ 201
Figure 4-14 Process of obtaining transnational samples ...................................... 202

List of Tables
VII
List of Tables
Table 2-1 Objects of standardization...................................................................... 11
Table 2-2 Interrelations between orientation systems of the EPRG-framework and
standardization/differentiation of marketing programs .................................. 15
Table 2-3 Cost saving and sales revenue rising potentials of
standardization/differentiation of a product ................................................... 17
Table 2-4 Classification of segmentation methods ................................................ 25
Table 2-5 Country characteristics as segmentation criteria classified.................... 29
Table 2-6 Country characteristics as segmentation criteria classified (an alternative
approach) ........................................................................................................ 30
Table 2-7 Consumer characteristics as segmentation criteria classified ................ 37
Table 3-1 Examples of secondary data sources...................................................... 42
Table 3-2 Correspondence between study goals and segmentation bases.............. 50
Table 3-3 Examples of proximity measures ........................................................... 71
Table 4-1 Investigated countries........................................................................... 122
Table 4-2 Fieldwork dates .................................................................................... 125
Table 4-3 Fieldwork locations.............................................................................. 126
Table 4-4 Fieldwork methodologies, age ranks and sizes of samples.................. 130
Table 4-5 Descriptor variables ............................................................................. 134
Table 4-6 Measures of sampling adequacy (MSA).............................................. 136
Table 4-7 Final factor solutions............................................................................ 138
Table 4-8 Clustering steps with a relatively significant increase in the error sum of
squares .......................................................................................................... 140
Table 4-9 Quantities of clusters, at which a sharp decrease in the within-groups
sum of squares was found............................................................................. 141
Table 4-10 SOM parameters ................................................................................ 144
Table 4-11 Quantities of completely homogeneous and highly homogeneous
clusters .......................................................................................................... 146
Table 4-12 Percentages of respondents classified by discriminant analysis correctly
...................................................................................................................... 147
Table 4-13 Structure of “Highly demanding” transnational segment .................. 149
Table 4-14 “Highly demanding” segments found ................................................ 151

List of Tables
VIII
Table 4-15 Structure of “Rational demanding” transnational segment................ 152
Table 4-16 “Rational demanding” segments found.............................................. 153
Table 4-17 Structure of “Rationalists” transnational segment ............................. 154
Table 4-18 “Rationalists” segments found ........................................................... 155
Table 4-19 Structure of “Good quality at a fair price” transnational segment ..... 156
Table 4-20 “Good quality at a fair price” segments found................................... 157
Table 4-21 Structure of “Quality and good value for money from a strong brand”
transnational segment ................................................................................... 158
Table 4-22 “Quality and good value for money from a strong brand” segments
found............................................................................................................. 159
Table 4-23 Structure of “Brand glamor driven mainstream” transnational segment
...................................................................................................................... 159
Table 4-24 “Brand glamor driven mainstream” segments found......................... 161
Table 4-25 Structure of “Only brand attractiveness driven (very little skin care
involved)” transnational segment ................................................................. 162
Table 4-26 “Only brand attractiveness driven (very little skin care involved)”
segments found............................................................................................. 163
Table 4-27 Structure of “Sensitivity and mildness driven” transnational segment
...................................................................................................................... 164
Table 4-28 “Sensitivity and mildness driven” segments found............................ 165
Table 4-29 Structure of “Moderate level of mildness from a popular and modern
brand” transnational segment ....................................................................... 166
Table 4-30 “Moderate level of mildness from a popular and modern brand”
segments found............................................................................................. 167
Table 4-31 Structure of “Uninvolved” transnational segment ............................. 167
Table 4-32 “Uninvolved” segments found ........................................................... 168
Table 4-33 Presence of transnational segments in twenty one countries ............. 172
Table 4-34 Cluster quantities................................................................................ 178
Table 4-35 Standardized product features ............................................................ 179
Table 4-36 Finding female population sizes ........................................................ 181
Table 4-37 Finding sizes of samples to be extracted............................................ 182
Table 4-38 Four-group system ............................................................................. 183
Table 4-39 Finding sizes of samples to be extracted according to the four-group
system ........................................................................................................... 184

List of Tables
IX
Table 4-40 Chosen factor solution ....................................................................... 185
Table 4-41 Increases in the error sum of squares (the last ten fusion steps) ........ 188
Table 4-42 Cluster names and sizes ..................................................................... 194
Table 4-43 Percentages of respondents from twenty one countries included into
each transnational segment........................................................................... 196
Table 4-44 Cluster sizes (percentages of a corresponding country sample) in the
case of each country ..................................................................................... 197
Table 4-45 Standardized product features (integral market segmentation).......... 200

List of Abbreviations
X
List of Abbreviations
AID Automatic Interaction Detection
ANN Artificial Neural Networks
CAPI Computer Assisted Personal Interview
CART Classification and Regression Trees
CATI Computer Assisted Telephone Interview
CATS Completely Automated Telephone Surveys
CSAQ Computerized Self-Administered Questionnaire
EPRG Ethnocentric/Polycentric/Regiocentric/Geocentric Orientation
System
EU European Union
FTW Fine-Tuning of Weights
GATT General Agreement on Tariffs and Trade
KMO Kaiser-Meyer-Olkin Criterion
NENET Neural Networks Tool
MSA Measure of Sampling Adequacy
PCA Principal Component Analysis
POW Proper Ordering of Weights
R&D Research and Development
SOM Self-Organizing Map
SPSS Superior Performing Software System
WTO World Trade Organization

Introduction
1
1 Introduction
1.1 Problematic Issues
“No one can be everything to everybody”1. This fact was realized already about fifty
years ago, as existence of diversity in consumer needs was acknowledged by
manufacturers, and the necessity to develop market-oriented thought within
companies became clear and acute. As a result, breaking down markets into internally
homogeneous and externally heterogeneous sub-markets and tailoring marketing
programs to their specific needs have started to be pursued by an ever bigger number
of firms. In this way, the era of market segmentation has begun.2
The last decades were marked with an increasing involvement of multi-product
manufacturers into cross-border business activities.3 Dealing with heterogeneous
needs of consumers in different countries is one of the biggest challenges in the
modern business. Correspondingly, special importance is being attached to
international market segmentation.4
The so-called classical approach to conducting international market segmentation lies
in dividing markets and satisfying needs of obtained sub-markets on a country-to-
country basis, i.e., without any strategic coordination between different countries. In
this case, applying domestic market segmentation techniques is more than sufficient.5
The relevance of this approach to international market segmentation decreases
nowadays, due to the factors that not only encourage conducting international business
activities, but also point at decreasing importance of country borders in organizing
these activities and therewith at the necessity in and advantages of their
standardization. Among these factors are:6 national markets becoming more saturated
together with international competitors becoming more numerous and price
aggressive; shorter product life cycles combined with higher research and
development costs; global economic and political conditions becoming more 1 Thorelli, 1980, p. 133. 2 See Smith, 1956, pp. 3-8, Engel/Fiorillo/Cayley, 1972, pp. 22-23, and Struhl, 1992, pp. 5-6. 3 See Meffert/Althans, 1982, p. 15 and Wedel/Kamakura, 2000, p. 4. 4 See Steenkamp/Ter Hofstede, 2002, p. 185. 5 See Kreutzer, 1991, pp. 4-5 and Steenkamp/Ter Hofstede, 2002, pp. 185-186. 6 For more detailed information see part 2.1 of the present thesis.

Introduction
2
favorable to international business; improved communication and transportation
technologies enabling faster and less expensive exchange of information, products,
services, and capital; and convergence of demand behavior and attitudes of consumers
from different countries. Correspondingly, an alternative approach to international
market segmentation, the one aimed at finding the so-called transnational segments
and developing standardized marketing programs to direct to them, gains on
popularity.
A transnational segment is a segment that, despite its affiliation in several countries,
can be characterized through a set of features common to all its parts in these
countries and addressed in a standardized way through one marketing program.7
There are several alternative ways of finding transnational segments. International
market segmentation can be related to countries and lead to identification of
transnational segments in the form of country groups. Moreover, this type of
segmentation can be complemented or substituted by international market
segmentation related to consumers and result in transnational segments presented
through combinations of segments in different countries.
Current empirical evidence shows that demand behavior and attitudes of consumers
transcend across national borders, and there are often more similarities between
consumer groups in different countries than between consumers in one and the same
country.8 This fact definitely speaks in favor of the latter type of transnational
segments and points at such clear shortcomings9 of international market segmentation
related only to countries as disregarding country-specific heterogeneity of consumers
and excluding the possibility to find transnational segments in countries belonging to
different country groups.
However, not all problematic issues with regard to finding transnational segments are
clarified therewith. International market segmentation related to consumers
(conducted either in combination with country-related market segmentation or
exclusively) can have a form of either additive intranational market segmentation
or integral market segmentation. In the case of additive intranational market
7 See Kreutzer, 1991, p. 5, Steffenhagen, 1992, p. 27, and Stegmüller, 1995, p. 77. 8 See Ter Hofstede/Steenkamp/Wedel, 1999, pp. 1-2 and Steenkamp/Ter Hofstede, 2002, p. 186. 9 See Bauer, 2000, p. 2807.

Introduction
3
segmentation, intranational segmentations are conducted first. Then, segments having
common features, but belonging to different countries are combined into transnational
segments. In the case of integral market segmentation, transnational segments are
identified on the base of segmenting all countries jointly.10
There is no clear and commonly accepted position among both academicians and
practitioners with regard to the role, which these two methodologies are supposed to
play in the area of modern international market segmentation. On the one hand, it is
stated that, in view of the increasing country equalization taking place nowadays, the
role of integral market segmentation becomes more and more significant.11 On the
other hand, integral market segmentation is strongly criticized because of its following
weaknesses, which are expected to be overcome by additive intranational market
segmentation:12
- providing with information neither on regional/national segments, which may
exist and be addressed with regional/national marketing programs, nor on
national specifics of media usage and point of purchase choice behavior of
members of transnational segments;
- estimating national sizes of transnational segments in a biased way.
Moreover, there is a limitless number of statistical-mathematical segmentation
methods, which can be used for finding transnational segments. The question
concerning their effectiveness still remains open.
The present thesis seeks to contribute to clarification of the problematic issues
mentioned above.
1.2 Research Objectives
Despite increasing importance of international market segmentation for marketing as a
discipline (in particular, for international marketing), the level of attention given to it
in the literature remains relatively low. Of course, some publications devoted to
international market segmentation have been appearing during the last three
10 See Bauer, 2000, p. 2808. 11 See Hünerberg, 1994, p. 109. 12 See Kale/Sudharshan, 1987, p. 63 and Bauer, 2000, p. 2808.
Introduction
4
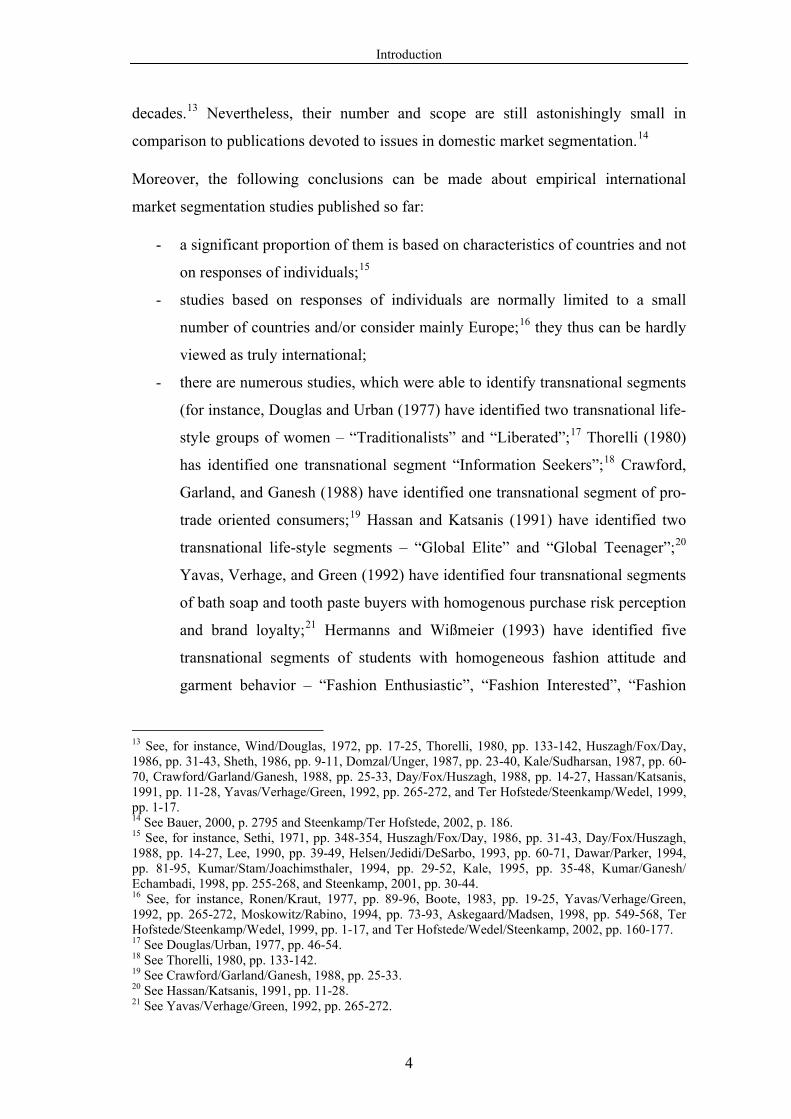
decades.13 Nevertheless, their number and scope are still astonishingly small in
comparison to publications devoted to issues in domestic market segmentation.14
Moreover, the following conclusions can be made about empirical international
market segmentation studies published so far:
- a significant proportion of them is based on characteristics of countries and not
on responses of individuals;15
- studies based on responses of individuals are normally limited to a small
number of countries and/or consider mainly Europe;16 they thus can be hardly
viewed as truly international;
- there are numerous studies, which were able to identify transnational segments
(for instance, Douglas and Urban (1977) have identified two transnational life-
style groups of women – “Traditionalists” and “Liberated”;17 Thorelli (1980)
has identified one transnational segment “Information Seekers”;18 Crawford,
Garland, and Ganesh (1988) have identified one transnational segment of pro-
trade oriented consumers;19 Hassan and Katsanis (1991) have identified two
transnational life-style segments – “Global Elite” and “Global Teenager”;20
Yavas, Verhage, and Green (1992) have identified four transnational segments
of bath soap and tooth paste buyers with homogenous purchase risk perception
and brand loyalty;21 Hermanns and Wißmeier (1993) have identified five
transnational segments of students with homogeneous fashion attitude and
garment behavior – “Fashion Enthusiastic”, “Fashion Interested”, “Fashion
13 See, for instance, Wind/Douglas, 1972, pp. 17-25, Thorelli, 1980, pp. 133-142, Huszagh/Fox/Day, 1986, pp. 31-43, Sheth, 1986, pp. 9-11, Domzal/Unger, 1987, pp. 23-40, Kale/Sudharsan, 1987, pp. 60-70, Crawford/Garland/Ganesh, 1988, pp. 25-33, Day/Fox/Huszagh, 1988, pp. 14-27, Hassan/Katsanis, 1991, pp. 11-28, Yavas/Verhage/Green, 1992, pp. 265-272, and Ter Hofstede/Steenkamp/Wedel, 1999, pp. 1-17. 14 See Bauer, 2000, p. 2795 and Steenkamp/Ter Hofstede, 2002, p. 186. 15 See, for instance, Sethi, 1971, pp. 348-354, Huszagh/Fox/Day, 1986, pp. 31-43, Day/Fox/Huszagh, 1988, pp. 14-27, Lee, 1990, pp. 39-49, Helsen/Jedidi/DeSarbo, 1993, pp. 60-71, Dawar/Parker, 1994, pp. 81-95, Kumar/Stam/Joachimsthaler, 1994, pp. 29-52, Kale, 1995, pp. 35-48, Kumar/Ganesh/ Echambadi, 1998, pp. 255-268, and Steenkamp, 2001, pp. 30-44. 16 See, for instance, Ronen/Kraut, 1977, pp. 89-96, Boote, 1983, pp. 19-25, Yavas/Verhage/Green, 1992, pp. 265-272, Moskowitz/Rabino, 1994, pp. 73-93, Askegaard/Madsen, 1998, pp. 549-568, Ter Hofstede/Steenkamp/Wedel, 1999, pp. 1-17, and Ter Hofstede/Wedel/Steenkamp, 2002, pp. 160-177. 17 See Douglas/Urban, 1977, pp. 46-54. 18 See Thorelli, 1980, pp. 133-142. 19 See Crawford/Garland/Ganesh, 1988, pp. 25-33. 20 See Hassan/Katsanis, 1991, pp. 11-28. 21 See Yavas/Verhage/Green, 1992, pp. 265-272.

Introduction
5
Ignorant”, “Fashion Discerning”, and “Fashion Rejecters”;22 Stegmüller
(1995) has identified three transnational segments of airline passengers with
homogeneous needs – “Demanding”, “Mainstream”, and “Spartans”;23 Ter
Hofstede, Steenkamp, and Wedel (1999) have identified four transnational
segments in the European yogurt market24); nevertheless, neither of them is
devoted to comparison of additive intranational market segmentation and
integral market segmentation or testing effectiveness of alternative statistical-
mathematical segmentation methods.
The doctoral research presented in this thesis contributes to overcoming the deficits
mentioned above. Firstly, it is based on responses of individuals. Secondly, these
individuals come from twenty one countries presenting five regions of the world
(Africa, Asia, Australia, Europe, and South America). Thirdly, two different forms of
international market segmentation (additive intranational market segmentation and
integral market segmentation) as well as three different statistical-mathematical
segmentation methods (the Ward’s method, K-means method, and SOM) are tested
and compared with each other.
In particular, the doctoral research has the following objectives:
• to investigate advantages and limitations of conducting additive intranational
market segmentation and integral market segmentation;
• to assess effectiveness of segmentation approaches based on the Ward’s
method, K-means method, and SOM in finding transnational segments.
1.3 Thesis Structure
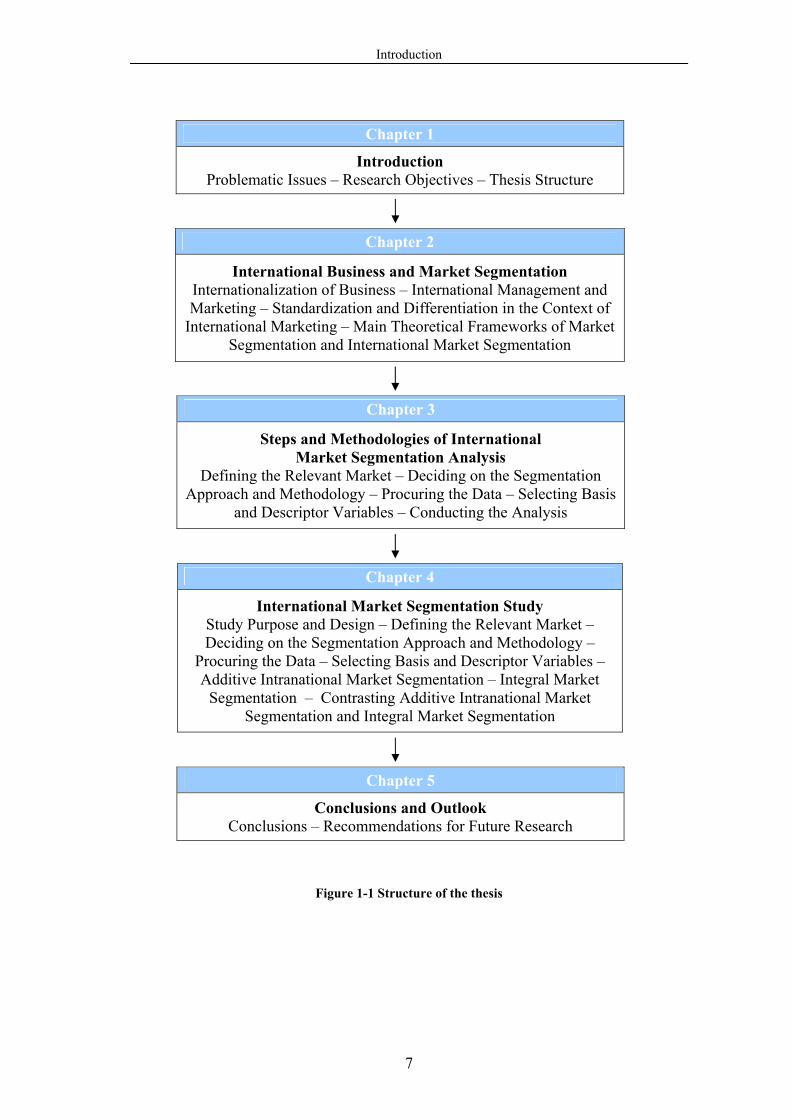
The present doctor thesis is subdivided into five chapters (see Figure 1-1). Chapter 2
following this introductory chapter deals with issues indispensable for understanding
the role, which international market segmentation is playing nowadays. First of all, the
current state of business internationalization as well as the concepts of international
management and international marketing are presented. Furthermore, the controversy
“standardization vs. differentiation”, which belongs to the central strategic issues of
22 See Hermanns/Wißmeier, 1993, pp. 26-33. 23 See Stegmüller, 1995, pp. 306-318. 24 See Ter Hofstede/Steenkamp/Wedel, 1999, pp. 1-17.

Introduction
6
modern international marketing, is introduced. Both notions are discussed in detail in
the context of international marketing, and their advantages (i.e., cost saving and sales
revenue rising potentials) are presented. The increasing importance of standardization
of international business activities and therewith a special role of transnational
segments, which can be found by means of international market segmentation, is
emphasized afterwards, and the main theoretical frameworks of market segmentation
and of international market segmentation are introduced.
Chapter 3 outlines steps and methodologies of international market segmentation
analysis. Diverse theoretical aspects of defining the relevant market, deciding on the
segmentation approach and methodology, procuring the data, selecting basis and
descriptor variables, and conducting the analysis are described here in detail.
Chapter 4 presents the international market segmentation study. It starts with the
description of study purpose and design and then leads the reader through all steps,
which were undertaken within the scope of the study (in particular, defining the
relevant market, deciding on the segmentation approach and methodology, procuring
the data, selecting basis and descriptor variables, conducting additive intranational
market segmentation and integral market segmentation using three segmentation
approaches (based on the Ward’s method, K-means method, and SOM) as well as
assessing their effectiveness, and contrasting additive intranational market
segmentation and integral market segmentation).
Finally, chapter 5 presents conclusions drawn from the international market
segmentation study and recommendations for the future research.
Introduction
7
Figure 1-1 Structure of the thesis
Chapter 4
International Market Segmentation Study Study Purpose and Design – Defining the Relevant Market – Deciding on the Segmentation Approach and Methodology –
Procuring the Data – Selecting Basis and Descriptor Variables – Additive Intranational Market Segmentation – Integral Market
Segmentation – Contrasting Additive Intranational Market Segmentation and Integral Market Segmentation
Chapter 3
Steps and Methodologies of International Market Segmentation Analysis
Defining the Relevant Market – Deciding on the Segmentation Approach and Methodology – Procuring the Data – Selecting Basis
and Descriptor Variables – Conducting the Analysis
Chapter 2
International Business and Market Segmentation Internationalization of Business – International Management and Marketing – Standardization and Differentiation in the Context of
International Marketing – Main Theoretical Frameworks of Market Segmentation and International Market Segmentation
Chapter 1
Introduction Problematic Issues – Research Objectives – Thesis Structure
Chapter 5
Conclusions and Outlook Conclusions – Recommendations for Future Research

International Business and Market Segmentation
8
2 International Business and Market Segmentation
2.1 Internationalization of Business – International Management – International Marketing
Increasing internationalization of business25 presents the most profound trend
occurring during the last decades. Many big companies in leading industrialized
countries of the world start conducting or broaden their cross-border activities
today.26 There is a number of factors encouraging this process:27
- companies face two problems simultaneously: on the one hand, their
national markets become more saturated, on the other hand, their
international competitors become more numerous and price aggressive (for
instance, vendors from South Asian countries);
- shorter product life cycles combined with higher research and development
costs force companies to merchandise their products abroad, in order to
amortize their investments to the highest degree;
- a great number of changes in global economic and political conditions have
occurred (for instance, GATT (General Agreement on Tariffs and Trade)
monitored by WTO (World Trade Organization) has helped to simplify
world trade, introduction of Euro has harmonized the EU-market28, East
European countries have become more open, China has shifted its
orientation closer to market economy);
- improved communication and transportation technologies make different
nations closer neighbors and allow for faster and less expensive exchange
of information, products, services, and capital between them;
- demand behavior and attitudes of consumers from different countries are
converging due to easier and therefore more frequent travel, emergence of
the internet and global media, equalization of demographic structures and
education levels. 25 Following Dülfer, 2001, p. 126, internalization of business is viewed here as any form of cross-border activities conducted by a company. For more detailed information on internationalization see Dülfer, 2001, pp. 126-147. 26 See Meffert/Althans, 1982, p. 15, Stegmüller, 1995, p. 1, and Bauer, 2002, p. 1. 27 See Meffert/Althans, 1982, pp. 15-16, Stegmüller, 1995, pp. 1-2, Douglas/Craig, 1997, p. 380, Meffert/Bolz, 1998, p. 15, Mennicken, 2000, p. 1, and Bauer, 2002, pp. 1-2. 28 EU stands here for “European Union”.

International Business and Market Segmentation
9
Any type of cross-border business activities involves goal-oriented communication
with foreign interaction partners, i.e., international management.29 These foreign
interaction partners can be subdivided into company-external and company-
internal (see Figure 2-1).30
Figure 2-1 Schematic presentation of internal and external interaction partners of a company
operating internationally Source: Dülfer, 2001, p. 253 and Bauer, 2002, pp. 3-4.
29 See Dülfer, 2001, p. 5. 30 See Dülfer, 2001, pp. 249-253 and Bauer, 2002, pp. 2-4.
* In particular, commercial enterprises ** In particular, advertising agencies, market research institutes, etc.
Foreign sales coope-
rators**
Foreign sales interme-
diaries*
Foreign publicity
Foreign competitors
Foreign unions
Foreign banks
Foreign customers
Foreign suppliers
Foreign ethnic
nobilities
Foreign religious
authorities Foreign network partners
Foreign authorities
Foreign management/management
abroad
Foreign workers/ workers abroad
Foreign cooperation
partners
Foreign investors

International Business and Market Segmentation
10
Communication with company-external foreign interaction partners devoted to
systematic analysis, initiation, arrangement and control of (possible) transactions
between a company providing real and/or nominal goods and foreign inquirers
designates the task domain of international marketing.31
This definition of international marketing is only one of many definitions existing
in the literature.32 It is quite wide and simplified, but it clearly emphasizes the next
three highly important aspects characterizing international marketing:33
- communication with foreign interaction partners takes place in the case of
international marketing, thus the uncertainty is higher here than in the case
of national marketing;
- this communication is systematic; it is not reactive, occasional or
accidental;
- the term “international marketing” refers to marketing associated with a
cross-border activity of any form and at any stage of development, thus
it should be viewed as a generic term for such sub-terms as, for instance,
“export marketing”, “multinational marketing”, “global marketing”, etc.
Of course, sub-terms of international marketing existing in the literature are not
limited to the three forms presented above.34 Ways of defining them are very
diverse. They can be classified according to the number of foreign markets chosen
for conducting of business activities, way of dealing with these markets, form of
internationalization, orientation of competitors, and form of corporate
governance.35
31 See Bauer, 2002, p. 4. 32 See, for instance, Meffert/Althans, 1982, pp. 21-24, Berekoven, 1985, pp. 19-22, Kulhavy, 1993, p. 10, Hünerberg, 1994, p. 24, Terpstra/Sarathy, 1991, p. 5, Müller/Gelbrich, 2004, pp. 172-174, Backhaus/Büschken/Voeth, 2005, pp. 52-53, Berndt/Fantapié Altobelli/Sander, 2005, p. 6, and Cateora/Graham, 2005, p. 9. 33 See Bauer, 2002, pp. 4-5. 34 See, for instance, Keegan, 1980, pp. 4-7, Meffert, 1988, pp. 268-269, Hünerberg, 1994, pp. 25-27, Meffert, 1994, pp. 270-272, Meffert/Bolz, 1998, pp. 25-29, Cateora/Graham, 2005, pp. 19-22, Becker, 2001, pp. 315-324, and Zentes/Swoboda/Morschett, 2004, pp. 609-610. 35 See Bauer, 2002, p. 5.
International Business and Market Segmentation
11
2.2 Standardization and Differentiation in the Context of International Marketing
Developments encouraging internationalization of business activities presented
above also point at decreasing importance of country borders in organizing
international activities and increasing necessity in making international strategic
decisions with regard to several markets simultaneously. No wonder that the
controversy “standardization vs. differentiation” belongs to the central strategic
issues of international marketing today.36
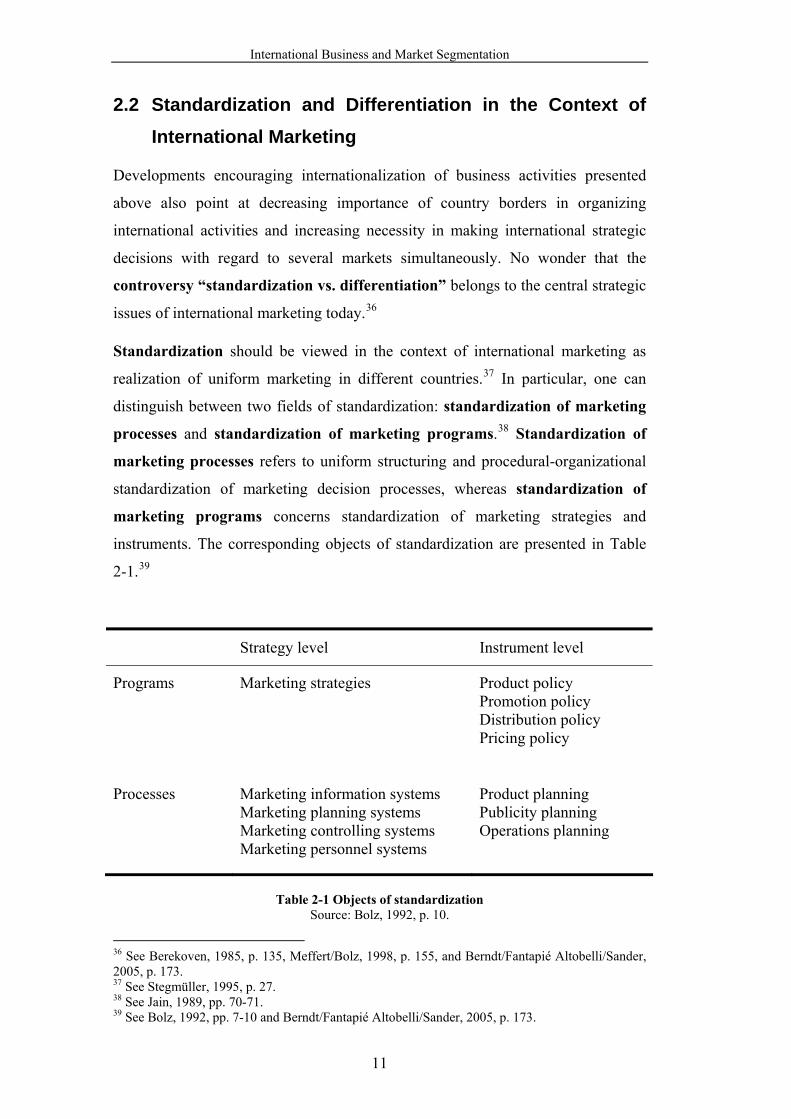
Standardization should be viewed in the context of international marketing as
realization of uniform marketing in different countries.37 In particular, one can
distinguish between two fields of standardization: standardization of marketing
processes and standardization of marketing programs.38 Standardization of
marketing processes refers to uniform structuring and procedural-organizational
standardization of marketing decision processes, whereas standardization of
marketing programs concerns standardization of marketing strategies and
instruments. The corresponding objects of standardization are presented in Table
2-1.39
Strategy level Instrument level
Programs Marketing strategies Product policy Promotion policy Distribution policy Pricing policy
Processes Marketing information systems Marketing planning systems Marketing controlling systems Marketing personnel systems
Product planning Publicity planning Operations planning
Table 2-1 Objects of standardization
Source: Bolz, 1992, p. 10.
36 See Berekoven, 1985, p. 135, Meffert/Bolz, 1998, p. 155, and Berndt/Fantapié Altobelli/Sander, 2005, p. 173. 37 See Stegmüller, 1995, p. 27. 38 See Jain, 1989, pp. 70-71. 39 See Bolz, 1992, pp. 7-10 and Berndt/Fantapié Altobelli/Sander, 2005, p. 173.

International Business and Market Segmentation
12
Differentiation should be viewed in the context of international marketing as
realization of marketing adjusted to peculiarities of each particular foreign
market.40 Again, both marketing programs and marketing processes can be
differentiated.
As far as standardization (differentiation) of marketing processes regards mainly
corporate-policy issues, only standardization (differentiation) of marketing
programs is considered in the following.41
A more explicit explanation of standardisation and differentiation notions in the
context of international marketing can be provided by means of the modified
EPRG-framework42. Here one talks about an orientation system of a company
operating internationally, which is defined as attitudes of company’s management
forming a basis for internationalization of business activities.43 In particular, one
distinguishes between four different orientation systems:44
1. Ethnocentric (= E)
ο A company is strongly oriented at a domestic country. Marketing
strategies and instruments applied to foreign markets do not (barely)
differ from domestic ones. (Almost) all specifics of foreign markets are
ignored.
ο This kind of an orientation system is typical for a company at the
beginning stage of internationalization, when it operates in several
markets only. The primarily aim of ethnocentrically oriented
international marketing in this case is supporting a domestic company
in struggling against domestic competitors through utilization of
profitable export chances. This utilization is systematic. In other words,
ethnocentrically oriented marketing should by no means be mistaken
40 See Stegmüller, 1995, p. 28. 41 See ibid. p. 27. 42 The original framework consisiting of only three orientation systems was proposed by Perlmutter, 1969, pp. 11-14. Heenan/Perlmutter, 1979, pp. 17-21 have later extended it by adding a regiocentric orientation system. 43 See Heenan/Perlmutter, 1979, p. 17 and Stegmüller, 1995, p. 16. 44 See Wind/Douglas/Perlmutter, 1973, pp. 14-15, Keegan, 1980, pp. 247-248, Segler, 1986, pp. 152-153, Kreutzer, 1989, pp. 12-16, Stegmüller, 1995, pp. 17-19, Lingenfelder, 1996, pp. 198-199, Bauer, 2002, pp. 7-10, Keegan, 2002, pp. 12-14, Keegan/Schlegelmilch/Stöttinger, 2002, pp. 20-24, and Müller/Kornmeier, 2002, pp. 317-333.

International Business and Market Segmentation
13
for passively conducted export businesses devoted to satisfying
reactively sporadic demands abroad.
ο An orientation system of a company may remain ethnocentric and be
still successful even after the number of markets chosen for conducting
of business activities has increased. This can happen, if, for instance,
characteristics of a product are strongly connected to a country of
origin. In this case, ethnocentrically oriented international
marketing appears to be primarily aimed at achieving of success in
struggling with regional or global competitors.
2. Polycentric (= P)
ο A company is oriented at each particular country it is working with.
Marketing strategies and instruments differentiate in this case from
country to country. Generally speaking, a polycentric orientation
system is opposite to an ethnocentric one. Here every country is viewed
as unique.
ο Polycentrically oriented international marketing is aimed at fighting
local competitors in each particular country and achieving in this way
an international success.
ο A company may use this kind of an organization system not only while
starting internationalization of its activities, but also manage to remain
polycentric even after expanding its business into a bigger number of
countries.
3. Regiocentric (= R)
ο A company is oriented at homogeneous regions of countries
constructed on the base of, for instance, cultural or political country
similarities or geographical closeness. Marketing strategies and
instruments are standardized for each particular region and
differentiated between them. The national borders inside one and the
same region are ignored in this case. Not countries, as in the case of a
polycentric orientation system, but regions are viewed here as unique
entities.
ο The main task of regiocentrically oriented international marketing
lies in achieving a success in controverting other, particularly, regional

International Business and Market Segmentation
14
competitors and optimizing in this way company’s results in terms of
each particular region.
ο A regiocentric company may cover its markets step by step working
with only a few of them at a time or may consider all of them
simultaneously. Moreover, regions chosen for conducting of business
activities may be so numerous that in combination they would cover a
very big part of the world market. In other words, a company may have
a regiocentric orientation system at any stage of internationalization of
its activities.
4. Geocentric (= G)
ο A company ignores all national borders and orients itself at the entire
world as one potential market. Having such a “worldview”, it strives to
standardize its marketing strategies and instruments at a global level to
optimize its total efficiency worldwide. Local interests of single
markets can be accepted and satisfied as well, if they serve long-term
goals of a company, and the optimal global orientation remains at least
at the core of corresponding local businesses.
ο The primary goal of geocentrically oriented international marketing
is achieving a success in struggling with other, particularly, global
competitors and improving a company’s global position through
systematic global analysis of success and risk potentials and global
integration of company’s activities.
ο As in the case of a regiocentric company, market coverage can be done
by a geocentric company not only for all markets simultaneously, but
also step by step. Correspondingly, it can be stated that geocentric
companies with any level of internationalization of their business
activities may exist.
In practice, companies not always have one of the four orientation systems
presented above. Sometimes, several systems are partly combined with each
other.45 Despite this fact, the EPRG-framework is considered to be of high
empirical value and relevance.46
45 See Bauer, 2002, p. 10. 46 See Stegmüller, 1995, p. 20.

International Business and Market Segmentation
15
Table 2-2 summarizes interrelations between the orientation systems of the EPRG-
framework and standardization/differentiation notions. It should be mentioned that,
according to Stegmüller (1995), the secondary role of foreign markets in the case
of an ethnocentric orientation system can result not in copying of domestic
marketing strategies (in other words, not in international standardization of
marketing strategies), but in framing some subordinate foreign marketing
strategies.47 As far as this statement is likely to be true only for companies at the
very beginning stage of internationalization, it was decided to ignore this
assumption in the present thesis and state that international standardization of
marketing strategies takes place in the case of an ethnocentric orientation system.
Form of an orientation system
Standardization of marketing programs
Differentiation of marketing programs
Ethnocentric High Low
Polycentric Low High
Regiocentric High inside regions High between regions
Geocentric High Low
Table 2-2 Interrelations between orientation systems of the EPRG-framework and
standardization/differentiation of marketing programs
The top objective of international business activities is realization and increase of
profits. A profit is determined by costs and sales revenues. It can be positively
influenced through either of these two components.48
Strictly speaking, both standardization and differentiation have potentials to save
costs and rise sales revenues.49
For instance, standardization of a product can lead to the following cost savings:50
47 See ibid. p. 31. 48 See ibid. pp. 38-39. 49 See Segler, 1986, p. 211. 50 See Segler, 1986, p. 212 and Stegmüller, 1995, pp. 48-52.

International Business and Market Segmentation
16
- economies of scale in production resulting from an increase in production
volume of standardized products (for instance, decline in per unit fixed
costs);
- R&D (Research and Development) savings attributed, for instance, to
needlessness of conducting R&D for each separate country;
- economies of scale in marketing arising, for instance, from using
internationally uniform packaging designs.
On the other hand, the sales revenue rising potential of standardization of a product
can be reffered to:51
- development of the uniform image of a product – the image evermore
inevitable in the conditions of increasing cross-border transparency of
markets caused by a boost in mobility of consumers and highly important
for consolidation of brand image;
- disposal of surplus production possible due to (at least temporary)
expansion of sales areas across borders;
- rapid parallel coverage of markets enabled, for instance, by the absence
of time-consuming country-specific adaptation of products.
At the same time, cost savings attributed to differentiation of a product can be
achieved through:52
- “down-adaptation” of a product quality for countries with lower
requirements (in particular, eliminating those product features that generate
costs, but are not needed in a corresponding country);
- reduction of service problems, which is possible because products are
tailored to local market requirements, and consumer incomprehension of
their characteristics does not arise;
- R&D savings ascribed, for instance, to receiving a big number of
suggestions, especially when subsidiaries play a significant role in the
process of country-specific adaptation of products.
Finally, the sales revenue rising potential of differentiation of a product can lie
in:53
51 See Segler, 1986, p. 212 and Stegmüller, 1995, pp. 42-45. 52 See Segler, 1986, pp. 212-214 and Stegmüller, 1995, pp. 52-53.

International Business and Market Segmentation
17
- increased consumer willingness to buy a product as a result of
adjustment to consumer needs in the way most optimal for each
particular country;
- avoidance of flops in international marketing, which may appear due to
insufficient consideration of country-specific conditions;
- supply of fringe markets with products matched to their specific needs.
Examples of cost saving and sales revenue rising potentials of
standardization/differentiation of a product described above are summarized in
Table 2-3.
Type of the potential Standardization of a product
Differentiation of a product
Saving costs
Economies of scale in production R&D savings Economies of scale in marketing
“Down-adaptation” of a product quality Reduction of service problems R&D savings
Rising sales revenues
The uniform image of a product Disposal of surplus production Rapid parallel coverage of markets
Increased consumer willingness to buy a product as a result of adjustment to consumer needs Avoidance of flops in international marketing Supply of fringe markets
Table 2-3 Cost saving and sales revenue rising potentials of standardization/differentiation of
a product Source: Segler, 1986, p. 213 and Stegmüller, 1995, p. 40.
It should be emphasized, however, that in practice standardization is considered to
be primarily a strategy oriented at saving costs, whereas differentiation – a strategy
53 See Segler, 1986, p. 214 and Stegmüller, 1995, pp. 45-47.

International Business and Market Segmentation
18
oriented at rising sales revenues. More and more companies view saving costs by
means of standardization as a central aspect of international marketing. Moreover,
they start to orient themselves at world regions or even at the whole world as one
potential market. A clear trend of switching from ethno- or polycentric to regio- or
geocentric orientation systems can be observed. Companies attempt to standardize
their international activities as much as possible and differentiate them, only if it is
necessary.54
In the light of these developments a special attention appears to be given to the
topic of transnational segments. Addressing them with standardized marketing
strategies and instruments is often viewed as a way of mutual compensation of
such disadvantages of global standardization and national differentiation as
insufficient consideration of consumer needs and loss of potential economies of
scale in production and marketing, respectively.55
International market segmentation presents an adequate procedure for finding
transnational segments. Its peculiarities are discussed below.
2.3 International Market Segmentation
2.3.1 Concept of Market Segmentation
First articles devoted to the concept of market segmentation appeared in the 1950s.
The most influential of them was the article “Product Differentiation and Market
Segmentation as Alternative Marketing Strategies” written by Wendell R. Smith in
1956. There he contrasted product differentiation with market segmentation stating
that the former notion is the strategy, which “is concerned with the bending of
demand to the will of supply”56, whereas the latter one – the strategy, which “is
based upon developments on the demand side of the market and represents a
rational and more precise adjustment of product and market effort to consumer or
user requirements”57.
54 See Segler, 1986, p. 211 and Stegmüller, 1995, pp. 53-54. 55 See, for instance, Yavas/Verhage/Green, 1992, p. 266 and Steenkamp/Ter Hofstede, 2002, p. 186. 56 Smith, 1956, p. 5. 57 ibid.

International Business and Market Segmentation
19
The article of Smith (1956) reflects developments and tensions occurring in his
contemporary business environment. In the early and mid fifties, major
manufacturers realized that mass production did not allow them to be successful
anymore. The competition has increased, and they had often to store unsold output
that had not met needs of the market. The manufacturers have acknowledged that
needs of consumers differed and decided to pursue a strategy of product
differentiation. In other words, although they had accepted the fact that there was
diversity in consumer needs, they did not really react to it. Instead of this they
treated consumers as similar and attempted to create a satisfactory demand for
products with only a few real differences through influencing consumers by
promotions, which emphasized these differences and presented product claims
appealing to broad consumer needs.58 In other words, this strategy was “designed
to bring about the convergence of individual market demands for a variety of
products upon a single or limited offering to the market”59.
Nevertheless, as technological advances led to smaller product runs, the need in
minimization of marketing costs became more acute, prosperity of consumers
increased making them choosier, and variety of competing products and services
expanded, the interest in market segmentation started to grow.60 According to
Smith (1956), market segmentation “consists of viewing a heterogeneous market
(one characterized by divergent demand) as a number of smaller homogeneous
markets in response to differing product preferences among important market
segments. It is attributable to the desires of consumers or users for more precise
satisfaction of their varying wants”61. He compared a market segmentation strategy
with taking a slice of the market cake (a vertical cut into only one area of the
market), whereas product differentiation strategy with taking its layer (a horizontal
cut through all areas of the market).62 He was sure that market segmentation was
not only useful in view of the developments listed above, but also that switching
attention from a layer of the market cake to its (fringe) slices can create growth
potential,63 and that “exploitation of market segments, which provides for greater
58 See Engel/Fiorillo/Cayley, 1972, p. 22 and Struhl, 1992, p. 5. 59 Smith, 1956, p. 4. 60 See ibid. pp. 6-7. 61 ibid. p. 6. 62 See Smith, 1956, p. 5 and Struhl, 1992, p. 6. 63 See Smith, 1956, p. 7.
International Business and Market Segmentation
20
maximization of consumer or user satisfactions, tends to build a more secure
market position and to lead to greater over-all stability”64.
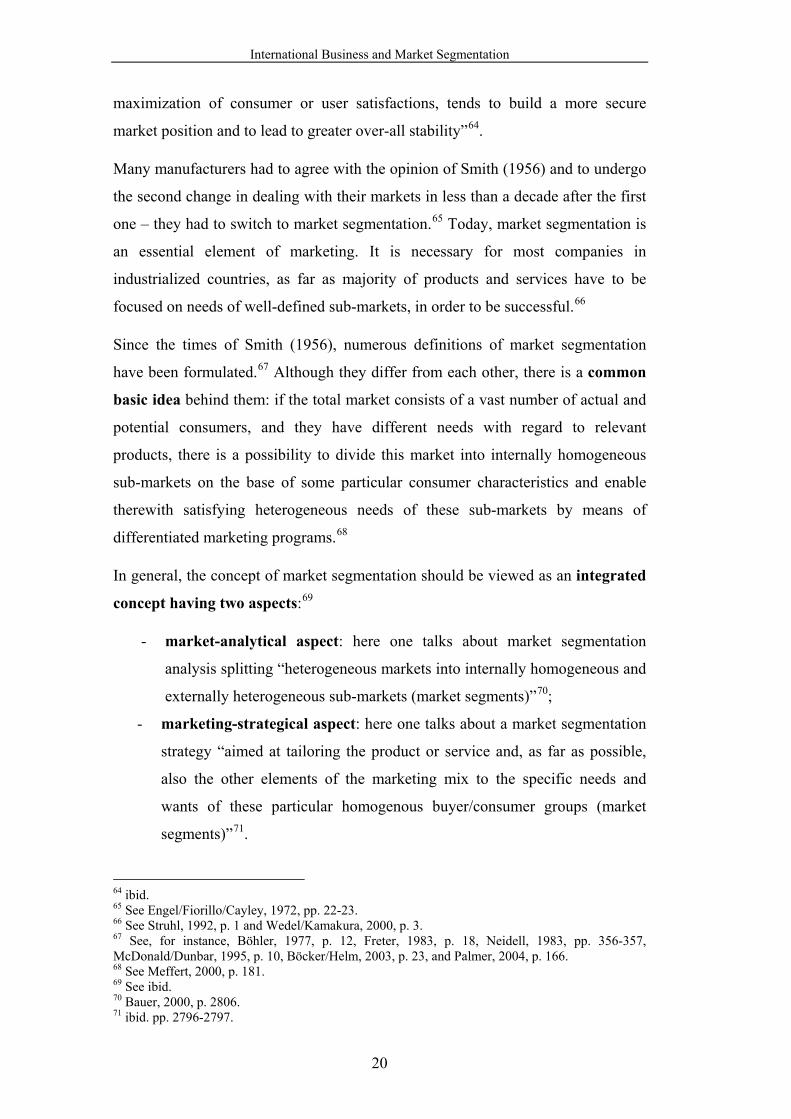
Many manufacturers had to agree with the opinion of Smith (1956) and to undergo
the second change in dealing with their markets in less than a decade after the first
one – they had to switch to market segmentation.65 Today, market segmentation is
an essential element of marketing. It is necessary for most companies in
industrialized countries, as far as majority of products and services have to be
focused on needs of well-defined sub-markets, in order to be successful.66
Since the times of Smith (1956), numerous definitions of market segmentation
have been formulated.67 Although they differ from each other, there is a common
basic idea behind them: if the total market consists of a vast number of actual and
potential consumers, and they have different needs with regard to relevant
products, there is a possibility to divide this market into internally homogeneous
sub-markets on the base of some particular consumer characteristics and enable
therewith satisfying heterogeneous needs of these sub-markets by means of
differentiated marketing programs.68
In general, the concept of market segmentation should be viewed as an integrated
concept having two aspects:69
- market-analytical aspect: here one talks about market segmentation
analysis splitting “heterogeneous markets into internally homogeneous and
externally heterogeneous sub-markets (market segments)”70;
- marketing-strategical aspect: here one talks about a market segmentation
strategy “aimed at tailoring the product or service and, as far as possible,
also the other elements of the marketing mix to the specific needs and
wants of these particular homogenous buyer/consumer groups (market
segments)”71.
64 ibid. 65 See Engel/Fiorillo/Cayley, 1972, pp. 22-23. 66 See Struhl, 1992, p. 1 and Wedel/Kamakura, 2000, p. 3. 67 See, for instance, Böhler, 1977, p. 12, Freter, 1983, p. 18, Neidell, 1983, pp. 356-357, McDonald/Dunbar, 1995, p. 10, Böcker/Helm, 2003, p. 23, and Palmer, 2004, p. 166. 68 See Meffert, 2000, p. 181. 69 See ibid. 70 Bauer, 2000, p. 2806. 71 ibid. pp. 2796-2797.

International Business and Market Segmentation
21
Peculiarities of both aspects of market segmentation are described below. It should
be mentioned that, in the context of the international market segmentation study
presented later in this thesis, market segmentation is viewed in the market-
analytical sense only.
2.3.1.1 Market Segmentation Analysis
Market segmentation analysis presents an instrumental perception of the concept of
market segmentation. In this case, the emphasis is put on identification of
consumer segments, which are internally (externally) as homogeneous
(heterogeneous) as possible with regard to their demand-relevant characteristics.72
Market segmentation analysis constitutes the information side of market
segmentation.73 It can serve two different purposes:74
- on the one hand, it can be focused on “the identification and documentation
of generalizable differences among consumer groups because these
differences can lead to insights about basic processes of consumer
behavior”75 (behaviorally oriented approach to market segmentation);
- on the other hand, it can be focused “not so much on why such differences
occur as on how they can be used to improve the efficiency of the firm’s
marketing program”76 (decision-oriented approach to market
segmentation).
As far as market segmentation analyses conducted within the scope of the
international market segmentation study presented later in this thesis are of a
decision-oriented character, only the latter approach to market segmentation is
considered in the following.
Market segmentation analysis in the decision-oriented sense is aimed at informing
a company whether members of the market it is interested in exhibit group-specific
differences in demand-relevant characteristics and, if yes, whether it is possible to
make use of these differences in increasing achievement rates of a company (for
72 See Bauer, 1976, p. 63. 73 See Meffert, 2000, p. 184. 74 See Bauer, 1976, p. 63. 75 Frank/Massy/Wind, 1972, p. 11. 76 ibid. p. 13.

International Business and Market Segmentation
22
instance, its profit, market position, etc.) through developing differentiated
marketing programs77 adequate for target groups and how to do it.78
In other words, market segmentation analysis attempts, in the first place, to
localize consumer segments, which do or might react to marketing programs in an
internally homogeneous and externally heterogeneous way (see Figure 2-2). These
segments “need not be physical entities that naturally occur in the marketplace”79,
but are normally “artificial groupings of consumers constructed to help managers
to design and target their strategies”80.
Figure 2-2 Market segmentation analysis
77 As it was already mentioned above, according to Bauer, 2000, pp. 2796-2797, such marketing mix element as a product should be considered and adjusted primarily in this case, whereas all others (promotion, distribution, pricing) – as far as possible. 78 See Bauer, 1976, p. 69. 79 Wedel/Kamakura, 2000, p. 5. 80 ibid.
Disaggregated market Diversity in consumer demand-related characteristics is accepted as a fact, but not understood
Segmented market Diversity in consumer demand-related characteristics is systematized and explained through identification of segments, which do or might react to marketing programs in an internally homogeneous and externally heterogeneous way
Market segmentation analysis

International Business and Market Segmentation
23
Correspondingly, the next two questions appear to be crucial for market
segmentation analysis:81
- Which statistical-mathematical methods are appropriate for decomposing
the total market into sub-markets and determining relevant differences
between them?
- Which criteria should be used to subdivide the total market into sub-
markets?
Usage of different segmentation methods and criteria82 normally results in finding
consumer segments of different type, number, and usefulness.83
Existing segmentation methods are very numerous. In general, they can be
classified in two ways.
Firstly, these methods can be of either descriptive or predictive nature.
Descriptive methods analyze interconnections within one set of variables and do
not distinguish between dependent and independent variables. On the contrary,
predictive methods analyze interconnections between two sets of variables
viewing one set as a group of dependent variables, which have to be
explained/predicted by the other set – a group of independent variables.84
Secondly, the type of a segmentation method used depends on a segmentation
model chosen.85 In particular, one can distinguish between a-priori and a-
posteriori segmentation models.86
Within the scope of a-priori segmentation, some particular cluster-defining
criterion is chosen in advance. On the base of this criterion consumers are
classified into groups and afterwards described by means of characteristics not
used for cluster building (the so-called descriptor variables87). The number of
clusters in this case is determined by characteristics of a cluster-defining criterion
(for instance, by the number of points on a corresponding measurement scale). A-
81 See Kaiser, 1977, p. 12. 82 According to Struhl, 1992, p. 10, segmentation criteria can also be called basis variables because they serve as a base for segmentation. 83 See Wedel/Kamakura, 2000, p. 5. 84 See ibid. p. 17. 85 See ibid. 86 See Green, 1977, p. 64. 87 See Struhl, 1992, p. 10.

International Business and Market Segmentation
24
priori segmentation makes sense, if a researcher assumes or knows that some
particular groups of consumers exist in the marketplace and attempts to obtain
information on them. Classification of consumers into groups according to their
favorite brand can be considered as a typical example of a-priori segmentation.
Here the variable “My favorite brand is …” serves as a cluster-defining criterion,
and the number of clusters corresponds to the number of brands considered.88
In the case of a-posteriori segmentation, a researcher does not have any
information about the number or type of segments in advance and tries to
determine them on the base of grouping consumers according to their similarities
on some set of variables. Segments obtained in this way can then be additionally
described by descriptor variables.89 As an example of a-posteriori segmentation
one can consider segmentation of consumers on the base of their similarities on
requirements towards a product/brand (i.e., needs) as in the case of the
international market segmentation study presented later in the thesis.
A-priori and a-posteriori segmentation can also be used in combination with each
other. In such case, one talks about hybrid segmentation. Here a-priori
segmentation precedes a-posteriori segmentation.90 For instance, consumers can
first be roughly classified into groups according to their favorite brand, and then
each of the obtained groups can be segmented on the base of consumers’
requirements towards a product/brand.
Examples of methods classified on the base of the two types of criteria described
above are presented in Table 2-4.
The number of characteristics which may serve as segmentation criteria is also
huge. In the case of conducting national market segmentation analysis, these
characteristics are chosen on the base of
- the goal of the market segmentation study;91
- their quality.92
88 See Green/Tull/Albaum, 1988, pp. 687-688 and Stegmüller, 1995, pp. 120-121. 89 See Wind, 1978, pp. 321-322, Green/Tull/Albaum, 1988, p. 688, and Stegmüller, 1995, p. 121. 90 See Wind, 1978, p. 322, Green/Tull/Albaum, 1988, pp. 688-689, and Stegmüller, 1995, pp. 121-122. 91 For more detailed information see part 3.4.1.1 of the present thesis. 92 For more detailed information see part 3.4.1.2 of the present thesis.

International Business and Market Segmentation
25
If international markets are being segmented, the choice of segmentation criteria is
additionally influenced by the type of international market segmentation analysis.93
A-priori A-posteriori Hybrid
Descriptive Contingency tables Log-linear models
Clustering methods ANN (Artificial Neural Networks) Mixture models
Predictive Cross-tabulation Regression Multinomial logit model Discriminant analysis
AID (Automatic Interaction Detection) CART (Classification and Regression Trees) Clusterwise regression ANN (Artificial Neural Networks) Mixture models
Combination of a-priori and a-posteriori methods
Table 2-4 Classification of segmentation methods
Source: Wedel/Kamakura, 2000, p. 17 and Liu, 2005, p. 25.
2.3.1.2 Market Segmentation Strategy
A market segmentation strategy is based on the cognition that markets are
heterogeneous, in other words, that consumers have different characteristics,
needs, wants, and preferences. Market heterogeneity is interpreted by a market
segmentation strategy not as a disturbing evil, but as a beneficial opportunity, an
advantage for both a company and consumers: viewing consumers with alike
demand-relevant characteristics as homogenous segments and addressing them
with marketing programs constructed specifically for these segments are expected
to lead to higher satisfaction of consumer needs and therewith to stabilization of or
increase in achievement rates of a company (for instance, its profit, market
position, etc).94
93 For more detailed information see part 2.3.2 of the present thesis. 94 See Bauer, 1976, pp. 59-60.

International Business and Market Segmentation
26
Correspondingly, conducting a market segmentation strategy means producing
heterogeneous products for homogeneous sub-markets of the heterogeneous total
market and selling them with the help of marketing programs oriented at target
sub-markets. It also means the increase in achievement of company’s objectives
though the increase in satisfaction of individual needs.95
A market segmentation strategy constitutes the action side of market
segmentation. It incorporates identifying a target segment (target segments) and
developing segment-specific marketing programs (management-oriented
approach to market segmentation) (see Figure 2-3).96 No wonder that in the
Anglo-American literature the term “market segmentation” refers to the market-
analytical aspect of market segmentation only, whereas market segmentation in the
marketing-strategical conceptualization is presented through “targeting” and
“brand (product) positioning” terms.97 For instance, Green, Tull, and Albaum
(1988) state:
“From a marketing management viewpoint, market segmentation is the act of
dividing a market into distinct groups of buyers who might require separate
products and/or marketing programs directed to them. In contrast, brand (product)
positioning is the act of developing a product and its associated marketing
program to fit a place in the consumer’s mind. The basis of product (or brand)
positioning is segmentation “working” through market targeting which involves
evaluating and selecting one or more of the market segments to serve”98.
95 See ibid. p. 60. 96 See Meffert, 2000, pp. 184-185. 97 See, for instance, Green/Tull/Albaum, 1988, pp. 672-673, Douglas/Craig, 1995, pp. 188-189, Kotabe/Helsen, 1998, p. 206-207, and Keegan, 2002, pp. 191-202. 98 Green/Tull/Albaum, 1988, pp. 672-673.
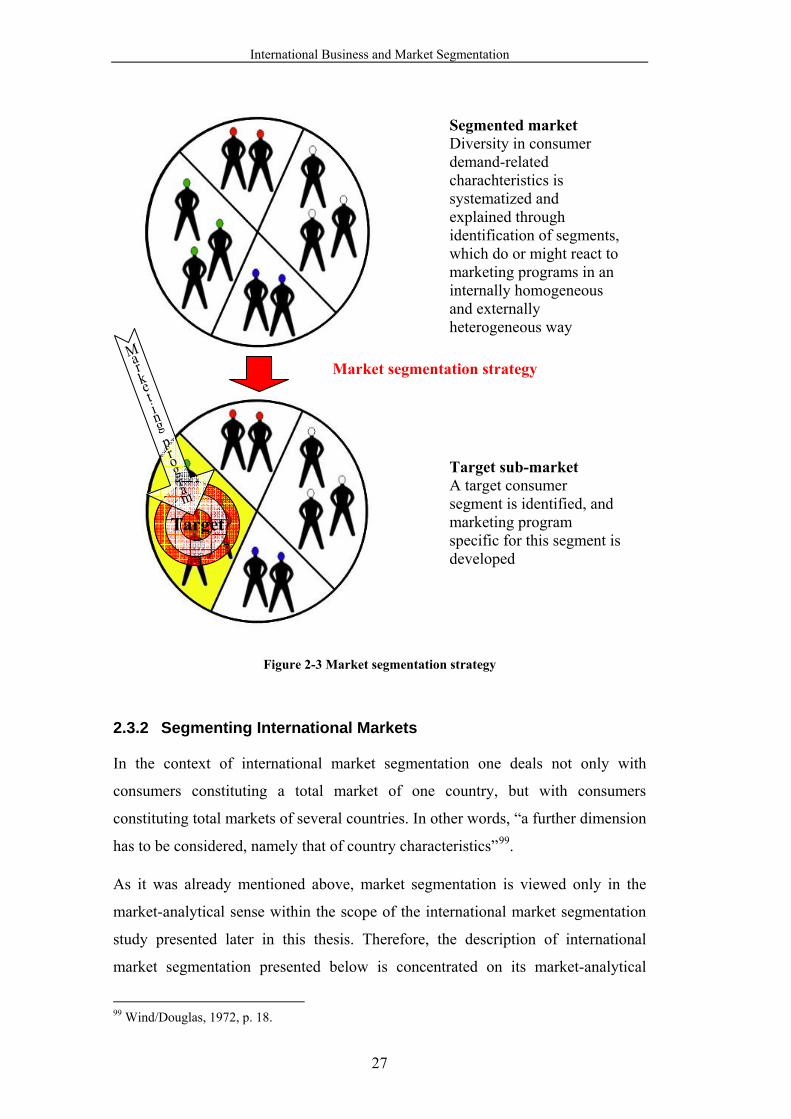
International Business and Market Segmentation
27
Figure 2-3 Market segmentation strategy
2.3.2 Segmenting International Markets
In the context of international market segmentation one deals not only with
consumers constituting a total market of one country, but with consumers
constituting total markets of several countries. In other words, “a further dimension
has to be considered, namely that of country characteristics”99.
As it was already mentioned above, market segmentation is viewed only in the
market-analytical sense within the scope of the international market segmentation
study presented later in this thesis. Therefore, the description of international
market segmentation presented below is concentrated on its market-analytical
99 Wind/Douglas, 1972, p. 18.
Market segmentation strategy
Target sub-market A target consumer segment is identified, and marketing program specific for this segment is developed
Target
Segmented market Diversity in consumer demand-related charachteristics is systematized and explained through identification of segments, which do or might react to marketing programs in an internally homogeneous and externally heterogeneous way

International Business and Market Segmentation
28
aspect only. In particular, the next three general types of international market
segmentation analysis will be discussed: exclusively country-related market
segmentation, country- and consumer-related market segmentation, and
exclusively consumer-related market segmentation.
2.3.2.1 Exclusively Country-Related Market Segmentation
Exclusively country-related market segmentation is international market
segmentation aimed at forming a country typology. In other words, not consumers,
but countries are being segmented here (see Figure 2-4).100
Figure 2-4 Exclusively country-related market segmentation Correspondingly, only country characteristics are considered as segmentation
criteria in this case. According to Meffert and Althans (1982), they can be
subdivided into four general groups: socioeconomic, political-legal, natural-
technical, and sociocultural (see Table 2-5).101
100 See, for instance, Liander/Terpstra/Yoshino/Sherbini, 1967, pp. 59-62, Sethi, 1971, pp. 348-354, Huszagh/Fox/Day, 1986, pp. 31-43, Day/Fox/Huszagh, 1988, pp. 14-27, Lee, 1990, pp. 39-49, Helsen/Jedidi/DeSarbo, 1993, pp. 60-71, Dawar/Parker, 1994, pp. 81-95, Kumar/Stam/ Joachimsthaler, 1994, pp. 29-52, Kale, 1995, pp. 35-48, Kumar/Ganesh/Echambadi, 1998, pp. 255-268, Kotabe/Helsen, 1998, pp. 188-189, Bauer, 2000, p. 2807, and Steenkamp, 2001, pp. 30-44. 101 See Meffert/Althans, 1982, p. 59.
The world (i.e., all countries viewed as potential markets) is considered
A country typology is formed

International Business and Market Segmentation
29
Group Country characteristics
Socioeconomic Market volume Competition
Natural-technical Typography Climate State of development Infrastructure Urbanization level
Political-legal Entrepreneurial activity of the state Social order Political stability Economic policy Foreign trade laws Foreign jurisdiction International agreements
Sociocultural Language Educational system Values and attitudes Religion Social structure
Table 2-5 Country characteristics as segmentation criteria classified
Source: Meffert/Althans, 1982, p. 59.
An alternative approach to classifying country characteristics as segmentation
criteria is proposed by Frank, Massy, and Wind (1972).102 They distinguish
between four different groups presented in Table 2-6. This classification approach
provides with much more detailed information about the segmentation criteria
because it points at differences in the nature of these criteria (general or situation
specific) and of their measurement process (objective or inferred)103.
102 See Frank/Massy/Wind, 1972, p. 103. 103 See ibid. pp. 26-27.

International Business and Market Segmentation
30
General Situation specific
Objective Geographic location Population characteristics Level of socioeconomic development
Economic and legal constraints Market conditions
Inferred Cultural characteristics Political factors
Product bound culture and life-style characteristics
Table 2-6 Country characteristics as segmentation criteria classified (an alternative
approach) Source: Frank/Massy/Wind, 1972, p. 103.
While conducting exclusively country-related market segmentation, countries can
be segmented either by means of segmentation methods presented in Table 2-4 or
by means of portfolio analysis104.
A country typology obtained in the case of exclusively country-related market
segmentation can serve as an information support in making country selection
decisions in international marketing. Nevertheless, its usefulness in finding
meaningful and realistic transnational segments as well as in providing a base for
constructing efficient marketing programs is quite questionable. First of all,
exclusively country-related market segmentation disregards country-specific
heterogeneity of consumers. Moreover, it excludes the possibility of finding
transnational segments in countries belonging to different country groups. To
address these shortcomings, exclusively country-related market segmentation
should be complemented or substituted by consumer-related market
segmentation.105
2.3.2.2 Country- and Consumer-Related Market Segmentation
In the case of country- and consumer-related market segmentation, one talks
about international market segmentation at the macro-level (i.e., country-related
104 See Bauer 2000, p. 2807. According to Stegmüller, 1995, p. 107, portfolio analysis presents a facility for evaluation and selection of countries on the base of a country portfolio – a two-dimensional coordinate space structured through evaluation/selection criteria as axes of coordinates. For more detailed information on portfolio analysis see Stegmüller, 1995, pp. 107-109, Backhaus/Büschken/Voeth, 2005, pp. 81-97, and Berndt/Fantapié Altobelli/Sander, 2005, pp. 115-117. 105 See Bauer, 2000, p. 2807.

International Business and Market Segmentation
31
market segmentation) followed by international market segmentation at the micro-
level (i.e., consumer-related market segmentation).106
The aim of country-related segmentation in this case is not only to form a country
typology, but also to identify a country group (country groups) worth being
considered at a micro-level (see Figure 2-5).107
Figure 2-5 International market segmentation at the macro-level Again, international market segmentation at the macro-level can be based either on
segmentation methods presented in Table 2-4 or on portfolio analysis. In the latter
case, subsequent assessment of countries is not required – it is already expressed in
corresponding portfolio positioning. In the former case, on the contrary, it is
necessary.108 Assessment criteria used here depend on the goal- and preference-
106 See, for instance, Wind/Douglas, 1972, pp. 17-25, Segler, 1986, p. 192, Althans, 1989, pp. 1469-1477, Hünerberg, 1994, pp. 108-110, Bauer, 2000, p. 2808, Mennicken, 2000, pp. 191-196, and Zentes/Swoboda/Morschett, 2004, p. 617. 107 See Bauer, 2000, p. 2808. 108 See ibid.
The world (i.e., all countries viewed as potential markets) is considered
A country typology is formed and promising
country group is identified

International Business and Market Segmentation
32
system of a company.109 The next two groups of them are considered to be
especially important:110
- indicators of business risk:
ο political factors (for instance, internal political stability,
expropriation risks, attitudes of the host-government to foreign
investment),
ο legal factors (for instance, import-export restrictions, legal systems,
restrictions on private ownership),
ο financial factors (for instance, rate of inflation, capital-flow
restrictions, foreign-exchange risks);
- indicators of market potential:
ο demographic characteristics (for instance, population size, rate of
population growth, degree of urbanization, population density, age
structure and composition of population),
ο geographic characteristics (for instance, physical size of the
country, topographical characteristics, climate conditions),
ο economic factors (for instance, GNP per capita, income distribution,
rate of growth of GNP, rate of investment to GNP),
ο technological factors (for instance, level of technological skills,
existing production and consumption technology, education levels),
ο sociocultural factors (for instance, dominant values, life-style
patterns, ethnic and linguistic groups).
In general, it can be stated that criteria used for choosing a promising country
group are normally quite similar to those used for forming a country typology.111
The country group choice procedure can be conducted with the help of either
analytical or heuristic methods.112
Analytical methods assume that relevant alternatives, business environment
conditions, and activity consequences can be quantified, and thus the optimal
alternative can be calculated. These methods require a big amount of information 109 See Mennicken, 2000, p. 192. 110 See Douglas/Craig, 1982, pp. 29.8-29.10, Köhler/Hüttemann, 1989, pp. 1433-1434, and Mennicken, 2000, pp. 193-194. 111 See Mennicken, 2000, p. 194. 112 See Meffert/Bolz, 1998, p. 116.

International Business and Market Segmentation
33
to be available. To analytical methods belongs, for instance, the capital value
method – a traditional method of investment analysis. It views a country group as
most advantageous and promising, if the capital value (i.e., the difference between
cash values of in- and outpayment) of product sales in it is the highest, and helps to
identify it.113
Heuristic methods are of a qualitative nature. Their requirements towards an
information supply are much lower than those of analytical methods. Among
heuristic methods is, for instance, the checklist method. The checklist method
verifies an ability of a country group to fulfill some basic requirements presented
in the form of a list. These requirements normally correspond to indicators of
business risk and market potential already presented above (for instance, internal
political stability, legal security of agreements, GNP per capita, personal attitude to
a job).114
After a promising country group (country groups) is (are) identified, a researcher
“switches” to the micro-level of international market segmentation and segments
consumers in these countries. Consumer-related market segmentation in this case
can be done in the form of either additive intranational market segmentation or
integral market segmentation (see Figure 2-6).115
113 See ibid. pp. 116-121. 114 See Meffert/Bolz, 1998, pp. 116-118 and Kutschker/Schmid, 2005, pp. 936-937. 115 See Segler, 1986, p. 192 and Bauer, 2000, p. 2808.

International Business and Market Segmentation
34
Figure 2-6 International market segmentation at the micro-level
Additive intranational market segmentation
Step 1
Intranational segmentation in each country
Step 2 Cross-national comparison of country-specific segments and aggregation of alike segments
into transnational segments
+ +
+ +
+ +
Integral market segmentation
Viewing all countries as one market
Obtaining transnational segments

International Business and Market Segmentation
35
Conduction of additive intranational market segmentation can be subdivided
into the next two steps:116
- Segmenting countries intranationally
Consumers within each particular country are subdivided into internally
homogeneous and externally heterogeneous groups.117 It should be emphasized
that intranational segmentations conducted in this case are not identical to
corresponding national segmentations. They have to be conducted in the way
guaranteeing cross-national comparability of country-specific segments.
- Comparing and aggregating of country-specific segments cross-
nationally
Segments identified in each particular country are compared with segments
from other countries. If alike segments in different countries are identified, they
are combined into corresponding transnational segments.
Within the scope of integral market segmentation, all countries are considered
jointly, as one market.118 Here segmenting consumers results in straight
identification of transnational segments.119
It should be mentioned that in the literature integral market segmentation is
sometimes defined not as an option for conducting country- and consumer-related
market segmentation at the micro level, but as an alternative to the whole two-step
procedure.120 In particular, it is stated that, in the case of integral market
segmentation, conduction of country-related market segmentation is abandoned,
and consumers are segmented worldwide. Within the scope of the present thesis,
integral market segmentation in this sense is considered only as an option for
conducting exclusively consumer-related market segmentation presented below.
Segmentation criteria used at the macro-level of country- and consumer-related
market segmentation are normally the same country characteristics as in the case of
exclusively country-related market segmentation. The role of segmentation criteria
used at the micro-level of country- and consumer-related market segmentation is 116 See Stegmüller, 1995, p. 79, Kotabe/Helsen, 1998, p. 190, and Bauer, 2000, p. 2808. 117 In other words, the number of consumer samples segmented in this case corresponds to the number of countries considered. 118 Here one consumer sample is segmented. 119 See Kotabe/Helsen, 1998, p. 190 and Bauer, 2000, p. 2808. 120 See, for instance, Hünerberg, 1994, pp. 109-110, Stegmüller, 1995, pp. 80-81, and Zentes/Swoboda/Morschett, 2004, p. 617.

International Business and Market Segmentation
36
normally played by different kinds of consumer characteristics. Usually, they are
identical to consumer characteristics used in the case of national market
segmentation.121
In the literature there is a big variety of both consumer characteristics, which can
be considered as segmentation criteria, and ways of their systematization122.
For instance, according to Wind (1978) they can be classified into the next two
groups:123
- general customer characteristics: “demographic and socioeconomic
characteristics, personality and life style characteristics, and attitudes and
behavior toward mass media and distribution outlets”124;
- situation specific customer characteristics: “product usage and purchase
patterns, attitudes toward the product and its consumption, benefits sought
in a product category, and any responses to specific marketing variables
such as new product concepts, advertisements, and the like”125.
Stegmüller (1995) criticizes such classification as not selective enough and
proposes to subdivide consumer characteristics as segmentation criteria into the
next three groups:126
- demographic variables: geographic characteristics (in particular, city size,
city/village, and region), demographic characteristics (in particular, gender,
age, marital status, and number of children), and socioeconomic
characteristics (in particular, occupation, education, and income);
- psychographic variables: attitudes (in particular, general, product type
specific and brand specific attitudes), motives, perceptions, and interests;
- behavioral variables: activities, product choice, purchase quantity and
frequency, brand loyalty, price behavior, choice of place of purchase, and
media usage.
121 See Bauer, 2000, p. 2808. 122 See, for instance, Frank/Massy/Wind, 1972, p. 27, Böhler, 1977, p. 63, Meffert, 1977, p. 438, Wind, 1978, p. 319, Freter, 1983, p. 46, Green/Tull/Albaum, 1988, p. 691, Kramer, 1991, p. 24, Struhl, 1992, p. 14, Stegmüller, 1995, p. 164, Palmer, 2004, pp. 172-185, and Berndt/Fantapié Altobelli/Sander, 2005, p. 122. 123 See Wind, 1978, p. 319. 124 ibid. 125 ibid. 126 See Stegmüller, 1995, pp. 163-164.
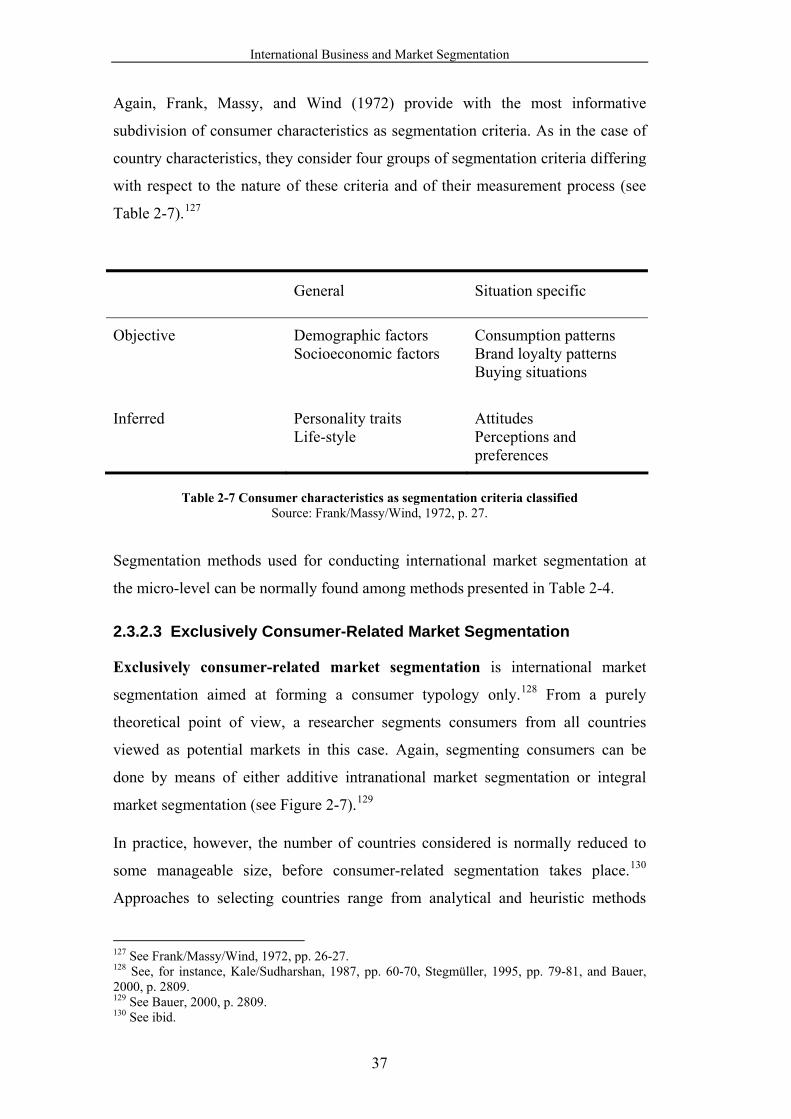
International Business and Market Segmentation
37
Again, Frank, Massy, and Wind (1972) provide with the most informative
subdivision of consumer characteristics as segmentation criteria. As in the case of
country characteristics, they consider four groups of segmentation criteria differing
with respect to the nature of these criteria and of their measurement process (see
Table 2-7).127
General Situation specific
Objective Demographic factors Socioeconomic factors
Consumption patterns Brand loyalty patterns Buying situations
Inferred Personality traits Life-style
Attitudes Perceptions and preferences
Table 2-7 Consumer characteristics as segmentation criteria classified
Source: Frank/Massy/Wind, 1972, p. 27.
Segmentation methods used for conducting international market segmentation at
the micro-level can be normally found among methods presented in Table 2-4.
2.3.2.3 Exclusively Consumer-Related Market Segmentation
Exclusively consumer-related market segmentation is international market
segmentation aimed at forming a consumer typology only.128 From a purely
theoretical point of view, a researcher segments consumers from all countries
viewed as potential markets in this case. Again, segmenting consumers can be
done by means of either additive intranational market segmentation or integral
market segmentation (see Figure 2-7).129
In practice, however, the number of countries considered is normally reduced to
some manageable size, before consumer-related segmentation takes place.130
Approaches to selecting countries range from analytical and heuristic methods
127 See Frank/Massy/Wind, 1972, pp. 26-27. 128 See, for instance, Kale/Sudharshan, 1987, pp. 60-70, Stegmüller, 1995, pp. 79-81, and Bauer, 2000, p. 2809. 129 See Bauer, 2000, p. 2809. 130 See ibid.
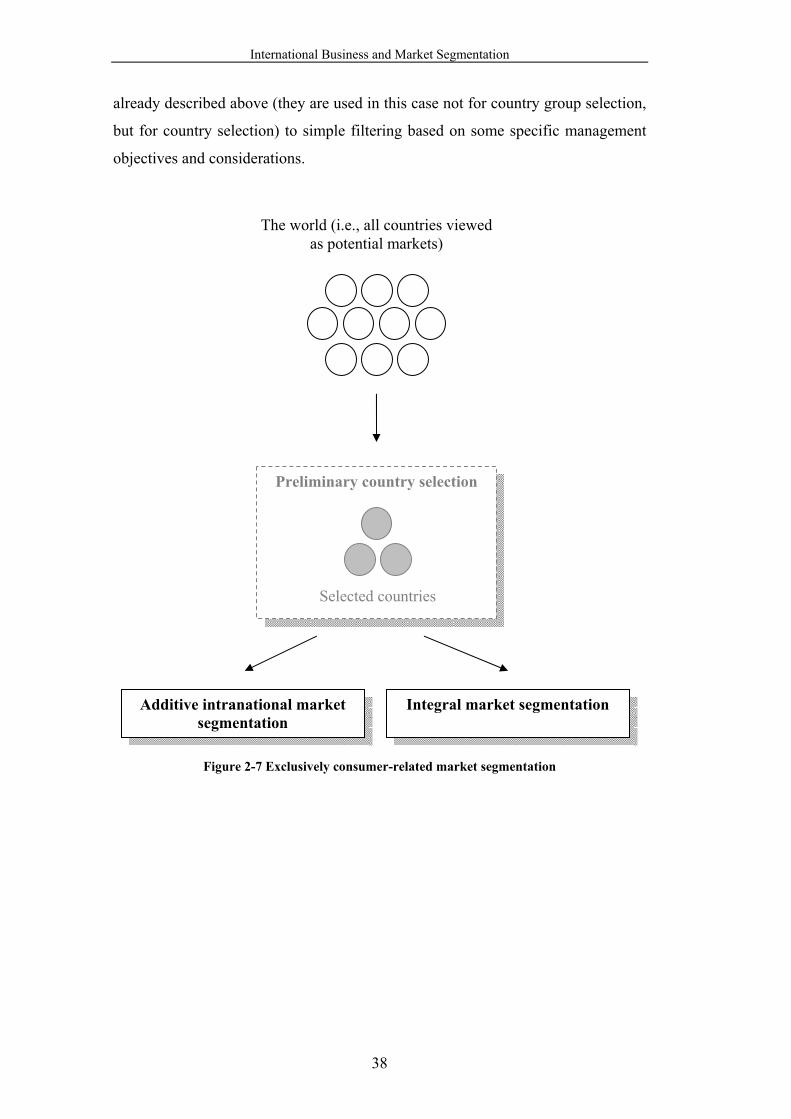
International Business and Market Segmentation
38
already described above (they are used in this case not for country group selection,
but for country selection) to simple filtering based on some specific management
objectives and considerations.
Figure 2-7 Exclusively consumer-related market segmentation
Preliminary country selection
Selected countries
The world (i.e., all countries viewed as potential markets)
Additive intranational market segmentation
Integral market segmentation
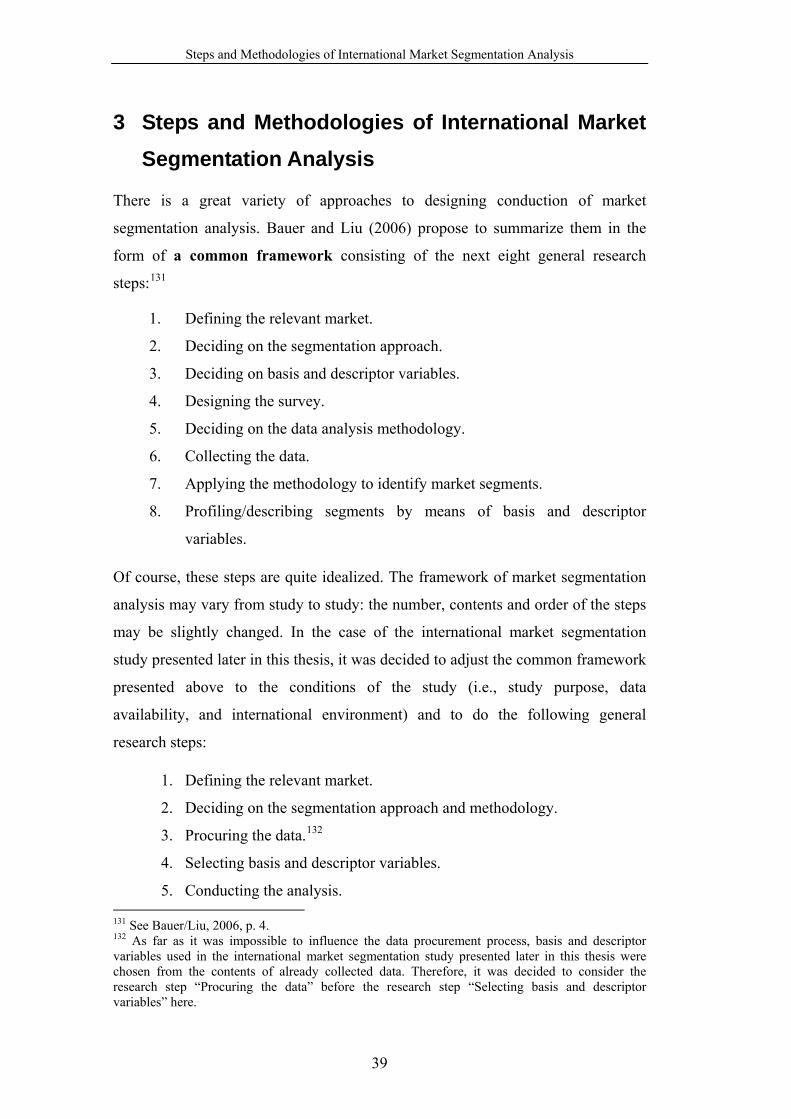
Steps and Methodologies of International Market Segmentation Analysis
39
3 Steps and Methodologies of International Market Segmentation Analysis
There is a great variety of approaches to designing conduction of market
segmentation analysis. Bauer and Liu (2006) propose to summarize them in the
form of a common framework consisting of the next eight general research
steps:131
1. Defining the relevant market.
2. Deciding on the segmentation approach.
3. Deciding on basis and descriptor variables.
4. Designing the survey.
5. Deciding on the data analysis methodology.
6. Collecting the data.
7. Applying the methodology to identify market segments.
8. Profiling/describing segments by means of basis and descriptor
variables.
Of course, these steps are quite idealized. The framework of market segmentation
analysis may vary from study to study: the number, contents and order of the steps
may be slightly changed. In the case of the international market segmentation
study presented later in this thesis, it was decided to adjust the common framework
presented above to the conditions of the study (i.e., study purpose, data
availability, and international environment) and to do the following general
research steps:
1. Defining the relevant market.
2. Deciding on the segmentation approach and methodology.
3. Procuring the data.132
4. Selecting basis and descriptor variables.
5. Conducting the analysis. 131 See Bauer/Liu, 2006, p. 4. 132 As far as it was impossible to influence the data procurement process, basis and descriptor variables used in the international market segmentation study presented later in this thesis were chosen from the contents of already collected data. Therefore, it was decided to consider the research step “Procuring the data” before the research step “Selecting basis and descriptor variables” here.
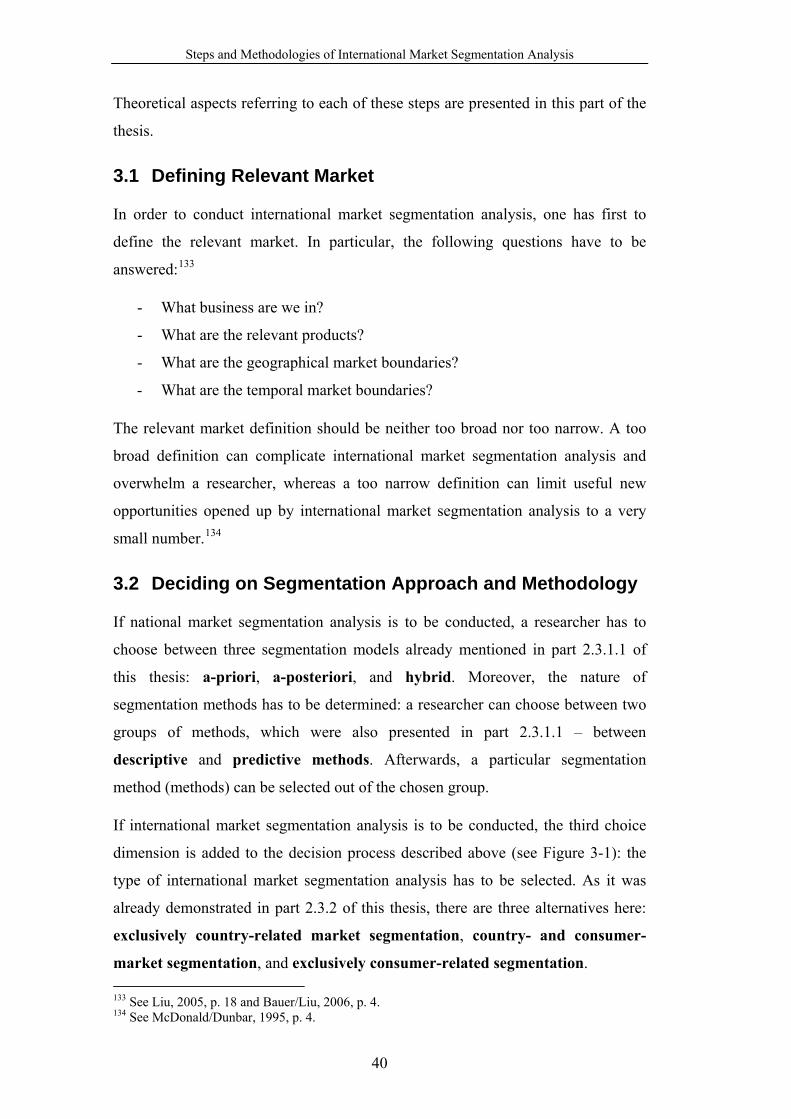
Steps and Methodologies of International Market Segmentation Analysis
40
Theoretical aspects referring to each of these steps are presented in this part of the
thesis.
3.1 Defining Relevant Market
In order to conduct international market segmentation analysis, one has first to
define the relevant market. In particular, the following questions have to be
answered:133
- What business are we in?
- What are the relevant products?
- What are the geographical market boundaries?
- What are the temporal market boundaries?
The relevant market definition should be neither too broad nor too narrow. A too
broad definition can complicate international market segmentation analysis and
overwhelm a researcher, whereas a too narrow definition can limit useful new
opportunities opened up by international market segmentation analysis to a very
small number.134
3.2 Deciding on Segmentation Approach and Methodology
If national market segmentation analysis is to be conducted, a researcher has to
choose between three segmentation models already mentioned in part 2.3.1.1 of
this thesis: a-priori, a-posteriori, and hybrid. Moreover, the nature of
segmentation methods has to be determined: a researcher can choose between two
groups of methods, which were also presented in part 2.3.1.1 – between
descriptive and predictive methods. Afterwards, a particular segmentation
method (methods) can be selected out of the chosen group.
If international market segmentation analysis is to be conducted, the third choice
dimension is added to the decision process described above (see Figure 3-1): the
type of international market segmentation analysis has to be selected. As it was
already demonstrated in part 2.3.2 of this thesis, there are three alternatives here:
exclusively country-related market segmentation, country- and consumer-
market segmentation, and exclusively consumer-related segmentation. 133 See Liu, 2005, p. 18 and Bauer/Liu, 2006, p. 4. 134 See McDonald/Dunbar, 1995, p. 4.

Steps and Methodologies of International Market Segmentation Analysis
41
Figure 3-1 Choice dimensions considered while deciding on the segmentation approach and methodology
All types of choice presented above depend on the objectives of a researcher
conducting a segmentation study.
3.3 Procuring Data
Data used as basis or descriptor variables can be subdivided into the next two
groups: secondary data and primary data.
Secondary data refers to readily available information collected for some other
purposes at an earlier date, which can also be useful for the current study.135 They
can be generally classified as follows:136
- statistical data (for instance, official, semi-official or operational
statistics); 135 See Kotabe/Helsen, 1998, p. 154 and Hammann/Erichson, 2000, p. 77. 136 See Bauer, 2002, p. 73.
Segmentation model
A-priori A-posteriori Hybrid
Descriptive
Predictive
Exclusively country-related
Exclusively consumer-related
Country- and consumer-related
* considered only in the case of conducting international market segmentation analysis
Segmentation methods
Type of international market segmentation analysis*
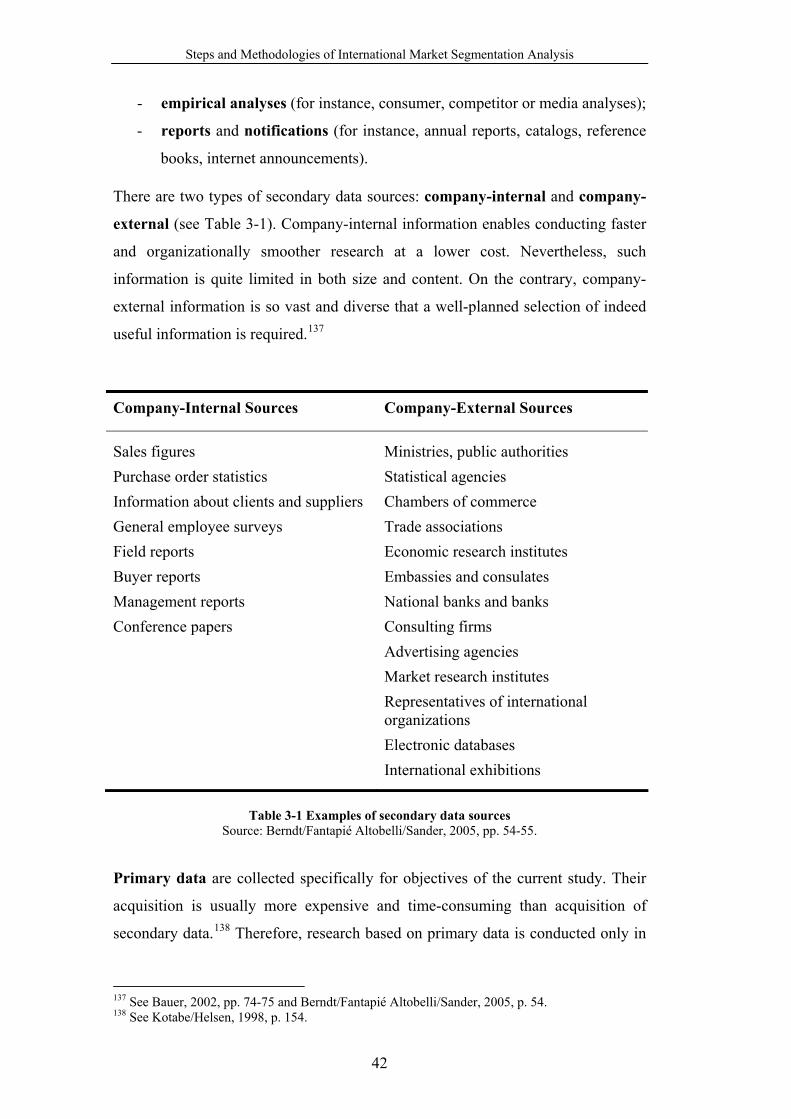
Steps and Methodologies of International Market Segmentation Analysis
42
- empirical analyses (for instance, consumer, competitor or media analyses);
- reports and notifications (for instance, annual reports, catalogs, reference
books, internet announcements).
There are two types of secondary data sources: company-internal and company-
external (see Table 3-1). Company-internal information enables conducting faster
and organizationally smoother research at a lower cost. Nevertheless, such
information is quite limited in both size and content. On the contrary, company-
external information is so vast and diverse that a well-planned selection of indeed
useful information is required.137
Company-Internal Sources Company-External Sources
Sales figures Purchase order statistics Information about clients and suppliers General employee surveys Field reports Buyer reports Management reports Conference papers
Ministries, public authorities Statistical agencies Chambers of commerce Trade associations Economic research institutes Embassies and consulates National banks and banks Consulting firms Advertising agencies Market research institutes Representatives of international organizations Electronic databases International exhibitions
Table 3-1 Examples of secondary data sources
Source: Berndt/Fantapié Altobelli/Sander, 2005, pp. 54-55. Primary data are collected specifically for objectives of the current study. Their
acquisition is usually more expensive and time-consuming than acquisition of
secondary data.138 Therefore, research based on primary data is conducted only in
137 See Bauer, 2002, pp. 74-75 and Berndt/Fantapié Altobelli/Sander, 2005, p. 54. 138 See Kotabe/Helsen, 1998, p. 154.

Steps and Methodologies of International Market Segmentation Analysis
43
the case, when information required for a particular study cannot be (or can be
only partially) found in readily available data material.139
Methods of primary data collection can be either quantitative or qualitative.
Quantitative methods are aimed at generating statistically representative
quantitative data. On the contrary, qualitative methods do not produce such type
of data, but are concentrated on providing a researcher with information on
respondents’ thoughts, subconscious feelings and need states. Such information is
often used to prepare, deepen or interpret the quantitative research. Besides, the
qualitative research can also be conducted independently from the quantitative
research (for instance, for the purpose of idea generation for new products). 140
As far as the scope of all existing primary data collection methods is very wide,
and the input data considered in the context of the international market
segmentation study presented later in the thesis are of quantitative nature,
description of methods is limited here to quantitative ones only.
In general, it can be distinguished between three quantitative approaches to
primary data collection: not-experimental surveys, not-experimental
observations, and experimental surveys and observation.141
Not-experimental surveys present the most important and widely used primary
data collection approach. Here a representative group of respondents is prompted
by means of stimuli (for instance, questions or illustrations) to make comments
with regard to an issue of investigation, which is presented by a researcher without
influencing it systematically.142 There are three basic types of non-experimental
surveys:143
1. Written surveys
Within the scope of a written survey, printed questionnaires are
delivered to respondents, filled in by them, and delivered back to
researches. No personal contact between researchers and respondents
139 See Berndt/Fantapié Altobelli/Sander, 2005, p. 64. 140 See Bauer, 2002, pp. 257-258 and Craig/Douglas, 2005, pp. 205-206. 141 See Meffert/Bolz, 1998, p. 88. 142 See Bauer, 2002, p. 184 and Berndt/Fantapié Altobelli/Sander, 2005, pp. 70-71. 143 See Bauer, 2002, pp. 185-190 and Berndt/Fantapié Altobelli/Sander, 2005, pp. 71-72.

Steps and Methodologies of International Market Segmentation Analysis
44
takes place here. Alternative forms of written surveys are presented in
Figure 3-2.
Figure 3-2 Forms of written surveys Source: Bauer, 2002, p. 186.
2. Verbal surveys
In the case of a verbal survey, direct communication takes place between an
interviewer and interviewee. Such surveys can be administered face-to-face
or by telephone (see Figure 3-3). Face-to-face surveys can take place in
respondent’s home or some location outside it (for instance, street, mall or
central-location). Moreover, both face-to-face and telephone surveys can be
conducted in the form of a conventional survey or computer assisted
survey (Computer Assisted Personal Interview (CAPI) in the case of
face-to-face surveys and Computer Assisted Telephone Interview
(CATI) in the case of telephone surveys). In the former case, an
interviewer works (in particular, reads questions and enters answers of an
interviewee) with a printed questionnaire, whereas in the latter case – with
a questionnaire in an electronic form. Besides, there is one more type of a
telephone interview, a relatively new and rarely deployed one: Completely
Automated Telephone Surveys (CATS). Here an interviewer is
Written Surveys
Questionnaires are sent: to respondents - per post;
back to researchers - per post
Researchers distribute and collect questionnaires personally
Questionnaires are distributed as print media inserts; questionnaires are sent
back to researches per post
Questionnaires are sent: to respondents - per fax;
back to researchers - per fax
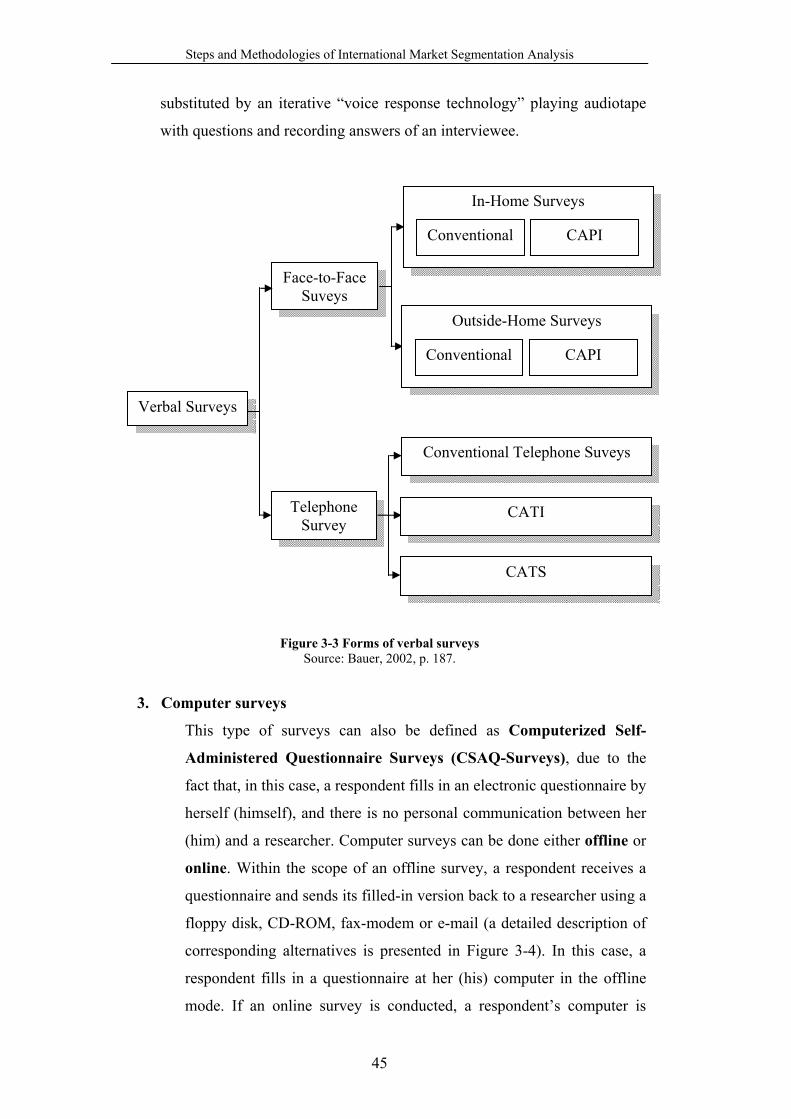
Steps and Methodologies of International Market Segmentation Analysis
45
substituted by an iterative “voice response technology” playing audiotape
with questions and recording answers of an interviewee.
Figure 3-3 Forms of verbal surveys Source: Bauer, 2002, p. 187.
3. Computer surveys
This type of surveys can also be defined as Computerized Self-
Administered Questionnaire Surveys (CSAQ-Surveys), due to the
fact that, in this case, a respondent fills in an electronic questionnaire by
herself (himself), and there is no personal communication between her
(him) and a researcher. Computer surveys can be done either offline or
online. Within the scope of an offline survey, a respondent receives a
questionnaire and sends its filled-in version back to a researcher using a
floppy disk, CD-ROM, fax-modem or e-mail (a detailed description of
corresponding alternatives is presented in Figure 3-4). In this case, a
respondent fills in a questionnaire at her (his) computer in the offline
mode. If an online survey is conducted, a respondent’s computer is
Verbal Surveys
Telephone Survey
Conventional Telephone Suveys
CATI
CATS
Face-to-Face Suveys
In-Home Surveys
Conventional CAPI
Outside-Home Surveys
Conventional CAPI

Steps and Methodologies of International Market Segmentation Analysis
46
permanently connected to a central computer managing this survey.
Possible forms of online surveys can also be found in Figure 3-4.
Figure 3-4 Forms of computer surveys Source: Bauer, 2002, p. 189.
Studio Computer Surveys
Online Surveys
Surveys Using Stand-Alone-Terminals
Surveys Using Online Sevices (for instance, AOL)
Web-Based Surveys
Surveys Using Cabel TV
Offline Surveys
Questionnaires are sent: to respondents - using floppy disks; back to researchers - using floppy
disks or e-mails
Questionnaires are sent: to respondents - using CD-ROMs; back to researchers - using floppy
disks or e-mails
Questionnaires are sent to respondents using fax-device;
questionnaires are received and sent back to researchers using fax-
modem
Questionnaires are sent: to respondents - using e-mails;
back to researchers - using e-mails
Computer Surveys

Steps and Methodologies of International Market Segmentation Analysis
47
Not-experimental observations take place, when a representative group of
observation objects is considered, and certain perceivable issues of investigation,
which are not systematically influenced by a researcher, are recorded in an orderly
fashion. Such data recordal can be done by a person or technical device.144
Correspondingly, one distinguishes between two groups of observations: 145
1. Personal observations (data are recorded by a person)
ο Conventional trade panel observations present a typical example
of personal observations. Here employees of a panel institute
periodically (normally, once per two months) contact companies
belonging to a trade panel and ascertain sales done in a
corresponding intervening period on the base of inventories and
purchase documents. Additionally, they register information about
prices, product placements and promotions undertaken during this
period.
ο In-store observations can be considered as a further example of
personal observations. With the help of such observations
researchers gather information on in-store distribution of products,
prices, displays, etc. for big samples of nationally representative
retail stores.
2. Automated observations (data are recorded by a technical device)
ο This group includes, for instance, observations of in-home-
scanning panels. Purchases of some particular products done by
members of a corresponding household panel and recorded by them
at home by means of a hand scanner are analyzed in this case.
ο Observations of TV-viewer panels are another example of
automated observations. Within their scope researchers analyze TV-
usage behavior of persons or households, which is recorded with the
help of a set or people meter146 – an accessory device attached to a
TV-set for registration of TV-usage duration and channel choice of
observation objects.
144 See Bauer, 2002, p. 237. 145 See ibid. pp. 237-240. 146 See Hammann/Erichson, 2000, p. 119.

Steps and Methodologies of International Market Segmentation Analysis
48
One talks about experimental surveys and observation, if issues of investigation
are systematically influenced by a researcher. Experimental surveys, observations
or combinations of them take place in the form of diverse test procedures. For
instance, concept tests and product tests can be found among them. Within the
scope of a concept test, a specific product idea or concept presented in verbal,
written or visual form is being assessed by test persons. During a product test, a
product itself serves as a test object, and its subjective quality is being examined.
Concept tests are normally used for identification of promising ideas or concepts
for new not yet existing products, whereas product tests normally help to obtain
information on market chances and improvement possibilities (in particular, on
ways to advance a product design and marketing concept) in the case of finished
(ready for selling) products. Correspondingly, concept tests usually precede
product tests.147
It should be mentioned while concluding this part of the thesis that although
secondary data have such advantages over primary data as easier accessibility,
relative inexpensiveness, quicker procurement, high reliability attributed to dealing
with better samples and better quality control of data collection procedures, and
providing with longitudinal data indispensable for dynamic segmentation analysis,
most market segmentation studies use primary data. This fact can be explained by
such disadvantages of secondary data as a mismatch of measurement units and data
classification definitions with those required for the current study, lack of the data
timeliness, and limited possibility to assess the data credibility.148
3.4 Selecting Basis and Descriptor Variables
3.4.1 Choice of Basis Variables
In order to decide which data should be used for cluster building or, in other
words, to define basis variables, the next two criteria should be considered: the
study goal and quality of basis variables. Aspects connected with these criteria are
discussed below.
147 See Hammann/Erichson, 2000, pp. 205-206 and Bauer, 2002, pp. 248-250. 148 See Bauer/Liu, 2006, p. 11.

Steps and Methodologies of International Market Segmentation Analysis
49
3.4.1.1 Study Goals
The choice of a particular segmentation base out of the limitless number of
existing alternatives should be made in accordance with goals of each particular
market segmentation study.149 Examples of such goals together with bases most
appropriate in the case of each of them are listed in Table 3-2.150
Goals of A Market Segmentation Study Segmentation Bases
Providing a general understanding of a market
Benefits sought Needs products will fill Product purchase and usage patterns Brand loyalty and switching patterns
Positioning studies (developing market segmentation strategies)
Product usage Product preference Benefits sought Needs products will fill Product-, user-, and self-perceptions
Studies of new product concepts (and new product introduction)
Reaction to new concepts (intention to buy, preference over current brand, etc.) Benefits sought Product usage patterns Price sensitivity
Studies of pricing decisions
Price sensitivity, by purchase and usage patterns Product, user, and self-images associated with products at different prices Product usage patterns Sensitivity to “deals”
149 See Struhl, 1992, p. 14. 150 As far as international market segmentation conducted within the scope of international market segmentation study presented later in this thesis has the form of exclusively consumer-related market segmentation, only consumer characteristics are considered as segmentation criteria from this point on.

Steps and Methodologies of International Market Segmentation Analysis
50
Studies of advertising decisions
Benefits sought Needs Psychographics/“life-styles” Product-, user-, and self-perceptions Media usage
Studies of distribution decisions Store loyalty and patronage Benefits sought in store selection Sensitivity to “deals”
Table 3-2 Correspondence between study goals and segmentation bases
Source: Wind, 1978, p. 320 and Struhl, 1992, pp. 14-15.
3.4.1.2 Quality of Basis Variables
The choice of basis variables also depends on their quality. In order to guarantee
effectiveness of international market segmentation, basis variables have to fulfill
certain requirements.
First of all, the next six criteria, which are commonly used for assessment of basis
variables in the case of national market segmentation,151 should also be considered
in the case of international market segmentation:152
- identifiably: the possibility to identify distinct segments;
- substantiality: the possibility to obtain segments of a substantial size;
- accessibility: the possibility to reach obtained segments with promotional
and distributional efforts;
- stability: the possibility to obtain segments with low temporal dynamic;
- actionability: the possibility to obtain segments useful for construction of
effective marketing strategies;
- responsiveness: the possibility to obtain segments, which respond to a
marketing effort uniquely.
Moreover, basis variables used in international market segmentation should exhibit
construct equivalence, or, in other words, they should present concepts equivalent
151 See Wedel/Kamakura, 2000, p. 7. 152 See Steenkamp/Ter Hofstede, 2002, p. 196.

Steps and Methodologies of International Market Segmentation Analysis
51
across countries. If this condition is not fulfilled, obtained transnational segments
will be biased by cross-national differences in the meaning of these variables.153
There are three types of construct equivalence:154
1. Functional equivalence
It is often the case that the same (different) objects or behaviors
perform different (the same) functions in different countries. For
instance, in some countries bicycles are viewed as means of
conveyance, whereas in other countries they are predominantly used for
recreation purposes. Of course, differences of this type are likely to
influence the structure and character of segments, and therefore it is
important to examine if basis variables present concepts having the
same role or function across countries (i.e., functionally equivalent
concepts).
2. Conceptual equivalence
Interpretation or application ways of the same concepts may differ from
country to country. In particular, concepts may be strongly culture-
bound or simply inexistent in some countries. For instance, in the USA
the concept of “a masculine life-style” is associated with frequent
reading of “Playboy” or big interest in sport news, whereas in Mexico –
with taking part in bullfights prevalently; such concept as “philotimo”
(“behaving in the way members of one’s in-group expect”155) exists
only in Greece. To be protected from appearance of corresponding
biases while conducting international market segmentation, the ability
of basis variables to present concepts existing and having the same
interpretation or application in different countries (i.e., conceptually
equivalent concepts) should be assessed.
3. Category equivalence
There can be differences in categorization of objects or behaviors
across countries too. The same (different) objects or behaviors may
153 See ibid. p. 198. 154 See Green/White, 1976, pp. 81-82, Kramer, 1991, pp. 121-125, Meffert/Bolz, 1998, pp. 90-92, Bauer, 2002, pp. 56-58, Steenkamp/Ter Hofstede, 2002, p. 198, and Craig/Douglas, 2005, pp. 188-190. 155 Craig/Douglas, 2005, p. 190.
Steps and Methodologies of International Market Segmentation Analysis
52
belong to different (the same) categories. For instance, in Netherlands
milk falls into the category “soft drinks”. At the same time, in many
other countries it is viewed as an additive for other drinks only. Again,
such differences in categorization should be avoided while segmenting
international markets. In other words, basis variables should present
concepts, which belong to the same category in different countries (i.e.,
categorically equivalent concepts).
However, fulfillment of the construct equivalence condition alone does not
guarantee that the quality of basis variables and thus reliability of corresponding
transnational segments is high. The quality of segmentation bases can be affected
by the process of input data collection and processing. Correspondingly, the
following equivalence conditions have to be fulfilled as well:156
1. Equivalence of research methods
ο Methodical equivalence of data collection: data collection methods,
which normally differ from country to country, must lead to equivalent
representation of national samples and equivalent internal validity of
survey results.
ο Tactical equivalence of data collection: partly nation-specific formats
and formulations of questions, which help to eliminate or minimize
biases typical for corresponding countries (for instance, item non-
response, politeness biases, socially desired answers), must be
developed.
ο Stimuli translation equivalence: translation of verbal and non-verbal
stimuli must be meaning-invariant.
ο Measurement method equivalence: measurement methods, which are
adjusted to a particular culture (culture fair) or independent of any
culture (culture free), must be used.
2. Equivalence of research objects
ο Definition equivalence: empirical definition of research objects must
be equivalent.
ο Choice equivalence: choice principles, methods, and techniques, which
lead to equivalent representation of national samples, must be used. 156 See Bauer, 2002, pp. 59-63.

Steps and Methodologies of International Market Segmentation Analysis
53
3. Equivalence of research situations
ο Temporal equivalence: national fieldworks must be conducted in such
way that the next two types of influencing factors can be controlled:
factors relating to the passage of time: social factors (for
instance, alteration of values), political factors (for instance,
legislation amendments), and economic factors (for instance,
economic cycle changes);
factors relating to the point in time: natural factors (for
instance, season, weather), political factors (for instance,
elections), religious factors (for instance, public holidays),
and economic factors (for instance, seasonal impacts).
ο Interaction equivalence: during all national data collection processes,
influence of an interviewer/researcher and any third party must be
controlled in an equivalent way.
4. Equivalence of research data processing
ο Response translation equivalence: there must be a semantic
equivalence between original and translated variants of responses.
ο Response categorization equivalence: categorization schemes of
responses must be equivalent.
3.4.2 Choice of Descriptor Variables
Descriptor variables are expected not only to make description and interpretation
of clusters more precise,157 but also to “facilitate the development and
implementation of strategies aimed at allocating marketing resources to take
advantage of heterogeneity in consumer behavior”158.
Correspondingly, the role of descriptor variables should be played by such
variables, which can be linked to both a segmentation base and performance
characteristics of marketing instruments. Typical examples of descriptor variables
are demographic characteristics, attitudes, and media usage.159
157 See Steinhausen/Langer, 1977, p. 21. 158 Frank/Massy/Wind, 1972, p. 19. 159 See Frank/Massy/Wind, 1972, pp. 17-18 and Struhl, 1992, p. 10.

Steps and Methodologies of International Market Segmentation Analysis
54
3.5 Conducting Analysis
3.5.1 Data Preparation
Before conducting segmentation analysis itself some preliminary transformation of
input data may be required. In this part of the thesis, such ways of data preparation
as preliminary data standardization as well as data preprocessing by means of
factor analysis are explicitly described.
3.5.1.1 Preliminary Data Standardization
The need for preliminary data standardization normally arises, if input data are
measured on rating scales of different length. In such case, input variables are
standardized to the zero mean and unit variance.160
As far as in the scope of the international market segmentation analyses presented
later in the thesis one deals with N input variables presenting N characteristics of J
individuals, input data are to be viewed as a data matrix X = [ jnx ] (j = 1,…, J; n =
1,…, N), where jnx are values of N variables (characteristics) for each of J
individuals. Standardization of an input data matrix X according to the way
mentioned above can then be described mathematically as follows: 161
jnz = n
njn
sxx − , (3-1)
where
jnx is a value of a variable n for an individual j
nx is the mean of a variable n over all individuals
ns = ∑=
−−
J
1j
)njn2x(x
1J1 is a standard deviation of a variable n values
jnz is a standardized value of a variable n for an individual j
160 See Aldenderfer/Blashfield, 1985, p. 20. 161 See Backhaus/Erichson/Plinke/Weiber, 2003, p. 271.

Steps and Methodologies of International Market Segmentation Analysis
55
3.5.1.2 Data Preprocessing Using Factor Analysis
Factor analysis is often used for preprocessing of input data in the case, when
presence of high correlation is noticed in them.162 It enables transformation of
input variables into new independent variables (the so-called factors), which leads
to exclusion of correlations from the data and thus to preventing appearance of
overemphasis distortions caused by highly correlated variables while conducting
segmentation analysis.163
Factor analysis interprets correlation between two variables as a result of existence
of a third hypothetical and unobservable magnitude called factor behind the
variables finding its expression in both of them.164
Factors not always contribute to correlation between variables. In particular, there
can be common and unique factors. If variation of a factor causes variation of at
least two variables, it is called a common factor. If one variable at most varies
with a factor, it is called a unique factor.165
Factor analysis can be used for an exploratory or confirmatory purpose
depending on the objectives of a researcher. Exploratory factor analysis is aimed
at data reduction and summarization by means of representing a set of observed
variables in terms of a smaller number of underlying factors. Confirmatory factor
analysis is aimed at testing specific hypothesis about the structure of the data.166
Of course, factor analysis used for preprocessing of input data is of an exploratory
type.
Conducting of factor analysis can be subdivided into the following general
steps:167
- constructing the correlation matrix;
- extracting factors;
- rotating and interpreting factors;
- calculating factor values.
162 See Aldenderfer/Blashfield, 1985, p. 21. 163 See Backhaus/Erichson/Plinke/Weiber, 2003, pp. 537-538. 164 See Überla, 1977, p. 2 and Backhaus/Erichson/Plinke/Weiber, 2003, p. 264. 165 See Lauwerth, 1980, p. 10. 166 See Green/Tull/Albaum, 1988, p. 554. 167 See Hammann/Erichson, 2000, p. 258.

Steps and Methodologies of International Market Segmentation Analysis
56
Main aspects of each step are presented below.
3.5.1.2.1 Constructing Correlation Matrix
A correlation matrix showing relationship between input variables (in the case of
the international market segmentation study presented later in the thesis – between
characteristics of individuals) is a necessary base for factor extraction. A
correlation matrix can be obtained from an input data matrix X = [ jnx ] (j = 1,…, J;
n = 1,…, N), where jnx are values of N variables for each of J individuals. Values
jnx have to be measured on a metric scale.168
An input data matrix X should be first transformed into a standardized data matrix
Z = [ jnz ] according to the way described in part 3.5.1.1 of the present thesis
because such transformation enables simplifying the standard formula of the
Pearson’s product-moment correlation coefficient between two variables n and k as
follows:169
nkr =
∑∑
∑
=
−
=
⋅−
=
−⋅−
J
1j
2kjk
J
1j
2njn
J
1jkjknjn
)z(z)z(z
)z(z)z(z =
1J
zz jkjn
J
1j
−
⋅∑=
, (3-2)
where
jnz is a standardized value of a variable n (correspondingly, k) for an individual j
nz is the mean of standardized values of a variable n (correspondingly, k) over all
individuals
168According to Gorsuch, 1974, pp. 127-128, data measured on the scales with metric (interval or ratio) characteristics is normally required for constructing a Pearson’s product-moment correlation coefficient presented below in equation (3-2). 169 According to Überla, 1977, pp. 50-51, in the standard form nkr =
ksnsnks
⋅, where nks
= ∑=
−⋅−−
J
1J)kzjk(z)nzjn(z1J
1 is covariance between variables n and k; under the condition of data
standardization, nkr is equal to nks , or in other words, a correlation matrix is equal to a covariance matrix.

Steps and Methodologies of International Market Segmentation Analysis
57
Values of a correlation coefficient range from -1 to +1, where the value of 0
indicates absence of relationship between variables. The closer its values to +1 (-1)
are, the stronger positive (negative) relationship between variables is.170
A symmetric correlation matrix R = [ nkr ] can then be presented in the following
way:171
R = [ nkr ] = 1J
1−
ZZ ′⋅ , (3-3)
where
Z′ is a transpose of a matrix Z
A correlation matrix is a good indicator of input data appropriateness for factor
analysis. A big number of low correlation coefficients casts doubt upon the
possibility to combine variables and extract a smaller number of factors, thus upon
the reasonability of conducting factor analysis.172
If it is difficult to make a conclusion about input data appropriateness for factor
analysis on the base of a correlation matrix itself, the following additional criteria
can be considered:173
− level of significance of correlations: shows the error probability of a
correlation coefficient being significantly different from zero.
Correspondingly, 1 minus the level of significance of a correlation
coefficient is equal to the probability that this correlation coefficient is
different from zero.
− inverse correlation matrix: it is assumed that a correlation matrix is
appropriate for factor analysis, if an inverse correlation matrix presents a
diagonal matrix, or, in other words, if its non-diagonal elements are close to
zero.
− Bartlett’s test: shows the probability that variables in a data set are
correlated and allows to indicate if a correlation matrix is different from a
unit matrix – a matrix showing that there is no correlation in the data – only
accidentally.
170 See Überla, 1977, p. 3. 171 See ibid. p. 51. 172 See Backhaus/Erichson/Plinke/Weiber, 2003, pp. 272-273. 173 See ibid. pp. 272-276.
Steps and Methodologies of International Market Segmentation Analysis
58
− anti-image covariance matrix: image is the part of variance of a variable,
which can be explained through other variables by means of multiple
regression analysis; anti-image is the part of variance of a variable, which
is independent from other variables. A correlation matrix is assumed to be
inappropriate for factor analysis, if non-diagonal elements of an anti-image
covariance matrix, which are not equal to zero (> 0.09), account for at least
25% of all non-diagonal elements.
− Kaiser-Meyer-Olkin (KMO) criterion: presents the measure of sampling
adequacy (MSA) calculated on the base of an anti-image correlation matrix.
It demonstrates to what degree variables belong together. Values of MSA
range between 0 and 1. If MSA ≥ 0.8, it is assumed that factor analysis is
appropriate.
3.5.1.2.2 Extracting Factors
Among a big number of existing factor-extraction techniques principal
component analysis (PCA) is considered to be especially efficient one.174 PCA
produces unique, reproducible results.175 It is a formal method directed at reduction
of complex relationships in the data to a more simple form, not at constructing
some specific hypotheses.176 PCA is a major factor-analytic technique used in
market research.177
The prime characteristic of PCA is that factors, here called “components”, are
extracted in such way that the first extracted factor accounts for the maximum
amount of the total variance in the data, the next extracted factor – for the
maximum amount of the rest variance, and so on. Moreover, the extracted factors
have to be mutually independent (in geometric representation – orthogonal).178
To start with factor extraction one should consider the basic assumption of factor
analysis that observed variables are linear combinations of several hypothetical
factors. Mathematically this assumption can be presented as follows:179
174 See Hammann/Erichson, 2000, p. 261. 175 See Green/Tull/Albaum, 1988, p. 566. 176 See Weber, 1974, p. 94. 177 See Wyss, 1991, p. 563. 178 See Überla, 1977, p. 99. 179 See Backhaus/Erichson/Plinke/Weiber, 2003, p. 278.
Steps and Methodologies of International Market Segmentation Analysis
59
jnz = j1n1 pa ⋅ + j2n2 pa ⋅ +…+ jqnq pa ⋅ +…+ jQnQ pa ⋅ (q = 1,…, Q), (3-4)
where
nqa is a loading of a factor q by a variable n
jqp is a factor value of a factor q for an individual j
Due to the fact that both variables and factors are standardized and factors are
uncorrelated, equation (3-4) can be viewed as an analog of a regression function
with factor loadings nqa as regression coefficients equal to simple correlations
between a variable and each factor.180
A matrix form of the basic assumption presents the basic equation of factor
analysis:181
Z = PA ⋅ (3-5)
This equation serves as a base for mathematical procedures leading to
determination of factor values discussed in the thesis later.182
Combining equation (3-5) with equation (3-3) leads to the following result:183
R =1J
1−
( )PA ⋅ ( )′⋅PA = A1J
1−
APP ′⋅′⋅ , (3-6)
As far as factor values jqp are standardized, 1J
1−
PP ′⋅ presents a correlation
matrix of factors C.184 In other words, one can rewrite equation (3-6) as follows:185
R = ACA ′⋅⋅ (3-7)
Due to independence of factors in PCA, C = I (a unit matrix). Consequently, one
obtains the next equation:186
R = AA ′⋅ (3-8)
180 See Green/Tull/Albaum, 1988, p. 563. 181 See Überla, 1977, p. 52 and Backhaus/Erichson/Plinke/Weiber, 2003, p. 278. 182 See Backhaus/Erichson/Plinke/Weiber, 2003, p. 278. 183 See Überla, 1977, p. 52. 184 See Überla, 1977, p. 52 and Backhaus/Erichson/Plinke/Weiber, 2003, p. 279. 185 See Überla, 1977, p. 52 and Backhaus/Erichson/Plinke/Weiber, 2003, p. 279. 186 See Überla, 1977, p. 52 and Backhaus/Erichson/Plinke/Weiber, 2003, p. 279.

Steps and Methodologies of International Market Segmentation Analysis
60
Equations (3-7) and (3-8) present the fundamental theorem of factor analysis.
They demonstrate the relationship between a correlation matrix R and matrix of
factor loadings A. The fundamental theorem points at the possibility to reproduce a
correlation matrix from a matrix of factor loadings A and correlation matrix of
factors C. Equation (3-8) is true only under condition of model’s linearity and
independence of factors.187
The more factors are extracted, the bigger part of variance in the data can be
explained. In PCA, variance of a variable is measured through squared correlations
between a variable and factors.188 In order to prove this, one should consider
variance of a variable under condition of data standardization:189
2ns = 1 = ∑
=−
J
1j
2jnz
1J1 (3-9)
Putting equation (3-4) into equation (3-9) leads to the next result:
2ns = 2
n1a1J
p2j1
−∑ + 2
n2a1J
p2j2
−∑ +…+ 2
nQa1J
p2jQ
−∑ +
+ 2( n1a n2a1Jpp j2j1
−∑ + …) (3-10)
As far as PCA assumes that factors are independent and standardized, 1J
p2jq
−∑ = 1
and 1Jpp j2j1
−∑ = 0. Correspondingly, equation (3-10) can be transformed into the
next one:
2ns = 2
n1a + 2n2a + … + 2
nQa = 1 (3-11)
Thus, the sum of all squared factor loadings (squared correlations) of one variable
is equal to variance of this variable, correspondingly, to 1.190
187 See Backhaus/Erichson/Plinke/Weiber, 2003, p. 279. 188 See Gorsuch, 1974, p. 86. 189 See Überla, 1977, pp. 56-57. 190 See ibid. p. 57.

Steps and Methodologies of International Market Segmentation Analysis
61
As it was already mentioned above, variance of variables can be explained by
common and unique factors. The part of variable’s variance which can be
accounted for by common factors is called communality 2nh .191
Picking R common factors out of all Q factors, one can present communality of a
variable n mathematically as follows:192
2nh = 2
n1a + 2n2a + … + 2
nRa (3-12)
The part of variable’s variance not attributed to common factors is called variable’s
uniqueness 2nu .193 Correspondingly, one can modify equation (3-11) as follows:194
2ns = 2
nh + 2nu = 1 (3-13)
Uniqueness can be additionally subdivided into variance explained by unique
factors 2nb indeed and variance caused by measurement errors 2
ne :195
2nu = 2
nb + 2ne (3-14)
Such additional subdivision seldom takes place in practice. It is normally assumed
that the whole uniqueness corresponds to the sum of squared unique factor
loadings.196
In order to connect the notion of communality and uniqueness with a correlation
matrix, one should modify equation (3-8) in the following way:197
R = )U(ΑU)(Α ′+⋅+ , (3-15)
where
R is a correlation matrix with unities in a diagonal
A is a matrix of common factor loadings
U is a diagonal matrix with unique factor loadings in a diagonal
As far as AU ′⋅ = UA ′⋅ = 0, opening the brackets leads to the next equation:198
191 See Gorsuch, 1974, p. 26. 192 See Überla, 1977, p. 57. 193 See Gorsuch, 1974, p. 26. 194 See Überla, 1977, p. 57. 195 See ibid. p. 57-58. 196 See ibid. 197 See ibid. p. 60.

Steps and Methodologies of International Market Segmentation Analysis
62
R = AA ′⋅ + UU ′⋅ , (3-16)
where
AA ′⋅ = hR is a reduced correlation matrix with values of communality 2nh in a
diagonal
UU ′⋅ = 2U is a diagonal matrix with values of uniqueness 2nu in a diagonal
PCA is aimed at comprehensive reproduction of a data structure through possibly
small number of factors. Distinction between communality and uniqueness is not
taken into consideration in PCA. There is no causal interpretation of factors here
either.199 In particular, PCA assumes that all variance of a variable can be
explained by common factors (“components”), and there is no uniqueness. Thus,
values of communality 2nh are always considered to be equal to 1, and values of
uniqueness 2nu are always substituted with zeros. Correspondingly, PCA always
extracts factors from a correlation matrix with unities in a diagonal, and, if all
feasible factors are extracted, or, in other words, if the number of extracted factors
is equal to the number of variables, a reproduced communality value should be
equal to 1. It becomes smaller than 1, only if a smaller number of factors than that
of variables is extracted, which is normally the case in PCA.200
In general, the notion of communality 2nh refers to variance of a variable explained
by all (extracted) common factors. If one considers the part of variance over all
variables explained by one particular factor, one talks about the notion of an
eigenvalue qλ .201
Correspondingly, it can be shown schematically that an eigenvalue qλ of each
factor is equal to a column sum of squared factor loadings in a matrix of factor
loadings A (see Figure 3-5). At the same time, communality 2nh of each variable
presents a row sum of squared factor loadings in a matrix of factor loadings A.
Factor loadings as elements of a column present correlations between a 198 See ibid. 199 According to Backhaus/Erichson/Plinke/Weiber, 2003, p. 292, due to this feature PCA is often separated from factor analysis and viewed as an independent procedure. Nevertheless, according to Basilevsky, 1994, p. 351, in established practice of the applied statistical literature, the term “factor analysis” refers to a group of methods used to explore or establish correlational structures between observed random variables, and PCA is included into this group. 200 See Backhaus/Erichson/Plinke/Weiber, 2003, pp. 291-292. 201 See ibid. p. 295.

Steps and Methodologies of International Market Segmentation Analysis
63
corresponding factor and variables, and as elements of a row – regression
coefficients between a corresponding variable and factors.202
An eigenvalue shows importance of a corresponding factor. In PCA, due to
maximization of the (residual) variance accounted by successive factors,
importance of factors decreases with every next factor extracted. The total
variance, which is equal to the sum of unit variances of standardized variables and
thus to the number of variables, appears to be redistributed between factors in a
decreasing manner. Usually, only several first factors accounting for the major part
of the total variance are considered to be important for analysis. After their
extraction, analysis is considered to be completed, and further factors are not
extracted.203
Factors
Variables
1 . . . q
. . . Q ∑
q
2nqa
1 11a . . . 1qa . . .
1Qa 21h
n n1a . . . nqa . . .
nQa 2nh
N N1a . . . Nqa . . .
NQa 2Nh
∑n
2nqa 1λ . . .
qλ . . . Qλ
Figure 3-5 Matrix of factor loadings
Source: Hammann/Erichson, 2000, p. 264.
There is no clear rule for determining the number of factors to be extracted. An
approach of every researcher is quite individual. Of course, there are several
criteria, which may help in solving a number-of-factors question.204
202 See Hammann/Erichson, 2000, pp. 263-264. 203 See Gorsuch, 1974, p. 130. 204 See Backhaus/Erichson/Plinke/Weiber, 2003, p. 295.
. . . .. .
.. . . . .
. . .
.. . . . .
.. . . . .
. . .

Steps and Methodologies of International Market Segmentation Analysis
64
The criterion most widely used in practice is the Kaiser criterion. According to it,
only factors with corresponding eigenvalues higher than 1 are to be extracted. In
other words, an extracted factor should account for the part of the total variance
that is bigger than unit variance of a standardized variable.205
Another important criterion is the scree-test. Here the scree-plot of eigenvalues of
the successively extracted factors has to be examined. Factor extraction has to be
stopped at the point, where eigenvalues begin to smooth out forming a strait line
with an almost horizontal slope.206 For instance, according to the scree-test
criterion, the last left point on a symbolic strait line at the right part of a graph
presented in Figure 3-6 points at a four-factor solution.207
Figure 3-6 Illustration of a scree-test Source: Überla, 1977, p. 128.
Other criteria proposed in the literature are: extracting factors until x% of the total
variance are explained; extracting n (some certain number of) factors; extracting
factors until their number is twice smaller than the number of variables, etc.208
In order to be protected from accepting dubious results, one may try to combine
various criteria and accept the outcome supported by several of them while
considering all other outcomes as experimental hypotheses. Of course, the outcome
205 See ibid. 206 See Kim/Mueller, 1978, p. 44. 207 See Überla, 1977, p. 127. 208 See Backhaus/Erichson/Plinke/Weiber, 2003, p. 314.
1.0
•
••
•• • •
• •
1 2 3 4 5 6 87 9
Eigenvalue
Number of a factor

Steps and Methodologies of International Market Segmentation Analysis
65
chosen according to this so-called general rule-of-thumb should be additionally
checked on the reasonableness on the base of the current standards in the research
field209.
3.5.1.2.3 Rotating and Interpreting Factors
After factors are extracted, they have to be interpreted and named. In PCA, factor
interpretation is aimed at finding a collective term for variables highly loaded on a
corresponding factor. In practice, a factor loading is considered to be high, if it is
≥ 0.5. If a variable is highly loaded on several factors, it should be taken into
consideration while naming each of them.210
It is quite easy to interpret factors, if every variable is highly loaded on only one of
them. This is often not the case, when a big amount of fieldworks is conducted, as
it is usually done in market research. Here interpretation of factors can become
highly complicated, and a factor loading pattern can even remain open for a
subjective judgment of a researcher.211
In order to improve the interpretation of factors, it is advisable to rotate them
beforehand.212
The easiest way to explain the notion of rotation is to consider a two-factor
solution. In such case, factors can be depicted as mutually perpendicular axes of
coordinates in a two-dimensional coordinate space. Standardized variables
presented as unit vectors in a multidimensional coordinate space of all existing
factors can be projected onto this two-dimensional coordinate space in the form of
arrows starting at the zero point. The length of each arrow is equal to 2n2
2n1 aa + .
In other words, it corresponds to the part of variance of a variable explained by
factor 1 and factor 2 (see Figure 3-7).213 Pulling the axes around the zero point and
changing in this way their position with regard to the arrows presenting variables is
nothing else but rotation in a factor analytic sense.214
209 See Kim/Mueller, 1978, p. 45. 210 See Backhaus/Erichson/Plinke/Weiber, 2003, pp. 298-299. 211 See ibid. p. 299. 212 See Hammann/Erichson, 2000, p. 265. 213 See ibid. pp. 264-266. 214 See Holm, 1976, p. 18.

Steps and Methodologies of International Market Segmentation Analysis
66
Factor rotations can be subdivided into two groups – orthogonal and oblique
rotations. Orthogonal rotations preserve the right angle between factors or, in
other words, their mutual independence. Oblique rotations lead to a loss of a
mutual perpendicularity between factors.215
Figure 3-7 Two-dimensional factor space Source: Backhaus/Erichson/Plinke/Weiber, 2003, p. 299.
In market research applications, PCA is almost always followed by the Varimax
rotation – a specific type of orthogonal rotations. The reason for this is that such
option allows for easier factor interpretation than any other option involving
oblique rotation.216
The Varimax rotation is aimed at producing some high loadings and some near-to-
zero loadings on each of the factors.217 In other words, by redistributing variance
between factors it simplifies columns of the matrix of factor loadings shown in
Figure 3-5.218
After the Varimax rotation is conducted, the successive factors do not account for
the maximum amount of the (residual) variance anymore. At the same time, the
215 See Green/Tull/Albaum, 1988, pp. 569-570. 216 See ibid. p. 572. 217 See ibid. p. 570. 218 See Hammann/Erichson, 2000, pp. 265-266.
F2
F1

Steps and Methodologies of International Market Segmentation Analysis
67
common variance accounted by factors as a group as well as communalities remain
unchanged.219
3.5.1.2.4 Calculating Factor Values
If the only interest of a researcher lies in transforming variables into a smaller
number of independent factors, factor analysis reaches its final point after
extracting, rotating and interpreting factors. Nevertheless, there is quite often the
need to describe individuals previously characterized through variables by means
of extracted, rotated and interpreted factors. In such case, one additional step has to
be made: finding factor values for each individual.220
A matrix of factor values P can be obtained from the basic equation of factor
analysis
Z = PA ⋅ (3-17)
by means of the following transformation
P = ZS ⋅ , (3-18)
where
S is a matrix of factor scores.221
The way of transformation from equation (3-17) to equation (3-18) has to be
chosen out of the following conditioned alternatives:
a) If all variance of a variable is explained by common factors, and if all
factors are extracted, a matrix of factor loadings A appears to be a square
matrix and can be inverted.222 In such case, both sides of equation (3-17)
can be multiplied by an inverse matrix A-1:
ZA 1 ⋅− = PAA 1 ⋅⋅− (3-19)
As far as AA-1 ⋅ is equal to a unit matrix I and PI ⋅ is equal to P, the
following transformation result can be obtained:223
P = ZA 1 ⋅− (3-20)
b) If all variance of a variable is explained by common factors, but not all of
them are extracted, a matrix of factor loadings A is not a square matrix 219 See Green/Tull/Albaum, 1988, p. 570. 220 See Hammann/Erichson, 2000, p. 267. 221 See ibid. p. 268. 222 See Überla, 1977, p. 237. 223 See Backhaus/Erichson/Plinke/Weiber, 2003, p. 302.
Steps and Methodologies of International Market Segmentation Analysis
68
anymore, and it is impossible to invert it.224 Here both sides of equation (3-
17) must be multiplied by a transposed matrix A′ :
ZA ⋅′ = PAA ⋅⋅′ (3-21)
A matrix ( )AA ⋅′ is a square matrix and can be inverted. Thus, it is possible
to multiply both sides of equation (3-21) by an inverted matrix ( ) 1AA −⋅′ :225
( ) ZAAA 1 ⋅′⋅⋅′ − = ( ) PA)A(AA 1 ⋅⋅′⋅⋅′ − (3-22)
As far as ( ) A)A(AA 1 ⋅′⋅⋅′ − is equal to a unit matrix I, and PI ⋅ is equal to
P, the next transformation result can be obtained:226
P = ( ) ZAAA 1 ⋅′⋅⋅′ − (3-23)
c) If variance of a variable can be explained by common factors only partly, a
matrix of common and unique factor loadings F= (A|U) = A+U includes a
bigger number of factors than that of variables.227 It is not a square matrix
and thus cannot be inverted. A matrix of factor scores S can be found in
such case only with the help of multiple regression.228
After a matrix of factor scores S is determined, it should be multiplied by a
standardized data matrix Z in order to obtain a factor value matrix P. Due to the
fact that a matrix of factor scores S is a (N×Q) matrix, and a matrix Z is a (J×N)
matrix, such multiplication is possible.
3.5.2 Finding Cluster Solution
In this part of the thesis, a-posteriori descriptive segmentation methods are
considered. In particular, peculiarities of only those methods, which are used
within the scope of international market segmentation study presented later in this
thesis – cluster analysis and self-organizing map (a specific type of artificial neural
networks), are covered here.
224 See Überla, 1977, p. 237. 225 See Backhaus/Erichson/Plinke/Weiber, 2003, p. 303. 226 See ibid. 227 According to Überla, 1977, p. 59, a matrix F is a (N × R+N) matrix, where R is the number of common factors. 228 See Überla, 1977, pp. 241-246.

Steps and Methodologies of International Market Segmentation Analysis
69
3.5.2.1 Cluster Analysis
Cluster analysis is the most commonly used generic term for techniques aimed at
data separation into component groups.229 Cluster analysis helps to solve a
complicated task of grouping classification objects (in the case of the international
market segmentation study presented later in the thesis – of grouping individuals)
on the base of all their characteristics simultaneously.230
Any type of cluster building is based on the notion of homogeneity or, in other
words, on the notion of homogeneous groups, which can be expressed through the
next two conditions:231
1. Homogeneity within a cluster: classification objects belonging to one
homogeneous group must be similar to each other.
2. Heterogeneity between clusters: classification objects belonging to
different homogeneous groups must be different from each other.
In general, techniques of cluster analysis are used for achieving the following
principal goals:
“a) development of a typology or classification,
b) investigation of useful conceptual schemes for grouping entities,
c) hypothesis generation through data exploration,
d) hypothesis testing, or the attempt to determine if types defined through
other procedures are in fact present in a data set”232.
Development of a classification is considered to be the most frequent use of cluster
analysis. Nevertheless, in applied data analysis several goals of cluster analysis are
usually combined to form a basis of a study.233
Two general problems are addressed in cluster analysis:234
1. Choosing a proximity measure.
2. Choosing a grouping method. 229 According to Everitt, 1974, p. 1, these techniques can also be referred to as techniques of classification, typology, Q-analysis, grouping, clumping, numerical taxonomy, and unsupervised pattern recognition. Such name variety can be explained by importance of the techniques in diverse research fields. 230 See Hammann/Erichson, 2000, pp. 270-271 and Backhaus/Erichson/Plinke/Weiber, 2003, p. 480. 231 See Bacher, 1996, p. 2. 232 Aldenderfer/Blashfield, 1985, p. 9. 233 See Aldenderfer/Blashfield, 1985, p. 9. 234 See Green/Tull/Albaum, 1988, p. 579 and Hammann/Erichson, 2000, pp. 271-272.

Steps and Methodologies of International Market Segmentation Analysis
70
Various proximity measures and grouping methods including those used in the
international market segmentation study presented later in the thesis (the Euclidean
distance and the Ward’s and K-means methods respectively) are described below.
3.5.2.1.1 Proximity Measures
Before conducting grouping of individuals itself a similarity or distance matrix
must be constructed. It is normally calculated from a raw data matrix X = [ jnx ] (j
= 1,…, J; n = 1,…, N) presenting a set of J individuals characterized by a set of N
variables. A similarity (distance) matrix includes similarity values jis (distance
values jid ) between two individuals j and i.235 Similarity values jis or distance
values jid are quantified by pairwise proximity measures.236
Correspondingly, there are two classes of pairwise proximity measures:237
1. Similarity measures reflecting the similarity between two individuals: the
higher the similarity measure is, the more similar the individuals are.
2. Distance measures reflecting the dissimilarity between two individuals:
the higher the distance measure is, the more different the individuals are.
As far as a similarity (distance) between two individuals is assumed not to be
influenced by the order of their comparison, or, in other words, it is assumed that
jis = ijs ( jid = ijd ), a similarity matrix S = [ jis ] (a distance matrix D = [ jid ]) is a
symmetric J × J matrix (see Figure 3-8).238
1 12s . . . 1Js 0 12d . . . 1Jd
S = 21s 1 . . . 2Js D = 21d 0 . . . 2Jd
J1s J2s . . . 1 J1d J2d . . . 0
Figure 3-8 Similarity and distance matrices Source: Duran/Odell, 1939, pp. 5-6.
235 See Backhaus/Erichson/Plinke/Weiber, 2003, pp. 482-483. 236 According to Green/Tull/Albaum, 1988, p. 581, pairwise proximity measures are used by majority of cluster analysis techniques. 237 See Backhaus/Erichson/Plinke/Weiber, 2003, p. 483. 238 See Bock, 1974, p. 25.
Similarity Matrix Distance Matrix
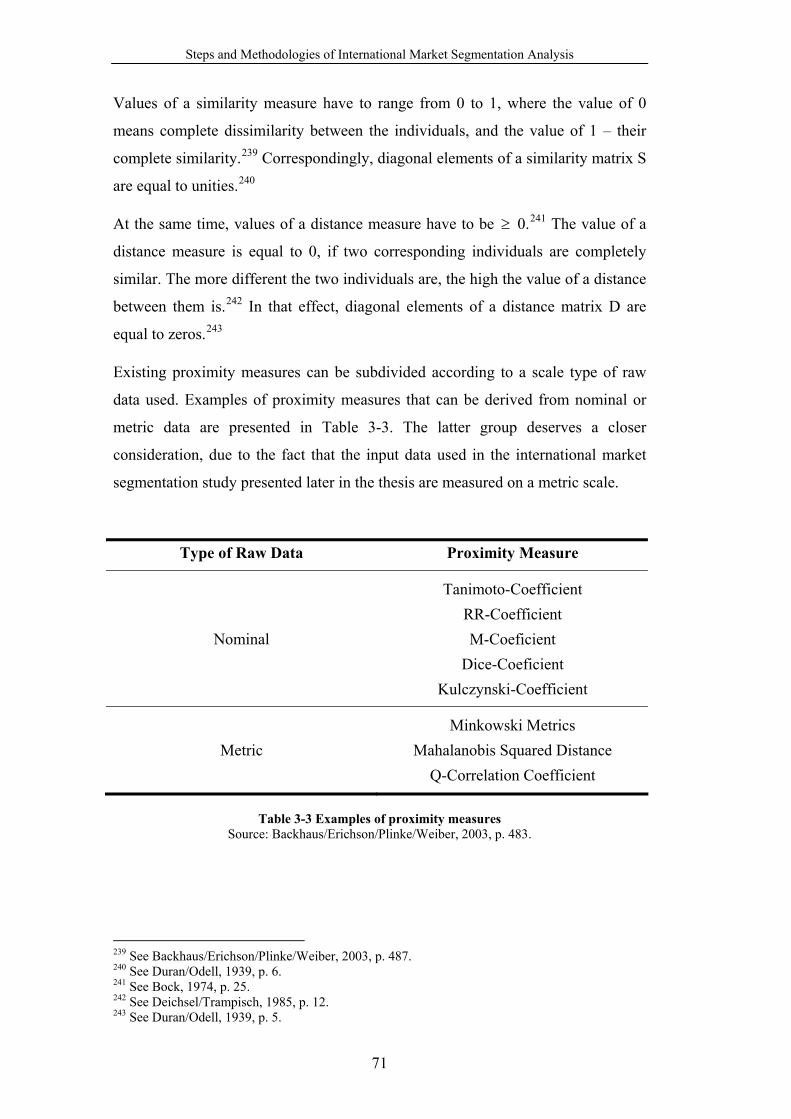
Steps and Methodologies of International Market Segmentation Analysis
71
Values of a similarity measure have to range from 0 to 1, where the value of 0
means complete dissimilarity between the individuals, and the value of 1 – their
complete similarity.239 Correspondingly, diagonal elements of a similarity matrix S
are equal to unities.240
At the same time, values of a distance measure have to be ≥ 0.241 The value of a
distance measure is equal to 0, if two corresponding individuals are completely
similar. The more different the two individuals are, the high the value of a distance
between them is.242 In that effect, diagonal elements of a distance matrix D are
equal to zeros.243
Existing proximity measures can be subdivided according to a scale type of raw
data used. Examples of proximity measures that can be derived from nominal or
metric data are presented in Table 3-3. The latter group deserves a closer
consideration, due to the fact that the input data used in the international market
segmentation study presented later in the thesis are measured on a metric scale.
Type of Raw Data Proximity Measure
Nominal
Tanimoto-Coefficient RR-Coefficient M-Coeficient
Dice-Coeficient Kulczynski-Coefficient
Metric Minkowski Metrics
Mahalanobis Squared Distance Q-Correlation Coefficient
Table 3-3 Examples of proximity measures
Source: Backhaus/Erichson/Plinke/Weiber, 2003, p. 483.
239 See Backhaus/Erichson/Plinke/Weiber, 2003, p. 487. 240 See Duran/Odell, 1939, p. 6. 241 See Bock, 1974, p. 25. 242 See Deichsel/Trampisch, 1985, p. 12. 243 See Duran/Odell, 1939, p. 5.

Steps and Methodologies of International Market Segmentation Analysis
72
The class of metric distance functions called Minkowski metrics or L-norms
presents proximity measures for metric variables widely used in practical
applications.244 Minkowski metrics are defined in a general form as follows:245
jid = r1
N
1n
r
injn xx ⎟⎠
⎞⎜⎝
⎛−∑
=
with 1r ≥ , (3-24)
where
jnx is a value of a variable (characteristic) n for an individual j (correspondingly,
i)
r is the Minkowski constant
If r = 2, one obtains the equation of the classical quadratic distance (Euclidean
distance or L2-norm); if r = 1, one obtains the equation, which depends on the
absolute value of differences between classification objects (Manhattan distance
or L1-norm); if r +∞→ , one obtains the equation of the maximum absolute
difference between classification objects (dominance metric).246
The Euclidean distance is the most often used proximity measure for metric
variables. It can be easily explained in a two-dimensional coordinate space
structured through variables as axes of coordinates (see Figure 3-9). j1x , j2x and
i1x , i2x are projections of points J and I on axis 1 and axis 2. These projections
correspond to values of the two variables (characteristics) for individuals j and i.
The Euclidean distance is presented by the shortest line between these two points,
in other words, by the hypotenuse of the triangle JOI.247
According to the Pythagorean Theorem, the square of the hypotenuse is equal to
the sum of squares of the sides of the right angle.248 Correspondingly, the
Euclidean distance for a multidimensional coordinate space of N variables can be
defined as follows:249
244 See Backhaus/Erichson/Plinke/Weiber, 2003, p. 491. 245 See Eckes, 1980, p. 45 and Backhaus/Erichson/Plinke/Weiber, 2003, pp. 491-492. 246 See Eckes, 1980, pp. 45-46, Jambu/Lebeaux, 1983, p. 93, and Backhaus/Erichson/ Plinke/Weiber, 2003, p. 492. 247 See Matiaske, 1994, p. 3. 248 See ibid. pp. 3-4. 249 See Aldenderfer/Blashfield, 1985, p. 25.

Steps and Methodologies of International Market Segmentation Analysis
73
jid = ∑=
−N
1n
2injn )x(x (3-25)
In practice, it is usually preferred to square a value of a distance jid avoiding in
this way the use of a square root. The obtained 2jid is called the squared
Euclidean distance.250
Figure 3-9 Euclidean distance in a two-dimensional space Source: Matiaske, 1994, p. 4.
The Manhattan distance or city-block metric is another popular proximity
measure for metric variables. It is defined as follows:251
ji(1)d = ∑=
−N
1ninjn xx (3-26)
In the two-dimensional coordinate space presented in Figure 3-9, the Manhattan
distance is equal to the sum of the sides of the right angle in the triangle JOI.252
The dominance metric or supremum metric is rather of theoretical importance. It
is defined as follows:253
250 See ibid. 251 See ibid. 252 See Matiaske, 1994, p. 6.
J
O
I
j1x
j2x
i1x
i2x
i1j1 xx −
i2j2 xx −
Variable 2
Variable 1

Steps and Methodologies of International Market Segmentation Analysis
74
)ji(d +∞ = injnnxxmax − (3-27)
In the two-dimensional coordinate space presented in Figure 3-9, the dominance
metric is equal to the longest side of the right angle in the triangle JOI (side OI).254
In general, it should be mentioned that the level of contribution of distances
measured on separate variables to calculation of the Minkowski metrics depends
on the size of the Minkowski constant r. With its increase, contribution of big
distances increases, whereas contribution of small ones decreases.255
Minkowski metrics are not scale-invariant. Therefore, if raw variables are
measured on rating scales of different length, one has first to standardize them to
unit variances and zero means.256
Moreover, neither of measures allows for correlations between variables.257
Therefore, if highly correlated variables are present in raw data, preliminary factor
analysis should be conducted.258
One more important proximity measure for metric variables is the Mahalanobis
squared distance defined as follows:259
ji(mah)d = )X -(X)X -(X ij-1
ij Σ′ , (3-28)
where
Σ is a within-groups variance-covariance matrix,
jX is a vector of values of all variables (characteristics) for an individual j
(correspondingly, i)
The advantage of this proximity measure over Minkowski metrics is that it allows
for correlation between variables. If all variables are uncorrelated, the Mahalanobis
squared distance is equivalent to the Euclidean distance derived from standardized
variables.260
253 See Eckes, 1980, p. 46. 254 See ibid. 255 See ibid. 256 See Aldenderfer/Blashfield, 1985, p. 26. 257 See Everitt, 1974, p. 57 and Aldenderfer/Blashfield, 1985, pp. 25-26. 258 See Green/Tull/Albaum, 1988, p. 581. 259 See Gordon, 1981, p. 25 and Aldenderfer/Blashfield, 1985, p. 25. 260 See Everitt, 1974, p. 57 and Aldenderfer/Blashfield, 1985, pp. 25-26.

Steps and Methodologies of International Market Segmentation Analysis
75
Finally, a different type of a proximity measure for metric variables – a similarity
measure – is presented by the Q-correlation coefficient defined in the next
way:261
jir =
∑∑
∑
==
=
⋅
−⋅−
−−
N
1niin
N
1njjn
N
1niinjjn
22 )x(x)x(x
)x(x)x(x, (3-29)
where
jx is the mean of the values of all variables (characteristics) for an individual j
(correspondingly, i)
In other words, the Q-correlation coefficient measures a similarity between two
classification objects j and i under consideration of all their characteristics. It is the
Pearson’s product-moment correlation coefficient adapted for measurement of
correlation between individuals.262
As a similarity measure the Q-correlation coefficient possesses completely
different features with regard to profiles of individuals (see Figure 3-10) than
distance measures. Distance measures consider the distance between the profiles,
whereas similarities – the slope of them. The profiles of individual j and i
presented in Figure 3-10 are viewed as different, if one uses distance measures. At
the same time, they are considered to be absolutely equal, when similarity
measures are used.263
This important difference between distance and similarity measures points at the
necessity to take into consideration the context of analysis while choosing a
proximity measure. Distance measures should be used, if the absolute distance
between classification objects is of interest, whereas similarity measures are
appropriate, when similarities in trend of classification objects’ profiles and not
differences in their levels must be considered.264
261 See Backhaus/Erichson/Plinke/Weiber, 2003, p. 494. 262 See Aldenderfer/Blashfield, 1985, p. 22. 263 See Matiaske, 1994, p. 7. 264 See Backhaus/Erichson/Plinke/Weiber, 2003, p. 496.

Steps and Methodologies of International Market Segmentation Analysis
76
Figure 3-10 Profiles of individuals j and i Source: Matiaske, 1994, p. 7.
In the case of the international market segmentation study presented later in the
thesis, the Euclidean distances are chosen as a proximity measure because
- the input data are measured on a metric scale;
- the Euclidean distances are primarily appropriate for grouping methods
considered (the Ward’s and K-means methods).
3.5.2.1.2 Grouping Methods
A variety of existing grouping methods can be roughly classified into the following
types:265
− hierarchical methods: here already existing groups are classified into new
groups, and this process is repeated at successive steps of grouping, in
order to form a hierarchy. Hierarchical methods are subdivided into
agglomerative and divisive methods. Agglomerative methods start with J
groups including one individual each and combine the two most similar
individuals. Continuing in this way, all individuals appear to be combined
into one group. Divisive methods consider all individuals as one group first
and then subdivide them into two groups. At the next step, each of these
groups is subdivided again. The group subdivision continues till there are J
groups with one individual in each of them.266
265 See Everitt, 1974, p. 7. 266 See Tücke, 1976, p. 21.
Individual j
Individual i
Variable
Level
1
2
3
4
1 2 3 4

Steps and Methodologies of International Market Segmentation Analysis
77
− optimization-partitioning methods: here groups are formed through
optimization of some predefined clustering criteria. The groups do not
overlap, thus the partition of individuals is formed.
− density or mode-seeking methods: here groups are formed through
identification of regions with a relatively high density of individuals. The
groups do not overlap here either.
− clumping methods: here groups are allowed to overlap.
− others: these methods cannot be clearly assigned to any of the mentioned
above groups (for instance, Q technique of factor analysis – factor analysis
exploring relationship between individuals, not between their
characteristics).
In the case of the international market segmentation study presented later in the
thesis, the Ward’s and K-means grouping methods are used. A special interest in
these two methods is due to their high application frequency and prominence in the
area of market segmentation.
3.5.2.1.2.1 Ward’s Method
The Ward’s method belongs to the family of hierarchical agglomerative grouping
methods.267 All hierarchical agglomerative methods start with constructing a (J× J)
similarity or distance matrix including similarities or distances between all
1)J(J21
− possible pairs of individuals.268 Only distance measures are appropriate
for the Ward’s method, and the squared Euclidean distances are the primary used
ones.269 Correspondingly, it is allowed for raw data used in the case of the Ward’s
method neither to be measured on ratings of different length nor to be highly
correlated. As it was already mentioned above, if these conditions are not fulfilled,
preprocessing of raw data by means of standardization or factor analysis is
required.270
267 See Backhaus/Erichson/Plinke/Weiber, 2003, p. 499. 268 See Lorr, 1983, p. 84. 269 See Steinhausen/Langer, 1977, p. 81 and Backhaus/Erichson/Plinke/Weiber, 2003, p. 505. 270 For more details see part 3.5.2.1.1 of the present thesis.
Steps and Methodologies of International Market Segmentation Analysis
78
At the first step of clustering, all hierarchical agglomerative methods combine the
two least different individuals (groups) into a new group.271 Therewith, the number
of existing groups R = J decreases by 1, and the two rows and two columns
presenting combined individuals in the distance matrix have to be substituted with
a new row and column presenting a new group. In other words, new distances – the
ones between a new group and other individuals (groups) – have to be calculated,
in order to construct a corresponding reduced (J-1× J-1) distance matrix used as a
base for the next clustering step. At this point, differences between hierarchical
agglomerative grouping methods arise because they define these new distances in
different ways.272 These ways can be summarized by the next general formula:273
f(ji),d = |dd|ecdbdad ifjfjiifjf −+++ , (3-30)
where
f(ji),d is a distance between a new group consisting of individuals (groups) j and i
and individual (group) f.
jfd is a distance between an individual (group) j and individual (group) f
ifd is a distance between an individual (group) i and individual (group) f
jid is a distance between an individual (group) j and individual (group) i
a, b, c, e are constants changing from method to method
The Ward’s method is aimed at the construction of maximally homogeneous
clusters in such way that the loss of information at every step of clustering is as
small as possible and at the same time quantifiable in a readily interpretable form.
The information loss is defined here in the form of the error sum of squares (also
called the variance criterion). The method combines those individuals (groups) at
every step of clustering, whose fusion results in the minimum increase in the error
sum of squares.274
The error sum of squares for a group r (r = 1,…, R) is defined as follows:275
271 This holds for all successive clustering steps as well. 272 See Backhaus/Erichson/Plinke/Weiber, 2003, pp. 503-504. 273 See Steinhausen/Langer, 1977, p. 76 and Backhaus/Erichson/Plinke/Weiber, 2003, p. 505. 274 See Bijnen, 1973, p. 41, Steinhausen/Langer, 1977, p. 80, Everitt, 1993, p. 65, and Backhaus/Erichson/Plinke/Weiber, 2003, p. 511. 275 See Tücke, 1976, p. 23.

Steps and Methodologies of International Market Segmentation Analysis
79
rESS = ∑∑= =
−rJ
1j
N
1n
2nrjnr )x(x , (3-31)
where
jnrx is a value of a variable (characteristic) n (n = 1,…, N) for an individual j (j =
1, …, J) from a group r (r = 1,…, R) including rJ individuals
nrx = r
J
1jjnr
J
xr
∑= is the mean of values of a variable (characteristic) n (n = 1,…, N)
for individuals in a group r (r = 1,…, R)
Before clustering starts, every individual presents an independent group, and the
error sum of squares is equal to zero. Each squared Euclidean distance in the
distance matrix is equal to a doubled increase in the error sum of squares arising at
fusion of a corresponding pair of individuals (groups). Correspondingly, the two
individuals (groups) combined at the first clustering step (the ones, whose fusion
causes the minimum increase in the error sum of squares) are also the two least
different individuals (groups) in terms of the squared Euclidean distances.276
Each of the distances between a new group and all other individuals (groups) is
calculated by the Ward’s method in such way that it is also equal to a doubled
increase in the error sum of squares arising at fusion of a corresponding pair of
individuals.277 Here a =fij
fj
nnnnn++
+, b =
fij
fi
nnnnn++
+ , c = fij
f
nnnn++
− and e =
0, and correspondingly:278
f (ji),d = [ ]jififfijffjfij
dn)dn(n)dn(nnnn
1−+++
++, (3-32)
where
jn is the number of individuals in a group j (correspondingly i, f)
In other words, due to such updating of the distance matrix, all distance values in
the reduced distance matrix at any following step of clustering are equal to
corresponding doubled increases in the error sum of squares, and the clustering
276 See Backhaus/Erichson/Plinke/Weiber, 2003, pp. 511-512. 277 See ibid. p. 512. 278 See Steinhausen/Langer, 1977, pp. 79-80.

Steps and Methodologies of International Market Segmentation Analysis
80
process can be continued in an analogous to the first step way. The total error sum
of squares existing after completion of each clustering step can also be calculated
as the sum of increases in the error sum of squares obtained at each of the fusions
of individuals (groups), which have already taken place.279
Successive fusions of individuals (groups) conducted according to the Ward’s
method can be portrayed in the form of a tree diagram called dendrogram (see
Figure 3-11). All J-1 successive clustering steps (in the form of branches of a tree
diagram) together with total error sums of squares obtained after combining
individuals (groups) at each corresponding step are depicted here. At the lowest
level of a dendrogram each individual presents an independent group, whereas at
its highest level all individuals (groups) are combined into one large group.280
Figure 3-11 Example of a dendrogram (the Ward’s method)
Source: Backhaus/Erichson./Plinke/Weiber, 2003, p. 515.
In the case of hierarchical clustering, one has to select the appropriate partition of
individuals (groups) (in other words, the appropriate number of clusters) out of
alternatives presented through the sequence of fusions and stop combining
individuals (groups) at a corresponding clustering step.281
One commonly used approach helping to determine the appropriate number of
clusters is based on the so-called scree-diagram (see Figure 3-12). The abscissa of
the scree-diagram presents quantities of clusters at successive clustering steps
279 See Backhaus/Erichson/Plinke/Weiber, 2003, pp. 513-515. 280 See Everitt, 1974, p. 8, Eckes, 1980, p. 76, Aldenderfer/Blashfield, 1985, p. 36, and Backhaus/Erichson/Plinke/Weiber, 2003, p. 515. 281 See Everitt, 2001, p. 138.
Clustering step 4
3
2
1
Total error sum of squares
total4ESS
total3ESS
total2ESS
total1ESS
Individuals: #1 #2 #3 #4 #5
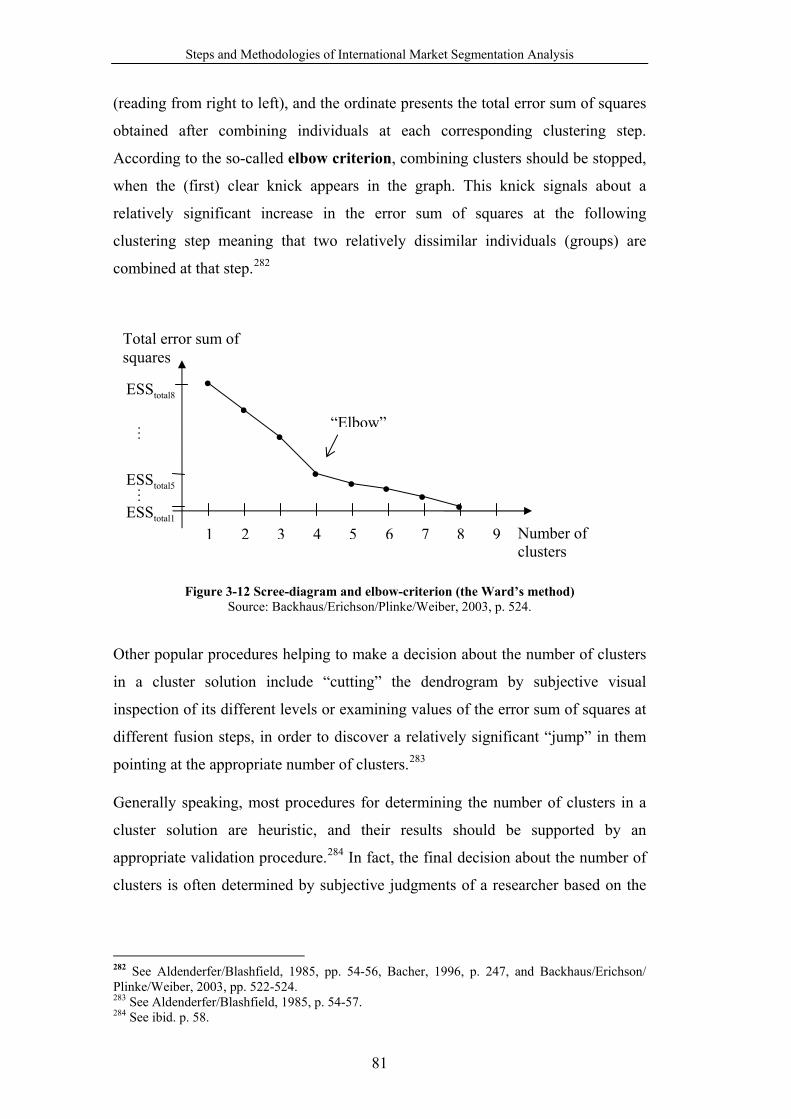
Steps and Methodologies of International Market Segmentation Analysis
81
(reading from right to left), and the ordinate presents the total error sum of squares
obtained after combining individuals at each corresponding clustering step.
According to the so-called elbow criterion, combining clusters should be stopped,
when the (first) clear knick appears in the graph. This knick signals about a
relatively significant increase in the error sum of squares at the following
clustering step meaning that two relatively dissimilar individuals (groups) are
combined at that step.282
Figure 3-12 Scree-diagram and elbow-criterion (the Ward’s method)
Source: Backhaus/Erichson/Plinke/Weiber, 2003, p. 524.
Other popular procedures helping to make a decision about the number of clusters
in a cluster solution include “cutting” the dendrogram by subjective visual
inspection of its different levels or examining values of the error sum of squares at
different fusion steps, in order to discover a relatively significant “jump” in them
pointing at the appropriate number of clusters.283
Generally speaking, most procedures for determining the number of clusters in a
cluster solution are heuristic, and their results should be supported by an
appropriate validation procedure.284 In fact, the final decision about the number of
clusters is often determined by subjective judgments of a researcher based on the
282 See Aldenderfer/Blashfield, 1985, pp. 54-56, Bacher, 1996, p. 247, and Backhaus/Erichson/ Plinke/Weiber, 2003, pp. 522-524. 283 See Aldenderfer/Blashfield, 1985, p. 54-57. 284 See ibid. p. 58.
Total error sum of squares
•
•
•
•
“Elbow”
1 2 3 4 5 6 87 9
• • ••
. . .
. . .
Number of clusters
total5ESS
total1ESS
total8ESS

Steps and Methodologies of International Market Segmentation Analysis
82
knowledge or hypothesis about the data structure or, pragmatically, by
interpretation ease.285
3.5.2.1.2.2 K-means Method
The K-means method is a specific type of optimization-partitioning grouping
methods. The central idea of most optimization-partitioning grouping methods lies
in improving some specified initial partition of individuals by means of moving
individuals between groups. In different optimization-partitioning methods, the
notion of improved partition is defined in different way.286 The K-means method
attempts to improve the initial partition so that the within-groups sum of squares,
which can also be interpreted as the total error sum of squares, is minimized.287
The within-groups sum of squares is defined here as follows:288
wSS = ∑∑∑= = =
−K
1k
J
1j
N
1n
2nkjnk
k
)x(x , (3-33)
where
jnkx is a value of a variable (characteristic) n (n = 1,…, N) for an individual j (j =
1,…, J) from a cluster k (k = 1,…, K) including kJ individuals
nkx = k
J
1jjnk
J
xk
∑= is the centroid of a cluster k (k = 1,…, K) for a variable n (in other
words, it is the mean of values of a variable n in a cluster k)
Due to the fact that ∑=
−N
1n
2nkjnk )x(x is equal to the squared Euclidean distance
between an individual j (j = 1,…, J) from a cluster k (k = 1,…, K) and centroid of a
cluster k in a multidimensional space of N variables, the within-groups sum of
squares can be expressed in the next equivalent form:289
wSS = ∑∑= =
K
1k
J
1j
2jk
k
d , (3-34)
285 See Steinhausen/Langer, 1977, p. 171. 286 See Anderberg, 1973, p. 158 and Steinhausen/Langer, 1977, p. 100. 287 See Bacher, 1996, pp. 308-309. 288 See ibid. p. 308. 289 See ibid. p. 309.

Steps and Methodologies of International Market Segmentation Analysis
83
where 2jkd is the squared Euclidean distance between an individual j (j = 1,…, J) from a
cluster k (k = 1,…, K) and centroid of a cluster k in a multidimensional space of N
variables
The K-means method does not require calculation and storage of a (J× J) similarity
or distance matrix including similarities or distances between 1)J(J21
− possible
pairs of individuals. It works with raw data directly.290 This feature may appear to
be quite advantageous while analyzing large data sets.
In the case of the K-means method, clusters are constructed according to the
following optimization-partitioning algorithm:291
a) find initial cluster centroids of predetermined by a researcher number K;
b) allocate each individual to the cluster centroid closest in terms of the
squared Euclidean distances and minimize in this way the within-groups
sum of squares;292
c) after all individuals are assigned to the clusters, compute new cluster
centroids;
d) repeat steps b) and c) until no change in cluster membership of individuals
occurs.
In practice, there is a great variety of different approaches to identifying initial
cluster centroids. For instance, they can be found by means of some other grouping
method or assigned at random.293 Within the scope of the international market
segmentation study presented later in the thesis, initial cluster centroids are
acquired as follows:294
- first K individuals are regarded as provisional cluster centroids;
290 See Aldenderfer/Blashfield, 1985, p. 46. 291 See Bacher, 1996, pp. 309-310. 292 It should be mentioned that the SPSS software (version 11) used within the scope of the international market segmentation analyses presented later in the thesis allocates individuals to the cluster centroid closest not in terms of the squared Euclidean distances, but in terms of the Euclidean distances. This, however, does not change the rationale of the algorithm because distances between individuals are non-negative numbers. 293 See Everitt, 1993, p. 94. 294 According to Brosius, 2002, pp. 670-671, such procedure is designated in the SPSS software (version 11).

Steps and Methodologies of International Market Segmentation Analysis
84
- each of the remaining J - K individuals is examined on her ability to present
a better cluster centroid and is substituted with the closest to her already
existing provisional centroid, if one of the following conditions is met:
ο the Euclidean distance between a new individual and the closest to
her provisional cluster centroid is bigger than the Euclidean
distance between the two closest provisional centroids,
ο the Euclidean distance between a new individual and the closest to
her provisional cluster centroid is bigger than the Euclidean
distance between this provisional cluster centroid and the closest to
it provisional cluster centroid;
- the cluster centroids originated after one-time examining of all J - K
individuals are considered to be the initial cluster centroids.
In other words, one deals in this case with the Euclidean distances between
individuals. Correspondingly, if scales of raw data are different, or if raw data are
highly correlated, their preprocessing by means of standardization or factor
analysis is required.295
It should be mentioned that the optimization-partitioning algorithm described
above does not necessary lead to the global minimum of the within-groups sum of
squares (the so-called global optimum). The global optimum would be found, if
one formed all possible partitions of individuals and compared them. However,
this task is computationally not feasible already for a moderate amount of data
because the number of possible partitions becomes astronomical. The algorithm
described above belongs to the procedures, which were developed to approximate
the global optimum while sampling only a small part of all possible partitions.296
In order to ensure a good approximation to the global optimum, it is advisable to
start the procedure using different initial partitions and compare obtained values of
the within-groups sum of squares.297
As it was already mentioned above, the number of clusters K is determined by a
researcher. In order to estimate this number, a researcher has to run the
295 For more details see part 3.5.2.1.1 of the present thesis. 296 See Eckes, 1980, p. 57, Lorr, 1983, p. 69, Aldenderfer/Blashfield, 1985, p. 46, Struhl, 1992, p. 41, and Everitt, 2001, p. 143. 297 See Steinhausen/Langer, 1977, p. 101.

Steps and Methodologies of International Market Segmentation Analysis
85
optimization-partitioning algorithm several times for some interval of K values.
Then, the following criteria can be used to make a decision about the correct
number of clusters:298
- plotting values of the within-groups sum of squares against corresponding
quantities of clusters at each of the successive runs of the optimization-
partitioning algorithm299 and searching for sharp decreases in values of the
within-groups sum of squares, which indicate correct quantities of clusters;
- assessing meaningfulness of cluster interpretation in the case of each
particular number of clusters.
3.5.2.2 Self-Organizing Map
The self-organizing map (SOM) presents a relatively new approach to
discovering market segments.300 SOM is a specific type of artificial neural
networks (ANN), which were originally developed to provide researchers with
both more powerful tools for accomplishment of certain optimization tasks and
abstract models of parts of a brain for better understanding of its functioning.301
SOM was introduced in 1982 by the Finnish scientist Teuvo Kohonen.302 It
simulates the self-organization of a brain – the process enabling creation of the
projection of external sensory signals (input signals) onto the brain’s cortex in such
way that topological relations between these signals are preserved.303
One can regard SOM as a nonlinear transformation of a high-dimensional input
space into a low-dimensional (normally, two-dimensional) output space.304 In
general, SOM is comparable to PCA: both procedures are used for reduction of
data dimensionality. The difference between them is that PCA transforms data in a
linear way. Correspondingly, the low-dimensional data space created by SOM
298 See Kaufman/Rousseeuw, 1990, p. 38 and Everitt, 1993, p. 100. 299 At each successive run of the optimization-partitioning algorithm, the number of clusters K is increased by one. 300 See Curry/Davies/Evans//Moutinho/Phillips, 2003, p. 191. 301 See Jockusch, 1995, p. 6. 302 See Quittek, 1997, p. 31. 303 See Speckmann, 1995, p. 4 and Sadeghi, 1996, p. 1. 304 See Rushmeier/Lawrence/Almasi, 1997, p. 2.
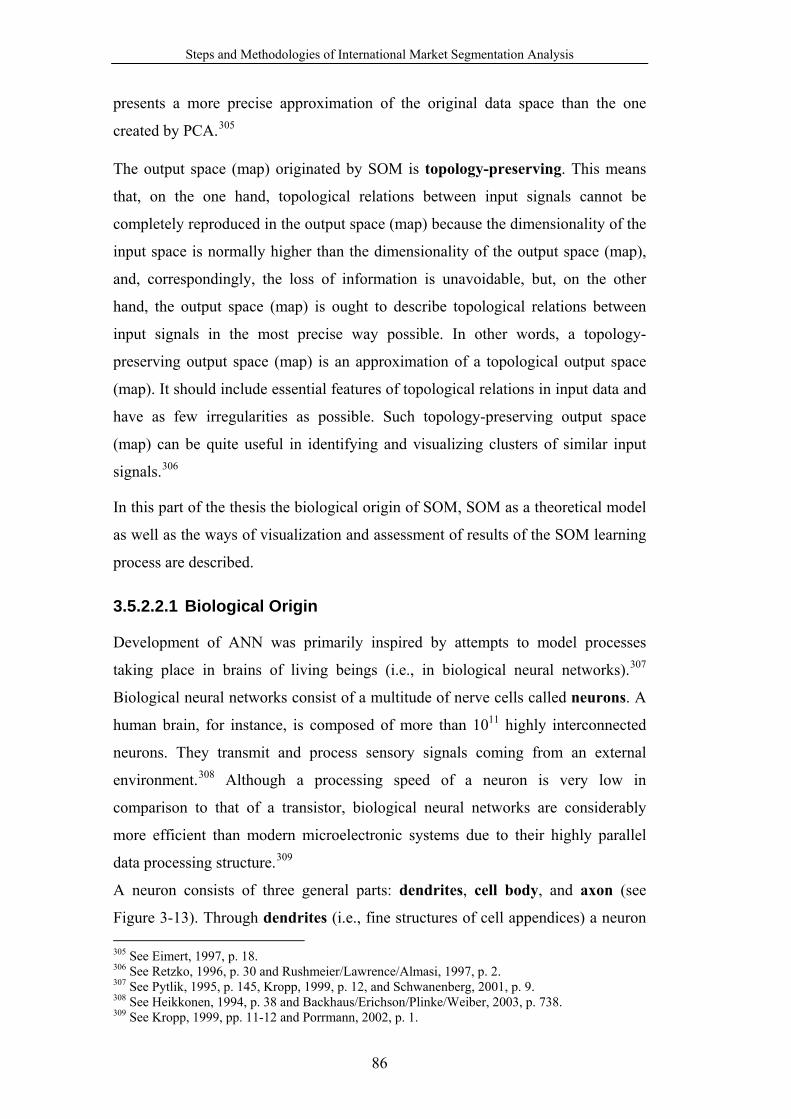
Steps and Methodologies of International Market Segmentation Analysis
86
presents a more precise approximation of the original data space than the one
created by PCA.305
The output space (map) originated by SOM is topology-preserving. This means
that, on the one hand, topological relations between input signals cannot be
completely reproduced in the output space (map) because the dimensionality of the
input space is normally higher than the dimensionality of the output space (map),
and, correspondingly, the loss of information is unavoidable, but, on the other
hand, the output space (map) is ought to describe topological relations between
input signals in the most precise way possible. In other words, a topology-
preserving output space (map) is an approximation of a topological output space
(map). It should include essential features of topological relations in input data and
have as few irregularities as possible. Such topology-preserving output space
(map) can be quite useful in identifying and visualizing clusters of similar input
signals.306
In this part of the thesis the biological origin of SOM, SOM as a theoretical model
as well as the ways of visualization and assessment of results of the SOM learning
process are described.
3.5.2.2.1 Biological Origin
Development of ANN was primarily inspired by attempts to model processes
taking place in brains of living beings (i.e., in biological neural networks).307
Biological neural networks consist of a multitude of nerve cells called neurons. A
human brain, for instance, is composed of more than 1011 highly interconnected
neurons. They transmit and process sensory signals coming from an external
environment.308 Although a processing speed of a neuron is very low in
comparison to that of a transistor, biological neural networks are considerably
more efficient than modern microelectronic systems due to their highly parallel
data processing structure.309
A neuron consists of three general parts: dendrites, cell body, and axon (see
Figure 3-13). Through dendrites (i.e., fine structures of cell appendices) a neuron 305 See Eimert, 1997, p. 18. 306 See Retzko, 1996, p. 30 and Rushmeier/Lawrence/Almasi, 1997, p. 2. 307 See Pytlik, 1995, p. 145, Kropp, 1999, p. 12, and Schwanenberg, 2001, p. 9. 308 See Heikkonen, 1994, p. 38 and Backhaus/Erichson/Plinke/Weiber, 2003, p. 738. 309 See Kropp, 1999, pp. 11-12 and Porrmann, 2002, p. 1.

Steps and Methodologies of International Market Segmentation Analysis
87
receives excitatory and inhibitory signals from other neurons. The signals are
summed and then transmitted to a cell body. If the excitation of a cell nucleus
caused by the total input value of all incoming signals exceeds some certain
threshold, a cell body sends out a short electrical impulse through an axon (i.e., a
nerve fiber). An axon brings the impulse to synapses (i.e., links between the axon
and dendrites of subsequent neurons). Every synapse produces biological
messengers called neurotransmitters, which enable transmission of the impulse
from one neuron to another. There are two general types of synapses: excitatory
and inhibitory. The former type forces the impulse to increase (to a greater or
lesser extent) the total input value of all signals coming into the subsequent neuron,
whereas the latter one – to reduce it. Synapses are plastic and can change
themselves. By adapting synapses and thereby changing the influence of one
neuron on another a brain learns.310
Figure 3-13 Components of a biological nerve cell (neuron)
Source: Backhaus/Erichson/Plinke/Weiber, 2003, p. 739. An artificial neuron is an abstracted model of a biological neuron (see Figure 3-
14).311 All components and biological processes are represented in this model
through mathematical equivalents and arithmetic operations:312
- mathematical data (input, output values) correspond to signals in a brain;
- synapses are modeled by means of modifiable weights;
310 See Ritter, 1988, p. 6, Quittek, 1997, p. 32, Seiffert, 1998, p. 13, Kropp, 1999, p. 12, and Backhaus/Erichson/Plinke/Weiber, 2003, pp. 738-739. 311 See Kropp, 1999, p. 13. 312 See Backhaus/Erichson/Plinke/Weiber, 2003, pp. 740-747.
Cell body
Dendrites
Synapses
Axon
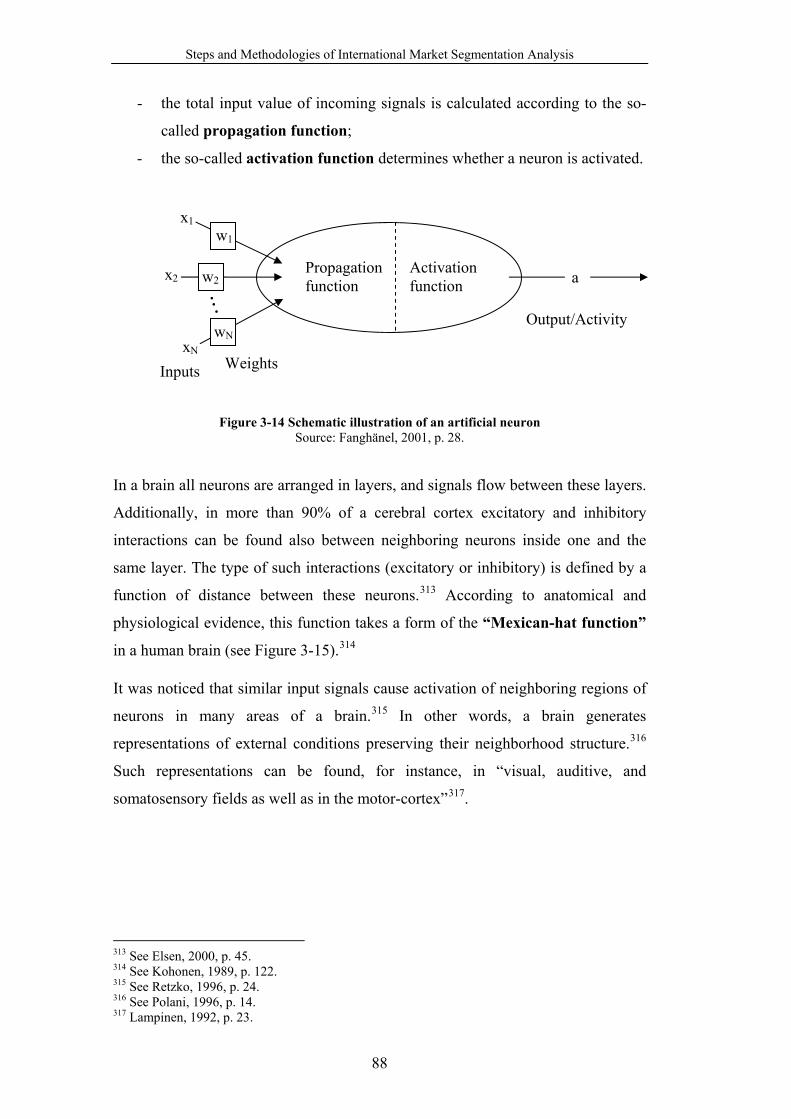
Steps and Methodologies of International Market Segmentation Analysis
88
- the total input value of incoming signals is calculated according to the so-
called propagation function;
- the so-called activation function determines whether a neuron is activated.
Figure 3-14 Schematic illustration of an artificial neuron
Source: Fanghänel, 2001, p. 28. In a brain all neurons are arranged in layers, and signals flow between these layers.
Additionally, in more than 90% of a cerebral cortex excitatory and inhibitory
interactions can be found also between neighboring neurons inside one and the
same layer. The type of such interactions (excitatory or inhibitory) is defined by a
function of distance between these neurons.313 According to anatomical and
physiological evidence, this function takes a form of the “Mexican-hat function”
in a human brain (see Figure 3-15).314
It was noticed that similar input signals cause activation of neighboring regions of
neurons in many areas of a brain.315 In other words, a brain generates
representations of external conditions preserving their neighborhood structure.316
Such representations can be found, for instance, in “visual, auditive, and
somatosensory fields as well as in the motor-cortex”317.
313 See Elsen, 2000, p. 45. 314 See Kohonen, 1989, p. 122. 315 See Retzko, 1996, p. 24. 316 See Polani, 1996, p. 14. 317 Lampinen, 1992, p. 23.
Inputs
w1
Activation function
Output/Activity
w2
wN
. . .
x1
x2
xN Weights
Propagation function a

Steps and Methodologies of International Market Segmentation Analysis
89
Figure 3-15 “Mexican-hat function” of a lateral interaction
Source: Kohonen, 1989, p. 123.
The feature of a human brain described above is only partly determined
genetically. To a bigger part it is set up through the self-organization of
neurons.318 The self-organization of neurons is the process of adaptation of
synapses under the influence of excitatory and inhibitory lateral interactions
between neurons that leads to creation of a pattern of activated neurons describing
topological relations of input signals.319
SOM presents a powerful computational algorithm, which abstracts from many
biological details, but, despite its simplicity, enables a good simulation of essential
aspects of the self-organization.320
3.5.2.2.2 Theoretical Model
SOM belongs to feedback ANN, which should be distinguished from
feedforward ANN. In feedforward ANN, data information flows only in one
direction. In other words, a layer of neurons can influence only subsequent layers
of neurons. On the contrary, in feedback ANN, data information can flow in any
direction. Here a layer of neurons can influence the preceding layer of neurons, or
318 See Kohonen, 1989, p. 119 and Hassoun, 1995, p. 113. 319 See Kohonen, 1989, p. 119 and Elsen, 2000, p. 45. 320 See Obermayer, 1993, p. 38, Heikkonen, 1994, p. 48, and Polani, 1996, p. 14.
Lateral distance
Interaction
Excitatory
Inhibitory Inhibitory
Excitatory (weak)
Excitatory (weak)

Steps and Methodologies of International Market Segmentation Analysis
90
there can be connections between neurons inside one and the same layer.321
Examples of feedforward and feedback ANN are demonstrated in Figure 3-16.
Figure 3-16 Feedforward and feedback ANN
Source: Fanghänel, 2001, p. 24.
SOM consists of two layers of neurons: the input layer and Kohonen-layer (see
Figure 3-17).322
The task of neurons of the input layer consists of introducing input data into the
network and transferring them unchanged to the Kohonen-layer.323 Input data can
be again thought of as a data matrix X = [ jnx ] (j = 1,…, J, n = 1,…, N), where jnx
are values of N variables (characteristics) for each of J individuals. Each input
neuron ni (n = 1,…, N) corresponds to a particular input variable. In other words,
321 See Scherer, 1997, pp. 54-55, Fanghänel, 2001, p. 24, and Backhaus/Erichson/Plinke/Weiber, 2003, p. 741. 322 See Schweizer, 1995, p. 83 and Retzko, 1996, p. 25. 323 See Schweizer, 1995, p. 83.
Single Layer Perceptron
Multilayer Perceptron
Radial-Basis Function Networks
SOM
Adaptive Resonance Theory Model
Hopfield Model
Feedforward ANN
Feedback ANN
ANN
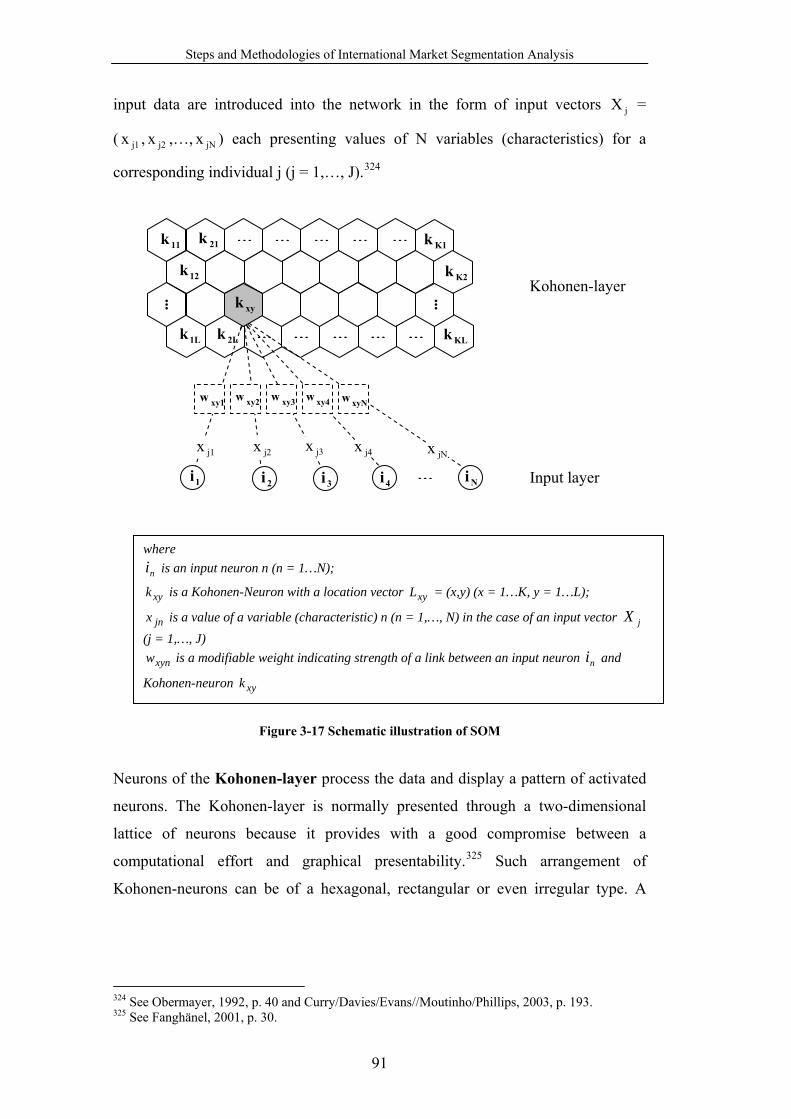
Steps and Methodologies of International Market Segmentation Analysis
91
input data are introduced into the network in the form of input vectors jX =
( j1x , j2x ,…, jNx ) each presenting values of N variables (characteristics) for a
corresponding individual j (j = 1,…, J).324
Figure 3-17 Schematic illustration of SOM
Neurons of the Kohonen-layer process the data and display a pattern of activated
neurons. The Kohonen-layer is normally presented through a two-dimensional
lattice of neurons because it provides with a good compromise between a
computational effort and graphical presentability.325 Such arrangement of
Kohonen-neurons can be of a hexagonal, rectangular or even irregular type. A
324 See Obermayer, 1992, p. 40 and Curry/Davies/Evans//Moutinho/Phillips, 2003, p. 193. 325 See Fanghänel, 2001, p. 30.
Kohonen-layer
4i 3i 2i Ni
K1k
. . .
12k
…
1Lk
11k
K2k
...
21k
…
… … … …
2Lk … … … … …
xy1w xy2w xy3w
j1x j2x j3x j4x
xyk
jNx
Input layer 1i
KLk
xy4w
where
ni is an input neuron n (n = 1…N);
xyk is a Kohonen-Neuron with a location vector xyL = (x,y) (x = 1…K, y = 1…L);
jnx is a value of a variable (characteristic) n (n = 1,…, N) in the case of an input vector jX (j = 1,…, J)
xynw is a modifiable weight indicating strength of a link between an input neuron ni and
Kohonen-neuron xyk
xyNw

Steps and Methodologies of International Market Segmentation Analysis
92
hexagonal arrangement type is considered to be especially effective for visual
presentation.326
Kohonen-neurons are entirely interconnected.327 A vector xyL = (x, y) presents a
location vector of each Kohonen-neuron xyk in a two-dimensional space A2 of the
Kohonen-layer defined as follows:328
A2 ={ }Ly1Kx1NNy)(x,y)(x, ≤≤∧≤≤∧×∈ .
Each Kohonen-neuron xyk is also connected to each input neuron ni .329 Strength
of every corresponding link is indicated through a modifiable weight xynw .
Generally speaking, a weight vector xyW = ( xy1w , xy2w ,…, xyNw ) is assigned to
every Kohonen-neuron xyk , and the number of elements in each weight vector
xyW is equal to the number of elements in each input vector jX . As it was already
mentioned above, a weight xynw corresponds to a synapse of a biological neuron,
whereas a positive weight stands for an excitatory synapse, and a negative weight –
for an inhibitory one. All weights xynw are normally initialized randomly and then
subjected to subsequent adaptations.330
With introduction of an input vector jX into a network, all Kohonen-neuron xyk
receive the same input signal xyI .331 It consists of an external input exyI and
lateral feedback fxyI :332
xyI = exyI + f
xyI (3-35)
In other words, equation (3-35) presents the propagation function in the case of
SOM.
An external input exyI is defined as follows:333
326 See Kohonen, 2001, p. 110. 327 See Martinetz, 1992, p. 19 and Retzko, 1996, p. 25. 328 See Tryba, 1992, p. 25. 329 See Bieler, 1994, p. 37. 330 See Ritter, 1988, p. 16 and Seiffert, 1998, p. 30. 331 See ibid. p. 31. 332 See Kohonen, 2001, p. 180.

Steps and Methodologies of International Market Segmentation Analysis
93
exyI = ∑
njnxyn xw , (3-36)
where
xynw is a modifiable weight indicating strength of a link between an input neuron
ni and Kohonen-neuron xyk
jnx is a value of a variable n in the case of an input vector jX
∑n
jnxyn xw is a scalar product of an input vector jX and weight vector xyW
associated with a Kohonen-neuron xyk .
A lateral feedback fxyI is defined as follows:334
fxyI = ∑
∈ xyy'x' Aky'x'y'xyx' Eg 2
xy Ak ∈ , 2xy AA ⊆ , (3-37)
where
y'xyx'g is a function showing strength of a lateral interaction between two Kohonen-
neurons xyk and y'x'k . It corresponds to the “Mexican-hat function” of a lateral
interaction already mentioned above with its maximum at a Kohonen-neuron xyk .
y'x'E is an excitation of a Kohonen-neuron y'x'k
xyA is a local interaction neighborhood of a neuron xyk
To become a topology-preserving map, the network presented above has first to
learn. Learning in ANN lies in adaptation of strengths of links between neurons
(in other words, weights). There are two types of learning in ANN: supervised and
unsupervised. During supervised learning, an output pattern of activated neurons
produced by a network is compared to some desired output pattern. Here
deviations between the two patterns are calculated, and weights are adapted so that
the real output pattern approximates the desired one. In contrast, during
unsupervised learning, no desired output is presented to a network. Here an
adaptation of weights must lead to constructing a consistent output pattern of
activated neurons on the base of a multitude of input vectors. In this case, a
333 See ibid. p. 180. 334 See Tryba, 1992, p. 23 and Kohonen, 2001, p. 180.

Steps and Methodologies of International Market Segmentation Analysis
94
network attempts to group different input vectors according to their similarity, or,
in other words, so that similar output values comply with similar input values.
Correspondingly, SOM learns in an unsupervised way.335
The learning process in SOM starts with random initialization of weights.336 Then,
input vectors are introduced into a network randomly, each one at a time zt (z =
1,…, Z) for a ztΔ = [ ]1zz t,t + period of time. In order to determine an excitation of
a Kohonen-neuron xyk caused by introduction of one input vector, some certain
number of iterations should be undertaken during the time period ztΔ according to
the following equation:337
Δt)(tE xy + = σ (∑n
jnxyn xw + ∑∈ xyy'x' Ak
y'x'y'xyx' (t)Eg - σ0) 2xy Ak ∈ , 2
xy AA ⊆ , (3-38)
where
Δt)(tE xy + is an excitation of a Kohonen-neuron xyk obtained after one iteration
tΔ = iterationsofNumber
t zΔ is a length of one iteration
( )⋅σ is a non-linear sigmoid function
( )tσ0 is an excitation threshold function chosen so that with an increasing zt a
smaller number of neurons is activated
In other words, equation (3-38) presents the activation function in the case of
SOM.
It should be also mentioned that such iteration algorithm is very robust to changes
of a function y'xyx'g . Correspondingly, it does not have to be of an exact form of the
“Mexican-hat function” described above, but must only approximate it.338
Due to a lateral interaction between Kohonen-neurons, values of xyE concentrate
themselves in the course of conducting iterations according to equation (3-38)
around the Kohonen-neuron with the maximum scalar product ∑n
jnxyn xw . The
335 See Eimert, 1997, pp. 14-15 and Backhaus/Erichson/Plinke/Weiber, 2003, p. 742. 336 See Tryba, 1992, p. 16. 337 See Ritter, 1988, p. 16, Kohonen, 1989, p. 123, and Tryba, 1992, pp. 23-25. 338 See Tryba, 1992, p. 24.

Steps and Methodologies of International Market Segmentation Analysis
95
fact that the scalar product ∑n
jnxyn xw can be defined as a measure of the
similarity between a weight vector xyW and input vector jX has allowed Teuvo
Kohonen to carry out some simplifications of the iteration process. To avoid time-
consuming computer simulation of iterations according to equation (3-38), he has
assumed that after sufficiently many iterations the Kohonen-neuron with the
maximum value of xyE corresponded to the Kohonen-neuron with the best match
between a weight vector xyW and input vector jX and substituted conducting
iterations according to equation (3-38) with a more trivial process of comparing all
weight vectors with an input vector jX .339 This comparison takes place on all
Kohonen-neurons simultaneously.340
Moreover, to allow for a simple mathematical approach, the similarity measure
∑n
jnxyn xw was replaced by the Euclidean distance between a weight vector xyW
and input vector jX .341 The Euclidean distance xyd is defined here in the next
form:342
xyd = jxy XW − = ∑ −n
2jnxyn )x(w (3-39)
In this case, the Kohonen-neuron with the smallest Euclidean distance xyd between
a weight vector xyW and input vector jX presents the Kohonen-neuron with the
best match between these vectors.343
It is assumed then that only this Kohonen-neuron is activated, i.e., has an output
different from zero. In particular, the output is obtained through the “winner takes
all” activation function:344
Output of a Kohonen-neuron = ⎪⎩
⎪⎨⎧
otherwise.,0
.dmin withneuron a isit if,1 xyyx, (3-40)
339 See Ritter, 1988, p. 16 and Tryba, 1992, pp. 24-25. 340 See Speckmann, 1995, p. 16. 341 See Tryba, 1992, p. 25 and Rüping, 1995, p. 9. 342 See Tryba, 1992, p. 25. 343 See Rüping, 1995, p. 9. 344 See Jockusch, 1995, p. 12 and Retzko, 1996, pp. 61-62.

Steps and Methodologies of International Market Segmentation Analysis
96
Correspondingly, the Kohonen-neuron with the smallest Euclidean distance xyd
between a weight vector xyW and input vector jX is called the winner neuron.345
After the winner neuron is identified, weights assigned to it and its neighboring
Kohonen-neurons are made more similar to a corresponding input vector.346
According to the adaptation rule designated in the model of Kohonen, weights
assigned to the winner neuron are adapted to an input vector to the highest degree,
whereas a degree of adaptation of weights assigned to all other Kohonen-neurons
depends on their position in the neighborhood of the winner neuron.347 Assuming
that the winner neuron has the location vector ww yxL = (xw, yw) this process can be
presented mathematically as follows:348
)(tw 1zxyn + = )(th)(tw zxyyxzxyn ww+ [ )(twx zxynjn − ] (3-41)
Here xyyx wwh is the so-called neighborhood function. It defines to which degree
weights of Kohonen-neurons are adapted.349
A neighborhood function serves as a substitute for the presented above function of
strength of a lateral interaction y'xyx'g , through which an adaptation neighborhood
would be defined in the case of conducting iterations according to equation (3-
38).350
A form of a neighborhood function is not strictly determined. There are only
following general requirements, which a neighborhood function has to comply
with:351
a) its maximum value should decrease with the time to guarantee convergence
of the adaptation process:
∞→ztlim
xyyx wwh = 0
b) its values should decrease with the distance from the winner neuron to
allow for imitation of the biological model: 345 See Seiffert, 1998, p. 31. 346 See Porrmann, 2002, p. 7. 347 See Retzko, 1996, p. 27. 348 See Kohonen, 2001, pp. 110-111. 349 See Elsen, 2000, p. 53. 350 See Tryba, 1992, pp. 24-26. 351 See Elsen, 2000, p. 54 and Kohonen, 2001, p. 111.

Steps and Methodologies of International Market Segmentation Analysis
97
∞→xywywx
dlim
xyyx wwh = 0
One of the most widely applied forms of a neighborhood function is the Gaussian
function:352
xyyx wwh = ⎟⎟
⎠
⎞
⎜⎜
⎝
⎛
)(t2σd
-)expα(tz
2
2xyyx
z
ww
(3-42)
where 2
xyyx wwd is the squared Euclidean distance between the winner neuron ww yxk and
Kohonen-neuron xyk
)α(t z is the learning-rate factor defining a degree of adaptation of weights during
each adaptation step ( 1)α(t0 z << )
)σ(t z is the width parameter defining a width of a neighborhood function xyyx wwh
The maximum of the neighborhood function xyyx wwh is located at the winner
neuron ww yxk (see Figure 3-18). Its width defined by the width parameter )σ(t z
corresponds to the radius of the neighborhood wwyxA 2A⊆ of the winner neuron
wwyxk .353 Weights assigned to Kohonen-neurons belonging to this neighborhood
are adapted to a corresponding input vector, whereas weights assigned to
Kohonen-neurons outside it remain unchanged.354
The width parameter )σ(t z should be set to a rather big value at the beginning of
the adaptation process. Otherwise, the Kohonen-layer accommodates itself to a
pattern of input data not as a uniform map, but as many small map areas, between
which accommodation is interrupted. The starting value of the width parameter
)σ(t z should be equal to approximately 70% of the longer side of the Kohonen-
layer. Nevertheless, it should decrease with the time, in order to allow for detailed
accommodation of a Kohonen-layer to input vectors. Correspondingly, the width
352 See Kohonen, 2001, p. 111 and Porrmann, 2002, p. 8. 353 See Kohonen, 2001, p. 111. 354 See Fanghänel, 2001, p. 31.
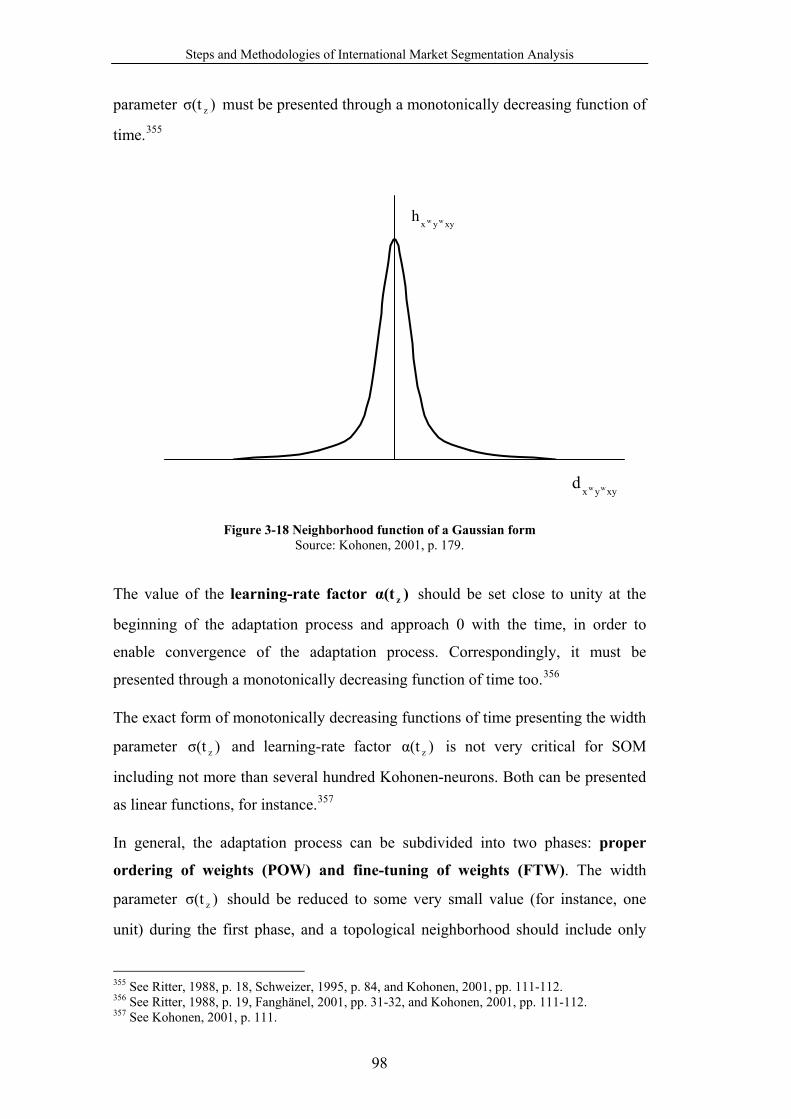
Steps and Methodologies of International Market Segmentation Analysis
98
parameter )σ(t z must be presented through a monotonically decreasing function of
time.355
Figure 3-18 Neighborhood function of a Gaussian form
Source: Kohonen, 2001, p. 179.
The value of the learning-rate factor )α(t z should be set close to unity at the
beginning of the adaptation process and approach 0 with the time, in order to
enable convergence of the adaptation process. Correspondingly, it must be
presented through a monotonically decreasing function of time too.356
The exact form of monotonically decreasing functions of time presenting the width
parameter )σ(t z and learning-rate factor )α(t z is not very critical for SOM
including not more than several hundred Kohonen-neurons. Both can be presented
as linear functions, for instance.357
In general, the adaptation process can be subdivided into two phases: proper
ordering of weights (POW) and fine-tuning of weights (FTW). The width
parameter )σ(t z should be reduced to some very small value (for instance, one
unit) during the first phase, and a topological neighborhood should include only
355 See Ritter, 1988, p. 18, Schweizer, 1995, p. 84, and Kohonen, 2001, pp. 111-112. 356 See Ritter, 1988, p. 19, Fanghänel, 2001, pp. 31-32, and Kohonen, 2001, pp. 111-112. 357 See Kohonen, 2001, p. 111.
xyyx wwd
xyyx wwh

Steps and Methodologies of International Market Segmentation Analysis
99
the nearest neighbors of the winner neuron in the second phase. The learning-rate
factor )α(t z should also reach a very small value (for instance, 0.02 or smaller)
after the POW phase. For a high final statistical accuracy of a pattern of activated
neurons, the FTW phase should be ten to hundred times longer than the POW
phase. Moreover, the number of iteration steps in the FTW phase should be at least
five hundred times bigger than the number of Kohonen-neurons.358
During the iterative learning process described above, weights assigned to
neighboring Kohonen-neurons become more and more similar to each other. After
the learning is completed, similar input vectors cause activation of neighboring
Kohonen-neurons. In other words, a topology-preserving map is created.359
3.5.2.2.3 Visualization of Results
Results of the SOM learning process can be visualized in the following ways:360
- the U-matrix;
- the hit histogram of input vectors;
- the component planes.
The U-matrix (see Figure 3-19) shows distribution of the average distance361
between a Kohonen-neuron and its closest neighbors on the topology-preserving
Kohonen-layer defined as follows:362
C
WW
Ucycxcycx
cc
Akyxxy
xy
∑∈
−
= 2yx
Ak cc ∈ , 2yx
AA cc ⊆ , (3-43)
where
ccyxA is the closest neighborhood of a Kohonen-neuron xyk
ccyxk is the closest neighbor of a Kohonen-neuron xyk
C is the number of closest neighbors of a Kohonen-neuron xyk
358 See Kohonen, 1989, p. 133 and Kohonen, 2001, p. 112. 359 See Eimert, 1997, pp. 16-17. 360 These possibilities of map visualization are provided by the NENET software used within the scope of the international market segmentation analyses presented later in the thesis. 361 According to Porrmann, 2002, p. 12, the distance measure used here should be the same as the one used for comparison of input vectors with weight vectors, in other words, the Euclidean distance. 362 See Rüping, 1995, pp. 17-18, Speckmann, 1995, p. 20, Kropp, 1999, p. 26, and Kohonen, 2001, p. 165.

Steps and Methodologies of International Market Segmentation Analysis
100
xyW is a weight vector assigned to a Kohonen-neuron xyk
ccyxW is a weight vector assigned to a Kohonen-neuron ccyx
k
Different values of average distances xyU are presented through shades of grey
(dark shades denoting high values, light shades – low ones). Dark-grey channels of
Kohonen-neurons illustrate borderlines of cluster regions on the Kohonen-layer.363
Figure 3-19 Example of the U-matrix
The hit histogram of input vectors (see Figure 3-20) shows distribution of input
vectors (correspondingly, individuals) on the topology-preserving Kohonen-layer.
As far as an input vector assigned to a Kohonen-neuron must have the best match
with its weight vector, the hit histogram of input vectors presents nothing else as
distribution of the best matches between input vectors and weight vectors on the
topology-preserving Kohonen-layer.364 Different quantities of input vectors
(correspondingly, individuals) assigned to Kohonen-neurons can be depicted in a
two-dimensional histogram through shades of blue (light shades illustrating big
quantities, dark shades – small ones) or in a three-dimensional histogram through a
height of diagram bars (high bars standing for big quantities, low bars – for small
ones).
363 See Kohonen, 2001, p. 166. 364 See Rüping, 1995, p. 19 and Speckmann, 1995, p. 20.

Steps and Methodologies of International Market Segmentation Analysis
101
Two-dimensional case
Three-dimensional case
Figure 3-20 Example of the hit histogram of input vectors If dark-grey channels in the U-matrix presented above are vague, the overlap of the
hit histogram of input vectors and the U-matrix may simplify identification of
cluster borderlines. Coincidence of channels of neurons having small quantities of
assigned input vectors in the hit histogram with dark-grey channels in the U-matrix
increases confidence in the fact that one deals with cluster borderlines.365
The component planes (see Figure 3-21) show distribution of the nth component
(n = 1,…, N) of weight vectors xyW = ( xy1w , xy2w ,…, xyNw ) associated with
365 See Rüping, 1995, p. 20.

Steps and Methodologies of International Market Segmentation Analysis
102
Kohonen-neurons on the topology-preserving Kohonen-layer.366 Here the highest
value of a particular component is displayed using a red color, the lowest one –
using a black color. The intermediate values are presented through a smooth
transition between “warm” and “cold” colors.
Due to the fact that components of a weight vector of each particular Kohonen-
neuron on the topology-preserving map match with corresponding characteristics
of an individual assigned to this neuron in the best possible way, component planes
allow to analyse the distribution of the nth characteristic (n = 1,…, N) of
individuals on the Kohonen-layer.
Figure 3-21 Example of the component plane
3.5.2.2.4 Assessment of Topology-Preserving Map
To assess the goodness of the topology-preserving map, three following quality
measures can be used: average quantization error, topographic error, and
percentage of used Kohonen-neurons.
The average quantization error qE helps to assess the map fit to input data, in
other words, the quality of input data compression into a finite number of weight
vectors.367 It is defined as follows:368
∑=
−=J
1jyxjq )WX(
J1Ε ww , (3-44)
366 See Tryba, 1992, p. 28. 367 See Kohonen, 2001, p. 161 and de Bodt/Cottrell/Verleysen, 2002, p. 968. 368 See Porrmann, 2002, p. 36.

Steps and Methodologies of International Market Segmentation Analysis
103
where
jX is an input vector j (j = 1,…, J)
ww yxW is a weight vector of the corresponding winner Kohonen-neuron ww yx
k
The smaller the value of the average quantization error qE is, the better the map’s
fit to input data is.369
The topographic error topoE helps to asses the map’s accuracy in preserving the
topology of input data.370 It is defined as follows:371
∑=
=J
1jjtopo )u(X
J1E , (3-45)
where
⎪⎩
⎪⎨⎧ >−=
=otherwise.0,
.1WWmif 1,)u(X Mapyxyxws
jssww
where
ww yxW is a weight vector of the winner Kohonen-neuron ww yx
k
ssyxW is a weight vector of the Kohonen-neuron ssyx
k – the neuron with the
second best match between its weight vector ssyxW and corresponding input vector
jX
wsm is a map distance between Kohonen-neurons ww yxk and ssyx
k
The smaller the value of the topographic error topoE is, the higher the map’s
accuracy in preserving the topology of input data is.372
The percentage of used Kohonen-neurons usedE helps to asses the map’s
resolution.373 It is defined as follows:374
100%neuronsofnumber total
onceleast at neurons winner that wereneurons ofnumber used ⋅=Ε (3-46)
369 See Kohonen, 2001, p. 161. 370 See ibid. p. 161. 371 See Fanghänel, 2001, p. 43. 372 See ibid. p. 44. 373 See ibid. 374 See ibid.
Steps and Methodologies of International Market Segmentation Analysis
104
If the value of usedE is equal to 100%, the task of indicating cluster regions may
become quite complicated, due to unclear transitions between them. In such case,
the map is obviously too small. On the other hand, if the value of usedE is close to
0%, the map is insufficiently used.375
3.5.3 Validation of Cluster Solution
After a partition of individuals presenting an outcome of clustering is chosen, one
should examine the quality of a corresponding cluster solution. Ways of doing this
are presented in this chapter.
3.5.3.1 Assessment of Cluster Solution’s Stability Using Results of Several Clustering Methods
In order to be protected from accepting purely accidental outcome of segmentation
analysis, one should examine stability of a cluster solution. This can be done by
applying several clustering methods to one and the same sample. A cluster solution
is considered to be stable, if it or its slightly changed version is repeatedly found
using different clustering methods.376
The conclusion about the similarity of an obtained cluster solutions can be made
on the base of comparison of cluster profiles consisting of average values of each
basis variable in a corresponding cluster (i.e., consisting of cluster centroids for
each basis variable).377
3.5.3.2 Assessment of Homogeneity within Clusters Using F-Values
Clusters in a high-quality cluster solution have to satisfy conditions of the notion
of homogeneity.378 According to the first of them homogeneity within clusters
have to exist.379 To examine if the obtained clusters are homogeneous, the so-
called F-value can be used. It is defined as follows:380
F =)n(Var)r,n(Var , (3-47)
375 See ibid. 376 See Eckes, 1980, p. 105 and Wiedenbeck/Züll, 2001, p. 17. 377 See Müller, 1977, pp. 52-53. 378 See Bacher, 1996, p. 253. 379 See part 3.5.2.1 of the present thesis. 380 See Backhaus/Erichson/Plinke/Weiber, 2003, p. 533.
Steps and Methodologies of International Market Segmentation Analysis
105
where
Var(n, r) is variance of a basis variable n in a cluster r
Var(n) is variance of a basis variable n in the total sample
The smaller the F-value is, the lower the variance of a basis variable in the cluster
is in comparison to its variance in the total sample. In fact, it is desirable that the F-
value does not exceed 1 because only in this case variance of a corresponding basis
variable in a cluster is smaller than its variance in the total sample. If F-values are
smaller than 1 for all basis variables in a corresponding cluster, it is considered to
be completely homogeneous.381
3.5.3.3 Assessment of Heterogeneity between Clusters Using t-Values
The second condition of the notion of homogeneity requires heterogeneity
between clusters.382 The so-called t-values can give one hints with regard to its
existence. The t-value is defined as follows:383
t =n
nnr
sxx − , (3-48)
where
nrx is the average value of a basis variable n in a cluster r
nx is the average value of a basis variable n in the total sample
ns is standard deviation of values of a basis variable n in the total sample
The t-values present standardized values, where positive (negative) values show
that basis variables are overrepresented (underrepresented) in a corresponding
cluster in comparison to the total sample.384
381 See ibid. 382 See part 3.5.2.1 of the present thesis. 383 See Backhaus/Erichson/Plinke/Weiber, 2003, p. 534. 384 See ibid.

Steps and Methodologies of International Market Segmentation Analysis
106
3.5.3.4 Assessment of Heterogeneity between Clusters and of Cluster Solution Reliability Using Discriminant Analysis
An additional way to assess the quality of a cluster solution lies in conducting
significance tests on basis variables by means of discriminant analysis. This
statistical technique enables among other things examining existence of significant
differences between clusters with respect to several variables simultaneously and
evaluating accuracy of representation of real groupings in the data or, in other
words, assessing reliability of a cluster solution.385
Feature profiles of individuals consisting of feature variables (characteristics of
individuals) measured on a metric scale and group variable presenting priori
defined group memberships of individuals and measured on a nominal scale are
required for conduction of discriminant analysis.386
Discriminant analysis attempts to separate (to discriminate) priori defined groups
in the most optimal way. Formally, discriminant analysis tries to explain values of
a group variable in terms of values of feature variables or, in other words, to
explore dependency of a group variable on feature variables.387
Discriminant analysis starts with deriving discriminant functions. Then, their
performance is tested. Testing criteria used here additionally enable making
judgments about existence of significant differences between groups or about
reliability of a cluster solution. Both derivation and examination of discriminant
functions are presented below.
3.5.3.4.1 Derivation of Discriminant Functions
Discriminant analysis works by combining original feature variables into linear
composites that maximize differences between priori defined groups.388 These
linear combinations are called (canonical) discriminant functions and defined as
follows:389
D = 0d + 11xd + 22xd + …+ NN xd , (3-49)
385 See Aldenderfer/Blashfield, 1985, p. 64 and Backhaus/Erichson/Plinke/Weiber, 2003, p. 156. 386 See Backhaus/Erichson/Plinke/Weiber, 2003, p. 156. 387 See Keysberg, 1989, p. 38 and Backhaus/Erichson/Plinke/Weiber, 2003, p. 156. 388 See Green/Tull/Albaum, 1988, p. 513. 389 See Klecka, 1982, p. 15 and Backhaus/Erichson/Plinke/Weiber, 2003, p. 161.

Steps and Methodologies of International Market Segmentation Analysis
107
where
D is a (canonical) discriminant score
0d is a constant
nd is a discriminant coefficient of a feature variable n (n = 1,…, N)
nx is a feature variable n
The maximum number of discriminant functions is equal to min{ }N1,R − , where
R is the number of groups, and N is the number of feature variables.
Correspondingly, only one discriminant function exists in a two-group case. If
there are more than two groups, several mutually uncorrelated functions can be
derived.390
For better understanding of the notion of a discriminant function, graphical
representation of a discriminant function in the case of only two groups of
individuals and only two feature variables (characteristics of individuals) should be
considered (see Figure 3-22).
The two ellipses schematically show locus of points presenting associations
( 1x , 2x ) of feature variables (characteristics) 1x and 2x for the two priori defined
groups of individuals.391
A discriminant function builds a plane over the two-dimensional coordinate space
of feature variables 1x and 2x . Inside this coordinate space, it can be represented
through a discriminant axis – a straight line defined for a discriminant function of
a form D = 0d + 11xd + 22xd (a two-group-two-variable case) as follows:392
1x = ⋅1
2
dd
2x (3-50)
390 See Klecka, 1982, p. 34 and Backhaus/Erichson/Plinke/Weiber, 2003, pp. 177-178. 391 See Green/Tull/Albaum, 1988, p. 510. 392 See Backhaus/Erichson/Plinke/Weiber, 2003, p. 173.

Steps and Methodologies of International Market Segmentation Analysis
108
Figure 3-22 Graphical representation of a discriminant function in a two-group-two-variable case
Source: Pytlik, 1995, p. 135. In other words, a discriminant axis crosses the zero point of the two-dimensional
coordinate space, and its slope is defined by the ratio of discriminant coefficients
1d and 2d .393
A discriminant axis is chosen by discriminant analysis from a variety of all
possible axes, which cross the zero point of the two-dimensional coordinate space,
through estimation of discriminant coefficients 1d and 2d . A discriminant axis is
the axis allowing for the best separation of groups of individuals.394 This can be
seen in Figure 3-22 too: separation of the two groups of individuals by means of
the thick dotted line leads to the smallest overlap between univariate distributions
of projections of associations ( 1x , 2x ) for each individual onto a discriminant axis
D.395 These projections are nothing else as corresponding discriminant scores of
individuals.396
By estimating the appropriate value of a constant d0 a scale of a discriminant axis
D can be chosen so that the projection of a separating line on a discriminant axis
(called a critical discriminant score) has the value of 0, and discriminant scores 393 See ibid. 394 See Pytlik, 1995, p. 136. 395 See Green/Tull/Albaum, 1988, p. 510. 396 See Backhaus/Erichson/Plinke/Weiber, 2003, p. 173.
D
x2
Group 1 Group 2
x1
Separating line

Steps and Methodologies of International Market Segmentation Analysis
109
of individuals positioned to the left from the separating line appear to have
negative values, and those to the right – positive ones. In fact, changes in values of
a constant d0 shift the scale of a discriminant axis D and thereby affect values of
discriminant scores, but do not influence a degree of group separation.397
The central problem of discriminant analysis is thus the next optimisation
problem:398
n1 d ,...,dmax { }Γ , (3-51)
where
Γ is the discriminant criterion measuring the difference between groups of
individuals
The discriminant criterion Γ is defined as follows:399
Γ = 2
rrj
J
1j
R
1r
2rr
R
1r
)D(DΣΣ
)DD(JΣr
−
−
==
= =w
b
SSSS
, (3-52)
where
rJ is the number of individuals in a group r (r=1,…, R)
rjD is a discriminant score of an individual j (j=1,…, J) belonging to a group r
rD is the centroid of a group r defined as follows:
rD = rj
J
1jr
DΣJ1 r
=
D is the total average discriminant score defined in the following way:
D = j
J
1jDΣ
=
bSS is the between-groups sum of squares (variance explained by a discriminant
function)
wSS is the within-groups sum of squares (variance not explained by a discriminant
function)400
397 See ibid. pp. 162-176. 398 See ibid. p. 166. 399 See ibid. pp. 165-166.
Steps and Methodologies of International Market Segmentation Analysis
110
The discriminant criterion is maximized for every feasible discriminant function.
The maximum value of the discriminant criterion { }ΓMaxγ = presents an
eigenvalue of a corresponding discriminant function.401
In the process of maximization of the discriminant criterion, discriminant functions
are derived in such way that the discriminant function derived first has the
maximum value of the discriminant criterion, and each following discriminant
function has the conditionally biggest value of the discriminant criterion. In other
words, discriminant analysis discloses dimensions of differences between groups,
where the dimension disclosed first presents maximum group differences, the
dimension disclosed next – maximum group differences not accounted by the first
one, and so on.402
3.5.3.4.2 Testing Performance of Discriminant Functions
Performance (discriminating power) of a discriminant function decreases with the
decrease in a corresponding eigenvalue. In other words, an eigenvalue presents a
performance measure of a discriminant function. Nevertheless, it can be useful
only for measuring relative performance of a discriminant function.403 In
particular, one can compare eigenvalues of different functions or eigenvalue
shares defined as follows:404
I21
i
γ...γγγ
ESi +++= , (3-53)
where
iγ is an eigenvalue of a discriminant function i (i = 1,…, I)
In order to define the absolute performance of a discriminant function, other
performance measures should be used. One of them is the canonical correlation
coefficient defined as follows:405
400 The within-groups sum of squares is defined in part 3.5.2.1.2.1 of the present thesis as the total error sum of squares. 401 See Backhaus/Erichson/Plinke/Weiber, 2003, p. 178. 402 See Tatsuoka, 1988, p. 217. 403 See Klecka, 1982, pp. 35-36. 404 See Backhaus/Erichson/Plinke/Weiber, 2003, p. 178. 405 See Klecka, 1982, p. 36 and Backhaus/Erichson/Plinke/Weiber, 2003, p. 182.
Steps and Methodologies of International Market Segmentation Analysis
111
total
b
i
ici SS
SSγ1
γr =
+= , (3-54)
where
totalSS = 2rj
J
1j
R
1r)D(DΣΣ
r
−==
= wb SSSS + is the total variance of discriminant scores406
The squared canonical correlation presents “the proportion of variation in the
discriminant function explained by the groups”407. In other words, the canonical
correlation coefficient indicates strength of relationship between the discriminant
function and the groups. Its values vary between 0 and 1, where the zero value
denotes no relationship, and the value equal to one – strong relationship.408
The canonical correlation coefficient also gives one a hint about the size of
differences between groups on chosen feature variables. If there are no big
differences between groups, canonical correlation coefficients of all discriminant
functions are low.409
Another performance measure used for testing the absolute performance of a
discriminant function is the so-called Wilks’s lambda. It is defined as follows:410
=iΛ total
w
i SSSS
γ11
=+
(3-55)
Values of the Wilks’s lambda also vary between 0 and 1, but it is an inverse
performance measure. Its zero value denotes a big discriminating power of a
discriminant function, whereas the value equal to one – a small one.411
The Wilks’s lambda can also be used for testing on existence of differences
between groups on chosen feature variables and therewith for examining statistical
significance of a discriminant function. In order to do this, the multivariate
Wilks’s lambda should be obtained first through multiplying Wilks’s lambdas of
all feasible discriminant functions:412
406 See Backhaus/Erichson/Plinke/Weiber, 2003, p. 166. 407 Klecka, 1982, p. 37. 408 See Cooley/Lohnes, 1971, p. 249 and Klecka, 1982, p. 36. 409 See Klecka, 1982, p. 37. 410 See Backhaus/Erichson/Plinke/Weiber, 2003, p. 182. 411 See ibid. 412 See ibid. p. 184.

Steps and Methodologies of International Market Segmentation Analysis
112
=mΛ ∏= +
I
1i iγ11 (3-56)
Then, it should be converted into the chi-square:413
m2 lnΛ12
RNJχ ⎥⎦⎤
⎢⎣⎡ −
+−−= (3-57)
distributed with 1)(RN −⋅ degrees of freedom,
where
J is the number of individuals
N is the number of variables
R is the number of groups
Finally, 2χ should be compared with standard tables presenting corresponding
significance levels. Here the significance test presents the test of the null
hypothesis that there are no differences between groups against the alternative
hypothesis that there are differences between groups.414
Low significance levels denote that there are differences between groups. This also
means that at least the discriminant function derived first is statistically
significant.415 Moreover, higher values of 2χ denote bigger differences between the
groups.416
With every derived discriminant function some part of discriminating information
is removed from the data. In order to determine if after derivation of the first i
discriminant functions there is residual discrimination in the data sufficient for
derivation of further discriminant functions contributing significantly to group
differentiation, one should refer to the Wilks’s lambda for residual
discrimination
=riΛ ∏
+= +
I
1ik kγ11 (i = 0, 1,…, I-1), (3-58)
where
kγ is an eigenvalue of a discriminant function k
413 See ibid. pp. 183-184. 414 See Klecka, 1982, p. 40 and Backhaus/Erichson/Plinke/Weiber, 2003, p. 183. 415 See Klecka, 1982, p. 40. 416 See Backhaus/Erichson/Plinke/Weiber, 2003, p. 183.
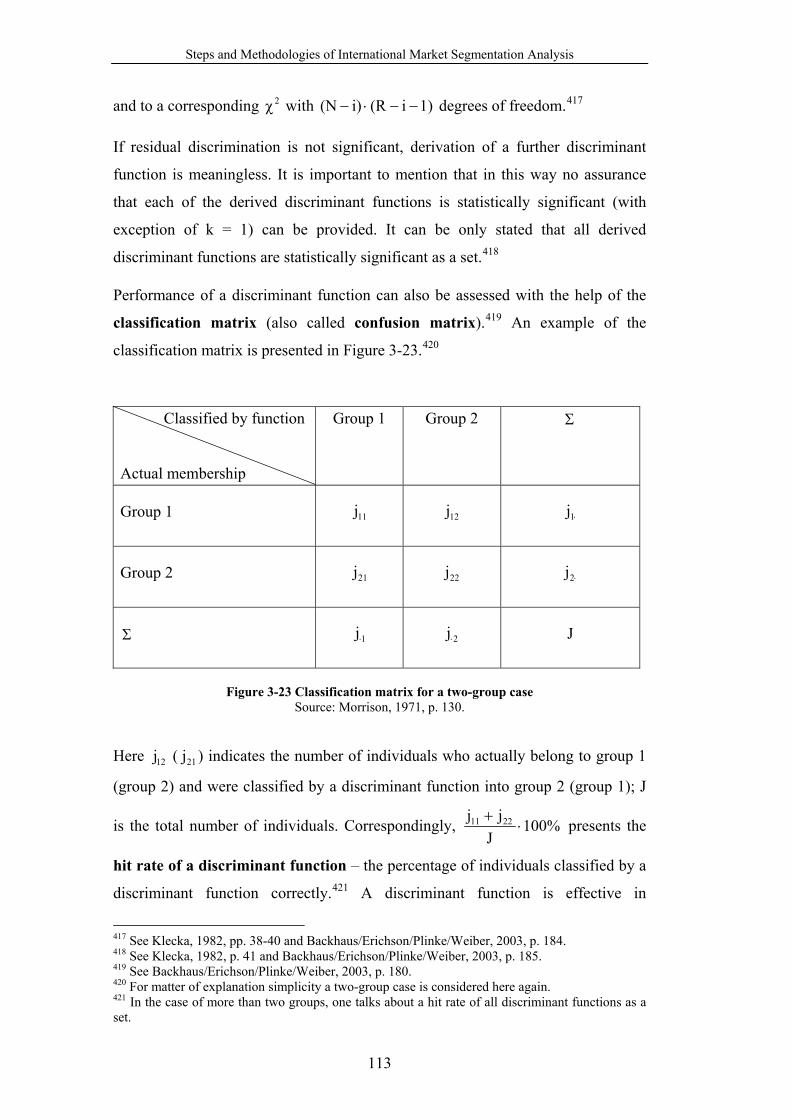
Steps and Methodologies of International Market Segmentation Analysis
113
and to a corresponding 2χ with 1)i(Ri)(N −−⋅− degrees of freedom.417
If residual discrimination is not significant, derivation of a further discriminant
function is meaningless. It is important to mention that in this way no assurance
that each of the derived discriminant functions is statistically significant (with
exception of k = 1) can be provided. It can be only stated that all derived
discriminant functions are statistically significant as a set.418
Performance of a discriminant function can also be assessed with the help of the
classification matrix (also called confusion matrix).419 An example of the
classification matrix is presented in Figure 3-23.420
Classified by function
Actual membership
Group 1 Group 2 Σ
Group 1 11j 12j ⋅1j
Group 2 21j 22j ⋅2j
Σ 1j⋅ 2j⋅ J
Figure 3-23 Classification matrix for a two-group case
Source: Morrison, 1971, p. 130.
Here 12j ( 21j ) indicates the number of individuals who actually belong to group 1
(group 2) and were classified by a discriminant function into group 2 (group 1); J
is the total number of individuals. Correspondingly, %100J
jj 2211 ⋅+ presents the
hit rate of a discriminant function – the percentage of individuals classified by a
discriminant function correctly.421 A discriminant function is effective in
417 See Klecka, 1982, pp. 38-40 and Backhaus/Erichson/Plinke/Weiber, 2003, p. 184. 418 See Klecka, 1982, p. 41 and Backhaus/Erichson/Plinke/Weiber, 2003, p. 185. 419 See Backhaus/Erichson/Plinke/Weiber, 2003, p. 180. 420 For matter of explanation simplicity a two-group case is considered here again. 421 In the case of more than two groups, one talks about a hit rate of all discriminant functions as a set.
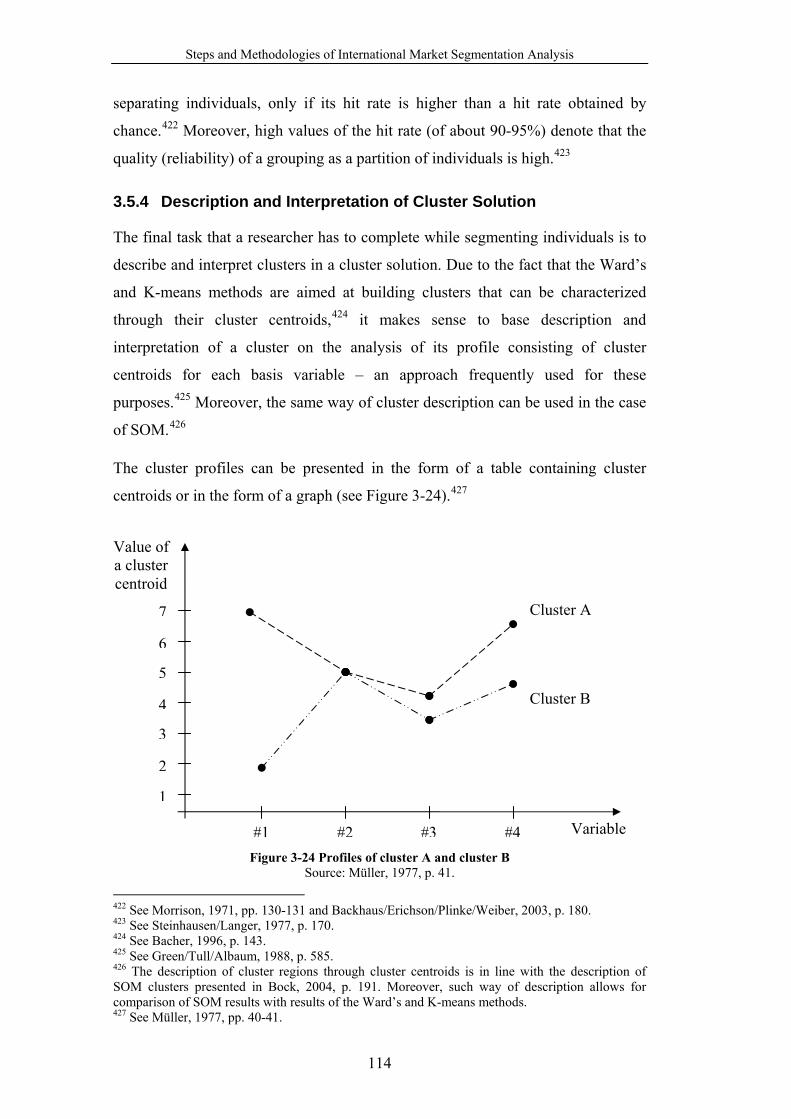
Steps and Methodologies of International Market Segmentation Analysis
114
separating individuals, only if its hit rate is higher than a hit rate obtained by
chance.422 Moreover, high values of the hit rate (of about 90-95%) denote that the
quality (reliability) of a grouping as a partition of individuals is high.423
3.5.4 Description and Interpretation of Cluster Solution
The final task that a researcher has to complete while segmenting individuals is to
describe and interpret clusters in a cluster solution. Due to the fact that the Ward’s
and K-means methods are aimed at building clusters that can be characterized
through their cluster centroids,424 it makes sense to base description and
interpretation of a cluster on the analysis of its profile consisting of cluster
centroids for each basis variable – an approach frequently used for these
purposes.425 Moreover, the same way of cluster description can be used in the case
of SOM.426
The cluster profiles can be presented in the form of a table containing cluster
centroids or in the form of a graph (see Figure 3-24).427
Figure 3-24 Profiles of cluster A and cluster B Source: Müller, 1977, p. 41.
422 See Morrison, 1971, pp. 130-131 and Backhaus/Erichson/Plinke/Weiber, 2003, p. 180. 423 See Steinhausen/Langer, 1977, p. 170. 424 See Bacher, 1996, p. 143. 425 See Green/Tull/Albaum, 1988, p. 585. 426 The description of cluster regions through cluster centroids is in line with the description of SOM clusters presented in Bock, 2004, p. 191. Moreover, such way of description allows for comparison of SOM results with results of the Ward’s and K-means methods. 427 See Müller, 1977, pp. 40-41.
Cluster A
Cluster B
Variable #1 #2 #3 #4
Value of a cluster centroid
1
2
3
4
5
6
7

Steps and Methodologies of International Market Segmentation Analysis
115
Additionally, clusters should be described by means of descriptor variables, in
order to allow for more precise description and interpretation of clusters and to
facilitate the development and implementation of cluster-specific marketing
programs.428
428 See Frank/Massy/Wind, 1972, p. 19 and Steinhausen/Langer, 1977, p. 21.

International Market Segmentation Study
116
4 International Market Segmentation Study
4.1 Study Purpose and Design
The international market segmentation study presented in this part of the thesis is
aimed at investigation of advantages and limitations of additive intranational
market segmentation and integral market segmentation as well as evaluation of
effectiveness of segmentation approaches based on the Ward’s method, K-means
method, and SOM in finding transnational segments.
The following general steps were done while conducting this study:
1. Defining the relevant market.
2. Deciding on the segmentation approach and methodology.
3. Procuring the data.
4. Selecting basis and descriptor variables.
5. Conducting the analysis:
a) conducting additive intranational market segmentation using
three segmentation approaches (based on the Ward’s method, K-
means method, and SOM) and assessing their effectiveness;
b) conducting integral market segmentation using three
segmentation approaches (based on the Ward’s method, K-
means method, and SOM) and assessing their effectiveness;
c) contrasting additive intranational market segmentation and
integral market segmentation.
4.2 Defining Relevant Market
While defining the market considered in the case of the international market
segmentation study, instructions of the Beiersdorf company – the initiator of the
study and provider of the data for the analysis – were followed. In particular, the
next market parameters were set:
- business: business of the Beiersdorf company at the female skin and body
care market, where the company is presented through NIVEA brand;
- products: thirteen general skin and body care product categories;
- market geographical boundaries: twenty one countries;

International Market Segmentation Study
117
- market temporal boundaries: years 2003 and 2004.
A more detailed description of the relevant issues is presented below.
4.2.1 Essence of Study Initiator’s Business
For better understanding of the essence of Beiersdorf’s business at the market
considered, a brief portrayal of both the Beiersdorf company and its brand NIVEA
is presented below.
4.2.1.1 Portrayal of Beiersdorf
Beiersdorf is a leading international company developing, manufacturing, and
distributing branded consumer products for skin and beauty care, wound treatment,
and adhesive products.429
The Beiersdorf company was established on the 28th of March 1882 in Hamburg as
the pharmacist Carl Paul Beiersdorf took out patent number 20057 describing the
new method developed by him for manufacturing of medical plasters (see Figure
4-1).430
Figure 4-1 Establishment of the Beiersdorf company Source: Beiersdorf-Aktiengesellschaft (Hrsg.) (1999), Das Unternehmen Beiersdorf, p. 9.
429 See Beiersdorf-Aktiengesellschaft (Hrsg.) (1999), Das Unternehmen Beiersdorf, p. 7 and www.beiersdorf.com. 430 See Beiersdorf-Aktiengesellschaft (Hrsg.) (1982), “100 Jahre Beiersdorf”, p. 4.
Carl Paul Beiersdorf Founder of the company
Dr. Oscar Troplowitz 1890 took over the company
The date of the patent document is taken as the establishment date

International Market Segmentation Study
118
In 1890 the Beiersdorf’s laboratory was acquired by the pharmacist Dr. Oskar
Troplowitz (see Figure 4-1). This talented entrepreneur and scientist possessing a
keen sense of consumer needs started developing innovative products and
brands.431
Since that time, the assortment of the Beiersdorf company has been constantly
expanding, and today it includes such core brands as NIVEA, atrix, Elastoplast,
Eucerin, Florena, Futuro, Hansaplast, Juvena, Labello, la prairie, tesa, and 8x4 (see
Figure 4-2).432
Figure 4-2 Core brands of the Beiersdorf company
The headquarter of the contemporary Beiersdorf company is still located in
Hamburg. Moreover, the company is presented through more than 130 affiliates
and joint ventures in a big number of countries. All together around 17 thousand
employees work at the Beiersdorf company worldwide.433
The Beiersdorf company is a typical example of a multi-product manufacturer
dealing with heterogeneous needs and wants of consumers worldwide. No wonder
that the issue of international market segmentation gains currently in importance
431 See Beiersdorf-Aktiengesellschaft (Hrsg.) (1982), “100 Jahre Beiersdorf”, p. 4 and Beiersdorf-Aktiengesellschaft (Hrsg.) (1999), Das Unternehmen Beiersdorf, p. 8. 432 See www.beiersdorf.com. 433 See ibid.

International Market Segmentation Study
119
for this company. Especially, in the case of such truly international brand as
NIVEA.
4.2.1.2 Portrayal of Umbrella Brand NIVEA
The history of NIVEA brand begins in 1911. That year Dr. Oscar Troplowitz has
acquired the patent of Dr. Isaac Lifschütz describing the method for developing the
first water-in-oil emulsifier called “Eucerit”. This product has enabled combining
oil and water to a stable emulsion used as a base for ointments. Dr. Oscar
Troplowitz inspired by his scientific advisor Prof. Paul Gerson Unna could make
use of “Eucerit” for invention of the first long-lasting cream. Due to its stable
consistency, the cream had a white color. Correspondingly, it was named
“NIVEA”, from the Latin word “niveus/nivea/niveum” meaning “Snow-white”.434
Since 1911, the world of NIVEA has expanded dramatically. NIVEA brand has
become an umbrella brand including a big variety of subbrands (see Figure 4-3).
Although each subbrand has a stand-alone visual identity, one can easily notice
that they belong to one and the same “family”. This uniformity is based on two
fundamental elements: NIVEA font (in particular, “NIVEA” logo in capital letters)
and NIVEA colors (in particular, blue/white color combination).435
Today, NIVEA is the world’s biggest skin and body care brand. It is sold in about
150 countries. Despite the high level of competition consisting of both numerous
local brands and such truly international brands as Dove, L’Oreal, and Oil of Olay,
NIVEA succeeds to remain a highly trusted and used brand all over the world.436 It
stands for “successful interplay of groundbreaking research, creativity, and
entrepreneurial expertise”437. The essence of NIVEA brand is expressed through
the next statement: “Empathetic, mild yet effective care to look and feel your
best”438.
434 See Beiersdorf-Aktiengesellschaft (Hrsg.) (1982), 100 Jahre Beiersdorf: 1882-1982, pp. 22-23, Hansen, 2001, p. 27, and www.nivea.co.uk. 435 See Verlagsgruppe Milchstrasse (Hrsg.) (1998), Märkte und Marken, Fallstudie NIVEA, pp. 2-3, Hansen, 2001, p. 102, and NIVEA Brand Philosophy 2003, p. 32. 436 See www.beiersdorf.com and www.nivea.co.uk. 437 www.beiersdorf.com. 438 NIVEA Brand Philosophy 2003, p. 17.

International Market Segmentation Study
120
Figure 4-3 World of NIVEA
4.2.2 Skin and Body Care Product Categories
As it was already mentioned above, female users of skin and body care products
were considered within the scope of the present study. In particular, the following
general categories of skin and body care products were regarded:439
1. All purpose creams
2. Hand creams
3. Face care and cleansing
4. Body milk/ lotions
5. Lip care 439 See Master Skin Care Questionnaire 2003.

International Market Segmentation Study
121
6. Sun protection
7. Baby care
8. Men’s care (i.e., shaving products, face care)
9. Deodorants
10. Soap, bath and shower products
11. Hair care (i.e., shampoo, rinse, cure)
12. Hair styling (i.e., spray, setting foam, gel)
13. Decorative cosmetics (i.e., lipsticks, make-up, nail varnish, mascara)
4.2.3 Geographical and Temporal Market Boundaries
Twenty one countries were investigated in the scope of the present study (see
Table 4-1). Correspondingly, the next five regions of the world were taken into
consideration:
- Africa;
- Asia;
- Australia;
- Europe;
- South America.
Although, data from a bigger number of countries were originally available, it was
decided to limit investigation to the data from years 2003 and 2004. In particular, it
was assumed that the data from a time period of two subsequent years could be
considered as the data from one wave of data collection because country-specific
data collection did not normally take place every year, and its planning had
differed from country to country.
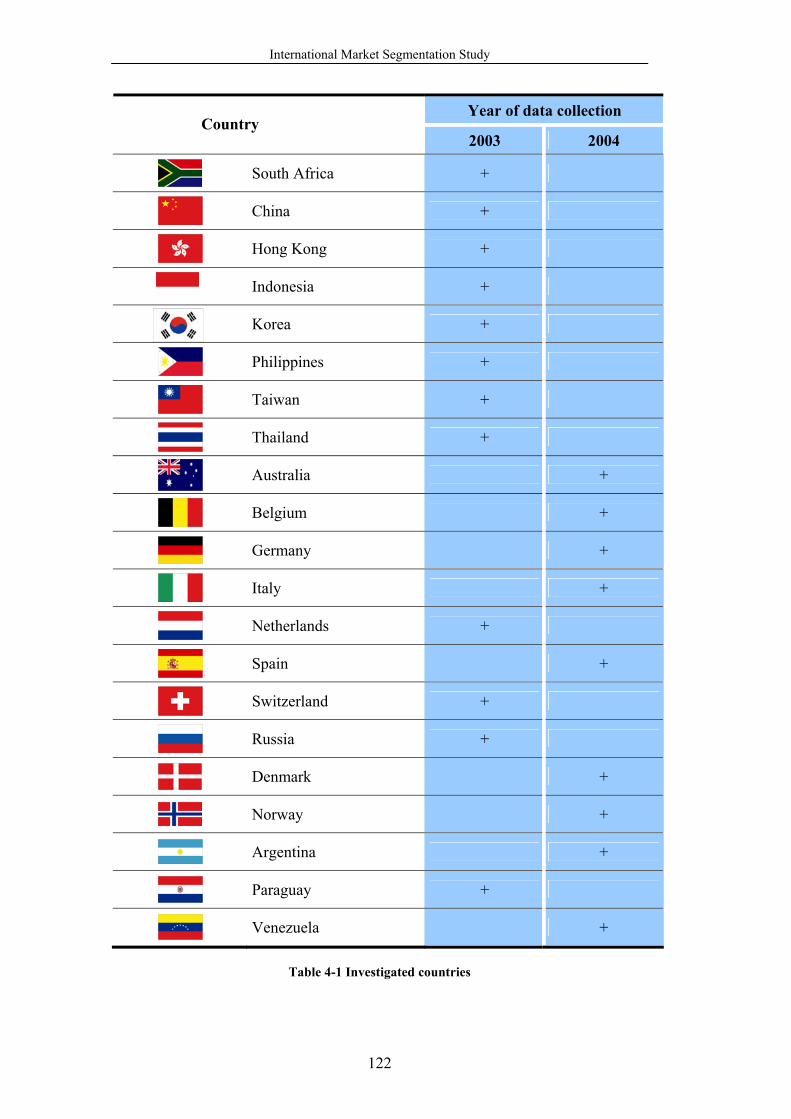
International Market Segmentation Study
122
Year of data collection Country
2003 2004
South Africa +
China +
Hong Kong +
Indonesia +
Korea +
Philippines +
Taiwan +
Thailand +
Australia +
Belgium +
Germany +
Italy +
Netherlands +
Spain +
Switzerland +
Russia +
Denmark +
Norway +
Argentina +
Paraguay +
Venezuela +
Table 4-1 Investigated countries
International Market Segmentation Study
123
4.3 Deciding on Segmentation Approach and Methodology
Three types of choice were done at this step. Firstly, the type of a segmentation
model was defined. It was decided to conduct neither a-priori nor hybrid, but a-
posteriori segmentation. This can be explained by the fact that the study was
intended for forming segments on the base of similarities in characteristics of the
market members. No information on the number or type of these segments was
available in advance.
Secondly, as far as similarities within one set of basis variables had to be
investigated, and no distinction between dependent and independent variables had
to be made, the nature of segmentation methods was determined to be descriptive,
not predictive. In particular, as it was already mentioned above, the Ward’s
method, K-means method, and SOM were considered.
Thirdly, it was decided to conduct exclusively consumer-related market
segmentation. Exclusively country-related segmentation was not considered as an
option for conducting international market segmentation analysis, due to the fact
that the interest of the study was in segments consisting of individuals, not of
countries. Moreover, as far as all relevant countries were defined in advance,
conducting macro-level market segmentation as a part of country- and consumer-
related market segmentation appeared to be redundant.
As it was already mentioned above, both forms of exclusively consumer-related
market segmentation (additive intranational market segmentation and integral
market segmentation) were considered within the scope of this study.
4.4 Procuring Data
Each of the twenty one national data sets used in this study was chosen from data
in the data bank of the International NIVEA Brand Monitor – an individual
quantitative survey representing users of skin and body care products of a
corresponding country.440 It is primarily aimed at evaluating and tracking the
standing of the umbrella brand NIVEA, its subbrands, and its main competitors in
terms of
440 See Krapp/Grieb/Voss, 2003, p. 2.
International Market Segmentation Study
124
- brand awareness, sympathy, and usage;
- brand image and fulfillment of consumer requirements;
- brand communication effectiveness.441
Data from the data banks of International NIVEA Brand Monitors used for this
study should be viewed as company-internal secondary data. Due to the fact that
market segmentation belongs to specific purposes of the International NIVEA
Brand Monitor and is conducted officially and on a regular basis for all countries
investigated in this study, it can be stated that such disadvantages of secondary
data as mismatch of measurement units and data classification definitions with
those required for the current study, lack of the data timeliness, and limited
possibility to assess the data credibility are minimized.
Peculiarities of collecting data for the data bank of the International NIVEA Brand
Monitor in the case of each of the twenty one countries are presented below.
4.4.1 Fieldwork Dates
The decision about the date of a fieldwork in each particular country was made
jointly by the headquarter of the Beiersdorf company, its corresponding local
subsidiaries, and market research institutes involved into the survey. It depended
mainly on such criteria as strategies and budgeting of the Beiersdorf company,
importance of changes and developments taking place at each particular market,
and working style of the market research institutes. The dates of the fieldworks in
each of the twenty one countries considered in this study are presented in Table 4-
2.
441 See International NIVEA Brand Monitor Presentation 2004: Germany and International NIVEA Brand Monitor Presentation 2004: Spain.

International Market Segmentation Study
125
Region Country Fieldwork date Africa South Africa October 2003 Asia China July/August 2003 Asia Hong Kong July/August 2003 Asia Indonesia July/August 2003 Asia Korea July/August 2003 Asia Philippines July/August 2003 Asia Taiwan July/August 2003 Asia Thailand July/August 2003 Australia Australia June 2004 Europe Belgium Mai 2004 Europe Germany February 2004 Europe Italy April 2004 Europe Netherlands September/October 2003 Europe Spain July 2004 Europe Switzerland November/December 2003Europe (East) Russia February 2003 Europe (Nordics) Denmark September 2004 Europe (Nordics) Norway September 2004 South America Argentina June 2004 South America Paraguay November/December 2003South America Venezuela June 2004
Table 4-2 Fieldwork dates
Source: International NIVEA Brand Monitor Presentations 2003-2004: each of the presented countries.
4.4.2 Fieldwork Locations
The primary criteria for making a choice of a fieldwork location were the scope of
activities of the Beiersdorf company and market peculiarities in each particular
country. In countries, where buying and consumption of NIVEA brand were
considered to be rather equally spread across large and small towns, interviews
were normally conducted in towns of a different size (for instance, in Germany).
At the same time, in countries, where NIVEA brand buyers and consumers were
expected to be concentrated in central locations, interviews were conducted in
major cities only (for instance, in China). Other reasons for choosing only major
cities as fieldwork locations were, for instance, budgeting of the Beiersdorf
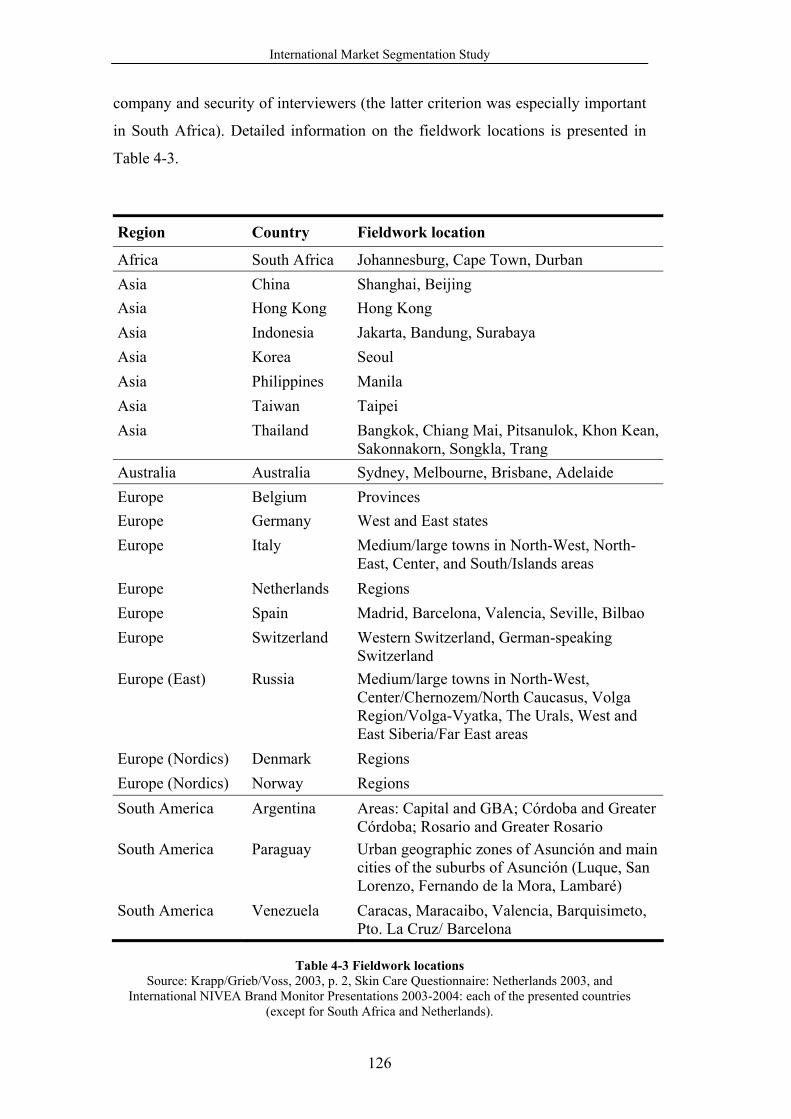
International Market Segmentation Study
126
company and security of interviewers (the latter criterion was especially important
in South Africa). Detailed information on the fieldwork locations is presented in
Table 4-3.
Region Country Fieldwork location
Africa South Africa Johannesburg, Cape Town, Durban Asia China Shanghai, Beijing Asia Hong Kong Hong Kong Asia Indonesia Jakarta, Bandung, Surabaya Asia Korea Seoul Asia Philippines Manila Asia Taiwan Taipei Asia Thailand Bangkok, Chiang Mai, Pitsanulok, Khon Kean,
Sakonnakorn, Songkla, TrangAustralia Australia Sydney, Melbourne, Brisbane, Adelaide Europe Belgium Provinces Europe Germany West and East states Europe Italy Medium/large towns in North-West, North-
East, Center, and South/Islands areas Europe Netherlands Regions Europe Spain Madrid, Barcelona, Valencia, Seville, Bilbao Europe Switzerland Western Switzerland, German-speaking
SwitzerlandEurope (East) Russia Medium/large towns in North-West,
Center/Chernozem/North Caucasus, Volga Region/Volga-Vyatka, The Urals, West and East Siberia/Far East areas
Europe (Nordics) Denmark Regions Europe (Nordics) Norway Regions South America Argentina Areas: Capital and GBA; Córdoba and Greater
Córdoba; Rosario and Greater Rosario South America Paraguay Urban geographic zones of Asunción and main
cities of the suburbs of Asunción (Luque, San Lorenzo, Fernando de la Mora, Lambaré)
South America Venezuela Caracas, Maracaibo, Valencia, Barquisimeto, Pto. La Cruz/ Barcelona
Table 4-3 Fieldwork locations
Source: Krapp/Grieb/Voss, 2003, p. 2, Skin Care Questionnaire: Netherlands 2003, and International NIVEA Brand Monitor Presentations 2003-2004: each of the presented countries
(except for South Africa and Netherlands).

International Market Segmentation Study
127
4.4.3 Fieldwork Methodology, Sample Definition, and Questionnaire Contents
One of the three following fieldwork methodologies was used for the data
collection in the considered countries:
- Verbal survey: face-to-face (conventional survey), in-home;
- Verbal survey: Computer Assisted Personal Interview (CAPI), in-home;
- Computer survey: Computerized Self-Administered Questionnaire Survey
(CSAQ-Survey), online.
In each country, the data were collected from a representative sample reflecting
local population composition. Normally, only female respondents were considered.
In some countries, men were interviewed too, but their answers were ignored
within the scope of the present study.
General contents of the questionnaires consisted of the following topics:442
- awareness:
ο unprompted and prompted awareness of brands,
ο prompted awareness of NIVEA subbrands;
- likeability:
ο likeability of brands,
ο likeability of NIVEA subbrands;
- usage of brands:
ο usage of brands,
ο brands used in the past,
ο brands never used,
ο usage of skin and body care products,
ο usage of NIVEA subbrands;
- image:
ο brand image (based on fulfilment of requirements towards a
product/brand),
442 See International NIVEA Brand Monitor Presentation 2003: Russia, International NIVEA Brand Monitor Presentation 2003: Switzerland, Master Skin Care Questionnaire 2003, Skin Care Questonnaires 2003-2004: each of the investigated countries, and International NIVEA Brand Monitor Presentation 2004: Germany.

International Market Segmentation Study
128
ο scaled assessment of importance of requirements towards a
product/brand (for instance, “Products offer good value for money”,
“Products are of higher quality”, “It is a trustworthy brand”),
ο attributes of brands (for instance, “Familiar”, “Reliable”, “Classic”)
ο suitability of NIVEA subbrands to NIVEA;
- advertising:
ο prompted advertising recall of brands,
ο scaled assessment of advertising for NIVEA,
ο prompted advertising recall of NIVEA subbrands;
- statistics:
ο demographic characteristics:
age of a respondent,
marital status of a respondent,
number of people in a household,
children in a household,
education level of a respondent,
employment status of a respondent,
monthly household income/ social class,
location,
ο type and sensitivity of face and body skin,
ο media usage,
ο point of purchase;
- genesis of NIVEA:
ο spontaneous associations with NIVEA,
ο first contact with NIVEA,
ο known activities of NIVEA;
- personal attitudes towards beauty/life (for instance, “I like to look nice at
all times”, “I keep up to date with the latest fashions”, “I put my family’s
needs before mine”).
Fieldwork methodologies used in the case of each particular country as well as age
ranks and sizes of representative female samples are presented in Table 4-4.

International Market Segmentation Study
129
Region Country Fieldwork methodology Sample definition
Africa South Africa Face-to-face (conventional survey), in-home
Females aged 18 – 49 years using skin and body care products; N=801
Asia China Face-to-face (conventional survey), in-home
Females aged 18 – 59 years using skin and body care products; n=800
Asia Hong Kong Face-to-face (conventional survey), in-home
Females aged 18 – 59 years using skin and body care products; n=504
Asia Indonesia Face-to-face (conventional survey), in-home
Females aged 15 – 54 years using skin and body care products; N=826
Asia Korea Face-to-face (conventional survey), in-home
Females aged 18 – 59 years using skin and body care products; N=500
Asia Philippines Face-to-face (conventional survey), in-home
Females aged 18 – 59 years using skin and body care products; N=500
Asia Taiwan Face-to-face (conventional survey), in-home
Females aged 18 – 59 years using skin and body care products; N=504
Asia Thailand Face-to-face (conventional survey), in-home
Females aged 18 – 59 years using skin and body care products; N=1000
Australia Australia CSAQ-Survey, online
Females aged 18 – 65 years using skin and body care products; N=581
Europe Belgium CAPI, in-home Females aged 15 years and older using skin and body care products; N=372
Europe Germany CAPI, in-home Females aged 14 – 65 years using skin and body care products; N=1047
Europe Italy Face-to-face (conventional survey), in-home
Females aged 14 – 65 years using skin and body care products; N=521
Europe Netherlands Face-to-face (conventional survey), in-home
Females aged 18 – 65 years using skin and body care products; N=491
Europe Spain CAPI, in-home Females aged 14 – 65 years using skin and body care products; N=755
Europe Switzerland Face-to-face (conventional survey), in-home
Females aged 18 – 65 years using skin and body care products; N=506

International Market Segmentation Study
130
Europe (East)
Russia Face-to-face (conventional survey), in-home
Females aged 18 – 64 years using skin and body care products; N=1200
Europe (Nordics)
Denmark CSAQ-Survey, online
Females aged 15 – 65 years using skin and body care products; N=400
Europe (Nordics)
Norway CSAQ-Survey, online
Females aged 15 – 65 years using skin and body care products; N=366
South America
Argentina Face-to-face (conventional survey), in-home
Females aged 18 – 65 years using skin and body care products; N=516
South America
Paraguay Face-to-face (conventional survey), in-home
Females aged 15 – 65 years using skin and body care products; N=402
South America
Venezuela Face-to-face (conventional survey), in-home
Females aged 18 – 65 years using skin and body care products; N=800
Table 4-4 Fieldwork methodologies, age ranks and sizes of samples
Source: Krapp/Grieb/Voss, 2003, p. 2 and International NIVEA Brand Monitor Presentations 2003-2004: each of the presented countries.
4.5 Selecting Basis and Descriptor Variables
As far as collecting data for the data bank of the International NIVEA Brand
Monitor is the standard procedure, it was impossible to influence the contents of
the questionnaires before the fieldworks took place. Therefore, basis and descriptor
variables used in this study were chosen from the contents of the International
NIVEA Brand Monitor data banks after the data procurement took place.
In particular, it was decided to use requirements of respondents towards a
product/brand (i.e., needs of respondents) as basis variables.
Such choice was done primarily because basis variables were expected to be
measured on a metric scale, in order to enable conduction of factor analysis,
cluster analyses, SOM, and discriminant analysis. In particular, the next two types
of variables were considered first: requirements towards a product/brand and
attitudes towards beauty/life. Both of them were measured on a seven point rating
scale (see Figure 4-4).

International Market Segmentation Study
131
Figure 4-4 Assessment scales Furthermore, basis variables were expected to be present in all countries
investigated, in order to guarantee comparability of results of intranational
segmentations as well as to allow for conducting integral market segmentation and
comparing its results with results of additive intranational market segmentation.
Attitudes towards beauty/life (except for only a very few of them) failed to fulfill
this requirement and were not considered any longer. The number and composition
of requirements towards a product/brand available in the data bank also varied
strongly from country to country. Nevertheless, the next fourteen requirements
towards a product/brand were found in every country and assigned the status of
basis variables:
- products offer good value for money
- products are of high quality
- it is a trustworthy brand
- products fulfill current expectations towards skin care
- products perform better than those of other brands
- products contain highly effective ingredients
- this brand is highly advertised
- it is a modern brand
- this brand offers mild skin care products
- products are suitable for sensitive skin
- products rely on the latest scientific findings
1 7
Not important at all Very important
Assessment scale used in the case of requirements towards a product/brand
Assessment scale used in the case of attitudes towards beauty/life
1 7
I fully disagree I fully agree

International Market Segmentation Study
132
- products are highly appropriate for skin
- products have a pleasant fragrance
- this brand is for demanding women who give importance to their
appearance
It was decided, that such segmentation base is highly appropriate for the present
study, due to the fact that results of this study were expected to be used for
constructing international market segmentation strategies.443
Moreover, assessment of the quality of the chosen segmentation base by means of
examining the fourteen statements themselves as well as results of the several first
intranational segmentations has demonstrated rather satisfactory results. In
particular, it was concluded that
- the chosen segmentation base allowed to find segments of respondents with
distinct requirements towards brands/products easily (i.e., fulfillment of
the identifiably condition);
- the size of obtained segments was normally substantial enough for
considering them while constructing marketing strategies (i.e., fulfillment
of the substantiality condition);
- relationship between obtained segments and media types was often (but not
always) quite strong and clear; moreover, members of one and the same
segment were often (but not always) concentrated in the same geographical
area and visited the same purchase locations (i.e., partial fulfillment of the
accessibility condition);
- as far as the fourteen requirements towards a product/brand were linked to
rather basic, thus rather stable needs of respondents, the character of
segments were not likely to change dramatically with the time (i.e., high
probability of fulfillment of the stability condition);
- as far as the fourteen requirements towards a product/brand were directly
connected to the core element of the marketing mix – the product444,
obtained segments could be considered as actionable and responsive (i.e.,
fulfillment of the actionability and responsiveness conditions). 443 This conclusion was made on the base of the guideline for choosing segmentation bases presented in part 3.4.1.1 of this thesis (the present study refers to the category “Positioning studies”). 444 As defined by Bauer, 2000, p. 2797.
International Market Segmentation Study
133
The chosen segmentation base has also demonstrated the ability to exhibit
construct equivalence. In particular, the following statements could be made:
- the chosen basis variables present skin and body care characteristics
performing the same function of describing a product/brand (requirements
to a product/brand) in all countries investigated (i.e., fulfillment of the
functional equivalence condition);
- the chosen basis variables present such skin and body care characteristics
that are existent and normally identically interpreted in all countries
investigated (i.e., fulfillment of the conceptual equivalence condition);
- in all considered countries, concepts presented through the chosen basis
variables belong to the same category “Skin and Body Care
Characteristics” (i.e., fulfillment of the category equivalence condition).
Finally, as far as data in the data banks of International NIVEA Brand Monitors
conducted in different countries are used by the Beiersdorf company for
comparative and combinational purposes officially and on a regular basis, it was
assumed that equivalence of research methods, objects, situations, and data
processing was guaranteed, and thus no discrepancies would be expected with
regard to the quality of the chosen basis variables and reliability of corresponding
transnational segments.
After the basis variables were defined, it was decided to choose descriptor
variables for more precise description and interpretation of segments as well as
facilitation of development and implementation of international market
segmentation strategies. It was attempted to select variables which could be related
to both the fourteen requirements towards a product/brand presented above and
elements of marketing mix (product, promotion, distribution, and price). Due to the
fact that the size and structure of data available in the International NIVEA Brand
Monitor data banks differed across the investigated countries, existence of cross-
national distinctions in the number, type and scaling of the variables chosen as
descriptor variables could not be avoided. All descriptor variables considered
within the scope of the present study are listed in Table 4-5.

International Market Segmentation Study
134
Country Descriptor variables
All countries
Requirements towards a product/brand not used for cluster building
Attitudes towards beauty/life
Demographic characteristics (age of a respondent, marital status of a respondent, number of people in a household, employment status of a respondent, living location of a respondent)
Brand assessments (prompted awareness, likeability, usage and prompted advertising recall of brands)
Skin conditions (face skin type and sensitivity, body skin type and sensitivity)
All countries (except for Spain)
Media usage
All countries (except for Spain and Russia)
Number of children under 16 years in a household
Spain Presence of children below 15 years in a household
Russia Presence of children below 14 years in a household
All countries (except for Germany, Italy, Spain, Denmark, Norway and Venezuela)
Point of purchase
All countries (except for South Africa, Australia, Germany, Spain, Denmark, Norway)
Education level of a respondent
Asia, Australia, Russia, Denmark, Norway, Venezuela
Monthly household income
South Africa, Belgium, Italy, Spain, Switzerland, Argentina, Venezuela
Social class
Table 4-5 Descriptor variables

International Market Segmentation Study
135
4.6 Conducting Analysis
4.6.1 Additive Intranational Market Segmentation
4.6.1.1 Data Preparation Using Factor Analysis
Before conducting segmentation analyses, it was decided to transform the fourteen
basis variables (requirements towards a product/brand) by means of factor analysis
into factor values, in order to exclude correlations in the input data and thus to
avoid overemphasis distortions while clustering respondents.
The newest program running factor analysis is the SPSS software445 – a versatile
computer package enabling performing a wide variety of complex statistical
analyses.446
All calculations necessary for conduction of factor analysis were done by means of
the Factor procedure of the SPSS software.447
In order to make a conclusion about the reasonability of conducting factor analysis
on the input data used in the case of each of the twenty one investigated countries,
correlation matrices were examined first. Due to the fact that values of majority of
correlation coefficients were rather not very high (of about 0.2 - 0.5), it was
decided to consider other criteria too. The following observations were made for
all countries:
- significance levels of majority of correlation coefficients are close to zero
meaning that majority of correlation coefficients are significantly different
from zero;
- majority of non-diagonal elements of the inverse correlation matrices and
anti-image covariance matrices are close to zero;
- significances of the Bartlett’s test are equal to zero meaning that the
probability that the data are correlated is equal to 100%, and thus the
correlation matrix is definitely different from the unit matrix;
- MSA ≥ 0.8 (see Table 4-6).
445 According to Pinnekamp/Siegmann, 2001, p. 268, SPSS stands for “Superior Performing Software System”. 446 See Voelkl/Gerber, 1999, p. 3 and Hinton/Brownlow/McMurray/Cozens, 2004, p. XV. 447 Here and in the following the eleventh version of the SPSS software was used.

International Market Segmentation Study
136
Region Country MSA Africa South Africa 0.81 Asia China 0.83 Asia Hong Kong 0.86 Asia Indonesia 0.85 Asia Korea 0.84 Asia Philippines 0.83 Asia Taiwan 0.84 Asia Thailand 0.86 Australia Australia 0.83 Europe Belgium 0.86 Europe Germany 0.91 Europe Italy 0.86 Europe Netherlands 0.82 Europe Spain 0.91 Europe Switzerland 0.85 Europe (East) Russia 0.87 Europe (Nordics) Denmark 0.86 Europe (Nordics) Norway 0.89 South America Argentina 0.83 South America Paraguay 0.80 South America Venezuela 0.88
Table 4-6 Measures of sampling adequacy (MSA)
All this has allowed assuming that conducting factor analysis is reasonable in all
countries.
To determine the number of factors to be extracted by means of PCA, the Kaiser
criterion was used first in the case of all countries.
Factor interpretation and naming were started then on the base of the rotated
component matrices obtained after conducting the Varimax rotation. The name of a
factor had to present the collective term for all variables highly loaded on it. At
that stage, it was noticed that, in the case of some countries, factors were too
aggregated, and their further diversification was required. Correspondingly, factor
solutions with a bigger number of factors were inquired. The final factor solutions
chosen in the case of each country as well as the respective percentages of the total
variance explained by extracted factors individually and cumulatively are

International Market Segmentation Study
137
demonstrated in Table 4-7. Statement compositions of the factors can be found in
Appendix A-1.
Region Country Factors % of total variance explained
Cumulative%
Africa South Africa Quality Brand glamor Sensitivity and mildness
27.78 15.23 8.15
51.16
Asia China Quality Brand glamor Sensitivity and mildness
32.34 15.44 7.67
55.44
Asia Hong Kong Quality Brand glamor Sensitivity and mildness
32.45 18.02 8.08
58.56
Asia Indonesia Quality Sensitivity and mildnessBrand glamor
30.53 12.25 8.10
50.90
Asia Korea Quality Sensitivity and mildnessBrand glamour
32.83 13.04 7.14
53.00
Asia Philippines
Sensitivity, mildness, and effectiveness Quality Brand popularity
31.52 10.71 10.45
52.68
Asia Taiwan
Quality Mildness, sensitivity, and effectiveness Brand glamor
38.74
12.89 8.25
59.88
Asia Thailand Quality Brand glamor Sensitivity and mildness
32.61 13.42 8.18
54.21
Australia Australia Quality Brand glamor Sensitivity and mildness
30.24 14.84 9.06
54.13
Europe Belgium
Sensitivity and quality Brand glamor Good value for money Pleasant fragrance
32.13 14.85 6.90 6.57
60.46
Europe Germany Quality Brand glamor Sensitivity and mildness
37.62 14.98 6.68
59.28
Europe Italy Quality Sensitivity and mildnessBrand glamor
35.09 15.52 6.60
57.21

International Market Segmentation Study
138
Europe Netherlands
Quality Brand glamor Sensitivity and mildnessPleasant fragrance
30.65 14.84 8.50 7.26
61.25
Europe Spain
Quality and mildness Brand glamor Suitability for sensitive skin
37.09 15.53 5.96
58.58
Europe Switzerland Quality Brand glamor Sensitivity and mildness
32.38 15.70 8.43
56.50
Europe (East) Russia Quality Sensitivity and mildnessBrand glamor
32.77 12.08 7.37
52.22
Europe (Nordics) Denmark
Sensitivity and mildnessBrand glamor and progressiveness Quality
33.46
15.77 8.04
57.27
Europe (Nordics) Norway
Quality Sensitivity and mildnessBrand glamor
38.93 13.21 7.75
59.89
South America Argentina
Mildness and effectiveness Brand glamor Quality and value
28.61 12.73 8.07
49.40
South America Paraguay
Quality Product excellence Brand popularity Sensitivity and mildness
28.14 11.77 7.84 7.79
55.55
South America Venezuela Quality and mildness Product excellence Brand glamor
35.64 11.85 7.11
54.60
Table 4-7 Final factor solutions
4.6.1.2 Finding Cluster Solutions
4.6.1.2.1 Segmentation Approach Based on Ward’s Method
Cluster analysis based on the Ward’s method was used as the first approach to
separating respondents into groups. All necessary calculations were done by means
of the Cluster procedure of the SPSS software.

International Market Segmentation Study
139
The SPSS software has transformed factor values for all respondents into squared
Euclidean distances between them. The Ward’s method was applied then to the
obtained distance matrix.
The first hint about the number of clusters, at which combining of respondents had
to be stopped, was obtained through examining increases in values of the error sum
of squares at the last ten448 fusion steps (see Appendix A-2) and finding a
relatively significant increase among them (see Table 4-8).449 The final decision
about the number of clusters in a cluster solution was made afterwards in
accordance with meaningfulness of cluster interpretation.
Region Country Step with a relatively significant increase in the error sum of squares
Africa South Africa # 797 (5 clusters are being combined to 4) # 798 (4 clusters are being combined to 3)
Asia China # 795 (6 clusters are being combined to 5) # 797 (4 clusters are being combined to 3)
Asia Hong Kong # 499 (6 clusters are being combined to 5) # 500 (5 clusters are being combined to 4)
Asia Indonesia # 822 (5 clusters are being combined to 4) # 823 (4 clusters are being combined to 3)
Asia Korea # 496 (5 clusters are being combined to 4) # 497 (4 clusters are being combined to 3)
Asia Philippines # 497 (4 clusters are being combined to 3)
Asia Taiwan # 500 (5 clusters are being combined to 4) # 501 (4 clusters are being combined to 3)
Asia Thailand # 996 (5 clusters are being combined to 4) # 997 (4 clusters are being combined to 3)
Australia Australia # 577 (5 clusters are being combined to 4) # 578 (4 clusters are being combined to 3)
Europe Belgium # 367 (6 clusters are being combined to 5) # 369 (4 clusters are being combined to 3)
Europe Germany # 1042 (6 clusters are being combined to 5) # 1044 (4 clusters are being combined to 3)
Europe Italy # 518 (4 clusters are being combined to 3)
448 This number corresponds to the first rough assumption about the possible maximum number of clusters in a cluster solution, which was equal to ten. 449 Two- and three-cluster solutions were not taken into consideration here as too aggregated.

International Market Segmentation Study
140
Europe Netherlands # 486 (6 clusters are being combined to 5) # 487 (5 clusters are being combined to 4) # 488 (4 clusters are being combined to 3)
Europe Spain # 751 (5 clusters are being combined to 4)
Europe Switzerland # 502 (5 clusters are being combined to 4) # 503 (4 clusters are being combined to 3)
Europe (East) Russia # 1195 (6 clusters are being combined to 5) # 1196 (5 clusters are being combined to 4) # 1197 (4 clusters are being combined to 3)
Europe (Nordics) Denmark # 395 (6 clusters are being combined to 5) # 397 (4 clusters are being combined to 3)
Europe (Nordics) Norway # 361 (6 clusters are being combined to 5) # 362 (5 clusters are being combined to 4)
South America Argentina # 512 (5 clusters are being combined to 4) # 513 (4 clusters are being combined to 3)
South America Paraguay # 398 (5 clusters are being combined to 4)
South America Venezuela # 795 (6 clusters are being combined to 5) # 797 (4 clusters are being combined to 3)
Table 4-8 Clustering steps with a relatively significant increase in the error sum of squares
4.6.1.2.2 Segmentation Approach Based on K-means Method
Cluster analysis based on the K-means method was used as the second approach to
separating respondents into groups. In this case, all necessary calculations were
done by means of the Quick Cluster procedure of the SPSS software.
The K-means method was applied to the factor values directly. It was decided to
run the optimization-partitioning algorithm for up to ten450 clusters in a cluster
solution. Values of the within-groups sum of squares were then plotted against
corresponding quantities of clusters (see Appendix A-3). Relatively sharp
decreases in these values served as an approximate indication of a correct number
of clusters in a cluster solution (see Table 4-9).451 These cluster quantities were
then reviewed while assessing meaningfulness of cluster interpretation.
450 Again, this number corresponds to the first rough assumption about the possible maximum number of clusters in a cluster solution, which was equal to ten. 451 Two- and three-cluster solutions were not taken into consideration here as too aggregated.

International Market Segmentation Study
141
Region Country Relatively sharp decrease in the within-groups sum of squares is found
Africa South Africa at 4 clusters at 6 clusters
Asia China at 5 clusters at 6 clusters
Asia Hong Kong at 4 clusters
Asia Indonesia at 4 clusters at 6 clusters
Asia Korea at 4 clusters Asia Philippines at 4 clusters Asia Taiwan at 5 clusters
Asia Thailand at 4 clusters at 5 clusters
Australia Australia at 4 clusters at 5 clusters
Europe Belgium at 5 clusters
Europe Germany at 4 clusters at 5 clusters
Europe Italy at 4 clusters
Europe Netherlands at 4 clusters at 5 clusters at 6 clusters
Europe Spain at 4 clusters
Europe Switzerland at 4 clusters at 5 clusters
Europe (East) Russia at 4 clusters at 6 clusters at 7 clusters
Europe (Nordics) Denmark at 4 clusters at 6 clusters
Europe (Nordics) Norway at 4 clusters at 5 clusters at 6 clusters
South America Argentina at 4 clusters at 6 clusters
South America Paraguay at 4 clusters at 8 clusters
South America Venezuela at 4 clusters
Table 4-9 Quantities of clusters, at which a sharp decrease in the within-groups sum of squares was found

International Market Segmentation Study
142
4.6.1.2.3 Segmentation Approach Based on Self-Organizing Map
Segmentation analysis based on the Self-Organizing Map was used as the third
approach to separating respondents into groups. The necessary operations for
creation, visualization and assessment of topology-preserving maps were done by
means of the NENET software452 developed in 1997 at the Helsinki University of
Technology as a user-friendly program illustrating the use of SOM.453
Not factor values, but the fourteen basis variables (requirements towards a
product/brand) were used here as a data input. This can be explained by the fact
that, as it was already mentioned in part 3.5.2.2 of the present thesis, PCA
transforms data in a linear way, whereas SOM – in a nonlinear one, and thus the
low-dimensional data space created by SOM approximates the original data space
more precisely. Therefore, conducting PCA before SOM should be avoided.
First of all, the NENET software has initialized maps consisting of Kohonen-
neurons with randomly assigned weight vectors. To guarantee effectiveness of
visual presentation, it was decided to use a hexagonal type of a neuron
arrangement. The choice of a map size in the case of each country was made after
experimenting with about thirty maps having different sizes and proportions. It was
based on:
- evaluation of the map goodness using the average quantization error,
topographic error, and percentage of used Kohonen-neurons criteria;
- visual inspection of obtained cluster regions and examining their size, form,
and clearness of their borderlines;454
- assessment of meaningfulness of cluster interpretation.
Then, the initialized maps were trained by the NENET software. In other words,
randomly initialized weights were adapted to input vectors presenting the fourteen
product/brand requirements of respondents according to the SOM learning process
described in part 3.5.2.2.2 of the present thesis. It was decided to use a
neighborhood function of a Gaussian form. The length of the POW phase was
calculated according to the next equation:
452 According to http://koti.mbnet.fi/~phodju/nenet/Nenet/General.html, NENET stands for “Neural Networks Tool”. 453 See Kohonen, 2001, p. 318 and http://koti.mbnet.fi/~phodju/nenet/Nenet/General.html. 454 The analysis was based on the U-matrix, hit histogram of input vectors, and component planes.

International Market Segmentation Study
143
5LLL yxpow ⋅⋅= , (4-1)
where
xL , yL are lengths of map sides (measured in neurons)
The FTW phase was hundred times longer than the POW phase.455
At the beginning of the adaptation process the width parameter )σ(t z was set to
the value equal to approximately 70% of the longer map side, and the learning-rate
factor )α(t z – to the value equal to 0.9. Both parameters were presented by the
NENET software in the form of linear monotonically decreasing functions of time.
After the POW phase, the width parameter )σ(t z was reduced to the value equal to
3, and learning-rate factor )α(t z – to the value equal to 0.02.456
The size of the eventually chosen map in the case of each country together with a
corresponding number of iteration steps in the POW and FTW phases and
corresponding starting value of the width parameter )σ(t z in the POW phase are
presented in Table 4-10.
The definition of cluster regions was done in the next stepwise way:
- small and very clear cluster regions were identified first;
- thereafter, the similarity of neighboring cluster regions was assessed using
the U-matrix, hit histogram of input vectors, and component planes as well
as cluster profiles consisting of cluster centroids for each variable presented
in the form of a table;
- then, the most similar neighboring cluster regions were combined to bigger
cluster regions and so on.
455 The choice of the length of both phases was made on the base of recommendations presented in part 3.5.2.2.2 of this thesis. 456 The choice of the parameter values was made on the base of recommendations presented in part 3.5.2.2.2 of this thesis.

International Market Segmentation Study
144
Number of iteration steps
Width parameter
)σ(t z Region Country
Len
gth
of m
ap
side
X (n
euro
ns)
Len
gth
of m
ap
side
Y (n
euro
ns)
POW FTW POW
Africa South Africa 30 17 2550 255000 21 Asia China 35 17 2975 297500 25 Asia Hong Kong 30 17 2550 255000 21 Asia Indonesia 30 12 1800 180000 21 Asia Korea 30 12 1800 180000 21 Asia Philippines 35 12 2100 210000 25 Asia Taiwan 30 10 1500 150000 21 Asia Thailand 25 10 1250 125000 18 Australia Australia 25 12 1500 150000 18 Europe Belgium 35 16 2800 280000 25 Europe Germany 35 14 2450 245000 25 Europe Italy 30 13 1950 195000 21 Europe Netherlands 30 15 2250 225000 21 Europe Spain 35 15 2625 262500 25 Europe Switzerland 30 15 2250 225000 21 Europe (East) Russia 30 11 1650 165000 21 Europe (Nordics) Denmark 25 12 1500 150000 18 Europe (Nordics) Norway 30 10 1500 150000 21 South America Argentina 40 18 3600 360000 28 South America Paraguay 40 17 3400 340000 28 South America Venezuela 40 12 2600 260000 28
Table 4-10 SOM parameters
It should be mentioned that some neurons (correspondingly, respondents) could
not be assigned to the final cluster regions (see, for instance, Figure 4-5). They
were normally positioned in the so-called “transitional” areas between clusters. It
was rather difficult to make a clear decision about cluster membership of
respondents assigned to “transitional” neurons on the base of visual inspection of a
map and examination of respondents’ and cluster profiles. Therefore, it was
decided to quantify similarities between profiles of respondents and clusters

International Market Segmentation Study
145
through Euclidean distances and assign each of the respondents to a cluster with
the corresponding smallest Euclidean distance.
Figure 4-5 Cluster regions (example of the U-matrix)
4.6.1.3 Validation of Cluster Solutions
For more precise validation, description and interpretation of cluster solutions, it
was decided to consider the fourteen basis variables (requirements towards a
product/brand) instead of the factors in all obtained solutions.
In order to examine stability of cluster solutions, the outcomes of the three
approaches to separating respondents into groups presented above were compared
in the case of each country. After visual inspection and confrontation of cluster
profiles consisting of cluster centroids for each variable presented in the form of a
table457, it was concluded that obtained solutions were very alike.
To assess homogeneity within the clusters and heterogeneity between them, the
respective F-values and t-values were calculated for the fourteen basis variables.
As far as majority of F-values were below one, and there were completely
homogeneous or highly homogeneous clusters in each solution (see Table 4-11), it
457 In order to keep a good overview of the variables, they were grouped inside the cluster profiles according to the factors they belonged to.
where initial cluster regions are outlined with yellow combinations of several initial cluster regions (i.e., cluster regions of the second level) are outlined with light-blue combinations of cluster regions of the second level and initial cluster regions (i.e., cluster regions of the third level) are outlined with red
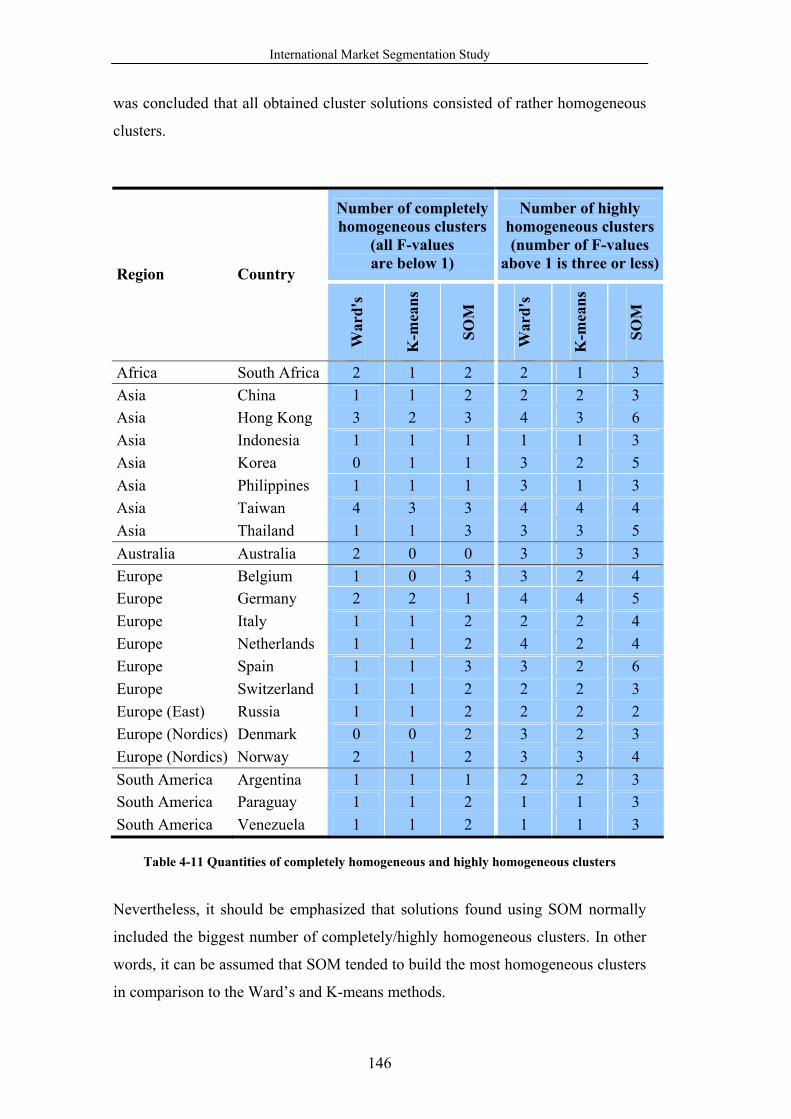
International Market Segmentation Study
146
was concluded that all obtained cluster solutions consisted of rather homogeneous
clusters.
Number of completely homogeneous clusters
(all F-values are below 1)
Number of highly homogeneous clusters (number of F-values
above 1 is three or less)Region Country
War
d's
K-m
eans
SOM
War
d's
K-m
eans
SOM
Africa South Africa 2 1 2 2 1 3 Asia China 1 1 2 2 2 3 Asia Hong Kong 3 2 3 4 3 6 Asia Indonesia 1 1 1 1 1 3 Asia Korea 0 1 1 3 2 5 Asia Philippines 1 1 1 3 1 3 Asia Taiwan 4 3 3 4 4 4 Asia Thailand 1 1 3 3 3 5 Australia Australia 2 0 0 3 3 3 Europe Belgium 1 0 3 3 2 4 Europe Germany 2 2 1 4 4 5 Europe Italy 1 1 2 2 2 4 Europe Netherlands 1 1 2 4 2 4 Europe Spain 1 1 3 3 2 6 Europe Switzerland 1 1 2 2 2 3 Europe (East) Russia 1 1 2 2 2 2 Europe (Nordics) Denmark 0 0 2 3 2 3 Europe (Nordics) Norway 2 1 2 3 3 4 South America Argentina 1 1 1 2 2 3 South America Paraguay 1 1 2 1 1 3 South America Venezuela 1 1 2 1 1 3
Table 4-11 Quantities of completely homogeneous and highly homogeneous clusters
Nevertheless, it should be emphasized that solutions found using SOM normally
included the biggest number of completely/highly homogeneous clusters. In other
words, it can be assumed that SOM tended to build the most homogeneous clusters
in comparison to the Ward’s and K-means methods.

International Market Segmentation Study
147
While considering t-values, one could definitely notice existence of significant
differences between clusters in all solutions. Furthermore, the results of
discriminant analyses have demonstrated that in each case
- there were very high canonical correlation coefficients;458
- significance levels of 2χ values calculated from values of the Wilks’s
lambda for residual discrimination were low;
- percentages of correctly classified respondents in majority of the countries
were close to 90% (see Table 4-12)459.
% of correctly classified respondents Region Country
Ward's K-means SOM Africa South Africa 90.0 92.4 86.6 Asia China 84.9 93.4 83.6 Asia Hong Kong 89.5 93.7 87.3 Asia Indonesia 86.2 93.3 84.5 Asia Korea 87.8 94.4 88.2 Asia Philippines 92.6 90.8 90.0 Asia Taiwan 89.1 93.1 90.5 Asia Thailand 87.4 91.9 88.4 Australia Australia 90.0 91.7 88.6 Europe Belgium 90.1 90.9 90.1 Europe Germany 86.9 93.3 89.1 Europe Italy 89.6 92.7 87.1 Europe Netherlands 87.2 93.9 88.6 Europe Spain 86.5 91.8 91.5 Europe Switzerland 91.9 91.9 85.0 Europe (East) Russia 89.9 88.9 86.9 Europe (Nordics) Denmark 87.5 91.5 87.8 Europe (Nordics) Norway 90.4 94.0 89.3 South America Argentina 91.7 91.7 85.9 South America Paraguay 89.3 90.5 89.3 South America Venezuela 90.8 91.0 89.9
Table 4-12 Percentages of respondents classified by discriminant analysis correctly
458 The definition of correlation coefficients > 0.7 as very high ones presented in Backhaus/ Erichson/Plinke/Weiber, 2003, p. 273 was considered here. 459 In the case of solutions found by the K-means method, some percentages of correctly classified respondents were even close to 95%.

International Market Segmentation Study
148
These observations have proved that all cluster solutions consisted of clusters
differing from each other significantly and constituted reliable partitions of
respondents.
4.6.1.4 Description and Interpretation of Cluster Solutions
To describe and interpret the clusters, cluster profiles consisting of average values
of the fourteen basis variables (requirements towards a product/brand) were
considered first. In particular, they were examined and compared to corresponding
total sample profiles. Thereby, it was distinguished between the next five deviation
levels:
- deviations lying in the interval [10%; +∞): high positive deviations of
cluster centroids from corresponding total sample centroids;
- deviations lying in the interval (5%; 10%): middle-high positive
deviations of cluster centroids from corresponding total sample centroids;
- deviations lying in the interval [-5%; 5%]: (almost) equal cluster
centroids and corresponding total sample centroids;
- deviations lying in the interval (-5%; -10%): middle-high negative
deviations of cluster centroids from corresponding total sample centroids;
- deviations lying in the interval [-10%; -∞): high negative deviations of
cluster centroids from corresponding total sample centroids.
Positive (negative) deviations of cluster centroids from total sample centroids were
interpreted as indicators of basis variables (requirements towards a product/brand),
which were important (unimportant) for members of a corresponding cluster.
Moreover, it was assumed that, in the clusters with overall low level of importance
of basis variables, deviations of cluster centroids from total sample centroids lying
in the intervals [-5%; 5%] and (-5%; -10%) pointed at relatively important basis
variables (requirements towards a product/brand).
Such description and interpretation procedure has helped to name the clusters (see
Appendix A-4). Moreover, it has also contributed to making the final decision with
regard to the number of clusters in a cluster solution in the case of segmentation
approaches based on the Ward’s and K-means methods and has been constantly
facilitating conduction of segmentation analyses in the case of SOM.
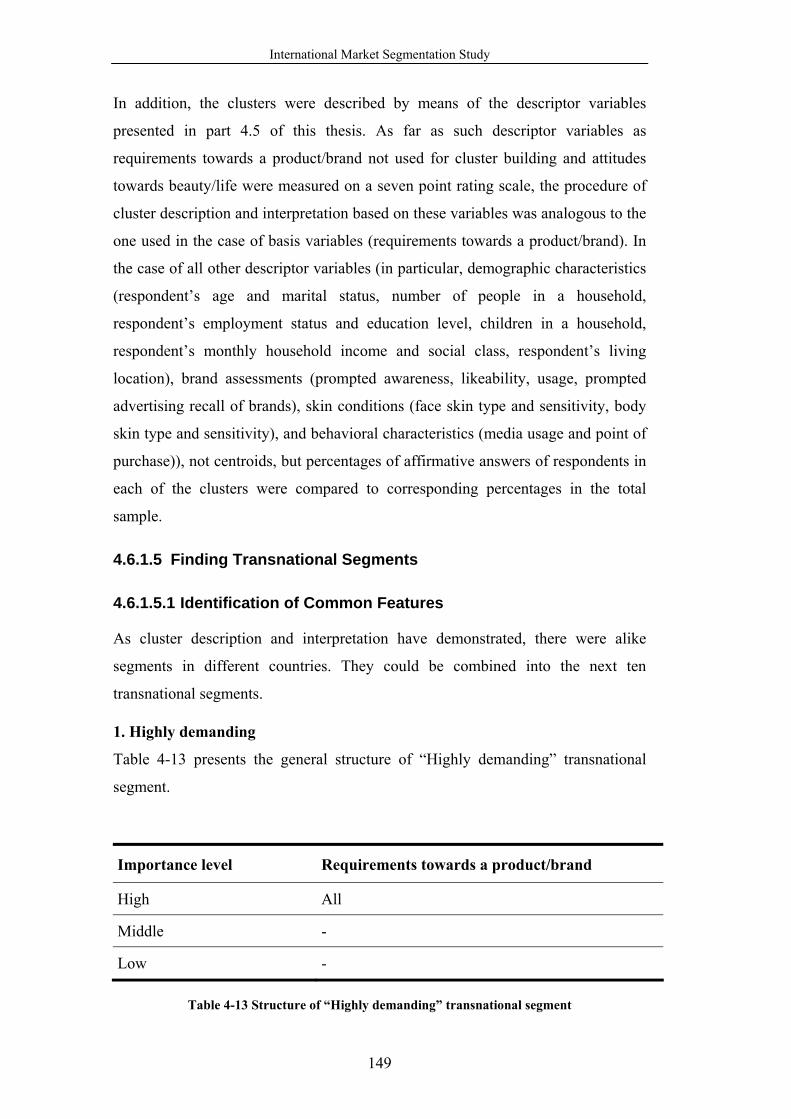
International Market Segmentation Study
149
In addition, the clusters were described by means of the descriptor variables
presented in part 4.5 of this thesis. As far as such descriptor variables as
requirements towards a product/brand not used for cluster building and attitudes
towards beauty/life were measured on a seven point rating scale, the procedure of
cluster description and interpretation based on these variables was analogous to the
one used in the case of basis variables (requirements towards a product/brand). In
the case of all other descriptor variables (in particular, demographic characteristics
(respondent’s age and marital status, number of people in a household,
respondent’s employment status and education level, children in a household,
respondent’s monthly household income and social class, respondent’s living
location), brand assessments (prompted awareness, likeability, usage, prompted
advertising recall of brands), skin conditions (face skin type and sensitivity, body
skin type and sensitivity), and behavioral characteristics (media usage and point of
purchase)), not centroids, but percentages of affirmative answers of respondents in
each of the clusters were compared to corresponding percentages in the total
sample.
4.6.1.5 Finding Transnational Segments
4.6.1.5.1 Identification of Common Features
As cluster description and interpretation have demonstrated, there were alike
segments in different countries. They could be combined into the next ten
transnational segments.
1. Highly demanding
Table 4-13 presents the general structure of “Highly demanding” transnational
segment.
Importance level Requirements towards a product/brand
High All
Middle -
Low -
Table 4-13 Structure of “Highly demanding” transnational segment

International Market Segmentation Study
150
The segment can be described verbally as follows:
• All requirements of these women are high.
• They select modern and highly advertised brands offering attractive
products with which they can indulge themselves. At the same time,
quality, mildness, and skin caring effects as well as usage convenience and
accessibility of the products have to be on the highest level. They believe
that premium brands are more likely to provide them with all these benefits
than retail or no-name brands.
• A personal attitude to a brand influences buying behavior of these women a
lot: they have to like and trust a brand; they want a brand to fit their image
and emphasize their personality.
• These women always try to look nice and stylish. They follow fashion and
spend lots of time and money on taking care of their appearance.
• They want to be successful in all their undertakings.
• These women normally belong to rich families. They often prefer to stay at
home rather than to work. If they work, they occupy only high positions.
• List of countries, where country-specific segments included into this
transnational segment were found in the case of the three segmentation
approaches, is shown in Table 4-14.

International Market Segmentation Study
151
Segmentation approach based on Country
Ward’s method K-means method SOM
South Africa x x x
China x x x
Hong Kong x x x
Indonesia x x
Korea x x
Philippines x x x
Taiwan x x x
Thailand x x
Australia x x x
Belgium x x x
Germany x x x
Italy x x
Netherlands x x x
Spain x x x
Switzerland x x x
Russia x x x
Denmark x x
Norway x x x
Argentina x x x
Paraguay x x x
Venezuela x x x
Table 4-14 “Highly demanding” segments found

International Market Segmentation Study
152
2. Rational demanding
Table 4-15 presents the general structure of “Rational demanding” transnational
segment.460
Importance level Requirements towards a product/brand
High
Products offer good value for money Products are of high quality It is a trustworthy brand Products fulfill current expectations towards skin care Products perform better than those of other brands Products contain highly effective ingredients This brand offers mild skin care products Products are suitable for sensitive skin Products rely on the latest scientific findings Products are highly appropriate for skin This brand is for demanding women who give importance to their appearance
Middle This brand is highly advertised It is a modern brand Products have a pleasant fragrance
Low -
Table 4-15 Structure of “Rational demanding” transnational segment
The segment can be described verbally as follows:
• Rational demanding can be viewed as a special case of highly demanding
respondents.
• Here one talks about much more rational women. Such factors as
advertising and brand modernity influence them to a significantly lower
degree. In the first place, they tend to be interested in functional benefits of
products, and, only afterwards, in what a commercial says or what is in
trend. 460 It should be mentioned that due to the fact that, in the case of segmentation approaches based on the Ward’s and K-means methods, this segment was found only in one country, it can be viewed as transnational segment only in the case of the segmentation approach based on SOM.

International Market Segmentation Study
153
• These women tend to be highly educated, to occupy high positions, and to
have high incomes. They always want to be ahead of others, to be the best.
• List of countries, where country-specific segments included into this
transnational segment were found in the case of the three segmentation
approaches, is shown in Table 4-16.
Segmentation approach based on Country
Ward’s method K-means method SOM
China x
Hong Kong x
Indonesia x
Korea x
Taiwan x x
Thailand x
Belgium x
Germany x x
Italy x
Netherlands x
Spain x
Switzerland x
Norway x
Paraguay x
Venezuela x
Table 4-16 “Rational demanding” segments found
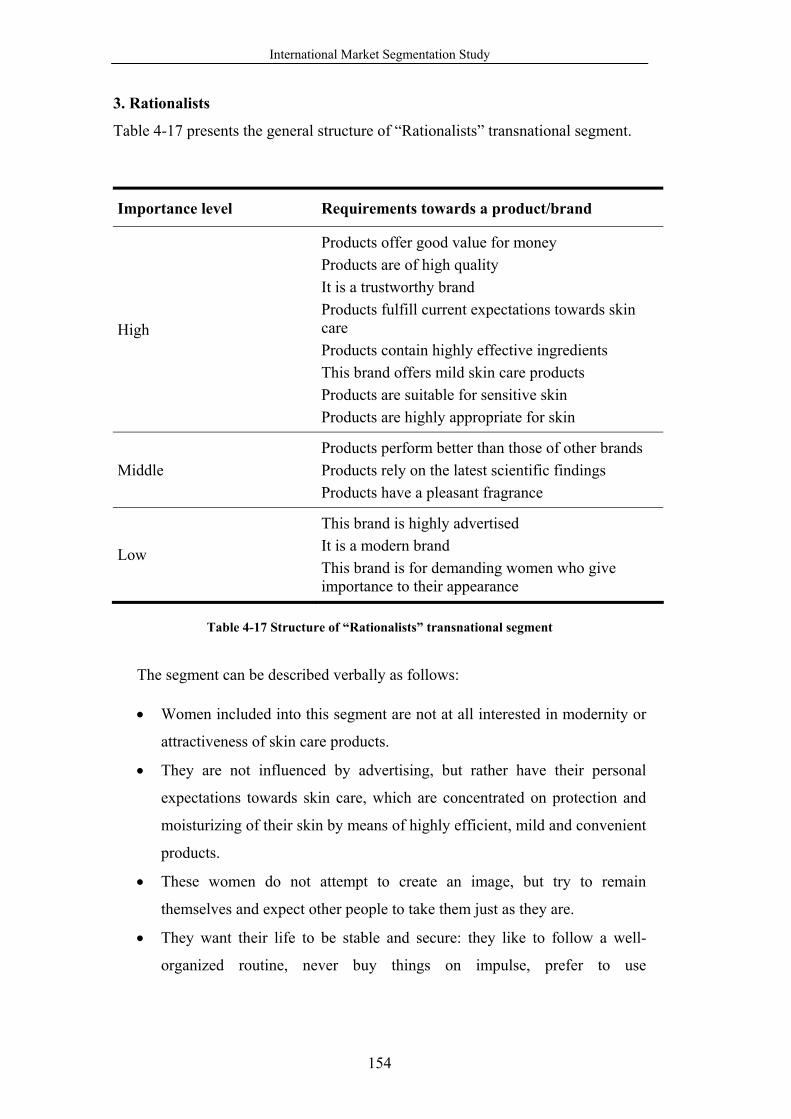
International Market Segmentation Study
154
3. Rationalists
Table 4-17 presents the general structure of “Rationalists” transnational segment.
Importance level Requirements towards a product/brand
High
Products offer good value for money Products are of high quality It is a trustworthy brand Products fulfill current expectations towards skin care Products contain highly effective ingredients This brand offers mild skin care products Products are suitable for sensitive skin Products are highly appropriate for skin
Middle Products perform better than those of other brands Products rely on the latest scientific findings Products have a pleasant fragrance
Low
This brand is highly advertised It is a modern brand This brand is for demanding women who give importance to their appearance
Table 4-17 Structure of “Rationalists” transnational segment
The segment can be described verbally as follows:
• Women included into this segment are not at all interested in modernity or
attractiveness of skin care products.
• They are not influenced by advertising, but rather have their personal
expectations towards skin care, which are concentrated on protection and
moisturizing of their skin by means of highly efficient, mild and convenient
products.
• These women do not attempt to create an image, but try to remain
themselves and expect other people to take them just as they are.
• They want their life to be stable and secure: they like to follow a well-
organized routine, never buy things on impulse, prefer to use
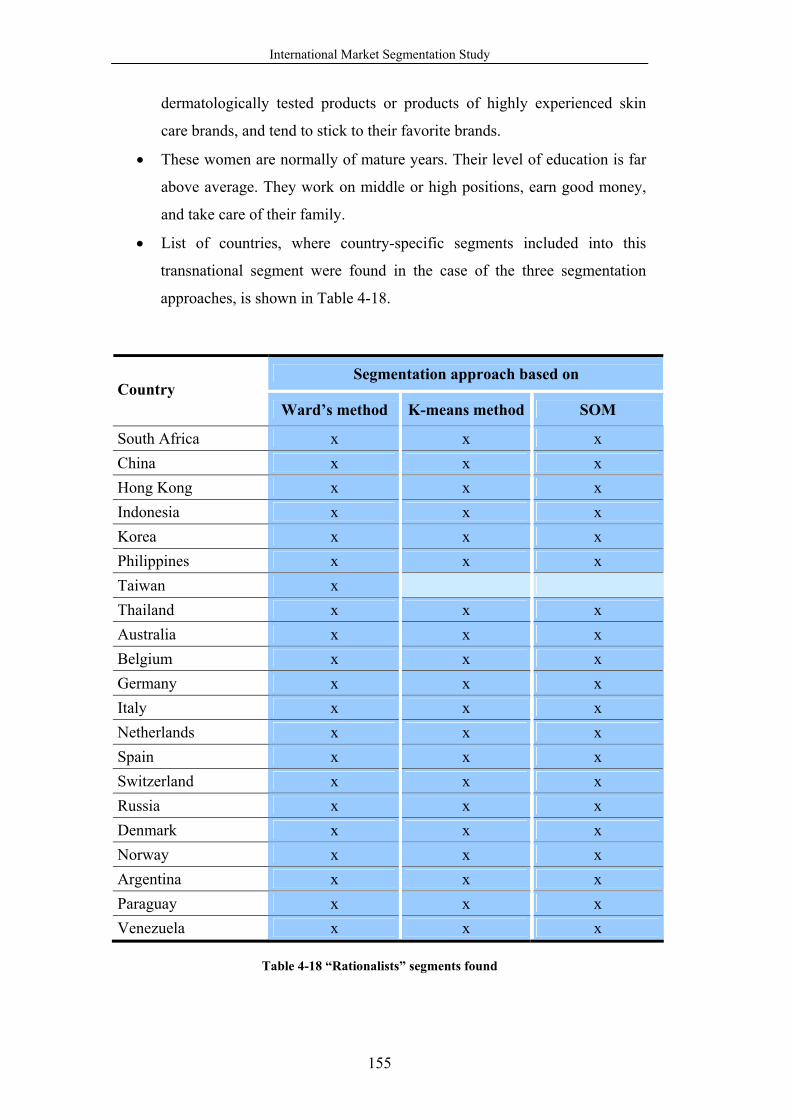
International Market Segmentation Study
155
dermatologically tested products or products of highly experienced skin
care brands, and tend to stick to their favorite brands.
• These women are normally of mature years. Their level of education is far
above average. They work on middle or high positions, earn good money,
and take care of their family.
• List of countries, where country-specific segments included into this
transnational segment were found in the case of the three segmentation
approaches, is shown in Table 4-18.
Segmentation approach based on Country
Ward’s method K-means method SOM
South Africa x x x China x x x Hong Kong x x x Indonesia x x x Korea x x x Philippines x x x Taiwan x Thailand x x x Australia x x x Belgium x x x Germany x x x Italy x x x Netherlands x x x Spain x x x Switzerland x x x Russia x x x Denmark x x x Norway x x x Argentina x x x Paraguay x x x Venezuela x x x
Table 4-18 “Rationalists” segments found
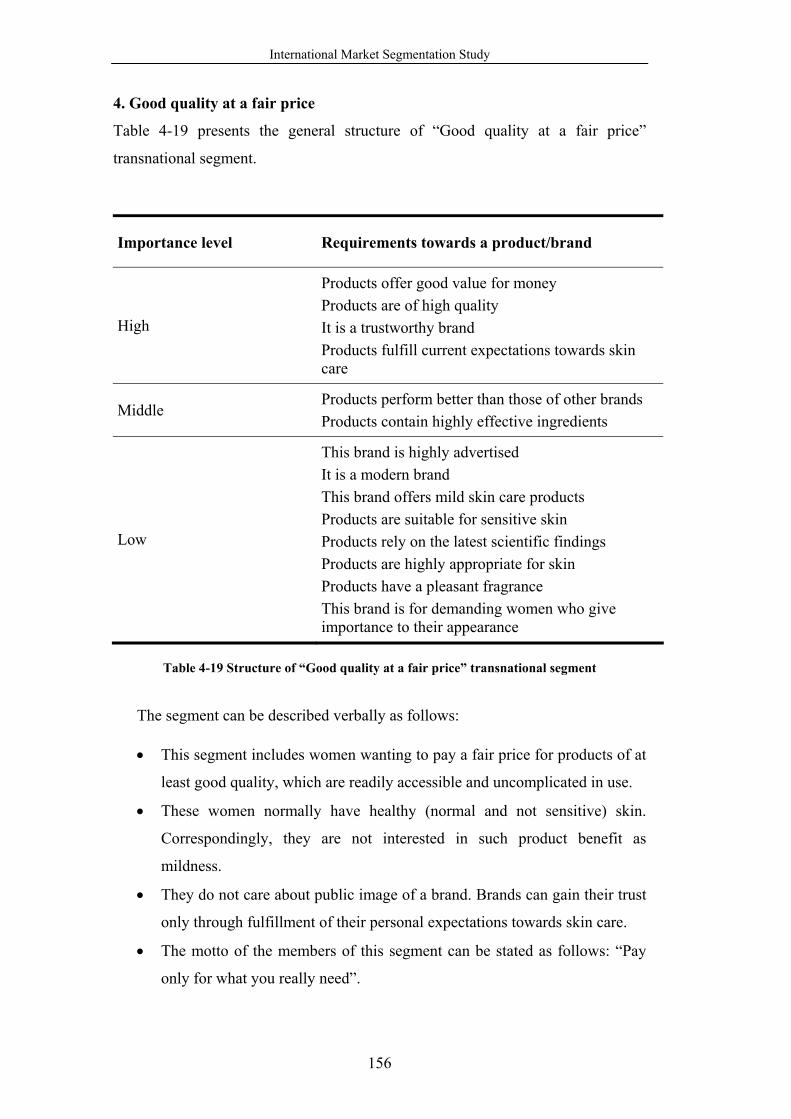
International Market Segmentation Study
156
4. Good quality at a fair price
Table 4-19 presents the general structure of “Good quality at a fair price”
transnational segment.
Importance level Requirements towards a product/brand
High
Products offer good value for money Products are of high quality It is a trustworthy brand Products fulfill current expectations towards skin care
Middle Products perform better than those of other brands Products contain highly effective ingredients
Low
This brand is highly advertised It is a modern brand This brand offers mild skin care products Products are suitable for sensitive skin Products rely on the latest scientific findings Products are highly appropriate for skin Products have a pleasant fragrance This brand is for demanding women who give importance to their appearance
Table 4-19 Structure of “Good quality at a fair price” transnational segment
The segment can be described verbally as follows:
• This segment includes women wanting to pay a fair price for products of at
least good quality, which are readily accessible and uncomplicated in use.
• These women normally have healthy (normal and not sensitive) skin.
Correspondingly, they are not interested in such product benefit as
mildness.
• They do not care about public image of a brand. Brands can gain their trust
only through fulfillment of their personal expectations towards skin care.
• The motto of the members of this segment can be stated as follows: “Pay
only for what you really need”.
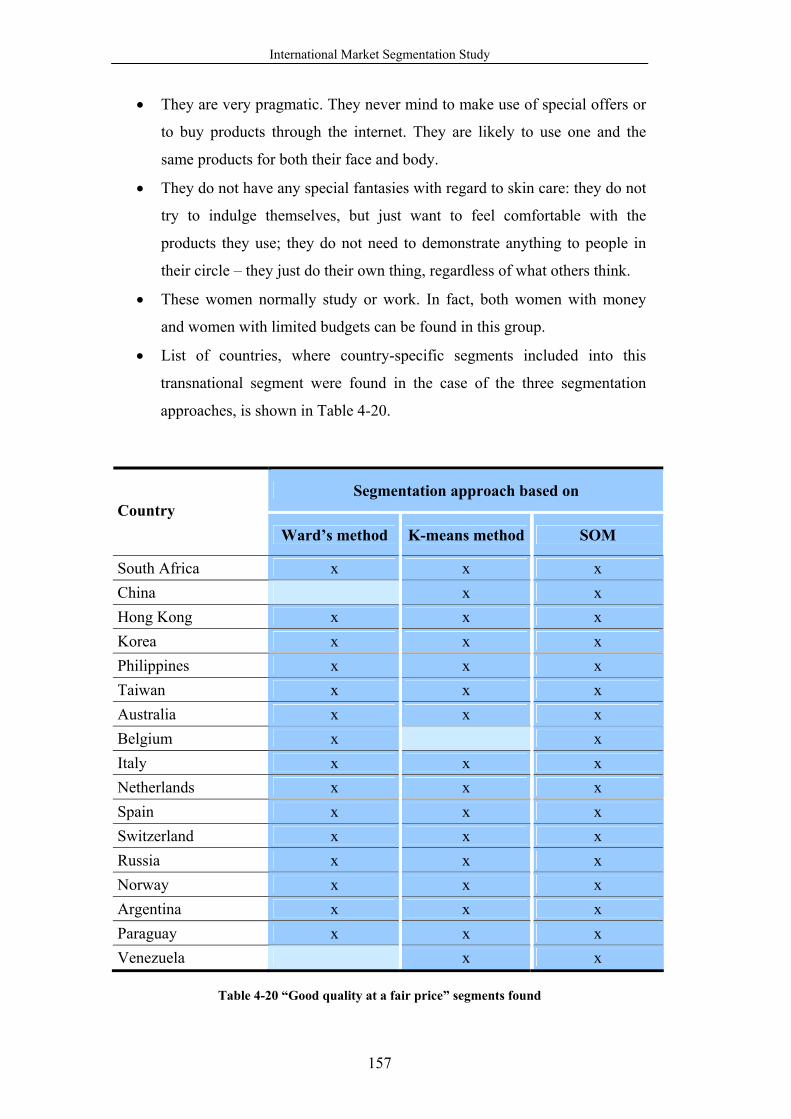
International Market Segmentation Study
157
• They are very pragmatic. They never mind to make use of special offers or
to buy products through the internet. They are likely to use one and the
same products for both their face and body.
• They do not have any special fantasies with regard to skin care: they do not
try to indulge themselves, but just want to feel comfortable with the
products they use; they do not need to demonstrate anything to people in
their circle – they just do their own thing, regardless of what others think.
• These women normally study or work. In fact, both women with money
and women with limited budgets can be found in this group.
• List of countries, where country-specific segments included into this
transnational segment were found in the case of the three segmentation
approaches, is shown in Table 4-20.
Segmentation approach based on Country
Ward’s method K-means method SOM
South Africa x x x China x x Hong Kong x x x Korea x x x Philippines x x x Taiwan x x x Australia x x x Belgium x x Italy x x x Netherlands x x x Spain x x x Switzerland x x x Russia x x x Norway x x x Argentina x x x Paraguay x x x Venezuela x x
Table 4-20 “Good quality at a fair price” segments found

International Market Segmentation Study
158
5. Quality and good value for money from a strong brand
Table 4-21 presents the general structure of “Quality and good value for money
from a strong brand” transnational segment.
Importance level Requirements towards a product/brand
High
Products offer good value for money Products are of high quality It is a trustworthy brand Products fulfill current expectations towards skin care
Middle
Products perform better than those of other brands Products contain highly effective ingredients This brand is highly advertised It is a modern brand This brand is for demanding women who give importance to their appearance
Low
This brand offers mild skin care products Products are suitable for sensitive skin Products rely on the latest scientific findings Products are highly appropriate for skin Products have a pleasant fragrance
Table 4-21 Structure of “Quality and good value for money from a strong brand”
transnational segment
The segment can be described verbally as follows:
• The only difference between this segment and the previous one is that these
women consider positive public image of a brand as quite important.
Buying products of well-known, leading brands assures them that the
products are of good quality.
• Obviously, one talks here about different approach to building trust in a
brand. These women prefer to rely on the feedback of others, rather than to
form their opinion through trial and error.
• List of countries, where country-specific segments included into this
transnational segment were found in the case of the three segmentation
approaches, is shown in Table 4-22.
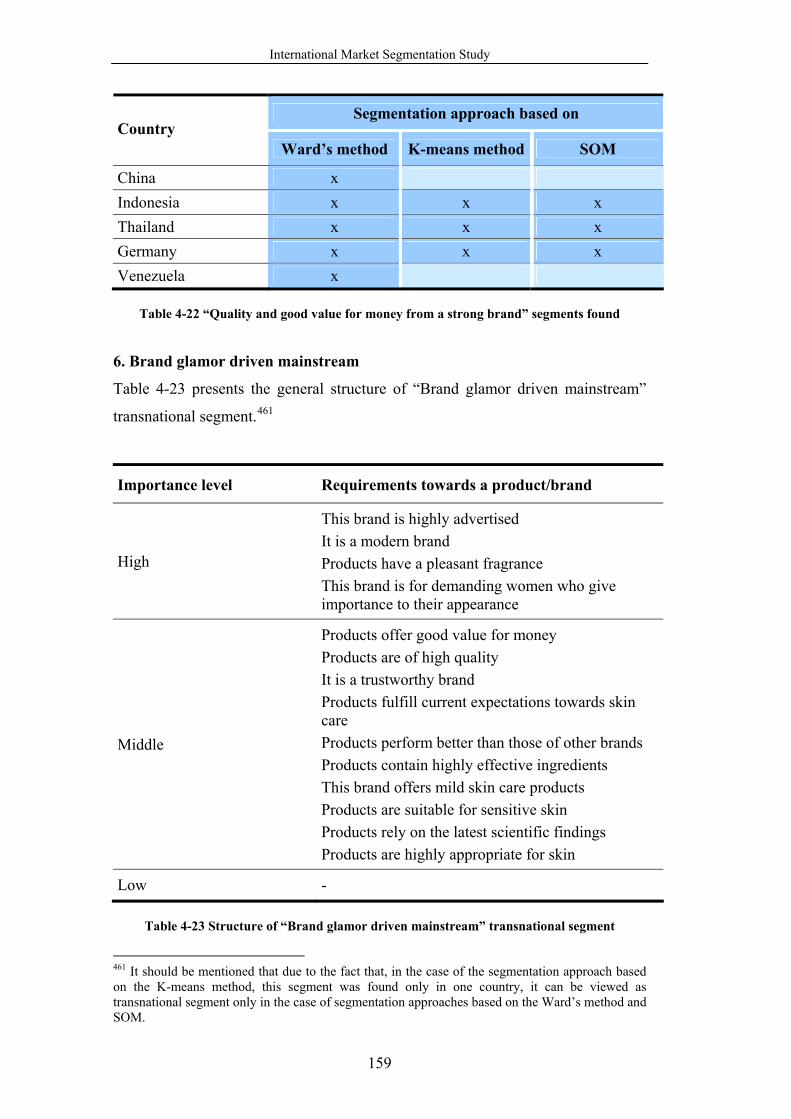
International Market Segmentation Study
159
Segmentation approach based on Country
Ward’s method K-means method SOM
China x Indonesia x x x Thailand x x x Germany x x x Venezuela x
Table 4-22 “Quality and good value for money from a strong brand” segments found
6. Brand glamor driven mainstream
Table 4-23 presents the general structure of “Brand glamor driven mainstream”
transnational segment.461
Importance level Requirements towards a product/brand
High
This brand is highly advertised It is a modern brand Products have a pleasant fragrance This brand is for demanding women who give importance to their appearance
Middle
Products offer good value for money Products are of high quality It is a trustworthy brand Products fulfill current expectations towards skin care Products perform better than those of other brands Products contain highly effective ingredients This brand offers mild skin care products Products are suitable for sensitive skin Products rely on the latest scientific findings Products are highly appropriate for skin
Low -
Table 4-23 Structure of “Brand glamor driven mainstream” transnational segment
461 It should be mentioned that due to the fact that, in the case of the segmentation approach based on the K-means method, this segment was found only in one country, it can be viewed as transnational segment only in the case of segmentation approaches based on the Ward’s method and SOM.

International Market Segmentation Study
160
The segment can be described verbally as follows:
• These women use skin care products to make their life more exciting and
colorful. An attractive packaging, rare design, label of an exclusive and
fashionable brand – that is what they need.
• They are easily influenced by all kinds of advertising. Trying a sample
often encourages them to buy a product. They are addicted to buying
products for their beauty and often spend more money on them than they
plan.
• Of course, they expect products to be of at least good quality, but, in the
first place, they just want to indulge themselves and do not think too
rationally.
• As far as they normally have no skin problems, they do not have any
special requirements with regard to mildness of products.
• These women are always seeking for beauty and pleasure in their life. Not
only their personal appearance, but the whole world around them has to be
admirable.
• They do care about opinion of others. They want the products they use to
underline their lovely personality. They often need an advice or approval of
people from their circle.
• These women normally belong to a middle social class. The level of their
education is not very high.
• List of countries, where country-specific segments included into this
transnational segment were found in the case of the three segmentation
approaches, is shown in Table 4-24.
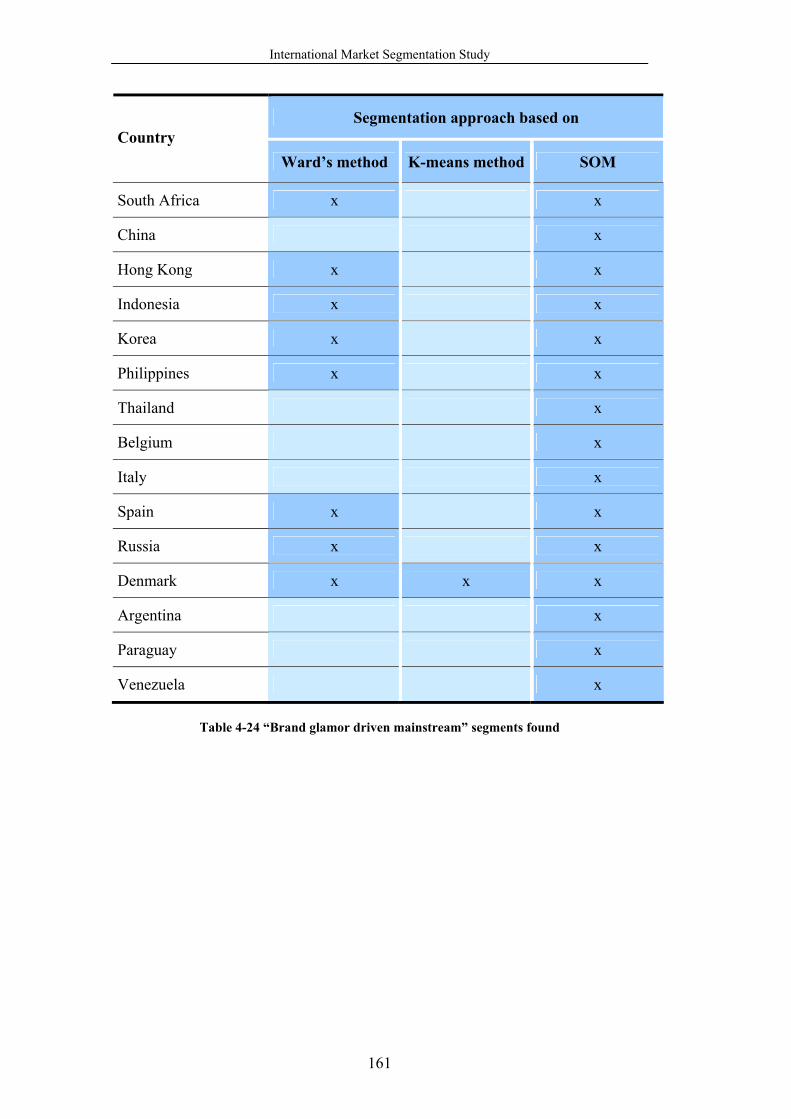
International Market Segmentation Study
161
Segmentation approach based on Country
Ward’s method K-means method SOM
South Africa x x
China x
Hong Kong x x
Indonesia x x
Korea x x
Philippines x x
Thailand x
Belgium x
Italy x
Spain x x
Russia x x
Denmark x x x
Argentina x
Paraguay x
Venezuela x
Table 4-24 “Brand glamor driven mainstream” segments found

International Market Segmentation Study
162
7. Only brand attractiveness driven (very little skin care involved)
Table 4-25 presents the general structure of “Only brand attractiveness driven
(very little skin care involved)” transnational segment.
Importance level Requirements towards a product/brand
High This brand is highly advertised It is a modern brand
Middle Products have a pleasant fragrance This brand is for demanding women who give importance to their appearance
Low
Products offer good value for money Products are of high quality It is a trustworthy brand Products fulfill current expectations towards skin care Products perform better than those of other brands Products contain highly effective ingredients This brand offers mild skin care products Products are suitable for sensitive skin Products rely on the latest scientific findings Products are highly appropriate for skin
Table 4-25 Structure of “Only brand attractiveness driven (very little skin care involved)”
transnational segment
The segment can be described verbally as follows:
• Here one talks about much more spontaneous and much less skin care
involved women than in the previous segment.
• They switch brands all the time. Trying a sample can easily make them buy
a product.
• They do not really care about functional product characteristics – they just
have to like a packaging and design.
• These women spend hours on pampering themselves. They cannot imagine
going out without putting on make-up or fragrance. They dream of looking
like models and stars in magazines.

International Market Segmentation Study
163
• They like changes and surprises in their life. They are more likely to spend
an evening together with their friends at the pub than watching TV on a
cozy couch at home.
• These women are normally very young. They are singles. Many of them are
students.
• List of countries, where country-specific segments included into this
transnational segment were found in the case of the three segmentation
approaches, is shown in Table 4-26.
Segmentation approach based on Country
Ward’s method K-means method SOM
Hong Kong x x
Korea x x x
Taiwan x x x
Thailand x x
Australia x x x
Belgium x x x
Germany x x x
Italy x x x
Netherlands x x
Spain x x
Switzerland x x x
Russia x
Norway x x x
Argentina x x x
Venezuela x x x
Table 4-26 “Only brand attractiveness driven (very little skin care involved)” segments found

International Market Segmentation Study
164
8. Sensitivity and mildness driven
Table 4-27 presents the general structure of “Sensitivity and mildness driven”
transnational segment.
Importance level Requirements towards a product/brand
High This brand offers mild skin care products Products are suitable for sensitive skin Products are highly appropriate for skin
Middle
Products offer good value for money Products are of high quality It is a trustworthy brand Products fulfill current expectations towards skin care Products perform better than those of other brands Products contain highly effective ingredients Products rely on the latest scientific findings Products have a pleasant fragrance
Low
This brand is highly advertised It is a modern brand This brand is for demanding women who give importance to their appearance
Table 4-27 Structure of “Sensitivity and mildness driven” transnational segment
The segment can be described verbally as follows:
• Members of this segment need mild products, which are highly compatible
to sensitive skin and therefore can be used everyday.
• These women tend to have problematic (dry and sensitive) skin. Taking
care of it, protecting and moisturizing it are always in their minds.
• The lifestyle of these women is quite simple. They do not look for
products, which could help them to create image, but rather for products,
which could help them to feel well. Products with natural ingredients or
products recommended by dermatologists are more likely to draw their
attention than attractive and modern products.

International Market Segmentation Study
165
• All kinds of women can be found in this group: young and old, singles and
married, poor and rich, well-educated and not.
• List of countries, where country-specific segments included into this
transnational segment were found in the case of the three segmentation
approaches, is shown in Table 4-28.
Segmentation approach based on Country
Ward’s method K-means method SOM
Hong Kong x
Indonesia x x
Philippines x x x
Taiwan x
Australia x x x
Belgium x x x
Germany x x x
Netherlands x x x
Switzerland x x x
Russia x x x
Denmark x x x
Norway x x x
Argentina x
Paraguay x x
Table 4-28 “Sensitivity and mildness driven” segments found

International Market Segmentation Study
166
9. Moderate level of mildness from a popular and modern brand
Table 4-29 presents the general structure of “Moderate level of mildness from a
popular and modern brand” transnational segment.
Importance level Requirements towards a product/brand
High
This brand is highly advertised It is a modern brand This brand offers mild skin care products Products are suitable for sensitive skin Products are highly appropriate for skin
Middle
Products rely on the latest scientific findings Products have a pleasant fragrance This brand is for demanding women who give importance to their appearance
Low
Products offer good value for money Products are of high quality It is a trustworthy brand Products fulfill current expectations towards skin care Products perform better than those of other brands Products contain highly effective ingredients
Table 4-29 Structure of “Moderate level of mildness from a popular and modern brand”
transnational segment
The segment can be described verbally as follows:
• Members of this segment are much more emotionally driven than members
of the previous one.
• They also tend to have dry and sensitive skin. However, their skin is
healthier, and they are not concentrated only on dealing with this problem.
Of course, they expect the products they use to be mild, but they also do
not mind them to be attractive and modern.
• These women like to experiment with brands. They tend to try and buy new
products and can be easily influenced by advertising.
• While keeping their problematic skin in mind, they try to follow the latest
trends and to buy innovative and popular brands.
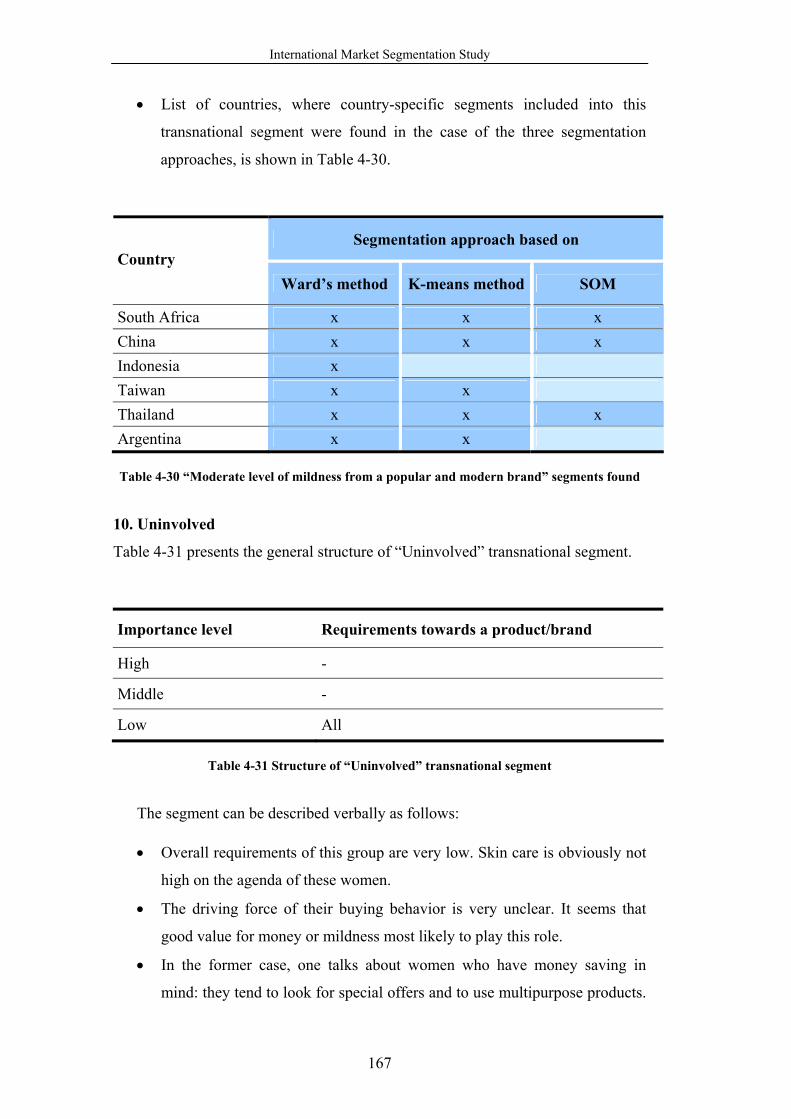
International Market Segmentation Study
167
• List of countries, where country-specific segments included into this
transnational segment were found in the case of the three segmentation
approaches, is shown in Table 4-30.
Segmentation approach based on Country
Ward’s method K-means method SOM
South Africa x x x China x x x Indonesia x Taiwan x x Thailand x x x Argentina x x
Table 4-30 “Moderate level of mildness from a popular and modern brand” segments found
10. Uninvolved
Table 4-31 presents the general structure of “Uninvolved” transnational segment.
Importance level Requirements towards a product/brand
High -
Middle -
Low All
Table 4-31 Structure of “Uninvolved” transnational segment
The segment can be described verbally as follows:
• Overall requirements of this group are very low. Skin care is obviously not
high on the agenda of these women.
• The driving force of their buying behavior is very unclear. It seems that
good value for money or mildness most likely to play this role.
• In the former case, one talks about women who have money saving in
mind: they tend to look for special offers and to use multipurpose products.

International Market Segmentation Study
168
Nevertheless, their buying behavior is much less deliberate than that of a
“good quality at a fair price oriented” segment. For instance, they may buy
a product just because it is the cheapest one, or because it smells nice.
• In the latter case, one talks about women who have to deal with some skin
problems and are forced to look for a minimum level of mildness and
protection.
• In general, one talks here about indifferent observers. They prefer just to be
natural and do not really care about the opinion of others.
• Unemployed or housewives can be often found in this group. In other
words, women who tend to spend their life at home.
• List of countries, where country-specific segments included into this
transnational segment were found in the case of the three segmentation
approaches, is shown in Table 4-32.
Segmentation approach based on Country
Ward’s method K-means method SOM
Hong Kong x x Thailand x Spain x x Denmark x x x Paraguay x
Table 4-32 “Uninvolved” segments found
Analysis of bar diagrams depicting the number of countries, where each particular
transnational segment was found, has allowed making the following conclusions:
• in the case of solutions found using the Ward’s method:
◦ “Rationalists”, “Highly demanding” and “Good quality at a fair
price” groups have the broadest (i.e., the most “global”) character
(see Figure 4-6). Only these three groups extend across all five
regions of the world (Africa, Asia, Australia, Europe, and South
America).
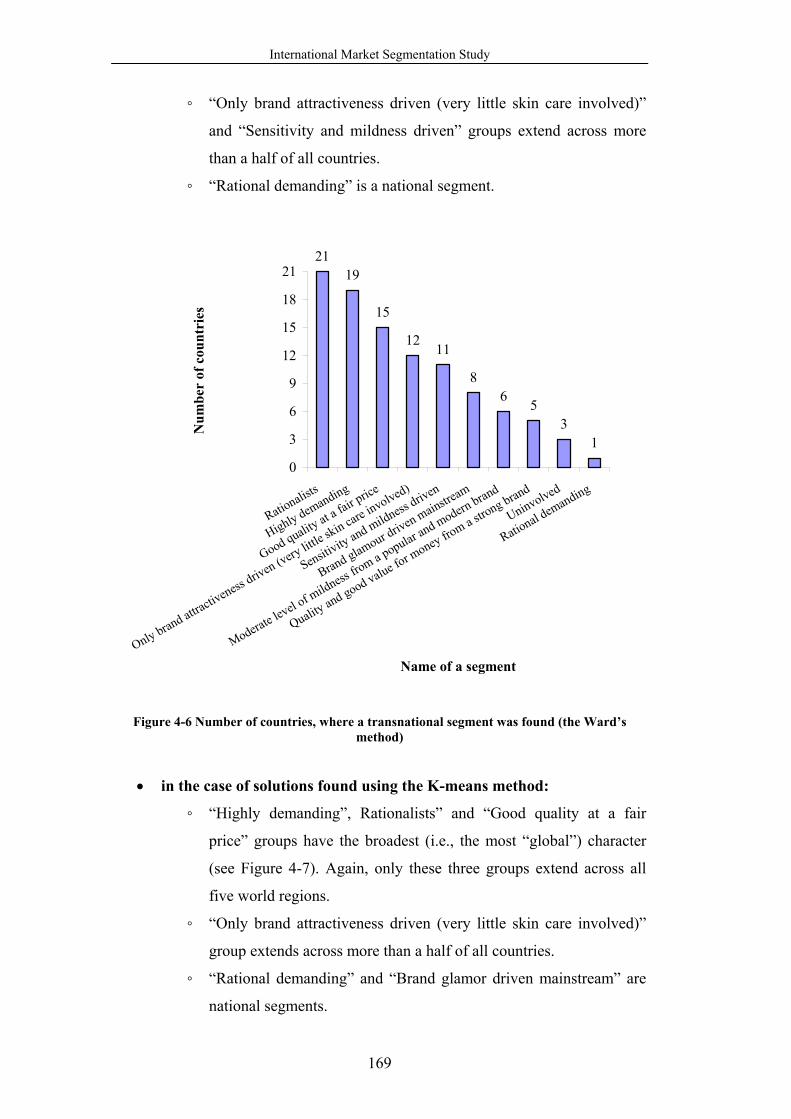
International Market Segmentation Study
169
◦ “Only brand attractiveness driven (very little skin care involved)”
and “Sensitivity and mildness driven” groups extend across more
than a half of all countries.
◦ “Rational demanding” is a national segment.
2119
15
12 11
86 5
31
0
3
6
9
12
15
18
21
Rationalists
Highly demanding
Good quality at a fair p
rice
Only brand attractiveness d
riven (very little s
kin care involved)
Sensitivity and mildness d
riven
Brand glamour driven mainstream
Moderate level of mildness f
rom a popular and modern brand
Quality and good value for m
oney from a stro
ng brand
Uninvolved
Rational demanding
Name of a segment
Num
ber
of c
ount
ries
Figure 4-6 Number of countries, where a transnational segment was found (the Ward’s method)
• in the case of solutions found using the K-means method:
◦ “Highly demanding”, Rationalists” and “Good quality at a fair
price” groups have the broadest (i.e., the most “global”) character
(see Figure 4-7). Again, only these three groups extend across all
five world regions.
◦ “Only brand attractiveness driven (very little skin care involved)”
group extends across more than a half of all countries.
◦ “Rational demanding” and “Brand glamor driven mainstream” are
national segments.

International Market Segmentation Study
170
20 20
1614
10
53 2 1 1
0
3
6
9
12
15
18
21
Highly demanding
Rationalists
Good quality at a fair p
rice
Only brand attractiveness d
riven (very little s
kin care involved)
Sensitivity and mildness d
riven
Moderate level of mildness f
rom a popular and modern brand
Quality and good value fo
r money fro
m a strong brand
Uninvolved
Rational demanding
Brand glamour driven mainstream
Name of a segment
Num
ber
of c
ount
ries
Figure 4-7 Number of countries, where a transnational segment was found (the K-means method)
• in the case of solutions found using SOM:
◦ “Rationalists”, “Highly demanding” and “Good quality at a fair
price” groups have the broadest (i.e., the most “global”) character
and extend across all five world regions also here (see Figure 4-8).
◦ Nevertheless, the total number of groups extending across more
than a half of countries has increased in this case to seven.
◦ All groups extend across national borders.
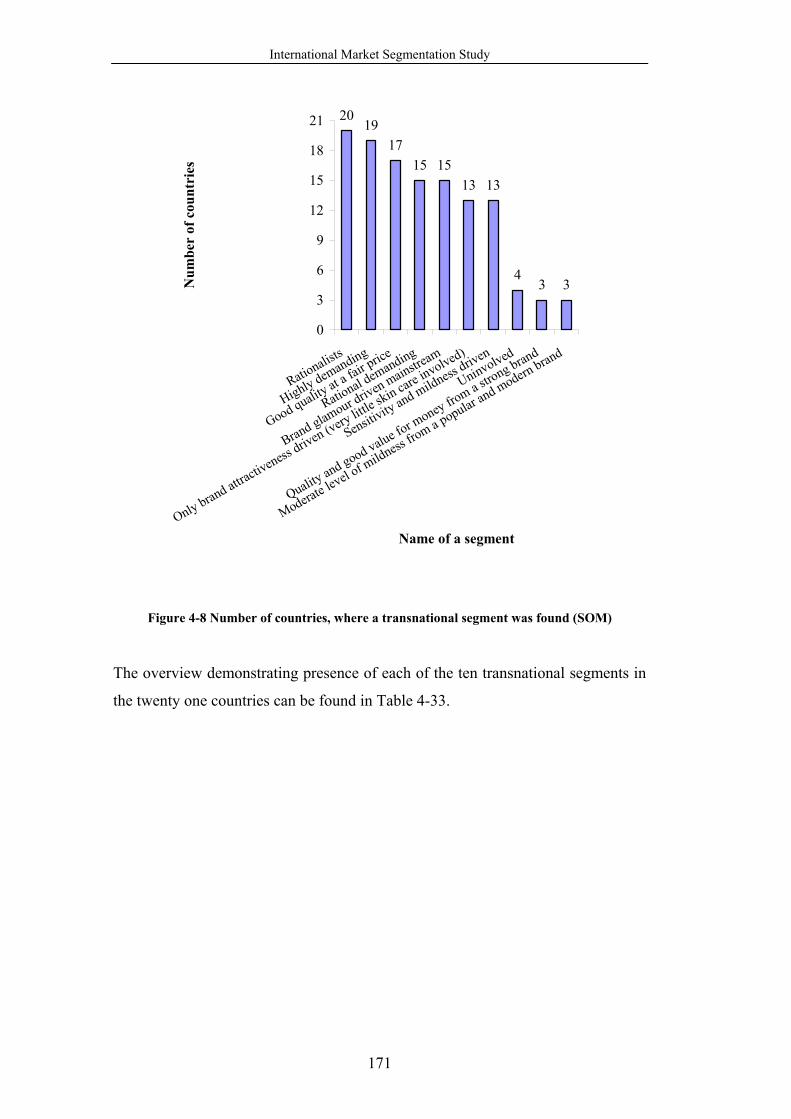
International Market Segmentation Study
171
2019
1715 15
13 13
43 3
0
3
6
9
12
15
18
21
Rationalists
Highly demanding
Good quality at a fair p
rice
Rational demanding
Brand glamour driven mainstream
Only brand attractiveness
driven (very little s
kin care involved)
Sensitivity and mildness d
riven
Uninvolved
Quality and good value for m
oney from a s
trong brand
Moderate level of mildness f
rom a popular and modern brand
Name of a segment
Num
ber
of c
ount
ries
Figure 4-8 Number of countries, where a transnational segment was found (SOM)
The overview demonstrating presence of each of the ten transnational segments in
the twenty one countries can be found in Table 4-33.

International Market Segmentation Study
172
Transnational segment
Country H
ighl
y de
man
ding
Rat
iona
l dem
andi
ng
Rat
iona
lists
Goo
d qu
ality
at a
fair
pri
ce
Qua
lity
and
good
val
ue fo
r m
oney
fr
om a
stro
ng b
rand
Bra
nd g
lam
or d
rive
n m
ains
trea
m
Onl
y br
and
attr
activ
enes
s dri
ven
(ver
y lit
tle sk
in c
are
invo
lved
)
Sens
itivi
ty a
nd m
ildne
ss d
rive
n
Mod
erat
e le
vel o
f mild
ness
from
a
popu
lar
and
mod
ern
bran
d
Uni
nvol
ved
South Africa w/k/s w/k/s w/k/s w/s w/k/s China w/k/s s w/k/s k/s w s w/k/s Hong Kong w/k/s s w/k/s w/k/s w/s k/s w w/s Indonesia k/s s w/k/s w/k/s w/s k/s w Korea k/s s w/k/s w/k/s w/s w/k/s Philippines w/k/s w/k/s w/k/s w/s w/k/s Taiwan w/k/s k/s w w/k/s w/k/s s w/k Thailand w/k s w/k/s w/k/s s w/k w/k/s s Australia w/k/s w/k/s w/k/s w/k/s w/k/s Belgium w/k/s s w/k/s w/s s w/k/s w/k/s Germany w/k/s w/s w/k/s w/k/s w/k/s w/k/s Italy w/k s w/k/s w/k/s s w/k/s Netherlands w/k/s s w/k/s w/k/s w/s w/k/s Spain w/k/s s w/k/s w/k/s w/s k/s w/s Switzerland w/k/s s w/k/s w/k/s w/k/s w/k/s Russia w/k/s w/k/s w/k/s w/s k w/k/s Denmark w/s w/k/s w/k/s w/k/s w/k/sNorway w/k/s s w/k/s w/k/s w/k/s w/k/s Argentina w/k/s w/k/s w/k/s s w/k/s s w/k Paraguay w/k/s s w/k/s w/k/s s w/s k Venezuela w/k/s s w/k/s k/s w s w/k/s Note: w means that a segment belongs to a solution found using the Ward’s method k means that a segment belongs to a solution found using the K-means method s means that a segment belongs to a solution found using SOM
Table 4-33 Presence of transnational segments in twenty one countries
International Market Segmentation Study
173
4.6.1.5.2 Examples of Regional/Country-Specific Peculiarities
Not only common features, but also regional/country-specific peculiarities were
identified while analyzing and combining country-specific segments. Most
significant of them are presented below.
4.6.1.5.2.1 Differences in Demographic Characteristics, Brand Assessments, and Behavioral Characteristics
While combining country-specific segments into transnational ones, accepting a
certain degree of divergence in demographic characteristics, brand assessments,
and behavioral characteristics of country-specific segments appeared to be
unavoidable.
For instance, education levels of respondents included into one and the same
transnational segment and their professions differed from country to country. This
can be explained by existence of distinctions in national educational systems and
types of professions as well as in national social meanings of completing a
particular degree or occupying a particular position.
Although there was normally no variation in country-specific relative levels of
monthly household incomes (i.e., high, middle, low) of respondents included into
one and the same transnational segment, clear differences were identified while
comparing them cross-nationally. These differences should be addressed to
distinctions in overall levels of monthly household incomes existing between the
countries.
Moreover, there were differences in brand awareness, likeability, usage, and
advertising recall. The reason for this is variation in the composition of brands as
well as in their role and image across the countries.
Furthermore, choices of purchase locations varied from country to country. This is
obviously due to differences in the number and type of distribution channels
existing between the countries.
Finally, differences in media usage behavior were observed. They seem to be
caused by variation in availability and prevalence of media types across the
countries.

International Market Segmentation Study
174
4.6.1.5.2.2 Differences in Character/Structure of Cluster Solution
During the analysis of country-specific segments, it was realized that
regional/country-specific cultural or economic factors have often strongly
influenced formation of segments and caused creation of regional/country-specific
features in a character or structure of a cluster solution. Examples of such
peculiarities are presented below.
South Africa
Dealing with South Africa means dealing with a multiracial society. According to
the representative sample collected in South Africa, white, black, colored and
Asian females live there. Of course, representatives of different races have
different cultural backgrounds. Moreover, while comparing white and black
females, it becomes clear that females of a white race still tend to belong to higher
social classes than females of a black race (see Figure 4-9).462 Correspondingly,
clear racial differentiation can be observed between segments in South Africa.
17% 17%21%
11%
22%
12%
35%
29%
21%
0% 0%
15%
0%5%
10%15%20%25%30%35%40%
LSM 5 LSM 6 LSM 7 LSM 8 LSM 9 LSM 10
Black females J = 302 White females J = 401
Figure 4-9 Percentages of black and white females in a social class
East Europe: Russia 462 LSM 10 (LSM 5) is the highest (lowest) class among all social classes considered.

International Market Segmentation Study
175
In Russia, as in any developing market economy, requirements and preferences of
respondents are affected by the amount of money they possess much stronger than
in West Europe. Correspondingly, separation of Russian respondents into clusters
is primarily defined by the level of their household income. In particular, the
following observations can be made:
- according to percentages presenting different household income levels,
respondents are very clearly subdivided into poor, middle reach, and reach
groups;
- age differences are often neglected: very young and very old age groups,
which actually present the poorest stratum in Russia, appear to be mixed in
one and the same segment;
- differences between students and pensioners are neglected: these two
normally low-income groups appear to be combined together;
- a rational or unpretentious character of segments strongly corresponds to
low household incomes of its members.
South America
Argentineans, Paraguayans, and Venezuelans are impulsive maximalists as typical
Latinos. Their requirements tend to be at the highest level. Females in the
representative sample collected in South America tick “7” on a seven point rating
scale much oftener than females in Europe (see Figure 4-10)463. Correspondingly,
sizes of demanding segments appear to be bigger in South America.
463 A percentage for each point on a rating scale was calculated here in the following way:
point% = J
Jpoint ,
where J is the total number of respondents
pointJ is the average number of respondents ticking this point on a rating scale. It is equal to
14
J14
1n
npoint∑
= ,
where npointJ is the number of respondents ticking this point on a rating scale in the case of a basis variable
(requirement towards a product/brand) n (n = 1, …, 14)

International Market Segmentation Study
176
5% 6%11% 13%
62%
3% 4%
74%
1%
17%
3%
11%
19%26%
2%2%10%
6%2%1% 4%2%
1%
69%
7%5%2%
33%
0%
10%
20%
30%
40%
50%
60%
70%
80%
1 2 3 4 5 6 7
Argentina N = 516 Paraguay N = 402 Venezuela N = 800 Germany N = 1047
Figure 4-10 Percentages for a point on a rating scale
4.6.1.6 Assessment of Segmentation Approaches
As it was already demonstrated above, cluster solutions produced by all three
segmentation approaches can be viewed as reliable partitions consisting of
homogeneous clusters differing from each other significantly.464 In this part of the
thesis additional criteria indispensable for assessment of segmentation approaches
are considered.
4.6.1.6.1 Application Convenience
It can be definitely stated that the segmentation approach based on SOM was the
most complicated one among the three segmentation approaches used. Here the
researcher had to go through the next three effort- and time-consuming stages of
analysis:
- examining a big number of maps and corresponding cluster characteristics,
in order to find the most appropriate map size;
- identifying cluster regions and finding cluster membership of respondents
assigned to “transitional” neurons;
- describing and interpreting clusters. 464 For more details see part 4.6.1.3 of the present thesis.

International Market Segmentation Study
177
The other two segmentation approaches (based on the Ward’s and K-means
methods) appeared to be much more convenient in use. Of course, the researcher
had to describe and interpret obtained cluster solutions here as well, but the process
of finding the final cluster solution was much more methodically determined,
easier, and faster in both cases: while determining the appropriate number of
clusters, the researcher had to examine only a few cluster solutions resulted from
statistical analyses conducted by the user-friendly SPSS software.
4.6.1.6.2 Structure, Meaningfulness and Coherency of Cluster Solution
Examination of structure, meaningfulness and coherency of three cluster solutions
in the case of each country has allowed concluding that the worst solutions were
normally found using the K-means method.
First of all, the K-means method tended to building one relatively big cluster with
overall high requirements that exceeded by far corresponding segments produced
by the Ward’s method and SOM.465 Increasing the number of clusters in a cluster
solution has not produced better results in such cases, as far as one or several
clusters including only a very small number of respondents normally appeared
making a corresponding solution unacceptable. Secondly, the content of the
obtained big clusters was rather vague. This has complicated description and
interpretation of cluster solutions.
Solutions found using the Ward’s method were normally most well-structured,
meaningful, and coherent. Nevertheless, the most detailed and informative
solutions were found using SOM. These solutions normally consisted of a bigger
number of clusters than in the case of solutions found using the other two
segmentation approaches (see Table 4-34). At the same time, cluster sizes
remained substantial, and cluster contents were quite meaningful and coherent.
Moreover, examination of not only differences, but also similarities between
clusters was enabled by visualization of cluster regions.
465 In South Africa, Paraguay, and Venezuela the size of such clusters is even larger than 50% of the total sample.
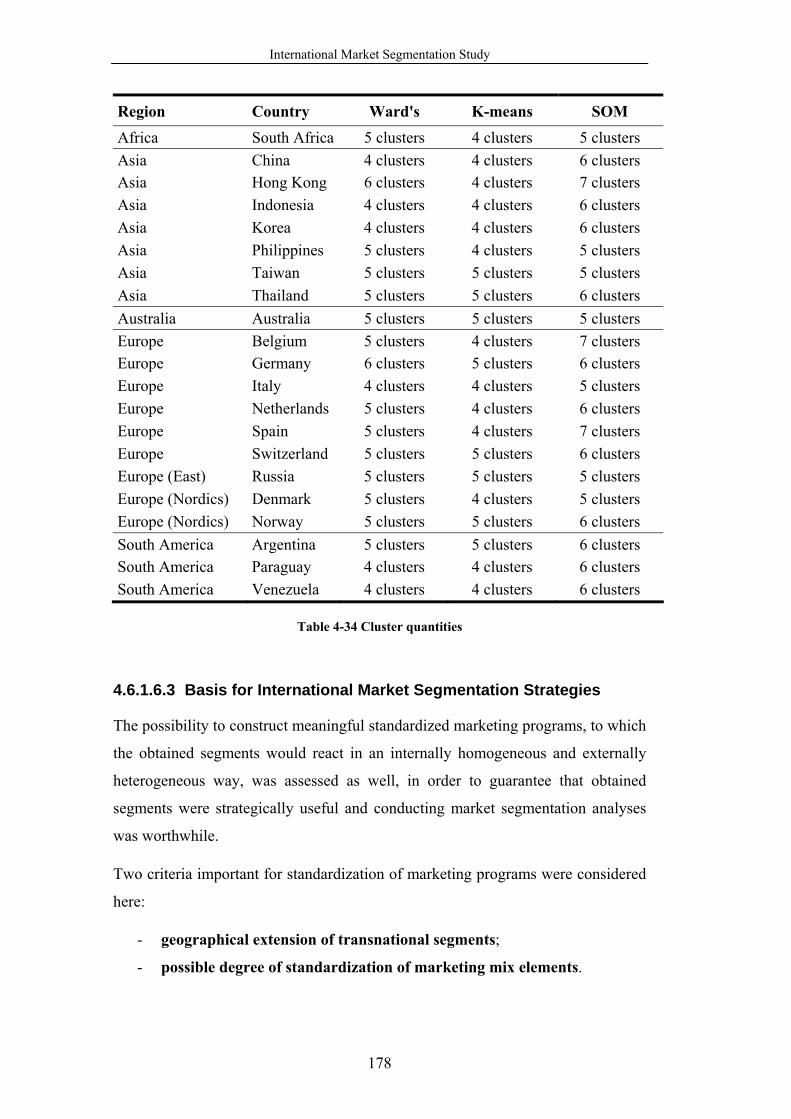
International Market Segmentation Study
178
Region Country Ward's K-means SOM Africa South Africa 5 clusters 4 clusters 5 clusters Asia China 4 clusters 4 clusters 6 clusters Asia Hong Kong 6 clusters 4 clusters 7 clusters Asia Indonesia 4 clusters 4 clusters 6 clusters Asia Korea 4 clusters 4 clusters 6 clusters Asia Philippines 5 clusters 4 clusters 5 clusters Asia Taiwan 5 clusters 5 clusters 5 clusters Asia Thailand 5 clusters 5 clusters 6 clusters Australia Australia 5 clusters 5 clusters 5 clusters Europe Belgium 5 clusters 4 clusters 7 clusters Europe Germany 6 clusters 5 clusters 6 clusters Europe Italy 4 clusters 4 clusters 5 clusters Europe Netherlands 5 clusters 4 clusters 6 clusters Europe Spain 5 clusters 4 clusters 7 clusters Europe Switzerland 5 clusters 5 clusters 6 clusters Europe (East) Russia 5 clusters 5 clusters 5 clusters Europe (Nordics) Denmark 5 clusters 4 clusters 5 clusters Europe (Nordics) Norway 5 clusters 5 clusters 6 clusters South America Argentina 5 clusters 5 clusters 6 clusters South America Paraguay 4 clusters 4 clusters 6 clusters South America Venezuela 4 clusters 4 clusters 6 clusters
Table 4-34 Cluster quantities
4.6.1.6.3 Basis for International Market Segmentation Strategies
The possibility to construct meaningful standardized marketing programs, to which
the obtained segments would react in an internally homogeneous and externally
heterogeneous way, was assessed as well, in order to guarantee that obtained
segments were strategically useful and conducting market segmentation analyses
was worthwhile.
Two criteria important for standardization of marketing programs were considered
here:
- geographical extension of transnational segments;
- possible degree of standardization of marketing mix elements.

International Market Segmentation Study
179
According to the first criterion, the segmentation approach based on SOM has
produced the best results: majority of transnational segments found on the base of
country-specific solutions obtained using SOM extended across more than a half of
all considered countries. At the same time, results of the segmentation approach
based on the K-means method have appeared to be the poorest.
According to the second criterion, all three segmentation approaches have shown
similar results. On the one hand, it was concluded that transnational segments
found in all three cases would allow for a high degree of standardization of a
product (see Table 4-35). On the other hand, it was realized that other marketing
mix elements (i.e., promotion, distribution, and pricing) would require some
degree of differentiation. The reason for this was existence of regional/country-
specific peculiarities described earlier in this part of the thesis.
Transnational segment Standardized product features
Highly demanding Upscale image, attractiveness, modernity, popularity, high quality, mildness, convenience
Rational demanding High quality, mildness, convenience, attractiveness
Rationalists High quality, mildness, convenience
Good quality at a fair price Good quality, convenience
Quality and good value for money from a strong brand Good quality, convenience, popularity
Brand glamor driven mainstream Attractiveness, modernity, good quality
Only brand attractiveness driven (very little skin care involved) Attractiveness, modernity, popularity
Sensitivity and mildness driven Mildness
Moderate level of mildness from a popular and modern brand
Mildness, attractiveness, modernity, popularity
Uninvolved Inexpensiveness, moderate level of quality and/or mildness
Table 4-35 Standardized product features

International Market Segmentation Study
180
It should be additionally mentioned that as far as cluster solutions obtained by
means of the segmentation approach based on SOM are most detailed and
informative, international market segmentation strategies constructed on their base
are likely to be most precise and efficient. For instance, SOM has enabled
identification of “Rational demanding” segment, which is strategically important in
such regions as South America, where requirements of majority of respondents are
set to the highest level, and separation of respondents into groups has to be more
perceptible to differences in their entries.
4.6.2 Integral Market Segmentation
4.6.2.1 Data Preparation
4.6.2.1.1 Defining Sample Size
For conducting integral market segmentation, the twenty one country samples had
to be combined to one “world” sample. In order to guarantee representativeness of
this sample, it was decided to combine the country samples after making their sizes
proportional to corresponding female population sizes.
First of all, corresponding female population sizes were found on the base of
information about an actual population size and sex ratio in each of the twenty one
countries investigated (see Table 4-36).466
Then, the adjustment ratio was calculated in the case of each country. It is defined
as follows:467
Adjustment Ratio = SS
FPS, (4-2)
where
FPS is a share of a country female population in the total female population
consisting of female populations in the twenty one countries
SS is a share of a country sample in the total sample consisting of the twenty one
country samples
466 As far as buying and consumption of NIVEA brand in China, Indonesia, Korea, Philippines, and Taiwan are concentrated in central locations only, not country populations, but populations in corresponding cities were considered in the case of these countries. 467 See Ter Hofstede/Steenkamp/Wedel, 1999, p. 4.

International Market Segmentation Study
181
Country
Tot
al
popu
latio
n in
th
ousa
nds
Sex
ratio
% o
f fem
ales
in
tota
l pop
ulat
ion
Fem
ale
popu
latio
n in
th
ousa
nds
South Africa 42718.5 0.99 male(s)/1 female 50.3 21466.6 China (Shanghai/Beijing) 16800.0 1.06 male(s)/1 female 48.5 8155.3 Hong Kong 6690.0 0.96 male(s)/1 female 51.0 3413.3 Indonesia (Jakarta/Bandung/Surabaya) 14513.8 1 male(s)/1 female 50.0 7256.9 Korea (Seoul) 9853.0 1.03 male(s)/1 female 49.3 4854.2 Philippines (Manila) 1581.1 0.99 male(s)/1 female 50.3 794.5 Taiwan (Taipei) 2600.5 1.03 male(s)/1 female 49.3 1281.1 Thailand 64865.5 0.98 male(s)/1 female 50.5 32760.4 Australia 19913.1 1.02 male(s)/1 female 49.5 9858.0 Belgium 10348.3 1.02 male(s)/1 female 49.5 5122.9 Germany 82424.6 1.04 male(s)/1 female 49.0 40404.2 Italy 58057.5 1.02 male(s)/1 female 49.5 28741.3 Netherlands 16318.2 1.03 male(s)/1 female 49.3 8038.5 Spain 40280.8 1.01 male(s)/1 female 49.8 20040.2 Switzerland 7450.9 1.02 male(s)/1 female 49.5 3688.5 Russia 143782.3 0.94 male(s)/1 female 51.5 74114.6 Denmark 5413.4 1.02 male(s)/1 female 49.5 2679.9 Norway 4574.6 1.03 male(s)/1 female 49.3 2253.5 Argentina 39144.8 1 male(s)/1 female 50.0 19572.4 Paraguay 6191.4 1.01 male(s)/1 female 49.8 3080.3 Venezuela 25017.4 1.01 male(s)/1 female 49.8 12446.5
Table 4-36 Finding female population sizes
Source: www.cia.gov/cia/publications/factbook/ and Der Fischer Weltalmanach 2004.
To obtain country samples having sizes proportional to corresponding female
population sizes, it was decided to extract randomly the percentage of each country
sample equal to some common percentage multiplied by the adjustment ratio
presented above. It was attempted to extract the highest possible number of
respondents, in order to minimize information losses. As Table 4-37 demonstrates,
the chosen common percentage is equal to 37.5%. Any further increase in this
percentage would require extracting a sample bigger than the available one in the
case of Russia. In other words, using 37.5% as the common percentage guaranteed

International Market Segmentation Study
182
that the maximum possible number of respondents was included into the “world”
sample.
Country
Size
of a
n or
igin
al sa
mpl
e
Sam
ple
shar
e (S
S)
Fem
ale
popu
latio
n in
th
ousa
nds
Fem
ale
popu
latio
n sh
are
(FPS
)
Adj
ustm
ent R
atio
: PS/
SS
Perc
enta
ge o
f an
orig
inal
sa
mpl
e to
be
extr
acte
d (3
7.5%
*adj
ustm
ent r
atio
)
Size
of a
sam
ple
to b
e ex
trac
ted
South Africa 801 6.0% 21467 6.9% 1.16 43.4% 348 China (Shanghai/Beijing) 800 6.0% 8155 2.6% 0.44 16.5% 132
Hong Kong 504 3.8% 3413 1.1% 0.29 11.0% 55 Indonesia (Jakarta/Bandung/Surabaya)
826 6.2% 7257 2.3% 0.38 14.2% 118
Korea (Seoul) 500 3.7% 4854 1.6% 0.42 15.7% 79 Philippines (Manila) 500 3.7% 795 0.3% 0.07 2.6% 13
Taiwan (Taipei) 504 3.8% 1281 0.4% 0.11 4.1% 21 Thailand 1000 7.5% 32760 10.6% 1.42 53.1% 531 Australia 581 4.3% 9858 3.2% 0.73 27.5% 160 Belgium 372 2.8% 5123 1.7% 0.59 22.3% 83 Germany 1047 7.8% 40404 13.0% 1.67 62.5% 654 Italy 521 3.9% 28741 9.3% 2.38 89.3% 465 Netherlands 491 3.7% 8039 2.6% 0.71 26.5% 130 Spain 755 5.6% 20040 6.5% 1.15 43.0% 325 Switzerland 506 3.8% 3689 1.2% 0.31 11.8% 60 Russia 1200 9.0% 74115 23.9% 2.67 100.0% 1200 Denmark 400 3.0% 2680 0.9% 0.29 10.8% 43 Norway 366 2.7% 2254 0.7% 0.27 10.0% 36 Argentina 516 3.9% 19572 6.3% 1.64 61.4% 317 Paraguay 402 3.0% 3080 1.0% 0.33 12.4% 50 Venezuela 800 6.0% 12447 4.0% 0.67 25.2% 202 Total 13392 100.0% 310023 100.0% 37.5% 5022
Table 4-37 Finding sizes of samples to be extracted

International Market Segmentation Study
183
Looking at the percentages of country samples to be extracted, it was realized that
some of them were extremely low (for instance, 2.6% in the case of Philippines,
4.1% in the case of Taiwan, 10.0% in the case of Norway, etc.). Due to the fact
that, in such cases, losses in country-specific information would be very high, and
using such small country groups while describing and interpreting the results of
integral market segmentation would be very unreliable, it was decided to adjust
sample sizes to female population sizes approximately, in particular, according to
the four-group system presented in Table 4-38.
Group number Female population size Size of a sample to be extracted
1 more than 30000 thousands 600 respondents 2 15000-30000 thousands 500 respondents 3 7000-15000 thousands 400 respondents
4 less than 7000 thousands 300 respondents
Table 4-38 Four-group system After subdividing all countries into the four groups shown above, a sample of a
corresponding size was extracted randomly in the case of each country (see Table
4-39). It was concluded that values of all extracted percentages were rather
substantial, and the obtained “world” sample was used for the segmentation
analyses described below.

International Market Segmentation Study
184
Country
Fem
ale
popu
latio
n si
ze
in th
ousa
nds
Gro
up n
umbe
r
Size
of a
n or
igin
al sa
mpl
e
Size
of a
sam
ple
to b
e ex
trac
ted
Perc
enta
ge o
f an
orig
inal
sam
ple
to b
e ex
trac
ted
South Africa 21466.6 2 801 500 62.4% China (Shanghai/Beijing) 8155.3 3 800 400 50.0% Hong Kong 3413.3 4 504 300 59.5% Indonesia (Jakarta/Bandung/Surabaya) 7256.9 3 826 400 48.4%
Korea (Seoul) 4854.2 4 500 300 60.0% Philippines (Manila) 794.5 4 500 300 60.0% Taiwan (Taipei) 1281.1 4 504 300 59.5% Thailand 32760.4 1 1000 600 60.0% Australia 9858.0 3 581 400 68.8% Belgium 5122.9 4 372 300 80.6% Germany 40404.2 1 1047 600 57.3% Italy 28741.3 2 521 500 96.0% Netherlands 8038.5 3 491 400 81.5% Spain 20040.2 2 755 500 66.2% Switzerland 3688.5 4 506 300 59.3% Russia 74114.6 1 1200 600 50.0% Denmark 2679.9 4 400 300 75.0% Norway 2253.5 4 366 300 82.0% Argentina 19572.4 2 516 500 96.9% Paraguay 3080.3 4 402 300 74.6% Venezuela 12446.5 3 800 400 50.0%
Total 310023 13392 8500 63.5%
Table 4-39 Finding sizes of samples to be extracted according to the four-group system
4.6.2.1.2 Factor Analysis
As in the case of additive intranational market segmentation, input variables were
first transformed into factor values by means of the SPSS software.
Again, it was quite difficult to make a conclusion about the reasonability of
conducting factor analysis on the base of examining the correlation matrix

International Market Segmentation Study
185
alone.468 Nevertheless, the following observations supporting the assumption that
conducting factor analysis makes sense could be made:
- majority of correlation coefficients are significantly different from zero;
- majority of non-diagonal elements of the inverse correlation matrix and
anti-image covariance matrix are close to zero;
- significance of the Bartlett’s test is equal to zero;
- MSA = 0.89, in other words, it is higher than 0.8.
The factors were extracted using PCA, and the decision about their number was
based on the Kaiser criterion. After conducting the Varimax rotation, factors were
interpreted and named (see Table 4-40).
Factors
Requirements towards a product/brand Quality Brand
glamor
Sensitivity and
mildness Products are of higher quality 0.749 0.002 0.176 Products offer good value for money 0.712 0.040 0.055 It is a trustworthy brand 0.681 0.217 0.205 Products fulfill current expectations towards skin care 0.667 0.170 0.297
Products contain highly effective ingredients 0.580 0.213 0.378 Products perform better than those of other brands 0.515 0.419 0.141 It is a modern brand 0.067 0.848 0.078 This brand is highly advertised 0.014 0.844 -0.027 This brand is for demanding women who give importance to their appearance 0.235 0.701 0.137
Products are suitable for sensitive skin 0.094 -0.003 0.860 This brand offers mild skin care products 0.303 0.175 0.660 Products are highly appropriate for skin 0.431 -0.081 0.606 Products rely on the latest scientific findings 0.167 0.418 0.603 Products have a pleasant fragrance 0.294 0.325 0.208 Note: High factor loadings ( ≥ 0.5) are highlighted with yellow
Table 4-40 Chosen factor solution
The first factor “Quality” explained 35.35% of the total variance, the second factor
“Brand glamor” – 13.20% of the total variance, and the third factor “Sensitivity
468 As in the case of additive intranational market segmentation, the researcher has faced the problem of dealing with not very high values (of about 0.2 - 0.5) of majority of correlation coefficients.

International Market Segmentation Study
186
and mildness” – 7.73% of the total variance. In other words, altogether they
explained 56.28% of the total variance.
4.6.2.1.3 Data Unification
Due to the fact that demographic characteristics were assessed on scales differing
from country to country, it was decided to develop common assessment scales, in
order to combine these variables.
In particular, in the case of “Age of a respondent” variable, it was decided to
transform all assessment scales with lengths varying between 5 and 11 points (age
groups) into the following assessment scale:
1 = 14-17 years old
2 = 18-24 years old
3 = 25-34 years old
4 = 35-44 years old
5 = 45-54 years old
6 = 55-65 years old
7 = older than 65 years
Assessment scales for “Marital status of a respondent” variable varied in their
length between 3 and 6 points (marital statuses) and were transformed as follows:
1 = Single
2 = Married
3 = Divorced/separated/widowed
Transformation of assessment scales for “Number of people in a household”
variable with lengths varying between 4 and 12 points (persons) was done as
follows:
1 = 1 person
2 = 2-4 persons
3 = 5 or more persons
It was decided to combine variables “Number of children under 16 years in a
household” and “Presence of children below 14/15 years in a household” (used in

International Market Segmentation Study
187
Russia and Spain) into the binary variable “Are there children under 16 years in
household?”.
As far as exact naming of professions in “Employment status of a respondent”
variable was seldom and differed across the countries, it was decided to use the
following assessment scheme in this case:
1= Works
2 = Studies
3 = Housewife
4 = Unemployed
5 = Retired
While combing assessment scales for “Education level of a respondent” variable,
even bigger generalization was required, as far as educational systems differed
from country to country dramatically. Correspondingly, the next common
assessment scale was chosen:
1 = Lower educated
2 = Middle educated
3 = Higher educated
As far as meaning of social classes and monthly household incomes could be only
approximately compared across the countries, and only one of the variables “Social
class” and “Monthly household income” was normally used in each of the twenty
one countries considered, it was decided to combine these two variables into
“Social class” variable with the next highly generalized common assessment scale:
1 = Higher social class
2 = Middle social class
3 = Lower social class
4.6.2.2 Finding Cluster Solutions
4.6.2.2.1 Segmentation Approach Based on Ward’s Method
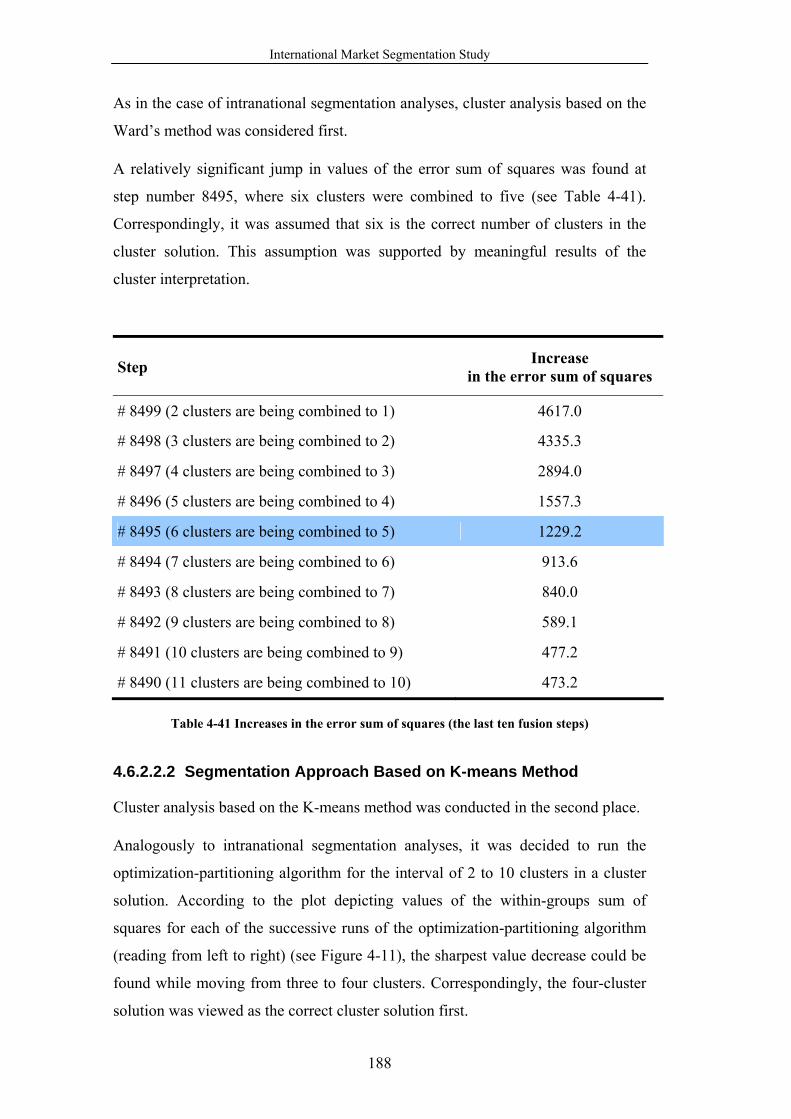
International Market Segmentation Study
188
As in the case of intranational segmentation analyses, cluster analysis based on the
Ward’s method was considered first.
A relatively significant jump in values of the error sum of squares was found at
step number 8495, where six clusters were combined to five (see Table 4-41).
Correspondingly, it was assumed that six is the correct number of clusters in the
cluster solution. This assumption was supported by meaningful results of the
cluster interpretation.
Step Increase in the error sum of squares
# 8499 (2 clusters are being combined to 1) 4617.0
# 8498 (3 clusters are being combined to 2) 4335.3
# 8497 (4 clusters are being combined to 3) 2894.0
# 8496 (5 clusters are being combined to 4) 1557.3
# 8495 (6 clusters are being combined to 5) 1229.2
# 8494 (7 clusters are being combined to 6) 913.6
# 8493 (8 clusters are being combined to 7) 840.0
# 8492 (9 clusters are being combined to 8) 589.1
# 8491 (10 clusters are being combined to 9) 477.2
# 8490 (11 clusters are being combined to 10) 473.2
Table 4-41 Increases in the error sum of squares (the last ten fusion steps)
4.6.2.2.2 Segmentation Approach Based on K-means Method
Cluster analysis based on the K-means method was conducted in the second place.
Analogously to intranational segmentation analyses, it was decided to run the
optimization-partitioning algorithm for the interval of 2 to 10 clusters in a cluster
solution. According to the plot depicting values of the within-groups sum of
squares for each of the successive runs of the optimization-partitioning algorithm
(reading from left to right) (see Figure 4-11), the sharpest value decrease could be
found while moving from three to four clusters. Correspondingly, the four-cluster
solution was viewed as the correct cluster solution first.

International Market Segmentation Study
189
Nevertheless, while assessing meaningfulness of cluster interpretation, it was
realized that this solution was too aggregated, and five-, six-, seven- as well as
eight-cluster solutions were considered instead.469 Due to the fact that clusters in
the six-cluster solution were most meaningful and coherent, it was eventually
chosen as the correct cluster solution.
100000
125000
150000
175000
200000
225000
250000
1 2 3 4 5 6 7 8 9 10Number of clusters
With
in-g
roup
s sum
of s
quar
es
Figure 4-11 Values of the within-groups sum of squares plotted against corresponding
quantities of clusters
4.6.2.2.3 Segmentation Approach Based on Self-Organizing Map
Segmentation analysis based on SOM was considered as the third approach to
clustering respondents.
As in the case of intranational segmentations, the fourteen basis variables
(requirements towards a product/brand) were used here as input data instead of
factor values.
Thirty Kohonen maps of different size were first initialized with the help of the
NENET software. Again, a hexagonal type of a neuron arrangement was used. The
469 As it can be seen in Figure 4-11, decreases in values of the within-groups sum of squares observed while moving from eight to nine and from nine to ten clusters are relatively small. Correspondingly, it was decided not to take nine- and ten-cluster solutions into consideration.

International Market Segmentation Study
190
map of size neurons 16neurons 45 × was chosen after evaluating the goodness of
all maps,470 examining a size, form and clearness of their cluster regions,471 and
assessing meaningfulness of cluster interpretations.
During map training, a neighborhood function was presented through the Gaussian
function, and the following parameters were used:472
- the number of iteration steps in the POW phase equal to 3825;
- the number of iteration steps in the FTW phase equal to 382500;
- the starting value of the width parameter )σ(t z equal to 32 in the POW
phase and to 3 in the FTW phase;
- the starting value of the learning-rate factor )α(t z equal to 0.9 in the POW
phase and to 0.02 in the FTW phase.
Seven finally obtained cluster regions are presented in Figure 4-12.
Respondents positioned on “transitional” neurons between these cluster regions
were assigned to clusters with corresponding smallest Euclidean distances between
a respondent’s profile and cluster centroid. In other words, all respondents were
subdivided into seven groups.
470 The evaluation was based on the average quantization error, topographic error, and percentage of used Kohonen-neurons criteria. 471 The examination was based on the U-matrix, hit histogram of input vectors, and component planes. 472 The choice of parameter values was done in the way analogous to the one used in the case of intranational segmentations.
th li
ght-b
lue
he th
ird
leve
l) ar
e ou
tline
d w
ith re
d fo
uth
leve
l) ar
e ou
tline
d w
ith g
reen
e
fifth
leve
l) ar
e ou
tline
d w
ith p
ink

International Market Segmentation Study
191
Figure 4-12 Cluster regions (the U-matrix)
, ,
, ,
Figu
re 4
-12
Clu
ster
reg
ions
(the
U-m
atri
x)

International Market Segmentation Study
192
4.6.2.3 Validation of Cluster Solutions
Analogously to intranational segmentation analyses, not the factors, but the
fourteen basis variables (requirements towards a product/brand) were used for
validation, description and interpretation of cluster solutions in the case of integral
market segmentation.
Visual inspection and comparison of cluster profiles consisting of cluster centroids
for each variable presented in the form of a table473 have demonstrated that the
outcomes of the three approaches to separating respondents into groups presented
above had a big number of similar features. Correspondingly, it was concluded that
the obtained cluster solution was stable.
Completely homogeneous clusters (in other words, clusters with F-values smaller
than 1 for all variables) were found in all solutions: two in the case of the solution
found using the Ward’s method, one in the case of the solution found using the K-
means method, and two in the case of the solution found using SOM. There were
also highly homogeneous clusters (in other words, clusters with at most three F-
values bigger than 1): three in the case of the solution found using the Ward’s
method, three in the case of the solution found using the K-means method, and six
in the case of the solution found using SOM. Generally speaking, majority of F-
values in the case of all three solutions were below 1. All this allowed concluding
that clusters in the solutions were rather homogeneous. Nevertheless, it was clear
that among the three segmentation approaches the one based on SOM tended to
build the most homogeneous clusters.
A big number of high positive and negative t-values as well as results of
discriminant analyses, which pointed at existence of very high canonical
correlation coefficients and low significance levels of 2χ values calculated from
values of the Wilks’s lambda for residual discrimination, supported the assumption
that there were significant differences between clusters in all three solutions.
82.2% of respondents were correctly classified by discriminant analysis in the case
of the solution found using the Ward’s method, 90.3% – in the case of the solution
473 Again, for a better overview, the variables were grouped here according to the factors they belonged to.

International Market Segmentation Study
193
found using the K-means method, and 82.1% – in the case of the solution found
using SOM. This demonstrated that the gap in levels of classification accuracy
between the K-means solution and the other two solutions has grown with the
increase in a sample size. Nevertheless, all three percentages were rather high, and
therefore all three solutions could be considered as reliable.
4.6.2.4 Description and Interpretation of Cluster Solutions
Description and interpretation of the three cluster solutions were done analogously
to description and interpretation of country-specific cluster solutions found while
conducting additive intranational market segmentation. Again, they were based on
- cluster profiles consisting of cluster centroids for each of the fourteen basis
variables (requirements towards a product/brand);
- cluster profiles consisting of cluster centroids for requirements towards a
product/brand, which were not used for cluster building;
- cluster profiles consisting of cluster centroids for attitudes towards
beauty/life;
- percentages of affirmative answers of respondents in each of the clusters
for demographic characteristics (respondent’s age and marital status,
number of people in a household, respondent’s employment status and
education level, children in a household, respondent’s monthly household
income and social class, respondent’s living location), brand assessments
(prompted awareness, likeability, usage, prompted advertising recall of
brands), skin conditions (face skin type and sensitivity, body skin type and
sensitivity), and behavioral characteristics (media usage and point of
purchase).
The cluster profiles/ percentages of affirmative answers were examined and
compared to the corresponding total sample profiles/ percentages of affirmative
answers. Again, it was distinguished between five deviation levels.474
Names and sizes of clusters obtained in the case of each of the three segmentation
approaches are presented in Table 4-42.
474 For more detailed information see part 4.6.1.4 of the present thesis.

International Market Segmentation Study
194
#1 #2 #3 #4 #5 #6
Clusters (the Ward’s method)
Rat
iona
lists
Hig
hly
dem
andi
ng
Goo
d qu
ality
at a
fair
pric
e
Bra
nd g
lam
or d
riven
m
ains
tream
Sens
itivi
ty a
nd m
ildne
ss
driv
en
Onl
y br
and
attra
ctiv
enes
s driv
en
(ver
y lit
tle sk
in c
are
invo
lved
)
Tot
al S
ampl
e
Number of respondents 2152 2188 947 1920 545 748 8500 % of total sample 25% 26% 11% 23% 6% 9% 100%
#1 #2 #3 #4 #5 #6
Clusters (the K-means method)
Rat
iona
lists
Hig
hly
dem
andi
ng
Goo
d qu
ality
at a
fair
pric
e
Sens
itivi
ty a
nd m
ildne
ss
driv
en
Onl
y br
and
attra
ctiv
enes
s dr
iven
(ver
y lit
tle sk
in
care
invo
lved
)
Qua
lity
and
good
val
ue
for m
oney
from
a st
rong
br
and
Tot
al S
ampl
e
Number of respondents 1570 3262 929 598 1490 651 8500 % of total sample 18% 38% 11% 7% 18% 8% 100%
#1 #2 #3 #4 #5 #6 #7
Clusters (SOM)
Onl
y br
and
attra
ctiv
enes
s dr
iven
(ver
y lit
tle sk
in c
are
invo
lved
)
Bra
nd g
lam
or d
riven
m
ains
tream
Hig
hly
dem
andi
ng
Rat
iona
l dem
andi
ng
Rat
iona
lists
Goo
d qu
ality
at a
fair
pric
e
Sens
itivi
ty a
nd m
ildne
ss
driv
en
Tot
al S
ampl
e
Number of respondents 753 1352 1602 1879 1147 1223 544 8500 % of total sample 9% 16% 19% 22% 13% 14% 6% 100%
Table 4-42 Cluster names and sizes
4.6.2.5 Results of Cluster Interpretation
As it can be seen in Table 4-42, segments obtained by all three segmentation
approaches are likely to be very similar to corresponding transnational segments
found by means of additive intranational market segmentation.
Interpretation of clusters based on requirements of respondents towards a
product/brand, attitudes of respondents towards beauty/life, and skin conditions of
International Market Segmentation Study
195
respondents appeared to be quite clear and supported the assumption about the
similarity of segments stated above. At the same time, cluster interpretation based
on demographic characteristics, brand assessments, and behavioral characteristics
was rather vague, due to the fact that corresponding cluster description had many
obscure characteristics. This can be addressed to
- information loss occurred while creating the “world” sample;
- information loss occurred while combining demographic characteristics
and turning to more generalized assessment scales;
- dealing with a big number of brands and assessing often extremely small
percentages of affirmative answers for their awareness, likeability, usage,
and advertising recall;
- dealing with a big number of purchase locations and assessing often
extremely small percentages of affirmative answers for corresponding
choice behavior of respondents;
- national differences in demographic characteristics, brand assessments, and
behavioral characteristics.
Additionally, it was noticed that countries belonging to one and the same region
tended to be overrepresented in one and the same group of segments (see Table 4-
43). In particular, respondents from South American countries tended to be
assigned to more demanding segments, respondents from Australia and majority of
European countries (in particular, from Belgium, Germany, Switzerland, Russia,
Denmark, and Norway) – to more rational and/or less demanding segments, and
respondents from South Africa and majority of Asian countries (in particular, from
China, Indonesia, Korea, Philippines, Taiwan, and Thailand) – to more brand
attractiveness driven segments. Cluster percentages for corresponding segments in
each country normally appeared to be much lower in the case of intranational
segmentation analyses than in the case of integral market segmentation (see Table
4-44). In other words, it can be definitely stated that results of integral market
segmentation are biased by differences in regional/country-specific data entry
patterns and reflect the actual state of affairs only approximately. It also means that
the influence of regional/country-specific cultural or economic forces on formation
of segments is broken and altered.

International Market Segmentation Study
196
Table 4-43 Percentages of respondents from twenty one countries included into each transnational segment

International Market Segmentation Study
197
Table 4-44 Cluster sizes (percentages of a corresponding country sample) in the case of each
country

International Market Segmentation Study
198
4.6.2.6 Assessment of Segmentation Approaches
According to validation procedures presented in part 4.6.1.3 of the present thesis,
the quality of cluster solutions found by means of all three segmentation
approaches can be considered as rather high. Assessment of segmentation
approaches on the base of their application convenience as well as on the base of
their ability to build well-structured, meaningful and coherent cluster solutions and
to create bases appropriate for conducting meaningful and efficient international
market segmentation strategies is presented below.
4.6.2.6.1 Application Convenience
Because of the same reasons as in the case of intranational segmentation analyses,
it can be stated here that the segmentation approach based on SOM appeared to be
most effort- and time-consuming.475
It should be mentioned that convenience of the Ward’s method has reduced, due to
a very long process of forming a hierarchy of clusters executed by the SPSS
software. At the same time, the speed of SPSS procedures in the case of the K-
means method has remained the same.
4.6.2.6.2 Structure, Meaningfulness and Coherency of Cluster Solution
Analysis of cluster solutions has demonstrated that using the Ward’s method has
resulted in finding not very big, but still substantial segments; using the K-means
method has led to producing the segment with overall high requirements including
38% of all respondents and exceeding by far corresponding segments built by the
Ward’s method and SOM; and using SOM has enabled the most detailed
separation of respondents into groups and visual inspection of cluster regions.
In general, it was concluded that results of all three segmentation approaches were
quite meaningful and coherent in terms of requirements of respondents towards a
product/brand, their attitudes towards beauty/life, and their skin conditions. At the
same time, the overall impression from analysis of demographic characteristics,
brand assessments, and behavioral characteristics was rather vague in the case of
all three segmentation approaches. 475 For more details see part 4.6.1.6.1 of the present thesis.

International Market Segmentation Study
199
4.6.2.6.3 Basis for International Market Segmentation Strategies
Analogously to the assessment procedure used within the scope of additive
intranational market segmentation, the possibility of constructing meaningful
standardized marketing programs, to which the obtained segments would react in
an internally homogeneous and externally heterogeneous way, was assessed here
on the base of geographical extension of transnational segments and possible
degree of standardization of marketing mix elements.
As it can be seen in Table 4-43, all three segmentation approaches have produced
only two segments extending across twenty countries. All other segments extend
across all twenty one countries. From a purely structural point of view, all
approaches have created bases appropriate for conduction of “global” standardized
market segmentation strategies. This holds, however, only for such marketing mix
element as a product (see Table 4-45). As far as obscurities in cluster descriptions
based on demographic characteristics, brand assessments, and behavioral
characteristics were found, complications in strategy planning with regard to other
marketing mix elements (i.e., promotion, distribution, and pricing) are likely to be
expected in the case of all three segmentation approaches.
Moreover, due to the fact that results of integral market segmentation appeared to
be biased by differences in regional/country-specific data entry patterns and thus to
reflect the actual state of affairs only approximately, and because the influence of
regional/country-specific cultural or economic forces on formation of segments
was broken and altered, it can be concluded that international market segmentation
strategies constructed on the base of cluster solutions obtained in the case of all
three segmentation approaches should not be expected to be precise and efficient.

International Market Segmentation Study
200
Transnational segment Standardized product features
Highly demanding Upscale image, attractiveness, modernity, popularity, high quality, mildness, convenience
Rational demanding High quality, mildness, convenience, attractiveness
Rationalists High quality, mildness, convenience
Good quality at a fair price Good quality, convenience
Quality and good value for money from a strong brand Good quality, convenience, popularity
Brand glamor driven mainstream Attractiveness, modernity, good quality
Only brand attractiveness driven (very little skin care involved) Attractiveness, modernity, popularity
Sensitivity and mildness driven Mildness
Table 4-45 Standardized product features (integral market segmentation)
4.6.3 Contrasting Additive Intranational Market Segmentation and Integral Market Segmentation
4.6.3.1 Preparation of Data for Analysis
While conducting additive intranational market segmentation, the researcher could
work with already available representative samples. On the contrary, in the case of
integral market segmentation, the researcher had to construct the “world” sample
first. As it was already demonstrated above, this process was rather complicated.
The attempt to combine country-specific samples after making their sizes
proportional to corresponding female population sizes has failed, and the
researcher had to develop and make use of an approximate adjustment scheme
based on the four-group system.476 Moreover, as far as assessment scales for
demographic characteristics differed across the countries, new, more generalized
assessment scales had to be generated, in order to combine these descriptor
variables.477
476 For more details see part 4.6.2.1.1 of the present thesis. 477 For more details see part 4.6.2.1.3 of the present thesis.

International Market Segmentation Study
201
Of course, it is important to emphasize at this point that difficulties described
above are rather specific for this particular study. They are not likely to appear, if a
data collection process is conducted across countries in a completely uniform way,
and samples proportional to population sizes (in either exact or approximate way)
are chosen from the very beginning. These are, nevertheless, idealized conditions.
They are not typical for practice of market research because ways of data
collection usually vary from country to country, and sizes of samples are normally
not chosen on the base of proportionality to population sizes. In other words,
researchers are very likely to deal with problems analogous to the ones described
above.
Steps undertaken while preparing data for analysis in the case of both additive
intranational market segmentation and integral market segmentation are presented
in Figure 4-13.
Figure 4-13 Preparation of data for analysis
Twenty one representative samples
Twenty one representative samples
Data Ready for Analysis
Additive Intranational Market Segmentation
Adjusting sample sizes according to the four-
group system and combining them
Developing generalized
assessment scales and combining
demographics
Making sample sizes proportional to
corresponding female population sizes
Integral Market Segmentation

International Market Segmentation Study
202
4.6.3.2 Effort- and Time-Costs of Analysis
While carrying out additive intranational market segmentation, the researcher had
to deal with twenty one data samples and conduct twenty one segmentation
analyses in the case of each of the three segmentation approaches to separating
respondents into groups (based on the Ward’s method, K-means method, and
SOM). Moreover, all cluster solutions had to be examined in detail, in order to find
country-specific segments with internationally common features and combine them
into transnational segments. Of course, the whole procedure has required a
substantial amount of effort and time.
On the contrary, while carrying out integral market segmentation only one
segmentation analysis was conducted on the base of only one data sample in the
case of each of the three segmentation approaches. Transnational segments were
found straight away. Correspondingly, arduous and long-lasting process of
examining country-specific segments and combing them into transnational
segments was avoided. Of course, it is a big and indisputable advantage of this
type of international market segmentation methodology.
Steps undertaken while obtaining transnational samples in the case of both additive
intranational market segmentation and integral market segmentation are presented
in Figure 4-14.
Figure 4-14 Process of obtaining transnational samples
Segmentation analysis of the “world”
Obtaining transnational segments
Additive Intranational Market Segmentation
Ward’s method K-means method
SOM
Segmentation analyses in twenty one countries
Examining country-specific cluster solutions
and finding segments with internationally common features
Integral Market Segmentation
International Market Segmentation Study
203
4.6.3.3 Description and Interpretation of Segments
Despite the fact that interpretation of country-specific segments in the case of
additive intranational market segmentation was normally clear and meaningful,
interpretation of corresponding transnational segments appeared to be generalized
to a certain degree, due to the fact that the researcher had to abstract off details and
focus on common tendencies. Nevertheless, such generalization of interpretation
can be viewed as a controlled one. It is always possible to go back to country-
specific segments for more detailed information.
On the contrary, the vagueness478 in segment interpretation based on demographic
characteristics, brand assessments, and behavioral characteristics in the case of
integral market segmentation as well as inaccuracy in its overall results biased by
differences in regional/country-specific data entry patterns cannot be corrected.
In other words, it can be stated that segment interpretation appeared to be of higher
quality in the case of additive intranational market segmentation than in the case of
integral market segmentation.
4.6.3.4 Conduction of International Market Segmentation Strategies
As it was already demonstrated above, both additive intranational market
segmentation and integral market segmentation have led to formation of
transnational segments with a rather “global” character, which can be addressed
with meaningful standardized product policies. At the same time, standardization
of other marketing mix elements (in particular, promotion, distribution, and
pricing) is likely to be problematic. The reason for this is obviously existence of
regional/country-specific peculiarities in demographic characteristics, brand
assessments, and behavioral characteristics. They can be clearly observed and dealt
with (i.e., used as a base for differentiation of marketing programs) in the case of
478 This vagueness is likely to be present even under idealized conditions, i.e., when a data collection process is conducted across countries in a completely uniform way, and samples proportional to population sizes (in either exact or approximate way) are chosen from the very beginning, because only such reason for its existence as information loss occurred while creating the “world” sample and turning to more generalized assessment scales while combining demographic characteristics would disappear. Other reasons (in particular, dealing with a big number of brands and assessing often extremely small percentages of affirmative answers for their awareness, likeability, usage, and advertising recall; dealing with a big number of purchase locations and assessing often extremely small percentages of affirmative answers for corresponding choice behavior of respondents; national differences in demographic charachteristics, brand assessments, and behavioral characteristics) would still be present.

International Market Segmentation Study
204
additive intranational market segmentation. On the contrary, in the case of integral
market segmentation, information on demographic characteristics, brand
assessments, and behavioral characteristics is vague479, and no good base for
differentiation of marketing programs is provided.
Moreover, additive intranational market segmentation allows not only to identify
regional/country-specific peculiarities, but also to consider regional/national
segments separately and to address them with regional/national marketing
programs.
Finally, as far as results of additive intranational market segmentation are more
reliable, international market segmentation strategies planned and conducted on
their base are likely to be more precise and efficient than in the case of integral
market segmentation.
479 Again, even under idealized conditions.

Conclusions and Outlook
205
5 Conclusions and Outlook
5.1 Additive Intranational Market Segmentation vs. Integral Market Segmentation: Conclusions
The international market segmentation study presented in this doctor thesis has
demonstrated that both additive intranational market segmentation and integral
market segmentation have their advantages and limitations.
The former methodology is a quite labor-intensive process. However, it leads to
meaningful and reliable results, which allow for a high degree of flexibility,
precision, and responsiveness while planning and conducting international market
segmentation strategies.
Effort- and time-costs in the case of the latter methodology are much lower.
Nevertheless, irrevocable information losses occurring while combining country
samples,480 obscurities and inaccuracy in results limiting ability to assess the actual
state of affairs, and impossibility to identify regional/national segments decrease
the value of this methodology dramatically.
The findings of the present study support the opinion of Kale and Sudharshan
(1987) and Bauer (2000) who pointed at such disadvantages of integral market
segmentation as impossibility to provide information on regional/national
segments and to describe national peculiarities of media usage and point of
purchase choice behavior of consumers as well as estimating national sizes of
transnational segments in a biased way.481 The authors were convinced that
additive intranational market segmentation is able to overcome these difficulties.
The results of this study demonstrate that their opinion was correct.
In general, it can be concluded that conducting additive intranational market
segmentation should be preferred while identifying transnational segments.
480 Again, this argument does not hold under idealized conditions, when a data collection process is conducted in different countries in a completely uniform way, and samples proportional to population sizes (in either exact or approximate way) are chosen from the very beginning. 481 See Kale/Sudharshan, 1987, p. 63 and Bauer, 2000, p. 2808. For more detailed information see also part 1.1 of the present thesis.
Conclusions and Outlook
206
5.2 Statistical-Mathematical Segmentation Methods: Conclusions
All three segmentation approaches (based on the Ward’s method, K-means
method, and SOM) have succeeded to produce reliable partitions consisting of
homogeneous clusters differing from each other significantly. In the case of
intranational segmentation analyses, only slight distinctions between the
approaches could be noticed while examining validation results. In particular,
cluster solutions found using SOM tended to include the most homogeneous
clusters, whereas cluster solutions found using the K-means method tended to
represent the real groupings in the data in the most accurate way. In the case of
integral market segmentation, where the researcher had to deal with a big sample
including 8500 respondents, these two distinctions became more pronounced.
Nevertheless, the overall impression from obtained validation results remained
quite positive in the case of all three segmentation approaches.
More significant distinctions in the effectiveness of segmentation approaches were
found while examining their application convenience as well as ability to build
well-structured, meaningful and coherent cluster solutions and to create bases
appropriate for conducting meaningful and efficient international market
segmentation strategies. The segmentation approach based on the Ward’s method
makes good showings on all these criteria. Its only disadvantage is a very low
speed of forming a hierarchy of clusters in the case of integral market
segmentation. The segmentation approach based on the K-means method is also
quite convenient in use, but it tends to produce cluster solutions with a worse
structure, many obscurities, and clusters often extending across only several
countries or not crossing national borders at all. Nevertheless, these disadvantages
seem to be alleviated in the case of integral market segmentation, or, in other
words, with the increase in a sample size. The segmentation approach based on
SOM is the absolute leader among the three approaches in building high-quality
cluster solutions in terms of criteria described above. Still, its obvious week point
is a rather complicated analysis procedure.

Conclusions and Outlook
207
In general, it can be concluded that
- the segmentation approach based on the Ward’s method is a good classical
segmentation procedure;
- the segmentation approach based on the K-means method produces quite
poor results, which, however, can be improved, if a quite big sample is used;
- the segmentation approach based on SOM provides an innovative researcher
with a big number of new opportunities in the field of international market
segmentation, but also with challenges inherent in dealing with a
complicated method.
5.3 Recommendations for Future Research
The doctoral research presented in this thesis is aimed at overcoming research
deficits and providing both academicians and practitioners with valuable insights
into the topic of international market segmentation. Nevertheless, further
investigations in this highly important and complicated area are desirable. In
particular, the following issues could be of interest:
• with regard to international market segmentation in general and such
its forms as additive intranational market segmentation and integral
market segmentation:
ο segmenting other than skin and body care markets,
ο conducting analysis on the base of data samples controlled for being
proportional to corresponding population sizes and collected across
countries in a completely uniform way;
• with regard to statistical-mathematical segmentation methods:
ο combining statistical-mathematical segmentation methods used in
the present thesis with each other (for instance, finding initial
cluster centroids used in the K-means method with the help of the
Ward’s method or SOM) and assessing efficiency of segmentation
approaches based on such combinations,
ο improving and facilitating the analysis procedure of the
segmentation approach based on SOM,
ο experimenting with other segmentation approaches (for instance,
with the approach based on mixture models).

References
208
References
Books and Journals
Aldenderfer, M.S./Blashfield, R.K. (1985), Cluster Analysis, Sage
Publications, Beverly Hills.
Althans, J. (1989), “Marktsegmentierung als Aufgabe des internationalen
Marketing”, in: Macharzina, K./Welge, M.K. (Hrsg.), Handwörterbuch
Export und internationale Unternehmung, Poeschel Verlag, Stuttgart, pp.
1469-1477.
Anderberg, M.R. (1973), Cluster Analysis for Applications, Academic Press,
New York.
Askegaard, S./Madsen, T.K. (1998), “The Local and the Global: Exploring
Traits of Homogeneity and Heterogeneity in European Food Cultures”,
International Business Review, Vol. 7, No. 6, pp. 549-568.
Bacher, J. (1996), Clusteranalyse: Anwendungsorientierte Einführung, 2. Aufl.,
Oldenbourg Verlag, München.
Backhaus, K./Büschken, J./Voeth, M. (2005), International Marketing,
Palgrave Macmillan, Basingstoke.
Backhaus, K./Erichson, B./ Plinke, W./ Weiber, R. (2003), Multivariate
Analysemethoden: eine anwendungsorientierte Einführung, 10. Aufl.,
Springer-Verlag, Berlin.
Basilevsky, A. (1994), Statistical Factor Analysis and Related Methods:
Theory and Applications, John Wiley & Sons, New York.
Bauer, E. (1976), Markt-Segmentierung als Marketing-Strategie, Duncker &
Humblot, Berlin.
Bauer, E. (2000), “Market Segmentation in International Marketing”, in:
Dahiya, S.B. (Ed.), The Current State of Business Disciplines, Volume Six:
Marketing, Spellbound Publications, Rohtak, pp. 2795-2814.
Bauer, E. (2002), Internationale Marketingforschung, 3. Aufl., Oldenbourg
Wissenschaftsverlag, München.
Bauer, E./Liu, Y. (2006), Segmenting the Chinese Consumer Goods Market: A
Hybrid Approach, IWIM, Bremen.

References
209
Becker, J. (2001), Marketing-Konzeption: Grundlagen des ziel-strategischen
und operativen Marketing-Managements, 7. Aufl., Verlag Franz Vahlen,
München.
Beiersdorf-Aktiengesellschaft (Hrsg.) (1982), 100 Jahre Beiersdorf: 1882-
1982, Published by Beiersdorf AG, Hamburg.
Beiersdorf-Aktiengesellschaft (Hrsg.) (1982), “100 Jahre Beiersdorf”, in:
Beiersdorf-Aktiengesellschaft (Hrsg.) (1982), BDF International, Published
by Beiersdorf AG, Hamburg, p. 4.
Beiersdorf-Aktiengesellschaft (Hrsg.) (1999), Das Unternehmen Beiersdorf,
Published by Beiersdorf AG, Hamburg.
Berekoven, L. (1985), Internationales Marketing, 2. Aufl., Verlag Neue
Wirtschafts-Briefe, Herne.
Berndt, R./Fantapié Altobelli, C./Sander, M. (2005), Internationales Marketing-
Management, 3. Aufl., Springer-Verlag, Berlin.
Bieler, K. (1994), Vergleich von Multilayer Perzeptron, Kohonen Maps und
Hidden Markov Modellen für die Fehlerdiagnose in Elektrischen
Energieübertragungssystemen, Eidgenössische Technische Hochschule,
Zürich.
Bijnen, E.J. (1973), Cluster Analysis: Survey and Evaluation of Techniques,
University Press, Tilburg.
Bock, H.H. (1974), Automatische Klassifikation: theoretische und praktische
Methoden zur Gruppierung und Strukturierung von Daten (Cluster -
Analyse), Vandenhoeck & Ruprecht, Göttingen.
Bock, T. (2004), “A New Approach for Exploring Multivariate Data: Self-
Organizing Maps”, International Journal of Market Research, Vol. 2, pp.
189-203.
Böcker, F./Helm, R. (2003), Marketing, 7. Aufl., Lucius & Lucius, Stuttgart.
Böhler, H. (1977), Methoden und Modelle der Marktsegmentierung, Poeschel
Verlag, Stuttgart.
Bolz, J. (1992), Wettbewerbsorientierte Standardisierung der internationalen
Marktbearbeitung: eine empirische Analyse in europäischen
Schlüsselmärkten, Wissenschaftliche Buchgeselschaft, Darmstadt.
Boote, A.S. (1983), “Psychographic Segmentation in Europe”, Journal of
Advertising Research, Vol. 22, No. 6, pp. 19-25.

References
210
Brosius F. (2002), SPSS 11, Mitp-Verlag, Bonn.
Cateora, P.R./Graham, J.L. (2005), International Marketing, 12th ed., McGraw-
Hill/Irwin, Boston.
Cooley, W.W./Lohnes, P.R. (1971), Multivariate Data Analysis, John Wiley &
Sons, New York.
Craig, C.S./Douglas, S.P. (2005), International Marketing Research, 3d ed.,
John Wiley & Sons, Chichester.
Crawford, J.C./Garland, B.C./Ganesh, G. (1988), “Identifying the Global Pro-
Trade Consumer”, International Marketing Review, Vol. 5, No. 4, pp. 25-
33.
Curry, B. / Davies, F. / Evans, M. / Moutinho, L. / Phillips, P. (2003), “The
Kohonen Self-Organizing Map As an Alternative to Cluster Analysis: An
Application to Direct Marketing”, International Journal of Market
Research, Vol. 2, pp. 191-211.
Dawar, N./Parker, P. (1994), “Marketing Universals: Consumers’ Use of Brand
Name, Price, Physical Appearance, and Retailer Reputation as Signals of
Product Quality”, Journal of Marketing, Vol. 58, April, pp. 81-95.
Day, E./Fox, R.J./Huszagh, S.M. (1988), “Segmenting the Global Market for
Industrial Goods: Issues and Implications”, International Marketing
Review, Vol. 5, No. 3, pp. 14-27.
de Bodt, E./Cottrell, M./Verleysen, M. (2002), “Statistical Tools to Assess the
Reliability of Self-Organizing Maps”, Neural Networks, Vol. 15, pp. 967-
978.
Deichsel, G./Trampisch, H.J. (1985), Clusteranalyse und Diskriminanzanalyse,
Gustav Fischer Verlag, Stuttgart.
Der Fischer Weltalmanach 2004, Fischer Taschenbuch Verlag, Frankfurt am
Main.
Domzal, T./Unger, L. (1987), “Emerging Positioning Strategies in Global
Marketing”, Journal of Consumer Marketing, Vol. 4, No.4, pp. 23-40.
Douglas, S.P./Craig, C.S. (1982), “Information for International Marketing
Decisions”, in: Walter, I./Murray, T. (Eds.), Handbook of International
Business, John Wiley & Sons, New York, pp. 29.1-29.33.
Douglas, S.P./Craig, C.S. (1995), Global Marketing Strategy, McGraw-Hill,
New York.

References
211
Douglas, S.P./Craig, C.S. (1997), “The changing dynamic of consumer
behavior: implications for cross-cultural research”, International Journal of
Research in Marketing, Vol. 14, pp. 379-395.
Douglas, S.P./Urban, C.D. (1977), “Life-Style Analysis to Profile Women in
International Markets”, Journal of Marketing, Vol. 41, July, pp. 46-54.
Dülfer, E. (2001), Internationales Management in unterschiedlichen
Kulturbereichen, 6 Aufl., Oldenbourg Wissenschaftsverlag, München.
Duran, B.S./Odell, P.L. (1939), Cluster Analysis: A Survey, Springer-Verlag,
Berlin.
Eckes, T. (1980), Clusteranalysen, Verlag W. Kohlhammer, Stuttgart.
Engel, J.F./Fiorillo, H.F./Cayley, M.A. (1972), Market Segmentation: Concepts
and Applications, Holt, Rinehart and Winston, New York.
Everitt, B. (1974): Cluster Analysis, Heinemann Educational Books, London.
Everitt, B. (1993), Cluster Analysis, 3d ed., Edward Arnold, London.
Everitt, B. (2001), Applied Multivariate Data Analysis, 2nd ed., Edward
Arnold, London.
Eimert, E. (1997), Beobachten und Klassifizieren von sportlichen Bewegungen
mit neuronalen Netzen, Eberhard-Karls-Universität, Tübingen.
Elsen, I. (2000), Ansichtenbasierte 3D-Objekterkennung mit erweiterten
Selbstorganisierenden Merkmalskarten, VDI Verlag, Düsseldorf.
Fanghänel, K. (2001), HF-Signalklassifikation mit Selbst-Organisierenden
Karten, Verlag im Internet, Berlin.
Frank, R.E./Massy, W.F./Wind, Y. (1972), Market Segmentation, Prentice-
Hall, Englewood Cliffs.
Freter, H. (1983), Marktsegmentierung, Verlag W. Kohlhammer, Stuttgart.
Gordon, A.D. (1981), Classification: Methods for the Exploratory Analysis of
Multivariate Data, Chapman and Hall, London.
Gorsuch, R.L. (1974), Factor Analysis, Saunders, Philadelphia.
Green, P.E. (1977), “A New Approach to Market Segmentation”, Business
Horizons, Vol. 20, February, pp. 61-73.
Green, P.E./Tull, D.S./Albaum, G. (1988), Research for Marketing Decisions,
5th ed., Prentice-Hall, Englewood Cliffs.
References
212
Green, R.T./White, P.D. (1976), “Methodological Considerations in Cross-
National Consumer Research”, Journal of International Business Studies,
Vol. 7, No. 2, pp. 81-87.
Hammann, P./Erichson, B. (2000), Marktforschung, 4. Aufl., Lucius & Lucius,
Stuttgart.
Hansen, C. (2001), NIVEA: Evolution of a World-Famous Brand, Published by
Beiersdorf AG, Hamburg.
Hassan, S.S./Katsanis, L.P. (1991), “Identification of Global Consumer
Segments: A Behavioral Framework”, Journal of International Consumer
Marketing, Vol. 3, No. 2, pp. 11-28.
Hassoun, M. (1995), Fundamentals of Artificial Neural Networks,
Massachusetts Institute of Technology Press, Cambridge.
Heenan, D.A./Perlmutter, H.V. (1979), Multinational Organization
Development, Addison-Wesley publishing Company, Reading.
Heikkonen, J. (1994), Subsymbolic Representations, Self-Organizing Maps,
and Object Motion Learning, University of Technology, Lappeenranta.
Helsen, K./Jedidi, K./DeSarbo, W.S. (1993), “A New Approach to Country
Segmentation Utilizing Multinational Diffusion Patterns”, Journal of
Marketing, Vol. 57, October, pp. 60-71.
Hermanns, A./Wißmeier, U.K. (1993), “Bekleidung und Mode: Einstellungen
und Verhalten im internationalen Vergleich”, Marketing ZFP, Vol, 15, No.
1, pp. 26-33.
Hinton, P.R./Brownlow, C./McMurray, I./Cozens, B. (2004): SPSS Explained,
Routledge, London.
Holm, K. (1976), Die Faktorenanalyse, Francke Verlag, München.
Hünerberg, R. (1994), Internationales Marketing, Verlag Moderne Industrie,
Landsberg/Lech.
Huszagh, S.M./Fox, R.J./Day, E. (1986), “Global Marketing: An Empirical
Investigation”, Columbia Journal of World Business, Vol. 20, No. 4, pp.
31-43.
International NIVEA Brand Monitor Presentations 2003-2004: SouthAfrica/
China/ Hong Kong/ Indonesia/ Korea/ Philippines/ Taiwan/ Thailand/
Australia/ Belgium/ Germany/ Italy/ Netherlands/ Spain/ Switzerland/

References
213
Russia/ Denmark/ Norway/ Argentina/ Paraguay/ Venezuela, Beiersdorf
AG, Unpublished.
Jain, S.C. (1989), “Standardization of International Marketing Strategy: Some
Research Hypotheses”, Journal of Marketing, Vol. 53, January, pp. 70-79.
Jambu, M./Lebeaux, M-O. (1983), Cluster Analysis and Data Analysis, North-
Holland Publishing Company, Amsterdam.
Jockusch, S. (1995), Modellierung und Manipulation von Bild- und
Grafikdaten mit neuronalen Netzen, Infix, Sankt Augustin.
Kaiser, A. (1977), Die Identifikation von Marktsegmenten, Duncker &
Humblot, Berlin.
Kale, S.H. (1995), “Grouping Euroconsumers: A Culture-Based Clustering
Approach”, Journal of International Marketing, Vol. 3, No. 3, pp. 35-48.
Kale, S.H./Sudharshan, D. (1987), “A Strategic Approach to International
Segmentation”, International Marketing Review, Vol. 4, No. 2, pp. 60-70.
Kaufman, L./.Rousseeuw, P.J. (1990), Finding Groups in Data: An
Introduction to Cluster Analysis, John Wiley & Sons, New York.
Keegan, W.J. (1980), Multinational Marketing Management, 2nd ed., Prentice
Hall, Englewood Cliffs.
Keegan, W.J. (2002), Global Marketing Management, 7th ed., Prentice Hall,
Upper Saddle River.
Keegan, W.J./Schlegelmilch, B.B./Stöttinger, B. (2002), Globales Marketing-
Management: eine europäische Perspective, Oldenbourg
Wissenschaftsverlag, München.
Keysberg, G. (1989), Die Anwendung der Diskriminanzanalyse zur
statistischen Kreditwürdigkeitsprüfung im Konsumentenkreditgeselschaft,
Müller BotermannVerlag, Köln.
Kim, J-O./Mueller, C.W. (1978), Factor Analysis: Statistical Methods and
Practical Issues, Sage Publications, Beverly Hills.
Klecka, W.R. (1982), Discriminant Analysis, Sage Publications, Beverly Hills.
Köhler, R./Hüttemann, H. (1989), “Marktauswahl im internationalen
Marketing”, in: Macharzina, K./Welge, M.K. (Hrsg.), Handwörterbuch
Export und internationale Unternehmung, Poeschel Verlag, Stuttgart, pp.
1428-1440.

References
214
Kohonen, T. (1989), Self-Organization and Associative Memory, 3d ed.,
Springer-Verlag, Berlin.
Kohonen, T. (2001), Self-Organizing Maps, 3d ed., Springer-Verlag, Berlin.
Kotabe, M./Helsen, K. (1998), Global Marketing Management, John Wiley &
Sons, New York.
Kramer, S. (1991), Europäische Life-Style-Analysen zur Verhaltensprognose
von Konsumenten, Verlag Dr. Kovac, Hamburg.
Krapp, N./Grieb, A./Voss, K. (August 2003): Research Proposal for
International NIVEA Brand Monitor in South Africa, Beiersdorf AG,
Unpublished.
Kreutzer, R. (1989), Global-Marketing – Konzeption eines Länderüber-
greifenden Marketing, Deutscher Universitäts-Verlag, Wiesbaden.
Kreutzer, R. (1991), “Länderübergreifende Segmentierungskonzepte – Antwort
auf die Globalisierung der Märkte”, Jahrbuch der Absatz- und
Verbrauchsforschung, Vol. 37, No. 1, pp. 4-27.
Kropp, J. (1999), Neuronale Netze und qualitative Wissensbasen in der
integrativen Umweltsystemanalyse, Verlag im Internet, Berlin.
Kulhavy, E. (1993) Internationales Marketing, 5th ed., Rudolf Trauner Verlag,
Linz.
Kumar, V./Ganesh, J./Echambadi, R. (1998), “Cross-National Diffusion
Research: What Do We Know and How Certain Are We?”, Journal of
Product Innovation Management, Vol. 15, No. 3, pp. 255-268.
Kumar, V./Stam, A./Joachimsthaler, E.A. (1994), “An Interactive Multicriteria
Approach to Identifying Potential Foreign Markets”, Journal of
International Marketing, Vol. 2, No. 1, pp. 29-52.
Kutschker, M./Schmid, S. (2005), Internationales Management, 4. Aufl.,
Oldenbourg Wissenschaftsverlag, München.
Lampinen, J. (1992), Neural Pattern Recognition: Distortion Tolerance by Self-
Organizing Maps, University of Technology, Lappeenranta.
Lauwerth, W. (1980), Zum Kommunalitätenproblem in der Faktorenanalyse,
Verlag Anton Hain, Königstein.
Lee, C. (1990), “Determinants of National Innovativeness and International
Market Segmentation”, International Marketing Review, Vol. 7, No. 5, pp.
39-49.

References
215
Liander, B./Terpstra, V./Yoshino, M.Y./Sherbini, A.A. (1967), Comparative
Analysis for International Marketing, Allyn and Bacon, Boston.
Lingenfelder, M. (1996), Die Internationalisierung im europäischen
Einzelhandel: Ursachen, Formen und Wirkungen im Lichte einer
theoretischen Analyse und empirischen Bestandsaufnahme, Duncker &
Humblot, Berlin.
Liu, Y. (2005), Options for Implementing A Strategy of Market Segmentation
in Chinese Consumer Goods Markets, Logos Berlin, Berlin.
Lorr, M. (1983), Cluster Analysis for Social Scientists, Jossey-Bass, San-
Francisco.
Matiaske, W. (1994), Hierarchical Cluster Analysis with P-STAT,
Diskussionspapier, 5, Technische Universität, Berlin.
Martinetz, T. (1992), Selbstorganisierende neuronale Netzwerkmodelle zur
Bewegungssteuerung, Infix, Sankt Augustin.
McDonald, M./Dunbar, I. (1995), Market Segmentation: A Step-by-Step
Approach to Creating Profiatble Market Segments, Macmillan Press,
Basingstoke.
Meffert, H. (1977), “Marktsegmentierung und Marktwahl im internationalen
Marketing”, Die Betriebswirtschaft, Vol. 37, No.3, pp. 433-446.
Meffert, H. (1988), Strategische Unternehemensführung und Marketing:
Beiträge zur marktorientierten Unternehmenspolitik, Gabler Verlag,
Wiesbaden.
Meffert, H. (1994), Marketing-Management: Analyse, Strategie,
Implementierung, Gabler Verlag, Wiesbaden.
Meffert, H. (2000), Marketing: Grundlagen marktorientierter
Unternehmensführung, 9. Aufl., Gabler Verlag, Wiesbaden.
Meffert, H./Althans, J, (1982), Internationales Marketing, Verlag W.
Kohlhammer, Stuttgart.
Meffert, H./Bolz, J. (1998), Internationales Marketing-Management, 3. Aufl.,
Verlag W. Kohlhammer, Stuttgart.
Mennicken, C. (2000), Interkulturelles Marketing: Wirkungszusammenhänge
zwischen Kultur, Konsumverhalten und Marketing, Deutscher Universitäts-
Verlag, Wiesbaden.

References
216
Morrison, D.G. (1971), “On the Interpretation of Discriminant Analysis”, in:
Aaker, D.A. (Ed.), Multivariate Analysis in Marketing: Theory and
Applications, Wadsworth Publishing Co., Belmont, pp. 127-142.
Moskowitz, H.R./Rabino, S. (1994), “Sensory Segmentation: An Organizing
Principle for International Product Concept Generation”, Journal of Global
Marketing, Vol. 8, No.1, pp. 73-93.
Müller, L. (1977), Auswertungsmethoden zur Clusteranalyse, Universität,
Hamburg.
Müller, S./Gelbrich, K. (2004), Interkulturelles Marketing, Verlag Franz
Vahlen, München.
Müller, S./Kornmeier, M. (2002), Strategisches internationales Management,
Verlag Franz Vahlen, München.
Neidell, L.A. (1983), Strategic Marketing Management: An Integrated
Approach, Macmillan Publishing Company, New York.
NIVEA Brand Philosophy 2003, Biersdorf AG, Unpublished.
Obermayer, K. (1993), Adaptive neuronale Netze und ihre Anwendung als
Modelle der Entwicklung kortikaler Karten, Infix, Sankt Augustin.
Palmer, A. (2004), Introduction to Marketing: Theory and Practice, Oxford
University Press, Oxford.
Perlmutter, H.V. (1969), “The Tortuous Evolution of the Multinational
Corporation”, Columbia Journal of World Business, Vol. 4, No. 1, pp. 9-
18.
Pinnekamp, H.-J./Siegmann, F. (2001), Deskriptive Statistik: mit einer
Einführung in das Programm SPSS, Oldenbourg Wissenschaftsverlag,
München.
Polani, D. (1996), Adaption der Topologie von Kohonen-Karten durch
Genetische Algorithmen, Infix, Sankt Augustin.
Porrmann, M. (2002), Leistungsbewertung eingebetteter
Neurocomputersysteme, Heinz Nixdorf Institut, Paderborn.
Pytlik, M. (1995), Diskriminanzanalyse und künstliche neuronale Netze zur
Klassifizierung von Jahresabschlüssen: ein empirischer Vergleich, Peter
Lang, Frankfurt am Main.
Quittek, J. (1997), Prozessorzuteilung in Parallelrechnern mit Hilfe
selbstorganisierender Karten, Shaker Verlag, Aachen.

References
217
Retzko, R. (1996), Flexible Tourenplanung mit selbstorganisierenden
neuronalen Netzen, Unitext-Verlag, Göttingen.
Ritter, H. (1988), Selbstorganisierende neuronale Karten, Technische
Universität, München.
Ronen, S./Kraut, A.I. (1977), “Similarities Among Countries Based on
Employee Work Values and Attitudes”, Columbia Journal of World
Business, Vol. 12, No. 2, pp. 89-96.
Rüping, S. (1995), VLSI-gerechte Umsetzung von selbstorganisierenden
Karten und ihre Einbindung in ein Neuro-Fuzzy Analysesystem, VDI
Verlag, Düsseldorf.
Rushmeier, H. / Lawrence, R. / Almasi, G. (1997), Case Study: Visualizing
Customer Segmentations Produced by Self-Organizing Maps, IBM Watson
Research Center, Yorktown Heights.
Sadeghi, A.A. (1996), Asymptotic Behaviour of Self-Organizing Maps with
Non-Uniform Stimuli Distribution, Universität, Kaiserslautern.
Scherer, A. (1997), Neuronale Netze: Grundlagen und Anwendungen, Friedr.
Vieweg & Sohn, Braunschweig.
Schwanenberg, S. (2001), Neuronale Netze als Segmentierungsverfahren für
die Marktforschung: ein Vergleich mit traditionellen
Segmentierungsansätzen auf der Basis von Daten aus Monte-Carlo-
Simulationen, Josef Eul Verlag, Lohmar.
Schweizer, M. (1995), Wissensanalyse und -erhebung mit Kohonen-Netzen am
praktischen Beispiel der Lawinenprognose, Universität, Zürich.
Segler, K. (1986), Basisstrategien im internationalen Marketing, Campus
Verlag, Frankfurt am Main.
Seiffert, U. (1998), Wachsende mehrdimensionale Selbstorganisierende Karten
zur Analyse bewegter Szenen, Otto-von-Guericke-Universität, Magdeburg.
Sethi, S.P. (1971), “Comparative Cluster Analysis for World Markets”, Journal
of Marketing Research, Vol. 8, August, pp. 348-354.
Sheth, J. (1986), “Global Markets or Global Competition?”, Journal of
Consumer Marketing, Vol. 3, No. 2, pp. 9-11.
Skin Care Questionnaires 2003-2004: SouthAfrica/ China/ Hong Kong/
Indonesia/ Korea/ Philippines/ Taiwan/ Thailand/ Australia/ Belgium/
References
218
Germany/ Italy/ Netherlands/ Spain/ Switzerland/ Russia/ Denmark/
Norway/ Argentina/ Paraguay/ Venezuela, Beiersdorf AG, Unpublished.
Smith, W.R. (1956), “Product Differentiation and Market Segmentation as
Alternative Marketing Strategies”, Journal of Marketing, Vol. 21, July, pp.
3-8.
Speckmann, H. (1995), Analyse mit fraktalen Dimensionen und
Parallelisierung von Kohonen’s selbstorganisierender Karte, Eberhard-
Karls-Universität, Tübingen.
Steenkamp, J.-B.E.M. (2001), “The Role of National Culture in International
Marketing Research”, International Marketing Review, Vol. 18, No. 1, pp.
30-44.
Steenkamp, J.-B.E.M./Ter Hofstede, F. (2002), “International Market
Segmentation: Issues and Perspectives”, International Journal of Research
in Marketing, Vol. 19, pp. 185-213.
Steffenhagen, H. (1992), “Marktforschung im Spannungsfeld
länderübergreifender Standardisierung und Differenzierung”, in: Breunig,
G. (Hrsg.), Internationalisierung versus Regionalisierung: Grundsätzliches,
Länderspezifisches, Methodisches, Vorträge zur Markt- und
Sozialforschung, BVM-Schriftenreihe, Band 21, Offenbach, pp. 21-34.
Stegmüller, B. (1995), Internationale Marktsegmentierung als Grundlage für
internationale Marketing-Konzeptionen, Josef Eul Verlag, Bergisch
Gladbach.
Steinhausen, D./Langer, K. (1977), Clusteranalyse: Einführung in Methoden
und Verfahren der automatischen Klassifikation, Walter de Gruyter & Co.,
Berlin.
Struhl, S.M. (1992), Market Segmentation: An Introduction and Review,
Publisched by American Marketing Association, Chicago.
Tatsuoka, M.M. (1988), Multivariate analysis, Macmillan Publishing
Company, New York.
Ter Hofstede, F./Steenkamp, J.-B.E.M./Wedel, M. (1999), “International
Market Segmentation Based on Consumer-Product Relations”, Journal of
Marketing Research, Vol. 36, February, pp. 1-17.

References
219
Ter Hofstede, F./Wedel, M./Steenkamp, J.-B.E.M. (2002), “Identifying Spatial
Segments in International Markets”, Marketing Science, Vol. 21, No. 2,
pp.160-177.
Terpstra, V./Sarathy, R. (1991), International Marketing, 5th ed., Dryden Press,
Chicago.
Thorelli, H.B. (1980), “The Information Seekers: Multinational Strategy
Target“, in: Thorelli, H.B./Becker, H. (Eds.), International Marketing
Strategy, Pergamon Press, New York, pp. 133-142.
Tryba, V. (1992), Selbstorganisierende Karten: Theorie, Anwendung und
VLSI-Implementierung, VDI Verlag, Düsseldorf.
Tücke, M. (1976), “Tachometrische Methoden unter besonderer
Berücksichtigung des WARDschen Algorithmus”, in: Rollet, B./Bartram,
M. (Hrsg.), Einführung in die hierarchische Clusteranalyse: für
Psychologen, Pädagogen und Soziologen, Ernst Klett Verlag, Stuttgart, pp.
19-36.
Überla, K. (1977), Faktorenanalyse, 2. Aufl., Springer-Verlag, Berlin.
Verlagsgruppe Milchstrasse (Hrsg.) (1998), Märkte und Marken, Fallstudie
NIVEA, Verlagsgruppe Milchstrasse, Hamburg.
Voelkl, K.E./Gerber, S.B. (1999), Using SPSS for Windows: Data Analysis
and Graphics, Springer-Verlag, New York.
Weber, E. (1974), Einführung in die Faktorenanalyse, Gustav Fischer Verlag,
Jena.
Wedel, M. / Kamakura, W. (2000), Market Segmentation: Conceptual and
Methodological Foundations, 2nd ed., Kluwer Academic Publishers,
Boston.
Wiedenbeck, M./Züll, C. (2001), Klassifikation mit Clusteranalyse:
Grundlegende Techniken hierarchischer und K-means-Verfahren, ZUMA,
How-to-Reihe, Nr. 10.
Wind, Y. (1978), “Issues and Advances in Segmentation Research”, Journal of
Marketing Research, Vol. 15, August, pp. 317-337.
Wind, Y./Douglas, S.P. (1972), “International Market Segmentation”,
European Journal of Marketing, Vol. 6, No. 1, pp. 17-25.
References
220
Wind, Y./Douglas, S.P./Perlmutter, H.V. (1973), “Guidlines for Developing
International Marketing Strategies”, Journal of Marketing, Vol. 37, April,
pp. 14-23.
Wyss, W. (1991), Marktforschung von A-Z, Verlag DemoSCOPE,
Adligenswil.
Yavas, U./Verhage, B.J./Green, R.T. (1992), “Global Consumer Segmentation
Versus Local Market Orientation: Empirical Findings”, Management
International Review, Vol. 32, No. 3, pp. 265-272.
Zentes, J./Swoboda, B./Morschett, D. (2004), Internationales Wertschöpfungs-
management, Verlag Franz Vahlen, München.
Internet Sources
www.beiersdorf.com (the official site of Beiersdorf company), visited in the
period from 01.02.2006 to 05.02.2006.
www.cia.gov/cia/publications/factbook/ (CIA – The World Factbook; country
information established in July 2004) visited on 24.01.2005.
http://koti.mbnet.fi/~phodju/nenet/Nenet/General.html (the official site of
NENET Software), visited on 15.12.2005.
www.nivea.co.uk (the official site of NIVEA in the United Kingdom), visited
in the period from 01.02.2006 to 05.02.2006.

Appendix A-1: Statement Compositions of Factors
221
Appendix A-1: Statement Compositions of Factors Note:
high factor loadings (≥ 0.5) are highlighted with yellow in all tables included into
this appendix.
South Africa
Factors
Requirements towards a product/brand Quality Brand
glamor
Sensitivity and
mildness It is a trustworthy brand 0.813 0.017 -0.033 Products fulfill current expectations towards skin care 0.770 0.057 0.041 Products are of high quality 0.683 0.142 0.163 Products offer good value for money 0.631 -0.029 0.126 Products contain highly effective ingredients 0.521 0.195 0.332 It is a modern brand -0.038 0.719 0.187 This brand is highly advertised -0.147 0.685 0.315 Products perform better than those of other brands 0.263 0.659 0.034 This brand is for demanding women who give importance to their appearance 0.118 0.650 0.067
Products are suitable for sensitive skin 0.124 0.047 0.783 This brand offers mild skin care products 0.008 0.251 0.670 Products rely on the latest scientific findings 0.072 0.373 0.607 Products are highly appropriate for skin 0.464 -0.107 0.559 Products have a pleasant fragrance 0.270 0.248 0.371
China
Factors
Requirements towards a product/brand Quality Brand
glamor
Sensitivity and
mildness Products are of higher quality 0.824 0.013 0.174 It is a trustworthy brand 0.797 0.161 0.103 Products offer good value for money 0.765 0.035 0.079 Products fulfill current expectations towards skin care 0.691 0.122 0.189 Products perform better than those of other brands 0.560 0.167 0.351 It is a modern brand 0.108 0.841 0.057 This brand is highly advertised -0.018 0.758 0.068 This brand is for demanding women who give importance to their appearance 0.131 0.688 0.102
Products rely on the latest scientific findings 0.182 0.657 0.193 Products have a pleasant fragrance 0.048 0.621 0.234 Products are suitable for sensitive skin -0.063 0.309 0.688 Products are highly appropriate for skin 0.302 0.013 0.632 This brand offers mild skin care products 0.257 0.310 0.623 Products contain highly effective ingredients 0.228 0.065 0.615

Appendix A-1: Statement Compositions of Factors
222
Hong Kong
Factors
Requirements towards a product/brand Quality Brand
glamor
Sensitivity and
mildness Products fulfill current expectations towards skin care 0.814 0.038 0.046 It is a trustworthy brand 0.770 -0.050 0.179 Products are of higher quality 0.764 -0.016 0.109 Products contain highly effective ingredients 0.738 0.068 0.173 Products offer good value for money 0.718 0.013 -0.036 Products perform better than those of other brands 0.697 0.146 0.188 Products are highly appropriate for skin 0.611 -0.015 0.411 It is a modern brand -0.041 0.825 0.137 This brand is highly advertised -0.100 0.745 0.139 This brand is for demanding women who give importance to their appearance 0.142 0.664 0.236
Products have a pleasant fragrance 0.135 0.656 -0.276 Products rely on the latest scientific findings 0.038 0.538 0.583 Products are suitable for sensitive skin 0.153 0.088 0.776 This brand offers mild skin care products 0.363 0.103 0.627
Indonesia
Factors
Requirements towards a product/brand Quality
Sensitivity and
mildness
Brand glamor
Products fulfill current expectations towards skin care 0.727 0.156 0.046 Products perform better than those of other brands 0.707 0.133 0.193 It is a trustworthy brand 0.642 0.317 -0.038 Products are of higher quality 0.638 0.202 0.158 Products contain highly effective ingredients 0.601 0.132 0.207 Products offer good value for money 0.589 0.096 0.159 Products are suitable for sensitive skin 0.102 0.730 -0.007 Products are highly appropriate for skin 0.313 0.668 -0.113 This brand offers mild skin care products 0.360 0.591 0.005 Products rely on the latest scientific findings 0.032 0.586 0.407 This brand is highly advertised 0.157 -0.061 0.811 It is a modern brand 0.127 0.103 0.808 This brand is for demanding women who give importance to their appearance 0.173 0.106 0.653
Products have a pleasant fragrance 0.179 0.462 0.239

Appendix A-1: Statement Compositions of Factors
223
Korea
Factors
Requirements towards a product/brand Quality
Sensitivity and
mildness
Brand glamor
Products offer good value for money 0.704 0.231 -0.011 Products are of higher quality 0.687 0.177 -0.101 It is a trustworthy brand 0.642 0.132 0.299 Products perform better than those of other brands 0.617 0.307 0.189 Products fulfill current expectations towards skin care 0.534 0.199 0.444 Products are suitable for sensitive skin 0.102 0.771 0.105 This brand offers mild skin care products 0.292 0.627 0.133 Products are highly appropriate for skin 0.312 0.623 -0.014 Products rely on the latest scientific findings 0.314 0.614 0.150 Products have a pleasant fragrance 0.042 0.567 0.361 It is a modern brand 0.054 0.017 0.830 This brand is highly advertised -0.081 0.127 0.823 This brand is for demanding women who give importance to their appearance 0.216 0.159 0.616
Products contain highly effective ingredients 0.436 0.464 -0.077
Philippines
Factors
Requirements towards a product/brand Sensitivity, mildness,
and effectiveness
Quality Brand popularity
Products are highly appropriate for skin 0.743 0.084 0.086 This brand is for demanding women who give importance to their appearance 0.701 0.016 0.129
Products are suitable for sensitive skin 0.690 0.174 -0.090 Products rely on the latest scientific findings 0.635 0.128 0.296 This brand offers mild skin care products 0.552 0.286 0.088 It is a trustworthy brand 0.133 0.767 0.126 Products are of higher quality 0.141 0.717 -0.051 Products offer good value for money -0.061 0.662 0.258 Products fulfill current expectations towards skin care 0.411 0.640 0.023
This brand is highly advertised 0.022 0.065 0.875 It is a modern brand 0.143 0.155 0.813 Products have a pleasant fragrance 0.446 0.011 0.433 Products perform better than those of other brands 0.369 0.312 0.399 Products contain highly effective ingredients 0.436 0.411 0.158

Appendix A-1: Statement Compositions of Factors
224
Taiwan
Factors
Requirements towards a product/brand Quality
Mildness, sensitivity,
and effectiveness
Brand glamor
Products contain highly effective ingredients 0.817 0.054 0.224 Products are highly appropriate for skin 0.765 0.150 -0.020 Products perform better than those of other brands 0.753 0.336 0.068 Products offer good value for money 0.734 0.394 0.161 Products are of higher quality 0.659 0.353 0.138 This brand offers mild skin care products 0.303 0.725 0.002 Products are suitable for sensitive skin 0.057 0.700 0.216 Products fulfill current expectations towards skin care 0.453 0.636 -0.140
It is a trustworthy brand 0.399 0.591 -0.062 Products rely on the latest scientific findings 0.371 0.517 0.224 This brand is highly advertised 0.010 0.019 0.831 It is a modern brand -0.007 0.392 0.733 Products have a pleasant fragrance 0.174 -0.262 0.590 This brand is for demanding women who give importance to their appearance 0.314 0.348 0.519
Thailand
Factors
Requirements towards a product/brand Quality Brand
glamor
Sensitivity and
mildness Products are of higher quality 0.756 0.084 0.091 It is a trustworthy brand 0.745 0.136 0.102 Products offer good value for money 0.682 -0.008 0.077 Products perform better than those of other brands 0.622 0.195 0.259 Products fulfill current expectations towards skin care 0.621 0.031 0.347 Products contain highly effective ingredients 0.554 0.156 0.375 It is a modern brand 0.139 0.839 -0.048 This brand is highly advertised 0.063 0.829 -0.128 Products rely on the latest scientific findings 0.109 0.583 0.311 Products have a pleasant fragrance 0.013 0.562 0.169 Products are suitable for sensitive skin 0.125 0.069 0.846 This brand offers mild skin care products 0.247 0.116 0.767 Products are highly appropriate for skin 0.422 0.054 0.587 This brand is for demanding women who give importance to their appearance 0.324 0.378 0.277
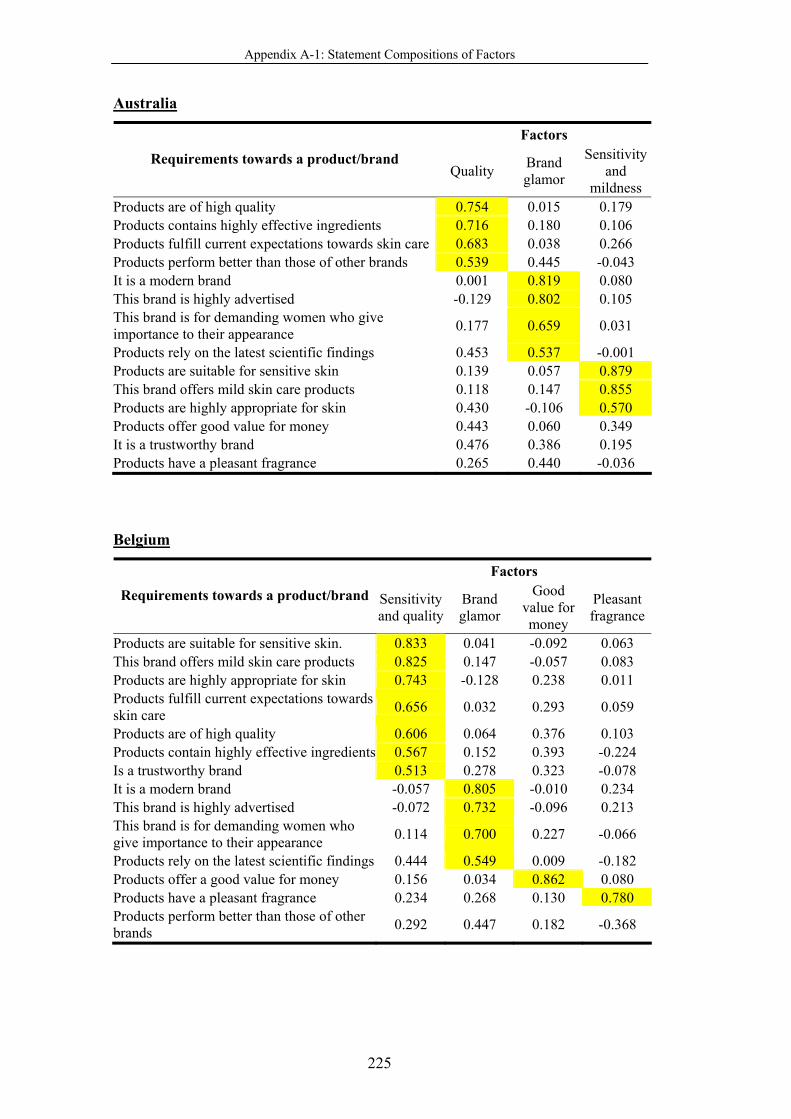
Appendix A-1: Statement Compositions of Factors
225
Australia
Factors
Requirements towards a product/brand Quality Brand
glamor
Sensitivity and
mildness Products are of high quality 0.754 0.015 0.179 Products contains highly effective ingredients 0.716 0.180 0.106 Products fulfill current expectations towards skin care 0.683 0.038 0.266 Products perform better than those of other brands 0.539 0.445 -0.043 It is a modern brand 0.001 0.819 0.080 This brand is highly advertised -0.129 0.802 0.105 This brand is for demanding women who give importance to their appearance 0.177 0.659 0.031
Products rely on the latest scientific findings 0.453 0.537 -0.001 Products are suitable for sensitive skin 0.139 0.057 0.879 This brand offers mild skin care products 0.118 0.147 0.855 Products are highly appropriate for skin 0.430 -0.106 0.570 Products offer good value for money 0.443 0.060 0.349 It is a trustworthy brand 0.476 0.386 0.195 Products have a pleasant fragrance 0.265 0.440 -0.036
Belgium
Factors
Requirements towards a product/brand Sensitivity and quality
Brand glamor
Good value for money
Pleasant fragrance
Products are suitable for sensitive skin. 0.833 0.041 -0.092 0.063 This brand offers mild skin care products 0.825 0.147 -0.057 0.083 Products are highly appropriate for skin 0.743 -0.128 0.238 0.011 Products fulfill current expectations towards skin care 0.656 0.032 0.293 0.059
Products are of high quality 0.606 0.064 0.376 0.103 Products contain highly effective ingredients 0.567 0.152 0.393 -0.224 Is a trustworthy brand 0.513 0.278 0.323 -0.078 It is a modern brand -0.057 0.805 -0.010 0.234 This brand is highly advertised -0.072 0.732 -0.096 0.213 This brand is for demanding women who give importance to their appearance 0.114 0.700 0.227 -0.066
Products rely on the latest scientific findings 0.444 0.549 0.009 -0.182 Products offer a good value for money 0.156 0.034 0.862 0.080 Products have a pleasant fragrance 0.234 0.268 0.130 0.780 Products perform better than those of other brands 0.292 0.447 0.182 -0.368

Appendix A-1: Statement Compositions of Factors
226
Germany
Factors
Requirements towards a product/brand Quality Brand
glamor
Sensitivity and
mildness Products are of high quality 0.719 0.108 0.268 Products contain highly effective ingredients 0.706 0.152 0.226 It is a trustworthy brand 0.702 0.200 0.190 Products offer good value for money 0.698 -0.087 0.211 Products fulfill current expectations towards skin care 0.684 0.145 0.250 Products rely on the latest scientific findings 0.614 0.384 0.105 Products have a pleasant fragrance 0.608 0.113 0.197 It is a modern brand 0.171 0.799 -0.014 This brand is highly advertised -0.248 0.768 0.002 This brand is for demanding women who give importance to their appearance 0.278 0.679 0.101
Products perform better than those of other brands 0.346 0.655 -0.013 Products are suitable for sensitive skin 0.169 0.040 0.867 This brand offers mild skin care products 0.374 0.050 0.725 Products are highly appropriate for skin 0.439 -0.048 0.671
Italy
Factors
Requirements towards a product/brand Quality
Sensitivity and
mildness
Brand glamor
It is a trustworthy brand 0.736 0.214 -0.119 Products fulfill current expectations towards skin care 0.689 0.365 -0.071 Products perform better than those of other brands 0.619 0.367 0.080 Products are of high quality 0.612 0.287 -0.008 Products offer good value for money 0.610 0.044 0.026 Products contain highly effective ingredients 0.530 0.544 -0.010 Products are suitable for sensitive skin 0.208 0.783 -0.024 This brand offers mild skin care products 0.305 0.768 0.084 Products rely on the latest scientific findings 0.141 0.661 0.354 Products are highly appropriate for skin 0.472 0.620 -0.045 It is a modern brand 0.023 0.037 0.858 This brand is highly advertised -0.034 -0.118 0.824 This brand is for demanding women who give importance to their appearance -0.019 0.250 0.705
Products have a pleasant fragrance 0.467 0.098 0.326

Appendix A-1: Statement Compositions of Factors
227
Netherlands
Factors
Requirements towards a product/brandQuality Brand
glamor
Sensitivity and
mildness
Pleasant fragrance
Products contain highly effective ingredients 0.745 0.103 0.257 0.008 Products are of high quality 0.700 -0.070 0.209 0.178 Products offer good value for money 0.672 -0.151 -0.018 0.333 Products perform better than those of other brands 0.653 0.240 0.047 -0.148
Products fulfill current expectations towards skin care 0.555 0.240 0.384 -0.020
It is a trustworthy brand 0.536 0.140 0.171 0.394 It is a modern brand -0.001 0.867 0.044 0.086 This brand is highly advertised -0.031 0.854 0.008 0.037 This brand is for demanding women who give importance to their appearance 0.225 0.705 0.060 0.089
Products are suitable for sensitive skin 0.048 0.009 0.815 0.062 This brand offers mild skin care products 0.201 0.020 0.736 0.144 Products are highly appropriate for skin 0.403 -0.056 0.542 0.372 Products rely on the latest scientific findings 0.303 0.391 0.538 -0.245 Products have a pleasant fragrance 0.100 0.178 0.119 0.837
Spain
Factors
Requirements towards a product/brand Quality and mildness
Brand glamor
Suitability for
sensitive skin
This brand offers mild skin care products 0.758 -0.028 0.089 Products fulfill current expectations towards skin care 0.753 0.176 -0.080 Products are highly appropriate for skin 0.741 -0.027 0.246 It is a trustworthy brand 0.739 0.161 -0.049 Products contain highly effective ingredients 0.694 0.187 0.257 Products offer good value for money 0.660 -0.094 0.188 Products are of high quality 0.634 0.159 0.247 Products have a pleasant fragrance 0.611 0.206 0.224 It is a modern brand 0.042 0.792 0.207 This brand is highly advertised -0.120 0.741 0.138 This brand is for demanding women who give importance to their appearance 0.134 0.729 0.156
Products perform better than those of other brands 0.372 0.650 -0.217 Products rely on the latest scientific findings 0.317 0.511 0.525 Products are suitable for sensitive skin 0.278 0.232 0.779
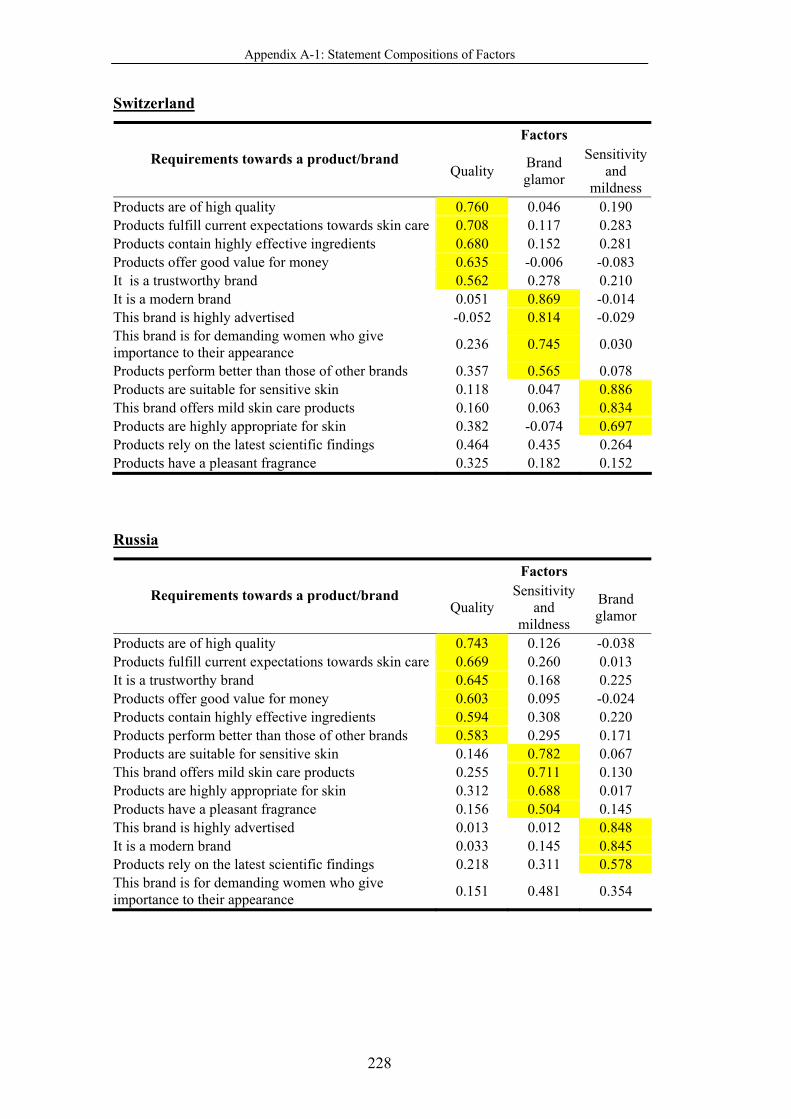
Appendix A-1: Statement Compositions of Factors
228
Switzerland
Factors
Requirements towards a product/brand Quality Brand
glamor
Sensitivity and
mildness Products are of high quality 0.760 0.046 0.190 Products fulfill current expectations towards skin care 0.708 0.117 0.283 Products contain highly effective ingredients 0.680 0.152 0.281 Products offer good value for money 0.635 -0.006 -0.083 It is a trustworthy brand 0.562 0.278 0.210 It is a modern brand 0.051 0.869 -0.014 This brand is highly advertised -0.052 0.814 -0.029 This brand is for demanding women who give importance to their appearance 0.236 0.745 0.030
Products perform better than those of other brands 0.357 0.565 0.078 Products are suitable for sensitive skin 0.118 0.047 0.886 This brand offers mild skin care products 0.160 0.063 0.834 Products are highly appropriate for skin 0.382 -0.074 0.697 Products rely on the latest scientific findings 0.464 0.435 0.264 Products have a pleasant fragrance 0.325 0.182 0.152
Russia
Factors
Requirements towards a product/brand Quality
Sensitivity and
mildness
Brand glamor
Products are of high quality 0.743 0.126 -0.038 Products fulfill current expectations towards skin care 0.669 0.260 0.013 It is a trustworthy brand 0.645 0.168 0.225 Products offer good value for money 0.603 0.095 -0.024 Products contain highly effective ingredients 0.594 0.308 0.220 Products perform better than those of other brands 0.583 0.295 0.171 Products are suitable for sensitive skin 0.146 0.782 0.067 This brand offers mild skin care products 0.255 0.711 0.130 Products are highly appropriate for skin 0.312 0.688 0.017 Products have a pleasant fragrance 0.156 0.504 0.145 This brand is highly advertised 0.013 0.012 0.848 It is a modern brand 0.033 0.145 0.845 Products rely on the latest scientific findings 0.218 0.311 0.578 This brand is for demanding women who give importance to their appearance 0.151 0.481 0.354
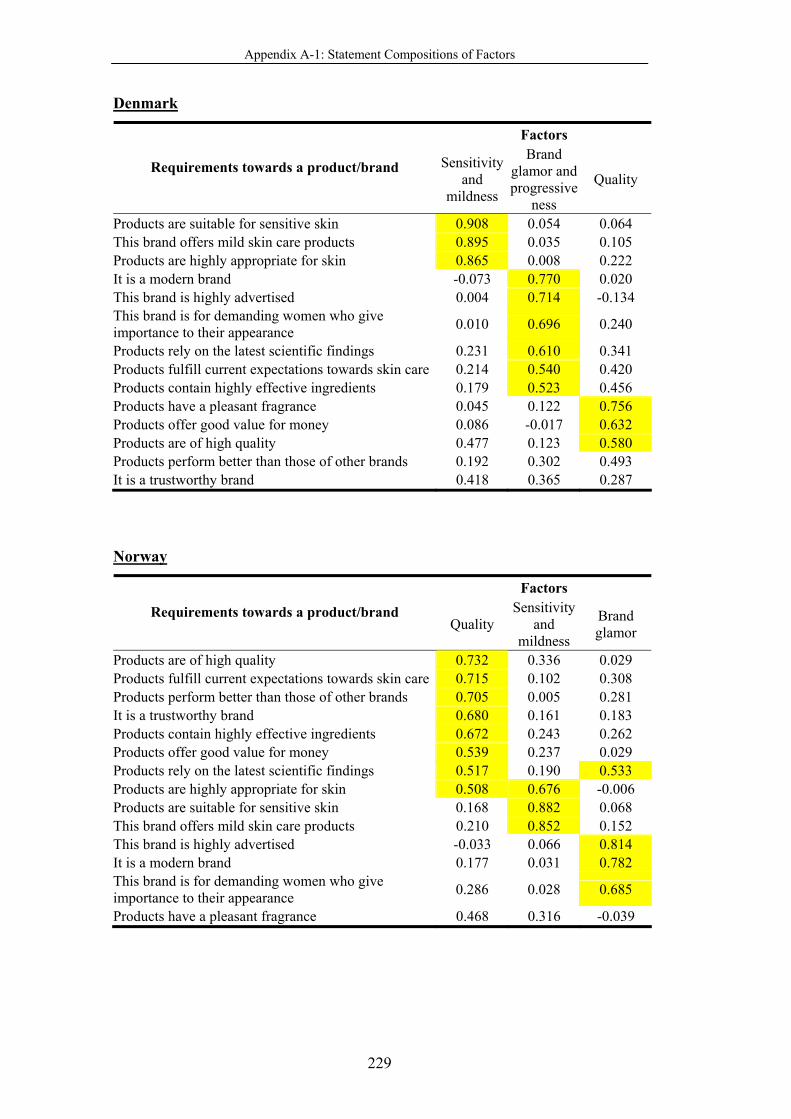
Appendix A-1: Statement Compositions of Factors
229
Denmark
Factors
Requirements towards a product/brand Sensitivity and
mildness
Brand glamor and progressive
ness
Quality
Products are suitable for sensitive skin 0.908 0.054 0.064 This brand offers mild skin care products 0.895 0.035 0.105 Products are highly appropriate for skin 0.865 0.008 0.222 It is a modern brand -0.073 0.770 0.020 This brand is highly advertised 0.004 0.714 -0.134 This brand is for demanding women who give importance to their appearance 0.010 0.696 0.240
Products rely on the latest scientific findings 0.231 0.610 0.341 Products fulfill current expectations towards skin care 0.214 0.540 0.420 Products contain highly effective ingredients 0.179 0.523 0.456 Products have a pleasant fragrance 0.045 0.122 0.756 Products offer good value for money 0.086 -0.017 0.632 Products are of high quality 0.477 0.123 0.580 Products perform better than those of other brands 0.192 0.302 0.493 It is a trustworthy brand 0.418 0.365 0.287
Norway
Factors
Requirements towards a product/brand Quality
Sensitivity and
mildness
Brand glamor
Products are of high quality 0.732 0.336 0.029 Products fulfill current expectations towards skin care 0.715 0.102 0.308 Products perform better than those of other brands 0.705 0.005 0.281 It is a trustworthy brand 0.680 0.161 0.183 Products contain highly effective ingredients 0.672 0.243 0.262 Products offer good value for money 0.539 0.237 0.029 Products rely on the latest scientific findings 0.517 0.190 0.533 Products are highly appropriate for skin 0.508 0.676 -0.006 Products are suitable for sensitive skin 0.168 0.882 0.068 This brand offers mild skin care products 0.210 0.852 0.152 This brand is highly advertised -0.033 0.066 0.814 It is a modern brand 0.177 0.031 0.782 This brand is for demanding women who give importance to their appearance 0.286 0.028 0.685
Products have a pleasant fragrance 0.468 0.316 -0.039

Appendix A-1: Statement Compositions of Factors
230
Argentina
Factors Requirements towards a product/brand Mildness and
effectivenessBrand glamor
Quality and value
Products are highly appropriate for skin 0.735 -0.053 0.013 Products fulfill current expectations towards skin care 0.695 0.035 0.204
Products contain highly effective ingredients 0.690 0.150 0.010 It is a trustworthy brand 0.631 0.094 0.329 Products are suitable for sensitive skin 0.603 0.110 0.121 Products rely on the latest scientific findings 0.584 0.238 -0.117 This brand offers mild skin care products 0.521 0.200 0.240 Products perform better than those of other brands 0.513 0.357 -0.068 It is a modern brand -0.001 0.801 -0.004 This brand is highly advertised. 0.045 0.798 0.047 This brand is for demanding women who give importance to their appearance 0.235 0.602 -0.091
Products have a pleasant fragrance 0.182 0.542 0.145 Products offer good value for money -0.041 0.061 0.831 Products are of high quality 0.360 -0.040 0.620
Paraguay
Factors
Requirements towards a product/brandQuality Product
excellenceBrand
popularity
Sensitivity and
mildness Products are of high quality 0.801 0.144 0.080 0.042 It is a trustworthy brand 0.786 0.118 0.017 0.060 Products offer good value for money 0.597 -0.084 0.215 0.100 Products fulfill current expectations towards skin care 0.509 0.327 0.060 0.304
Products are highly appropriate for skin 0.004 0.729 0.107 0.240 Products rely on the latest scientific findings 0.088 0.660 0.221 -0.128 This brand is for demanding women who give importance to their appearance 0.054 0.522 0.454 0.063
This brand is highly advertised 0.073 0.141 0.834 -0.019 It is a modern brand 0.100 0.288 0.755 0.194 Products are suitable for sensitive skin 0.117 0.060 -0.037 0.766 This brand offers mild skin care products 0.123 0.273 0.222 0.713 Products have a pleasant fragrance 0.164 -0.069 0.470 0.472 Products contain highly effective ingredients 0.443 0.422 -0.234 0.211 Products perform better than those of other brands 0.296 0.493 0.058 0.195

Appendix A-1: Statement Compositions of Factors
231
Venezuela
Factors Requirements towards a product/brand Quality and
mildness Product
excellence Brand glamor
It is a trustworthy brand 0.757 0.243 -0.034 Products are of high quality 0.732 0.239 -0.012 Products fulfill current expectations towards skin care 0.730 0.263 -0.033 This brand offers mild skin care products 0.678 0.109 0.280 Products are suitable for sensitive skin 0.663 0.221 0.193 Products have a pleasant fragrance 0.535 0.090 0.311 Products offer good value for money 0.532 0.096 0.113 Products rely on the latest scientific findings 0.218 0.731 0.134 Products perform better than those of other brands 0.062 0.693 0.293 Products contain highly effective ingredients 0.313 0.635 0.059 Products are highly appropriate for skin 0.392 0.535 0.064 It is a modern brand 0.149 0.117 0.848 This brand is highly advertised 0.062 0.140 0.833 This brand is for demanding women who give importance to their appearance 0.153 0.410 0.509
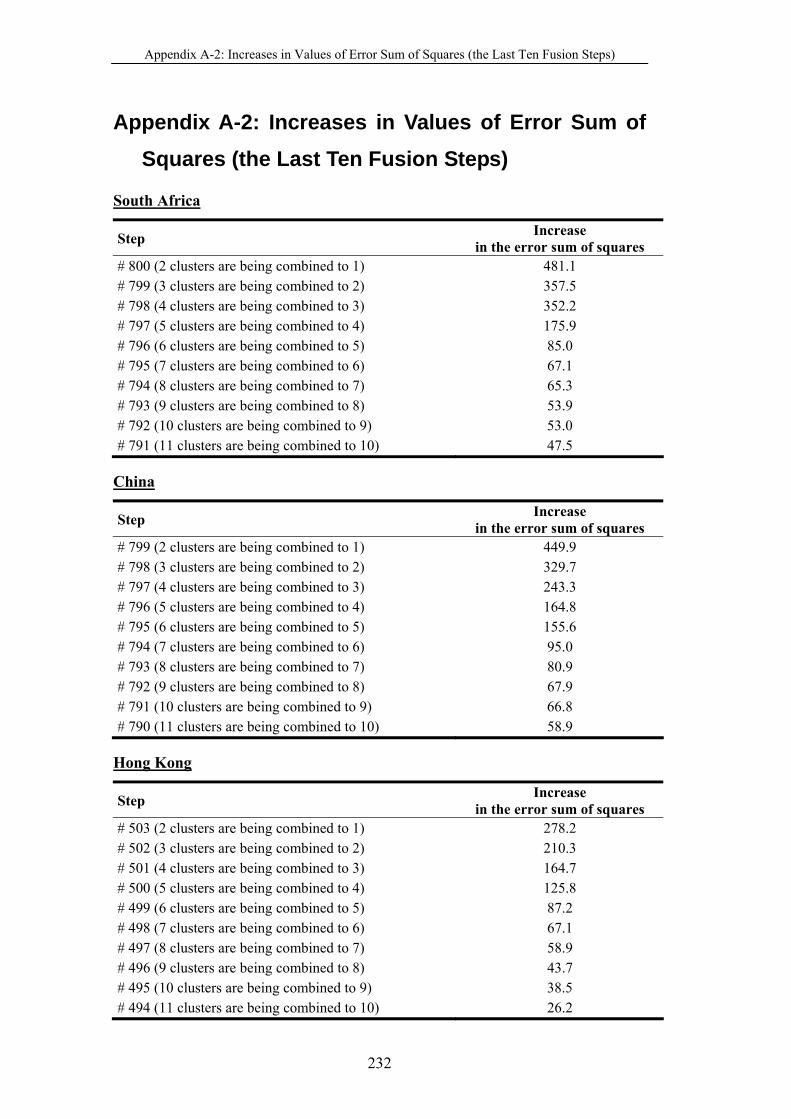
Appendix A-2: Increases in Values of Error Sum of Squares (the Last Ten Fusion Steps)
232
Appendix A-2: Increases in Values of Error Sum of Squares (the Last Ten Fusion Steps)
South Africa
Step Increase in the error sum of squares
# 800 (2 clusters are being combined to 1) 481.1 # 799 (3 clusters are being combined to 2) 357.5 # 798 (4 clusters are being combined to 3) 352.2 # 797 (5 clusters are being combined to 4) 175.9 # 796 (6 clusters are being combined to 5) 85.0 # 795 (7 clusters are being combined to 6) 67.1 # 794 (8 clusters are being combined to 7) 65.3 # 793 (9 clusters are being combined to 8) 53.9 # 792 (10 clusters are being combined to 9) 53.0 # 791 (11 clusters are being combined to 10) 47.5
China
Step Increase in the error sum of squares
# 799 (2 clusters are being combined to 1) 449.9 # 798 (3 clusters are being combined to 2) 329.7 # 797 (4 clusters are being combined to 3) 243.3 # 796 (5 clusters are being combined to 4) 164.8 # 795 (6 clusters are being combined to 5) 155.6 # 794 (7 clusters are being combined to 6) 95.0 # 793 (8 clusters are being combined to 7) 80.9 # 792 (9 clusters are being combined to 8) 67.9 # 791 (10 clusters are being combined to 9) 66.8 # 790 (11 clusters are being combined to 10) 58.9
Hong Kong
Step Increase in the error sum of squares
# 503 (2 clusters are being combined to 1) 278.2 # 502 (3 clusters are being combined to 2) 210.3 # 501 (4 clusters are being combined to 3) 164.7 # 500 (5 clusters are being combined to 4) 125.8 # 499 (6 clusters are being combined to 5) 87.2 # 498 (7 clusters are being combined to 6) 67.1 # 497 (8 clusters are being combined to 7) 58.9 # 496 (9 clusters are being combined to 8) 43.7 # 495 (10 clusters are being combined to 9) 38.5 # 494 (11 clusters are being combined to 10) 26.2
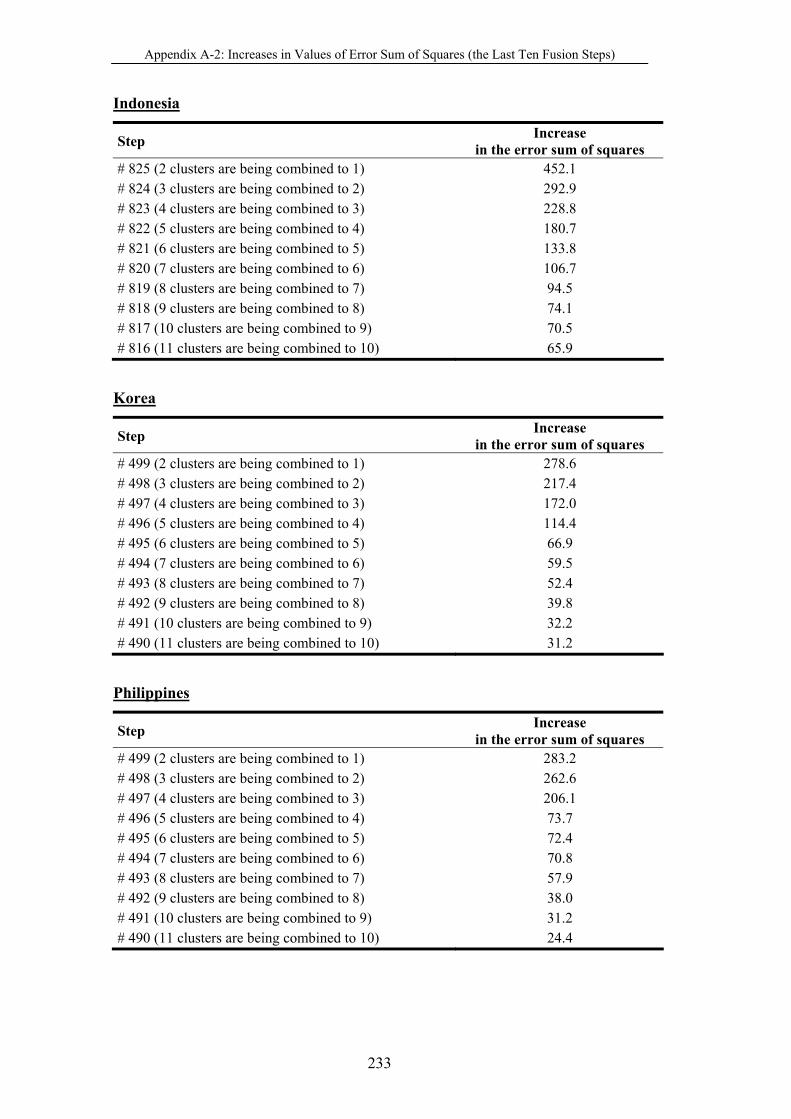
Appendix A-2: Increases in Values of Error Sum of Squares (the Last Ten Fusion Steps)
233
Indonesia
Step Increase in the error sum of squares
# 825 (2 clusters are being combined to 1) 452.1 # 824 (3 clusters are being combined to 2) 292.9 # 823 (4 clusters are being combined to 3) 228.8 # 822 (5 clusters are being combined to 4) 180.7 # 821 (6 clusters are being combined to 5) 133.8 # 820 (7 clusters are being combined to 6) 106.7 # 819 (8 clusters are being combined to 7) 94.5 # 818 (9 clusters are being combined to 8) 74.1 # 817 (10 clusters are being combined to 9) 70.5 # 816 (11 clusters are being combined to 10) 65.9
Korea
Step Increase in the error sum of squares
# 499 (2 clusters are being combined to 1) 278.6 # 498 (3 clusters are being combined to 2) 217.4 # 497 (4 clusters are being combined to 3) 172.0 # 496 (5 clusters are being combined to 4) 114.4 # 495 (6 clusters are being combined to 5) 66.9 # 494 (7 clusters are being combined to 6) 59.5 # 493 (8 clusters are being combined to 7) 52.4 # 492 (9 clusters are being combined to 8) 39.8 # 491 (10 clusters are being combined to 9) 32.2 # 490 (11 clusters are being combined to 10) 31.2
Philippines
Step Increase in the error sum of squares
# 499 (2 clusters are being combined to 1) 283.2 # 498 (3 clusters are being combined to 2) 262.6 # 497 (4 clusters are being combined to 3) 206.1 # 496 (5 clusters are being combined to 4) 73.7 # 495 (6 clusters are being combined to 5) 72.4 # 494 (7 clusters are being combined to 6) 70.8 # 493 (8 clusters are being combined to 7) 57.9 # 492 (9 clusters are being combined to 8) 38.0 # 491 (10 clusters are being combined to 9) 31.2 # 490 (11 clusters are being combined to 10) 24.4

Appendix A-2: Increases in Values of Error Sum of Squares (the Last Ten Fusion Steps)
234
Taiwan
Step Increase in the error sum of squares
# 503 (2 clusters are being combined to 1) 333.1 # 502 (3 clusters are being combined to 2) 248.9 # 501 (4 clusters are being combined to 3) 207.9 # 500 (5 clusters are being combined to 4) 94.0 # 499 (6 clusters are being combined to 5) 66.2 # 498 (7 clusters are being combined to 6) 60.0 # 497 (8 clusters are being combined to 7) 43.4 # 496 (9 clusters are being combined to 8) 42.4 # 495 (10 clusters are being combined to 9) 27.9 # 494 (11 clusters are being combined to 10) 23.6
Thailand
Step Increase in the error sum of squares
# 999 (2 clusters are being combined to 1) 563.0 # 998 (3 clusters are being combined to 2) 454.9 # 997 (4 clusters are being combined to 3) 318.1 # 996 (5 clusters are being combined to 4) 217.9 # 995 (6 clusters are being combined to 5) 162.4 # 994 (7 clusters are being combined to 6) 132.3 # 993 (8 clusters are being combined to 7) 90.5 # 992 (9 clusters are being combined to 8) 81.1 # 991 (10 clusters are being combined to 9) 64.5 # 990 (11 clusters are being combined to 10) 58.6
Australia
Step Increase in the error sum of squares
# 580 (2 clusters are being combined to 1) 355.4 # 579 (3 clusters are being combined to 2) 297.9 # 578 (4 clusters are being combined to 3) 258.6 # 577 (5 clusters are being combined to 4) 110.0 # 576 (6 clusters are being combined to 5) 61.3 # 575 (7 clusters are being combined to 6) 54.1 # 574 (8 clusters are being combined to 7) 50.3 # 573 (9 clusters are being combined to 8) 40.5 # 572 (10 clusters are being combined to 9) 36.1 # 571 (11 clusters are being combined to 10) 30.2

Appendix A-2: Increases in Values of Error Sum of Squares (the Last Ten Fusion Steps)
235
Belgium
Step Increase in the error sum of squares
# 371 (2 clusters are being combined to 1) 229.2 # 370 (3 clusters are being combined to 2) 172.2 # 369 (4 clusters are being combined to 3) 157.2 # 368 (5 clusters are being combined to 4) 119.2 # 367 (6 clusters are being combined to 5) 107.8 # 366 (7 clusters are being combined to 6) 58.2 # 365 (8 clusters are being combined to 7) 47.9 # 364 (9 clusters are being combined to 8) 30.2 # 363 (10 clusters are being combined to 9) 28.5 # 362 (11 clusters are being combined to 10) 28.4
Germany
Step Increase in the error sum of squares
# 1046 (2 clusters are being combined to 1) 570.8 # 1045 (3 clusters are being combined to 2) 557.9 # 1044 (4 clusters are being combined to 3) 417.0 # 1043 (5 clusters are being combined to 4) 168.0 # 1042 (6 clusters are being combined to 5) 161.1 # 1041 (7 clusters are being combined to 6) 108.7 # 1040 (8 clusters are being combined to 7) 100.1 # 1039 (9 clusters are being combined to 8) 85.1 # 1038 (10 clusters are being combined to 9) 60.7 # 1037 (11 clusters are being combined to 10) 53.0
Italy
Step Increase in the error sum of squares
# 520 (2 clusters are being combined to 1) 290.9 # 519 (3 clusters are being combined to 2) 283.2 # 518 (4 clusters are being combined to 3) 195.2 # 517 (5 clusters are being combined to 4) 81.9 # 516 (6 clusters are being combined to 5) 72.2 # 515 (7 clusters are being combined to 6) 66.4 # 514 (8 clusters are being combined to 7) 55.1 # 513 (9 clusters are being combined to 8) 36.7 # 512 (10 clusters are being combined to 9) 32.1 # 511 (11 clusters are being combined to 10) 27.6

Appendix A-2: Increases in Values of Error Sum of Squares (the Last Ten Fusion Steps)
236
Netherlands
Step Increase in the error sum of squares
# 490 (2 clusters are being combined to 1) 282.9 # 489 (3 clusters are being combined to 2) 234.2 # 488 (4 clusters are being combined to 3) 196.8 # 487 (5 clusters are being combined to 4) 133.4 # 486 (6 clusters are being combined to 5) 95.7 # 485 (7 clusters are being combined to 6) 72.2 # 484 (8 clusters are being combined to 7) 66.7 # 483 (9 clusters are being combined to 8) 57.9 # 482 (10 clusters are being combined to 9) 49.3 # 481 (11 clusters are being combined to 10) 39.7
Spain
Step Increase in the error sum of squares
# 754 (2 clusters are being combined to 1) 455.9 # 753 (3 clusters are being combined to 2) 352.0 # 752 (4 clusters are being combined to 3) 236.7 # 751 (5 clusters are being combined to 4) 172.2 # 750 (6 clusters are being combined to 5) 100.5 # 749 (7 clusters are being combined to 6) 86.8 # 748 (8 clusters are being combined to 7) 81.5 # 747 (9 clusters are being combined to 8) 75.4 # 746 (10 clusters are being combined to 9) 73.3 # 745 (11 clusters are being combined to 10) 37.5
Switzerland
Step Increase in the error sum of squares
# 505 (2 clusters are being combined to 1) 320.6 # 504 (3 clusters are being combined to 2) 266.3 # 503 (4 clusters are being combined to 3) 146.7 # 502 (5 clusters are being combined to 4) 103.4 # 501 (6 clusters are being combined to 5) 69.9 # 500 (7 clusters are being combined to 6) 58.0 # 499 (8 clusters are being combined to 7) 50.8 # 498 (9 clusters are being combined to 8) 47.2 # 497 (10 clusters are being combined to 9) 39.1 # 496 (11 clusters are being combined to 10) 31.7

Appendix A-2: Increases in Values of Error Sum of Squares (the Last Ten Fusion Steps)
237
Russia
Step Increase in the error sum of squares
# 1199 (2 clusters are being combined to 1) 669.2 # 1198 (3 clusters are being combined to 2) 533.9 # 1197 (4 clusters are being combined to 3) 515.6 # 1196 (5 clusters are being combined to 4) 222.8 # 1195 (6 clusters are being combined to 5) 175.2 # 1194 (7 clusters are being combined to 6) 125.6 # 1193 (8 clusters are being combined to 7) 117.8 # 1192 (9 clusters are being combined to 8) 117.8 # 1191 (10 clusters are being combined to 9) 80.5 # 1190 (11 clusters are being combined to 10) 75.6
Denmark
Step Increase in the error sum of squares
# 399 (2 clusters are being combined to 1) 240.8 # 398 (3 clusters are being combined to 2) 193.8 # 397 (4 clusters are being combined to 3) 134.5 # 396 (5 clusters are being combined to 4) 79.5 # 395 (6 clusters are being combined to 5) 76.1 # 394 (7 clusters are being combined to 6) 37.4 # 393 (8 clusters are being combined to 7) 36.1 # 392 (9 clusters are being combined to 8) 31.1 # 391 (10 clusters are being combined to 9) 30.1 # 390 (11 clusters are being combined to 10) 26.6
Norway
Step Increase in the error sum of squares
# 365 (2 clusters are being combined to 1) 227.7 # 364 (3 clusters are being combined to 2) 160.1 # 363 (4 clusters are being combined to 3) 119.8 # 362 (5 clusters are being combined to 4) 111.6 # 361 (6 clusters are being combined to 5) 71.9 # 360 (7 clusters are being combined to 6) 42.1 # 359 (8 clusters are being combined to 7) 34.6 # 358 (9 clusters are being combined to 8) 28.2 # 357 (10 clusters are being combined to 9) 24.9 # 356 (11 clusters are being combined to 10) 23.8

Appendix A-2: Increases in Values of Error Sum of Squares (the Last Ten Fusion Steps)
238
Argentina
Step Increase in the error sum of squares
# 515 (2 clusters are being combined to 1) 375.3 # 514 (3 clusters are being combined to 2) 287.1 # 513 (4 clusters are being combined to 3) 229.0 # 512 (5 clusters are being combined to 4) 93.3 # 511 (6 clusters are being combined to 5) 49.7 # 510 (7 clusters are being combined to 6) 48.5 # 509 (8 clusters are being combined to 7) 45.6 # 508 (9 clusters are being combined to 8) 33.0 # 507 (10 clusters are being combined to 9) 27.3 # 506 (11 clusters are being combined to 10) 22.1
Paraguay
Step Increase in the error sum of squares
# 401 (2 clusters are being combined to 1) 226.6 # 400 (3 clusters are being combined to 2) 224.3 # 399 (4 clusters are being combined to 3) 194.0 # 398 (5 clusters are being combined to 4) 149.5 # 397 (6 clusters are being combined to 5) 67.8 # 396 (7 clusters are being combined to 6) 67.5 # 395 (8 clusters are being combined to 7) 57.2 # 394 (9 clusters are being combined to 8) 53.4 # 393 (10 clusters are being combined to 9) 34.6 # 392 (11 clusters are being combined to 10) 34.2
Venezuela
Step Increase in the error sum of squares
# 799 (2 clusters are being combined to 1) 473.0 # 798 (3 clusters are being combined to 2) 438.6 # 797 (4 clusters are being combined to 3) 348.6 # 796 (5 clusters are being combined to 4) 139.2 # 795 (6 clusters are being combined to 5) 133.9 # 794 (7 clusters are being combined to 6) 81.5 # 793 (8 clusters are being combined to 7) 80.0 # 792 (9 clusters are being combined to 8) 78.2 # 791 (10 clusters are being combined to 9) 50.9 # 790 (11 clusters are being combined to 10) 42.7

Appendix A-3: Values of Within-Groups Sum of Squares Plotted against Corresponding Quantities of Clusters
239
Appendix A-3: Values of Within-Groups Sum of Squares Plotted against Corresponding Quantities of Clusters
South Africa
China
10000
12000
14000
16000
18000
20000
1 2 3 4 5 6 7 8 9 10
Number of clusters
With
in-g
roup
s sum
of s
quar
es
6000
8000
10000
12000
14000
1 2 3 4 5 6 7 8 9 10
Number of clusters
With
in-g
roup
s sum
of s
quar
es

Appendix A-3: Values of Within-Groups Sum of Squares Plotted against Corresponding Quantities of Clusters
240
Hong Kong
Indonesia
4000
6000
8000
10000
12000
1 2 3 4 5 6 7 8 9 10
Number of clusters
With
in-g
roup
s su
m o
f squ
ares
6000
8000
10000
12000
1 2 3 4 5 6 7 8 9 10
Number of clusters
With
in-g
roup
s su
m o
f squ
ares

Appendix A-3: Values of Within-Groups Sum of Squares Plotted against Corresponding Quantities of Clusters
241
Korea
Philippines
4000
5000
6000
7000
8000
1 2 3 4 5 6 7 8 9 10
Number of clusters
With
in-g
roup
s su
m o
f squ
ares
4000
5000
6000
7000
8000
1 2 3 4 5 6 7 8 9 10
Number of clusters
With
in-g
roup
s su
m o
f squ
ares

Appendix A-3: Values of Within-Groups Sum of Squares Plotted against Corresponding Quantities of Clusters
242
Taiwan
Thailand
3000
4000
5000
6000
7000
1 2 3 4 5 6 7 8 9 10
Number of clusters
With
in-g
roup
s su
m o
f squ
ares
11000
13000
15000
17000
19000
21000
1 2 3 4 5 6 7 8 9 10
Number of clusters
With
in-g
roup
s su
m o
f squ
ares

Appendix A-3: Values of Within-Groups Sum of Squares Plotted against Corresponding Quantities of Clusters
243
Australia
Belgium
11000
13000
15000
17000
19000
21000
1 2 3 4 5 6 7 8 9 10
Number of clusters
With
in-g
roup
s su
m o
f squ
ares
5000
7000
9000
11000
1 2 3 4 5 6 7 8 9 10
Number of clusters
With
in-g
roup
s su
m o
f squ
ares

Appendix A-3: Values of Within-Groups Sum of Squares Plotted against Corresponding Quantities of Clusters
244
Germany
Italy
14000
17000
20000
23000
26000
29000
1 2 3 4 5 6 7 8 9 10
Number of clusters
With
in-g
roup
s su
m o
f squ
ares
5000
7000
9000
11000
1 2 3 4 5 6 7 8 9 10
Number of clusters
With
in-g
roup
s su
m o
f squ
ares
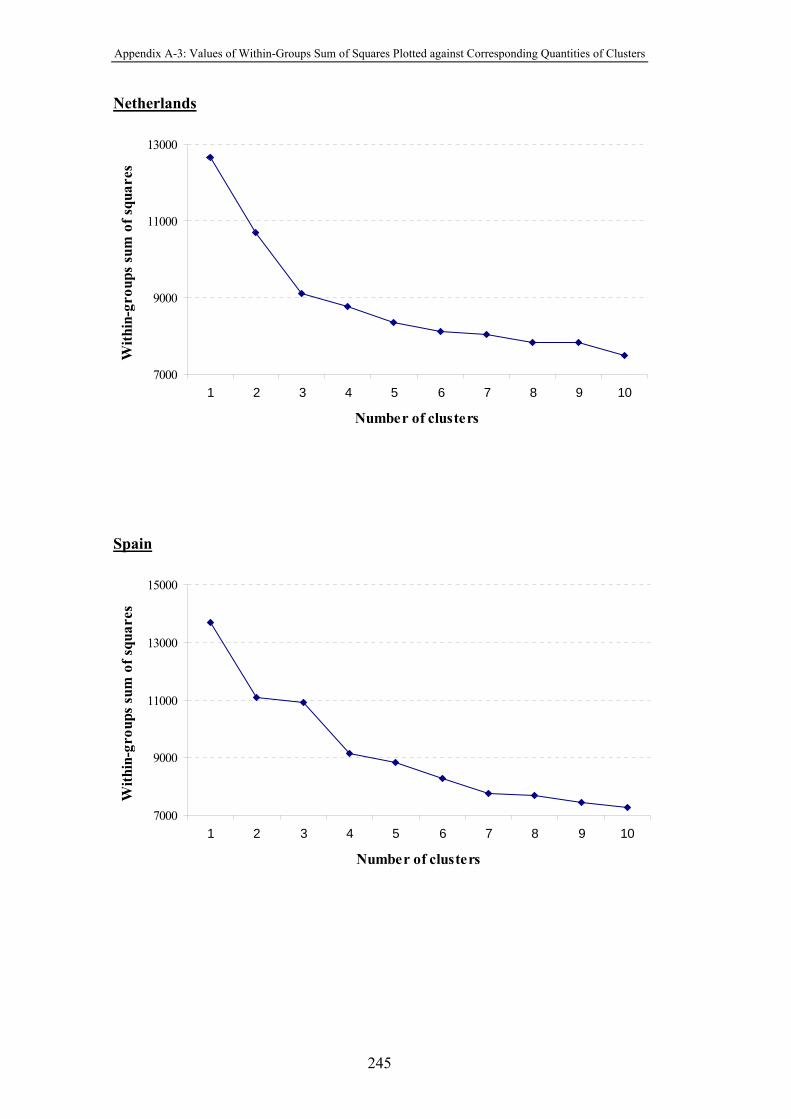
Appendix A-3: Values of Within-Groups Sum of Squares Plotted against Corresponding Quantities of Clusters
245
Netherlands
Spain
7000
9000
11000
13000
1 2 3 4 5 6 7 8 9 10
Number of clusters
With
in-g
roup
s su
m o
f squ
ares
7000
9000
11000
13000
15000
1 2 3 4 5 6 7 8 9 10
Number of clusters
With
in-g
roup
s su
m o
f squ
ares
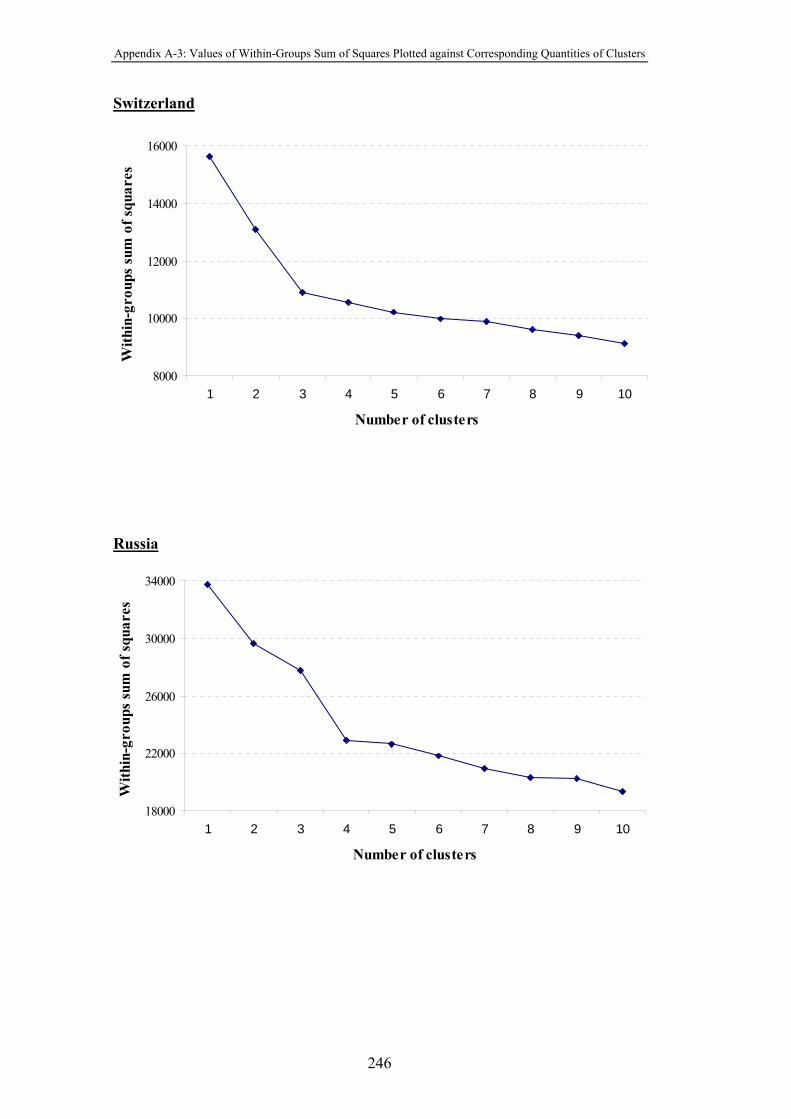
Appendix A-3: Values of Within-Groups Sum of Squares Plotted against Corresponding Quantities of Clusters
246
Switzerland
Russia
8000
10000
12000
14000
16000
1 2 3 4 5 6 7 8 9 10
Number of clusters
With
in-g
roup
s su
m o
f squ
ares
18000
22000
26000
30000
34000
1 2 3 4 5 6 7 8 9 10
Number of clusters
With
in-g
roup
s su
m o
f squ
ares

Appendix A-3: Values of Within-Groups Sum of Squares Plotted against Corresponding Quantities of Clusters
247
Denmark
Norway
9000
11000
13000
15000
17000
1 2 3 4 5 6 7 8 9 10
Number of clusters
With
in-g
roup
s su
m o
f squ
ares
7000
9000
11000
13000
15000
1 2 3 4 5 6 7 8 9 10
Number of clusters
With
in-g
roup
s su
m o
f squ
ares

Appendix A-3: Values of Within-Groups Sum of Squares Plotted against Corresponding Quantities of Clusters
248
Argentina
Paraguay
6000
8000
10000
12000
1 2 3 4 5 6 7 8 9 10
Number of clusters
With
in-g
roup
s su
m o
f squ
ares
4000
5000
6000
7000
8000
9000
1 2 3 4 5 6 7 8 9 10
Number of clusters
With
in-g
roup
s su
m o
f squ
ares

Appendix A-3: Values of Within-Groups Sum of Squares Plotted against Corresponding Quantities of Clusters
249
Venezuela
6000
8000
10000
12000
14000
1 2 3 4 5 6 7 8 9 10
Number of clusters
With
in-g
roup
s su
m o
f squ
ares

Appendix A-4: Cluster Names and Sizes
250
Appendix A-4: Cluster Names and Sizes
South Africa
The Ward’s method
#1 #2 #3 #4 #5
Clusters B
rand
gla
mor
dr
iven
m
ains
tream
Rat
iona
lists
Mod
erat
e le
vel o
f m
ildne
ss fr
om a
po
pula
r and
m
oder
n br
and
Hig
hly
de
man
ding
Goo
d qu
ality
at a
fa
ir pr
ice Tot
al S
ampl
e
Number of respondents 301 119 62 197 122 801 % of total sample 38% 15% 8% 25% 15% 100%
The K-means method
#1 #2 #3 #4
Clusters
Hig
hly
dem
andi
ng
Goo
d qu
ality
at a
fa
ir pr
ice
Rat
iona
lists
Mod
erat
e le
vel o
f m
ildne
ss fr
om a
po
pula
r and
m
oder
n br
and
Tot
al S
ampl
e Number of respondents 413 122 157 109 801 % of total sample 52% 15% 20% 14% 100%
SOM
#1 #2 #3 #4 #5
Clusters
Goo
d qu
ality
at a
fa
ir pr
ice
Mod
erat
e le
vel o
f m
ildne
ss fr
om a
po
pula
r and
m
oder
n br
and
Rat
iona
lists
Bra
nd g
lam
or
driv
en
mai
nstre
am
Hig
hly
dem
andi
ng
Tot
al S
ampl
e
Number of respondents 125 193 197 171 115 801 % of total sample 16% 24% 25% 21% 14% 100%
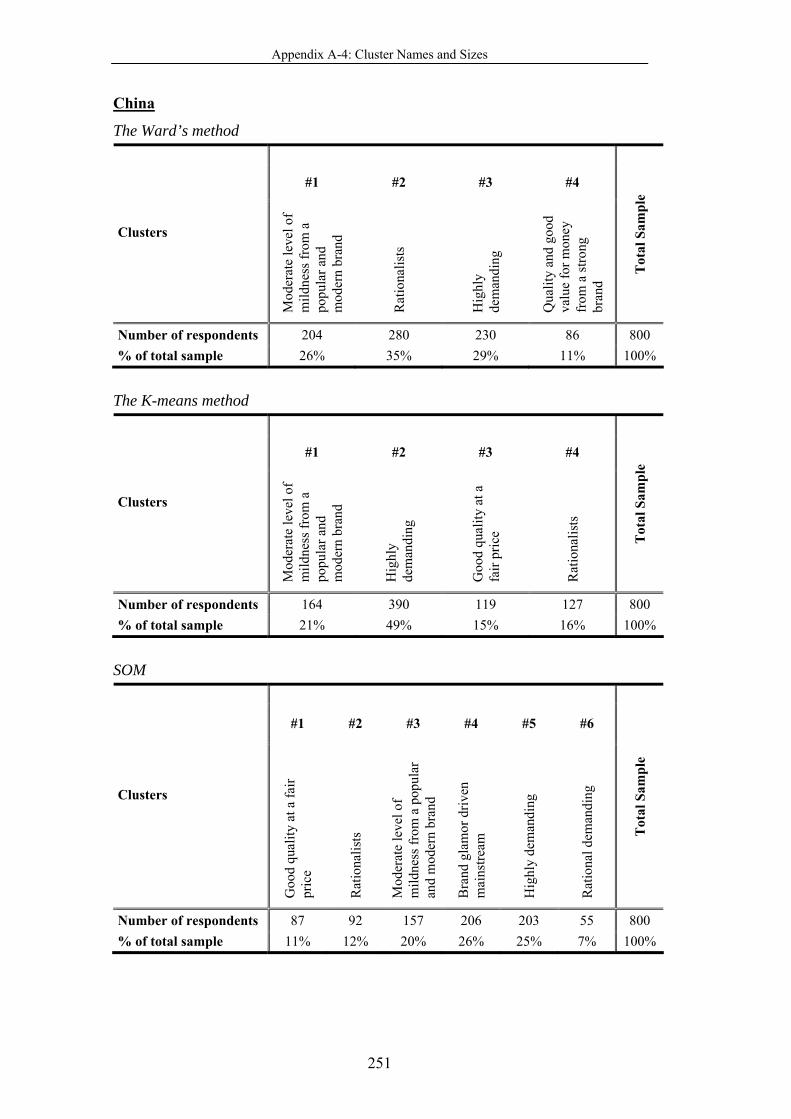
Appendix A-4: Cluster Names and Sizes
251
China
The Ward’s method
#1 #2 #3 #4
Clusters
Mod
erat
e le
vel o
f m
ildne
ss fr
om a
po
pula
r and
m
oder
n br
and
Rat
iona
lists
Hig
hly
dem
andi
ng
Qua
lity
and
good
va
lue
for m
oney
fr
om a
stro
ng
bran
d
Tot
al S
ampl
e
Number of respondents 204 280 230 86 800 % of total sample 26% 35% 29% 11% 100%
The K-means method
#1 #2 #3 #4
Clusters
Mod
erat
e le
vel o
f m
ildne
ss fr
om a
po
pula
r and
m
oder
n br
and
Hig
hly
dem
andi
ng
Goo
d qu
ality
at a
fa
ir pr
ice
Rat
iona
lists
Tot
al S
ampl
e
Number of respondents 164 390 119 127 800 % of total sample 21% 49% 15% 16% 100%
SOM
#1 #2 #3 #4 #5 #6
Clusters
Goo
d qu
ality
at a
fair
pric
e
Rat
iona
lists
Mod
erat
e le
vel o
f m
ildne
ss fr
om a
pop
ular
an
d m
oder
n br
and
Bra
nd g
lam
or d
riven
m
ains
tream
Hig
hly
dem
andi
ng
Rat
iona
l dem
andi
ng
Tot
al S
ampl
e
Number of respondents 87 92 157 206 203 55 800 % of total sample 11% 12% 20% 26% 25% 7% 100%
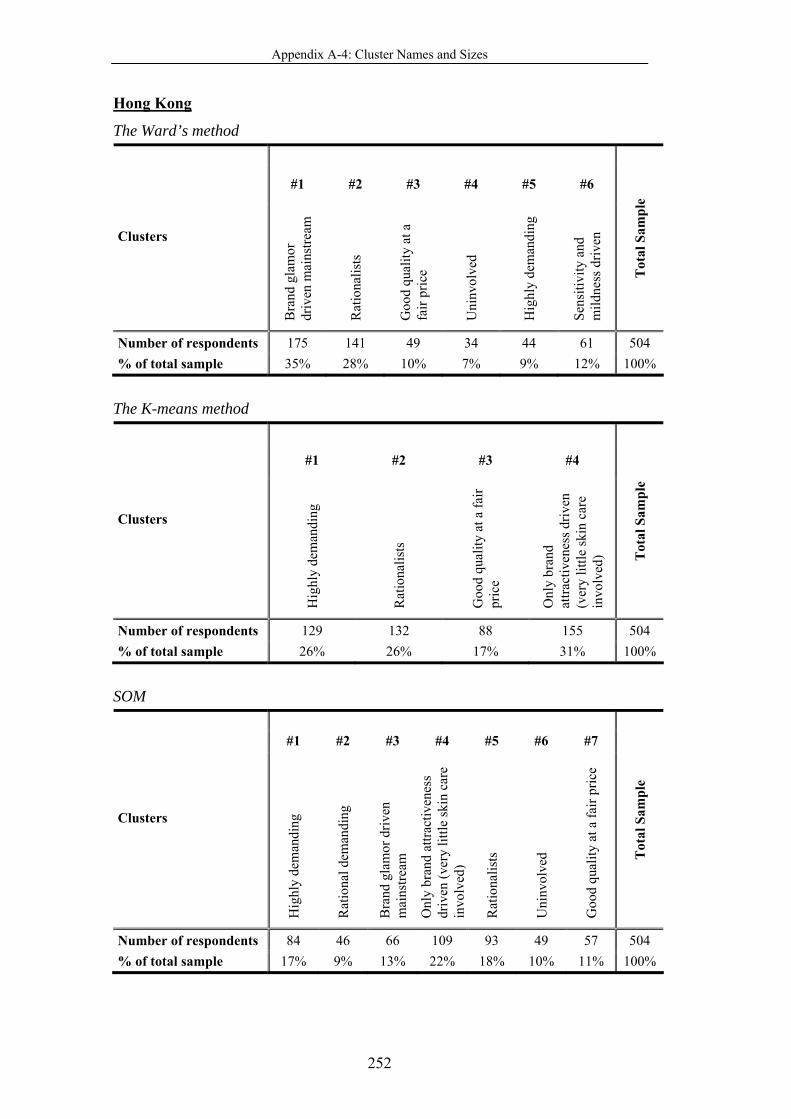
Appendix A-4: Cluster Names and Sizes
252
Hong Kong
The Ward’s method
#1 #2 #3 #4 #5 #6
Clusters
Bra
nd g
lam
or
driv
en m
ains
tream
Rat
iona
lists
Goo
d qu
ality
at a
fa
ir pr
ice
Uni
nvol
ved
Hig
hly
dem
andi
ng
Sens
itivi
ty a
nd
mild
ness
driv
en
Tot
al S
ampl
e
Number of respondents 175 141 49 34 44 61 504 % of total sample 35% 28% 10% 7% 9% 12% 100%
The K-means method
#1 #2 #3 #4
Clusters
Hig
hly
dem
andi
ng
Rat
iona
lists
Goo
d qu
ality
at a
fair
pric
e
Onl
y br
and
attra
ctiv
enes
s driv
en
(ver
y lit
tle sk
in c
are
invo
lved
) Tot
al S
ampl
e Number of respondents 129 132 88 155 504 % of total sample 26% 26% 17% 31% 100%
SOM
#1 #2 #3 #4 #5 #6 #7
Clusters
Hig
hly
dem
andi
ng
Rat
iona
l dem
andi
ng
Bra
nd g
lam
or d
riven
m
ains
tream
Onl
y br
and
attra
ctiv
enes
s dr
iven
(ver
y lit
tle sk
in c
are
invo
lved
)
Rat
iona
lists
Uni
nvol
ved
Goo
d qu
ality
at a
fair
pric
e
Tot
al S
ampl
e
Number of respondents 84 46 66 109 93 49 57 504 % of total sample 17% 9% 13% 22% 18% 10% 11% 100%

Appendix A-4: Cluster Names and Sizes
253
Indonesia
The Ward’s method
#1 #2 #3 #4
Clusters
Mod
erat
e le
vel o
f m
ildne
ss fr
om a
po
pula
r and
mod
ern
bran
d
Bra
nd g
lam
or d
riven
m
ains
tream
Qua
lity
and
good
va
lue
for m
oney
from
a
stro
ng b
rand
Rat
iona
lists
Tot
al S
ampl
e
Number of respondents 108 284 74 360 826 % of total sample 13% 34% 9% 44% 100%
The K-means method
#1 #2 #3 #4
Clusters
Qua
lity
and
good
va
lue
for m
oney
fr
om a
stro
ng
bran
d
Hig
hly
dem
andi
ng
Sens
itivi
ty a
nd
mild
ness
driv
en
Rat
iona
lists
Tot
al S
ampl
e Number of respondents 184 335 142 165 826 % of total sample 22% 41% 17% 20% 100%
SOM
#1 #2 #3 #4 #5 #6
Clusters
Rat
iona
l dem
andi
ng
Hig
hly
dem
andi
ng
Qua
lity
and
good
val
ue fo
r m
oney
from
a st
rong
br
and
Bra
nd g
lam
or d
riven
m
ains
tream
Rat
iona
lists
Sens
itivi
ty a
nd m
ildne
ss
driv
en
Tot
al S
ampl
e
Number of respondents 97 104 86 204 155 180 826 % of total sample 12% 13% 10% 25% 19% 22% 100%

Appendix A-4: Cluster Names and Sizes
254
Korea
The Ward’s method
#1 #2 #3 #4
Clusters
Rat
iona
lists
Bra
nd g
lam
or d
riven
m
ains
tream
Onl
y br
and
attra
ctiv
enes
s driv
en
(ver
y lit
tle sk
in c
are
invo
lved
)
Goo
d qu
ality
at a
fair
pric
e
Tot
al S
ampl
e
Number of respondents 205 176 85 34 500 % of total sample 41% 35% 17% 7% 100%
The K-means method
#1 #2 #3 #4
Clusters
Rat
iona
lists
Goo
d qu
ality
at a
fa
ir pr
ice
Onl
y br
and
attra
ctiv
enes
s dr
iven
(ver
y lit
tle
skin
car
e in
volv
ed)
Hig
hly
dem
andi
ng
Tot
al S
ampl
e Number of respondents 115 58 91 236 500 % of total sample 23% 12% 18% 47% 100%
SOM
#1 #2 #3 #4 #5 #6
Clusters
Onl
y br
and
attra
ctiv
enes
s dr
iven
(ver
y lit
tle sk
in
care
invo
lved
)
Goo
d qu
ality
at a
fair
pric
e
Bra
nd g
lam
or d
riven
m
ains
tream
Rat
iona
lists
Rat
iona
l dem
andi
ng
Hig
hly
dem
andi
ng
Tot
al S
ampl
e
Number of respondents 77 70 76 69 129 79 500 % of total sample 15% 14% 15% 14% 26% 16% 100%

Appendix A-4: Cluster Names and Sizes
255
Philippines
The Ward’s method
#1 #2 #3 #4 #5
Clusters
Hig
hly
dem
andi
ng
Rat
iona
lists
Sens
itivi
ty a
nd
mild
ness
driv
en
Bra
nd g
lam
or d
riven
m
ains
tream
Goo
d qu
ality
at a
fair
pric
e
Tot
al S
ampl
e
Number of respondents 143 124 71 60 102 500 % of total sample 29% 25% 14% 12% 20% 100%
The K-means method
#1 #2 #3 #4
Clusters
Sens
itivi
ty a
nd
mild
ness
driv
en
Goo
d qu
ality
at a
fair
pric
e
Rat
iona
lists
Hig
hly
dem
andi
ng
Tot
al S
ampl
e Number of respondents 76 107 91 226 500 % of total sample 15% 21% 18% 45% 100%
SOM
#1 #2 #3 #4 #5
Clusters
Hig
hly
dem
andi
ng
Bra
nd g
lam
or d
riven
m
ains
tream
Rat
iona
lists
Goo
d qu
ality
at a
fa
ir pr
ice
Sens
itivi
ty a
nd
mild
ness
driv
en
Tot
al S
ampl
e
Number of respondents 148 104 130 75 43 500 % of total sample 30% 21% 26% 15% 9% 100%

Appendix A-4: Cluster Names and Sizes
256
Taiwan
The Ward’s method
#1 #2 #3 #4 #5
Clusters
Onl
y br
and
attra
ctiv
enes
s driv
en
(ver
y lit
tle sk
in c
are
invo
lved
)
Hig
hly
dem
andi
ng
Goo
d qu
ality
at a
fair
pric
e
Rat
iona
lists
Mod
erat
e le
vel o
f m
ildne
ss fr
om a
po
pula
r and
mod
ern
bran
d
Tot
al S
ampl
e
Number of respondents 62 178 97 55 112 504 % of total sample 12% 35% 19% 11% 22% 100%
The K-means method
#1 #2 #3 #4 #5
Clusters
Onl
y br
and
attra
ctiv
enes
s driv
en
(ver
y lit
tle sk
in c
are
invo
lved
)
Hig
hly
dem
andi
ng
Rat
iona
l dem
andi
ng
Mod
erat
e le
vel o
f m
ildne
ss fr
om a
po
pula
r and
mod
ern
bran
d
Goo
d qu
ality
at a
fair
pric
e
Tot
al S
ampl
e Number of respondents 133 124 57 127 63 504 % of total sample 26% 25% 11% 25% 13% 100%
SOM
#1 #2 #3 #4 #5
Clusters
Hig
hly
dem
andi
ng
Rat
iona
l dem
andi
ng
Goo
d qu
ality
at a
fair
pric
e
Onl
y br
and
attra
ctiv
enes
s driv
en
(ver
y lit
tle sk
in c
are
invo
lved
)
Sens
itivi
ty a
nd
mild
ness
driv
en
Tot
al S
ampl
e
Number of respondents 115 69 109 103 108 504 % of total sample 23% 14% 22% 20% 21% 100%

Appendix A-4: Cluster Names and Sizes
257
Thailand
The Ward’s method
#1 #2 #3 #4 #5
Clusters
Mod
erat
e le
vel o
f m
ildne
ss fr
om a
po
pula
r and
mod
ern
bran
d
Hig
hly
dem
andi
ng
Qua
lity
and
good
val
ue
for m
oney
from
a
stro
ng b
rand
Onl
y br
and
attra
ctiv
enes
s driv
en
(ver
y lit
tle sk
in c
are
invo
lved
)
Rat
iona
lists
Tot
al S
ampl
e
Number of respondents 223 299 220 65 193 1000 % of total sample 22% 30% 22% 7% 19% 100%
The K-means method
#1 #2 #3 #4 #5
Clusters
Hig
hly
dem
andi
ng
Qua
lity
and
good
va
lue
for m
oney
fr
om a
stro
ng b
rand
Onl
y br
and
attra
ctiv
enes
s driv
en
(ver
y lit
tle sk
in c
are
invo
lved
)
Mod
erat
e le
vel o
f m
ildne
ss fr
om a
po
pula
r and
mod
ern
bran
d
Rat
iona
lists
Tot
al S
ampl
e Number of respondents 380 146 85 134 255 1000 % of total sample 38% 15% 9% 13% 26% 100%
SOM
#1 #2 #3 #4 #5 #6
Clusters
Rat
iona
lists
Uni
nvol
ved
Qua
lity
and
good
val
ue
for m
oney
from
a st
rong
br
and
Rat
iona
l dem
andi
ng
Mod
erat
e le
vel o
f m
ildne
ss fr
om a
pop
ular
an
d m
oder
n br
and
Bra
nd g
lam
or d
riven
m
ains
tream
Tot
al S
ampl
e
Number of respondents 121 144 117 233 137 248 1000 % of total sample 12% 14% 12% 23% 14% 25% 100%

Appendix A-4: Cluster Names and Sizes
258
Australia
The Ward’s method
#1 #2 #3 #4 #5
Clusters
Sens
itivi
ty a
nd
mild
ness
driv
en
Hig
hly
dem
andi
ng
Goo
d qu
ality
at a
fair
pric
e
Rat
iona
lists
Onl
y br
and
attra
ctiv
enes
s driv
en
(ver
y lit
tle sk
in c
are
invo
lved
) Tot
al S
ampl
e
Number of respondents 109 190 93 114 75 581 % of total sample 19% 33% 16% 20% 13% 100%
The K-means method
#1 #2 #3 #4 #5
Clusters
Sens
itivi
ty a
nd
mild
ness
driv
en
Hig
hly
dem
andi
ng
Goo
d qu
ality
at a
fa
ir pr
ice
Onl
y br
and
attra
ctiv
enes
s driv
en
(ver
y lit
tle sk
in c
are
invo
lved
)
Rat
iona
lists
Tot
al S
ampl
e Number of respondents 102 168 89 61 161 581 % of total sample 18% 29% 15% 10% 28% 100%
SOM
#1 #2 #3 #4 #5
Clusters
Sens
itivi
ty a
nd
mild
ness
driv
en
Onl
y br
and
attra
ctiv
enes
s driv
en
(ver
y lit
tle sk
in c
are
invo
lved
)
Goo
d qu
ality
at a
fair
pric
e
Rat
iona
lists
Hig
hly
dem
andi
ng
Tot
al S
ampl
e
Number of respondents 85 94 87 132 183 581 % of total sample 15% 16% 15% 23% 31% 100%

Appendix A-4: Cluster Names and Sizes
259
Belgium
The Ward’s method
#1 #2 #3 #4 #5
Clusters
Onl
y br
and
attra
ctiv
enes
s driv
en
(ver
y lit
tle sk
in c
are
invo
lved
)
Hig
hly
dem
andi
ng
Sens
itivi
ty a
nd
mild
ness
driv
en
Rat
iona
lists
Goo
d qu
ality
at a
fair
pric
e
Tot
al S
ampl
e
Number of respondents 45 170 32 32 93 372 % of total sample 12% 46% 9% 9% 25% 100%
The K-means method
#1 #2 #3 #4
Clusters
Rat
iona
lists
Hig
hly
dem
andi
ng
Sens
itivi
ty a
nd
mild
ness
driv
en
Onl
y br
and
attra
ctiv
enes
s driv
en
(ver
y lit
tle sk
in c
are
invo
lved
) Tot
al S
ampl
e Number of respondents 53 183 58 78 372 % of total sample 14% 49% 16% 21% 100%
SOM
#1 #2 #3 #4 #5 #6 #7
Clusters
Bra
nd g
lam
or d
riven
m
ains
tream
Hig
hly
dem
andi
ng
Rat
iona
l dem
andi
ng
Sens
itivi
ty a
nd m
ildne
ss
driv
en
Rat
iona
lists
Goo
d qu
ality
at a
fair
pric
e
Onl
y br
and
attra
ctiv
enes
s dr
iven
(ver
y lit
tle sk
in
care
invo
lved
)
Tot
al S
ampl
e
Number of respondents 34 72 75 36 66 36 53 372 % of total sample 9% 19% 20% 10% 18% 10% 14% 100%
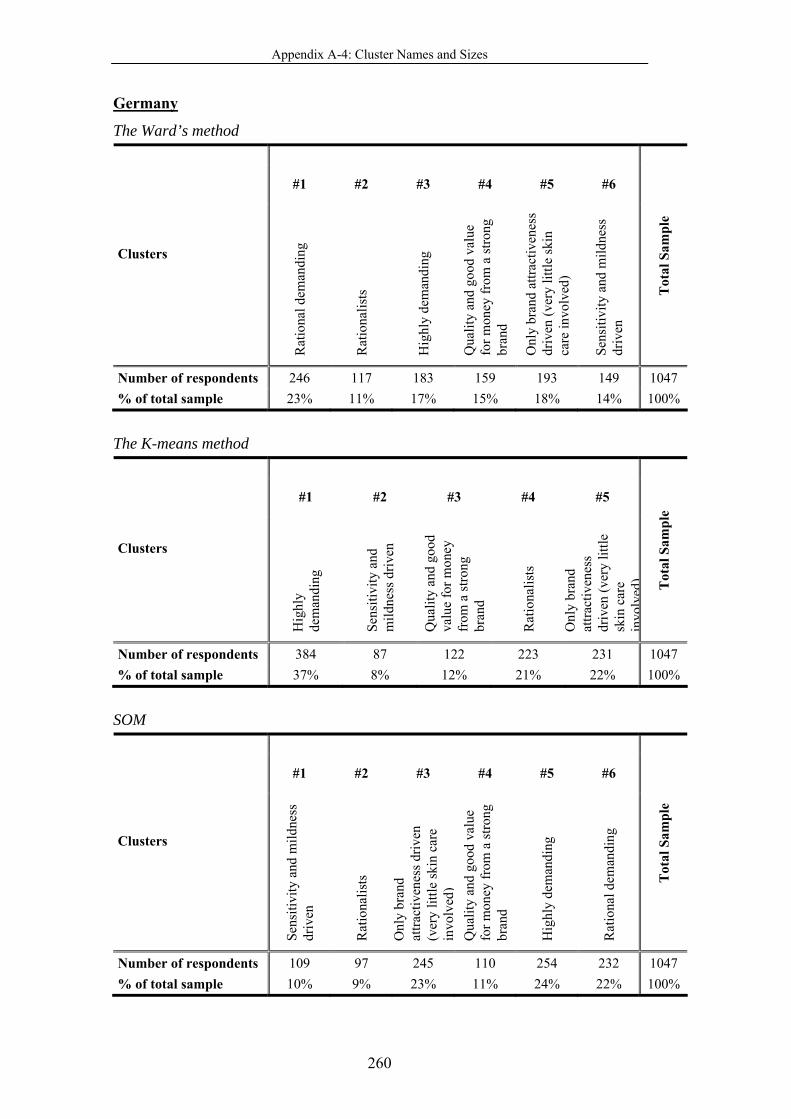
Appendix A-4: Cluster Names and Sizes
260
Germany
The Ward’s method
#1 #2 #3 #4 #5 #6
Clusters
Rat
iona
l dem
andi
ng
Rat
iona
lists
Hig
hly
dem
andi
ng
Qua
lity
and
good
val
ue
for m
oney
from
a st
rong
br
and
Onl
y br
and
attra
ctiv
enes
s dr
iven
(ver
y lit
tle sk
in
care
invo
lved
)
Sens
itivi
ty a
nd m
ildne
ss
driv
en
Tot
al S
ampl
e
Number of respondents 246 117 183 159 193 149 1047 % of total sample 23% 11% 17% 15% 18% 14% 100%
The K-means method
#1 #2 #3 #4 #5
Clusters
Hig
hly
de
man
ding
Sens
itivi
ty a
nd
mild
ness
driv
en
Qua
lity
and
good
va
lue
for m
oney
fr
om a
stro
ng
bran
d
Rat
iona
lists
Onl
y br
and
attra
ctiv
enes
s dr
iven
(ver
y lit
tle
skin
car
e in
volv
ed) Tot
al S
ampl
e Number of respondents 384 87 122 223 231 1047 % of total sample 37% 8% 12% 21% 22% 100%
SOM
#1 #2 #3 #4 #5 #6
Clusters
Sens
itivi
ty a
nd m
ildne
ss
driv
en
Rat
iona
lists
Onl
y br
and
attra
ctiv
enes
s driv
en
(ver
y lit
tle sk
in c
are
invo
lved
) Q
ualit
y an
d go
od v
alue
fo
r mon
ey fr
om a
stro
ng
bran
d
Hig
hly
dem
andi
ng
Rat
iona
l dem
andi
ng
Tot
al S
ampl
e
Number of respondents 109 97 245 110 254 232 1047 % of total sample 10% 9% 23% 11% 24% 22% 100%

Appendix A-4: Cluster Names and Sizes
261
Italy
The Ward’s method
#1 #2 #3 #4
Clusters
Onl
y br
and
attra
ctiv
enes
s dr
iven
(ver
y lit
tle
skin
car
e in
volv
ed)
Hig
hly
dem
andi
ng
Goo
d qu
ality
at a
fa
ir pr
ice
Rat
iona
lists
Tot
al S
ampl
e
Number of respondents 147 162 112 100 521 % of total sample 28% 31% 21% 19% 100%
The K-means method
#1 #2 #3 #4
Clusters
Onl
y br
and
attra
ctiv
enes
s driv
en
(ver
y lit
tle sk
in c
are
invo
lved
)
Rat
iona
lists
Goo
d qu
ality
at a
fair
pric
e
Hig
hly
dem
andi
ng
Tot
al S
ampl
e
Number of respondents 109 147 65 200 521 % of total sample 21% 28% 12% 38% 100%
SOM
#1 #2 #3 #4 #5
Clusters
Onl
y br
and
attra
ctiv
enes
s dr
iven
(ver
y lit
tle sk
in c
are
invo
lved
)
Bra
nd g
lam
or d
riven
m
ains
tream
Rat
iona
l dem
andi
ng
Goo
d qu
ality
at a
fair
pric
e
Rat
iona
lists
Tot
al S
ampl
e
Number of respondents 87 125 83 118 108 521 % of total sample 17% 24% 16% 23% 21% 100%

Appendix A-4: Cluster Names and Sizes
262
Netherlands
The Ward’s method
#1 #2 #3 #4 #5
Clusters
Hig
hly
dem
andi
ng
Onl
y br
and
attra
ctiv
enes
s dr
iven
(ver
y lit
tle
skin
car
e in
volv
ed)
Rat
iona
lists
Sens
itivi
ty a
nd
mild
ness
driv
en
Goo
d qu
ality
at a
fa
ir pr
ice Tot
al S
ampl
e
Number of respondents 138 125 126 54 48 491 % of total sample 28% 25% 26% 11% 10% 100%
The K-means method
#1 #2 #3 #4
Clusters
Rat
iona
lists
Goo
d qu
ality
at a
fair
pric
e
Sens
itivi
ty a
nd
mild
ness
driv
en
Hig
hly
dem
andi
ng
Tot
al S
ampl
e
Number of respondents 143 95 76 177 491 % of total sample 29% 19% 15% 36% 100%
SOM
#1 #2 #3 #4 #5 #6
Clusters
Hig
hly
dem
andi
ng
Rat
iona
l dem
andi
ng
Onl
y br
and
attra
ctiv
enes
s dr
iven
(ver
y lit
tle sk
in
care
invo
lved
)
Goo
d qu
ality
at a
fair
pric
e
Sens
itivi
ty a
nd m
ildne
ss
driv
en
Rat
iona
lists
Tot
al S
ampl
e
Number of respondents 93 113 70 43 97 75 491 % of total sample 19% 23% 14% 9% 20% 15% 100%

Appendix A-4: Cluster Names and Sizes
263
Spain
The Ward’s method
#1 #2 #3 #4 #5
Clusters
Uni
nvol
ved
Rat
iona
lists
Bra
nd g
lam
or d
riven
m
ains
tream
Hig
hly
dem
andi
ng
Goo
d qu
ality
at a
fair
pric
e
Tot
al S
ampl
e
Number of respondents 117 135 204 241 58 755 % of total sample 15% 18% 27% 32% 8% 100%
The K-means method
#1 #2 #3 #4
Clusters
Onl
y br
and
attra
ctiv
enes
s driv
en
(ver
y lit
tle sk
in c
are
invo
lved
)
Rat
iona
lists
Hig
hly
dem
andi
ng
Goo
d qu
ality
at a
fair
pric
e
Tot
al S
ampl
e Number of respondents 186 161 344 64 755 % of total sample 25% 21% 46% 8% 100%
SOM
#1 #2 #3 #4 #5 #6 #7
Clusters
Rat
iona
l dem
andi
ng
Hig
hly
dem
andi
ng
Goo
d qu
ality
at a
fair
pric
e
Bra
nd g
lam
or d
riven
m
ains
tream
Rat
iona
lists
Uni
nvol
ved
Onl
y br
and
attra
ctiv
enes
s dr
iven
(ver
y lit
tle sk
in c
are
invo
lved
) Tot
al S
ampl
e
Number of respondents 180 110 117 140 87 62 59 755 % of total sample 24% 15% 15% 19% 12% 8% 8% 100%
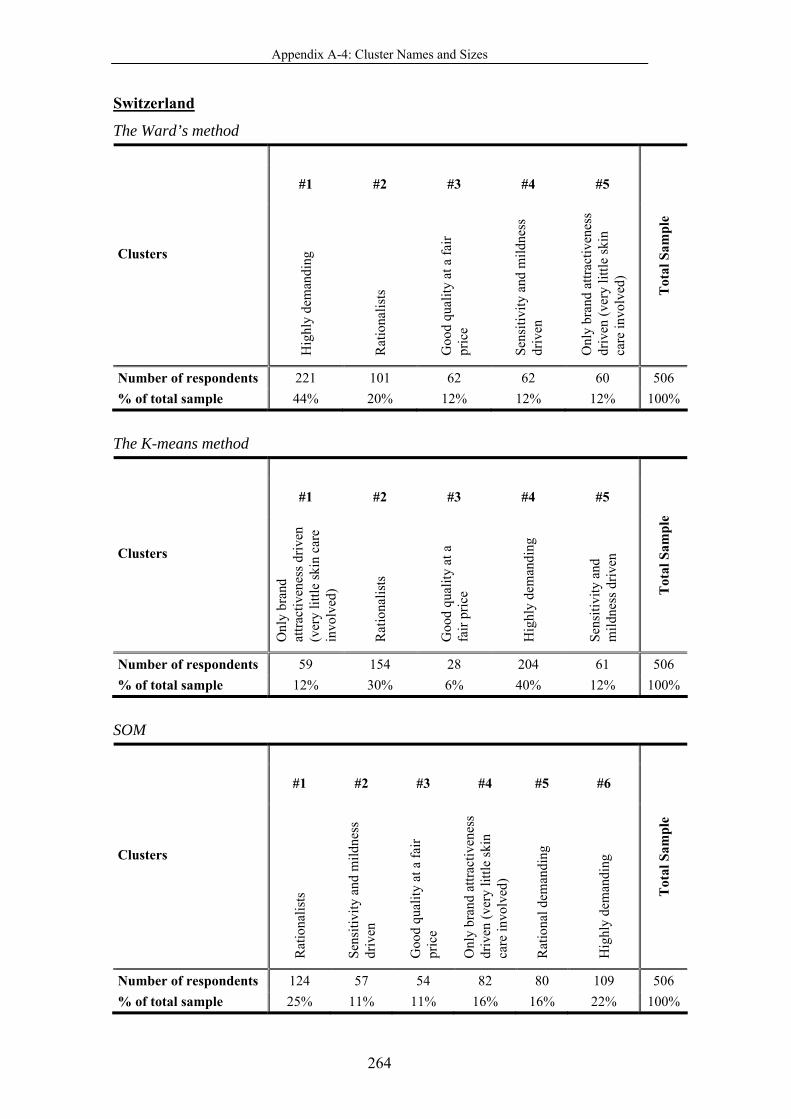
Appendix A-4: Cluster Names and Sizes
264
Switzerland
The Ward’s method
#1 #2 #3 #4 #5
Clusters
Hig
hly
dem
andi
ng
Rat
iona
lists
Goo
d qu
ality
at a
fair
pric
e
Sens
itivi
ty a
nd m
ildne
ss
driv
en
Onl
y br
and
attra
ctiv
enes
s dr
iven
(ver
y lit
tle sk
in
care
invo
lved
)
Tot
al S
ampl
e
Number of respondents 221 101 62 62 60 506 % of total sample 44% 20% 12% 12% 12% 100%
The K-means method
#1 #2 #3 #4 #5
Clusters
Onl
y br
and
attra
ctiv
enes
s driv
en
(ver
y lit
tle sk
in c
are
invo
lved
)
Rat
iona
lists
Goo
d qu
ality
at a
fa
ir pr
ice
Hig
hly
dem
andi
ng
Sens
itivi
ty a
nd
mild
ness
driv
en
Tot
al S
ampl
e Number of respondents 59 154 28 204 61 506 % of total sample 12% 30% 6% 40% 12% 100%
SOM
#1 #2 #3 #4 #5 #6
Clusters
Rat
iona
lists
Sens
itivi
ty a
nd m
ildne
ss
driv
en
Goo
d qu
ality
at a
fair
pric
e
Onl
y br
and
attra
ctiv
enes
s dr
iven
(ver
y lit
tle sk
in
care
invo
lved
)
Rat
iona
l dem
andi
ng
Hig
hly
dem
andi
ng
Tot
al S
ampl
e
Number of respondents 124 57 54 82 80 109 506 % of total sample 25% 11% 11% 16% 16% 22% 100%

Appendix A-4: Cluster Names and Sizes
265
Russia
The Ward’s method
#1 #2 #3 #4 #5
Clusters
Rat
iona
lists
Hig
hly
dem
andi
ng
Sens
itivi
ty a
nd
mild
ness
driv
en
Bra
nd g
lam
or d
riven
m
ains
tream
Goo
d qu
ality
at a
fair
pric
e
Tot
al S
ampl
e
Number of respondents 328 443 200 187 42 1200 % of total sample 27% 37% 17% 16% 4% 100%
The K-means method
#1 #2 #3 #4 #5
Clusters
Sens
itivi
ty a
nd m
ildne
ss
driv
en
Goo
d qu
ality
at a
fair
pric
e
Onl
y br
and
attra
ctiv
enes
s driv
en
(ver
y lit
tle sk
in c
are
invo
lved
)
Rat
iona
lists
Hig
hly
dem
andi
ng
Tot
al S
ampl
e Number of respondents 60 147 107 416 470 1200 % of total sample 5% 12% 9% 35% 39% 100%
SOM
#1 #2 #3 #4 #5
Clusters
Sens
itivi
ty a
nd
mild
ness
driv
en
Goo
d qu
ality
at a
fair
pric
e
Rat
iona
lists
Bra
nd g
lam
or d
riven
m
ains
tream
Hig
hly
dem
andi
ng
Tot
al S
ampl
e
Number of respondents 84 223 412 171 310 1200 % of total sample 7% 19% 34% 14% 26% 100%

Appendix A-4: Cluster Names and Sizes
266
Denmark
The Ward’s method
#1 #2 #3 #4 #5
Clusters
Sens
itivi
ty a
nd
mild
ness
driv
en
Uni
nvol
ved
Bra
nd g
lam
or
driv
en m
ains
tream
Rat
iona
lists
Hig
hly
dem
andi
ng
Tot
al S
ampl
e
Number of respondents 80 63 85 106 66 400 % of total sample 20% 16% 21% 27% 17% 100%
The K-means method
#1 #2 #3 #4
Clusters
Sens
itivi
ty a
nd m
ildne
ss
driv
en
Uni
nvol
ved
Rat
iona
lists
Bra
nd g
lam
or d
riven
m
ains
tream
Tot
al S
ampl
e Number of respondents 92 68 127 113 400 % of total sample 23% 17% 32% 28% 100%
SOM
#1 #2 #3 #4 #5
Clusters
Sens
itivi
ty a
nd
mild
ness
driv
en
Uni
nvol
ved
Rat
iona
lists
Bra
nd g
lam
or d
riven
m
ains
tream
Hig
hly
dem
andi
ng
Tot
al S
ampl
e
Number of respondents 60 74 125 63 78 400 % of total sample 15% 19% 31% 16% 20% 100%

Appendix A-4: Cluster Names and Sizes
267
Norway
The Ward’s method
#1 #2 #3 #4 #5
Clusters
Rat
iona
lists
Onl
y br
and
attra
ctiv
enes
s driv
en
(ver
y lit
tle sk
in c
are
invo
lved
)
Goo
d qu
ality
at a
fa
ir pr
ice
Hig
hly
dem
andi
ng
Sens
itivi
ty a
nd
mild
ness
driv
en
Tot
al S
ampl
e
Number of respondents 148 60 43 56 59 366 % of total sample 40% 16% 12% 15% 16% 100%
The K-means method
#1 #2 #3 #4 #5
Clusters
Rat
iona
lists
Goo
d qu
ality
at a
fair
pric
e
Onl
y br
and
attra
ctiv
enes
s driv
en
(ver
y lit
tle sk
in c
are
invo
lved
)
Sens
itivi
ty a
nd
mild
ness
driv
en
Hig
hly
dem
andi
ng
Tot
al S
ampl
e Number of respondents 106 62 38 60 100 366 % of total sample 29% 17% 10% 16% 27% 100%
SOM
#1 #2 #3 #4 #5 #6
Clusters
Rat
iona
l dem
andi
ng
Hig
hly
dem
andi
ng
Rat
iona
lists
Goo
d qu
ality
at a
fair
pric
e
Sens
itivi
ty a
nd m
ildne
ss
driv
en
Onl
y br
and
attra
ctiv
enes
s dr
iven
(ver
y lit
tle sk
in c
are
invo
lved
)
Tot
al S
ampl
e
Number of respondents 34 86 97 45 69 35 366 % of total sample 9% 23% 27% 12% 19% 10% 100%
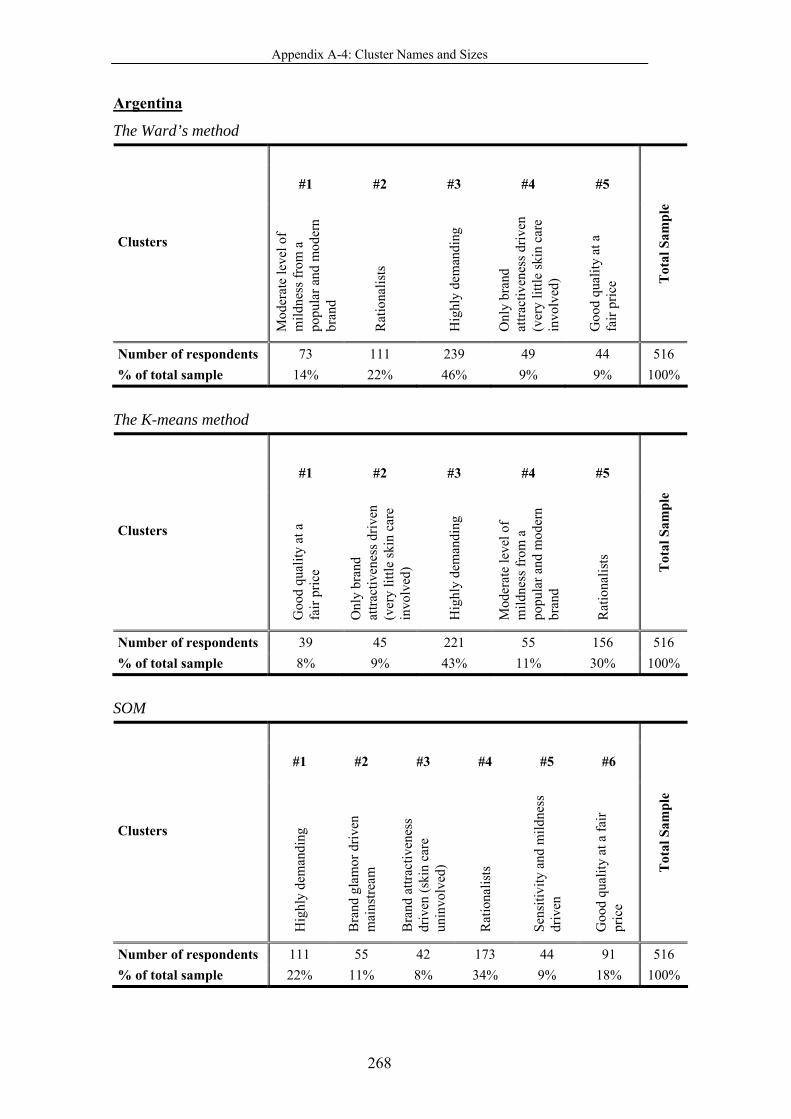
Appendix A-4: Cluster Names and Sizes
268
Argentina
The Ward’s method
#1 #2 #3 #4 #5
Clusters
Mod
erat
e le
vel o
f m
ildne
ss fr
om a
po
pula
r and
mod
ern
bran
d
Rat
iona
lists
Hig
hly
dem
andi
ng
Onl
y br
and
attra
ctiv
enes
s driv
en
(ver
y lit
tle sk
in c
are
invo
lved
)
Goo
d qu
ality
at a
fa
ir pr
ice T
otal
Sam
ple
Number of respondents 73 111 239 49 44 516 % of total sample 14% 22% 46% 9% 9% 100%
The K-means method
#1 #2 #3 #4 #5
Clusters
Goo
d qu
ality
at a
fa
ir pr
ice
Onl
y br
and
attra
ctiv
enes
s driv
en
(ver
y lit
tle sk
in c
are
invo
lved
)
Hig
hly
dem
andi
ng
Mod
erat
e le
vel o
f m
ildne
ss fr
om a
po
pula
r and
mod
ern
bran
d
Rat
iona
lists
Tot
al S
ampl
e Number of respondents 39 45 221 55 156 516 % of total sample 8% 9% 43% 11% 30% 100%
SOM
#1 #2 #3 #4 #5 #6
Clusters
Hig
hly
dem
andi
ng
Bra
nd g
lam
or d
riven
m
ains
tream
Bra
nd a
ttrac
tiven
ess
driv
en (s
kin
care
un
invo
lved
)
Rat
iona
lists
Sens
itivi
ty a
nd m
ildne
ss
driv
en
Goo
d qu
ality
at a
fair
pric
e
Tot
al S
ampl
e
Number of respondents 111 55 42 173 44 91 516 % of total sample 22% 11% 8% 34% 9% 18% 100%

Appendix A-4: Cluster Names and Sizes
269
Paraguay
The Ward’s method
#1 #2 #3 #4
Clusters
Sens
itivi
ty a
nd
mild
ness
driv
en
Hig
hly
dem
andi
ng
Rat
iona
lists
Goo
d qu
ality
at a
fair
pric
e
Tot
al S
ampl
e
Number of respondents 29 192 128 53 402 % of total sample 7% 48% 32% 13% 100%
The K-means method
#1 #2 #3 #4
Clusters
Uni
nvol
ved
Rat
iona
lists
Goo
d qu
ality
at a
fair
pric
e
Hig
hly
dem
andi
ng
Tot
al S
ampl
e Number of respondents 39 125 19 219 402 % of total sample 10% 31% 5% 54% 100%
SOM
#1 #2 #3 #4 #5 #6
Clusters
Hig
hly
dem
andi
ng
Rat
iona
l dem
andi
ng
Bra
nd g
lam
or d
riven
m
ains
tream
Sens
itivi
ty a
nd m
ildne
ss
driv
en
Rat
iona
lists
Goo
d qu
ality
at a
fair
pric
e
Tot
al S
ampl
e
Number of respondents 116 102 63 29 69 23 402 % of total sample 29% 25% 16% 7% 17% 6% 100%

Appendix A-4: Cluster Names and Sizes
270
Venezuela
The Ward’s method
#1 #2 #3 #4
Clusters
Hig
hly
dem
andi
ng
Qua
lity
and
good
va
lue
for m
oney
from
a
stro
ng b
rand
Rat
iona
lists
Onl
y br
and
attra
ctiv
enes
s driv
en
(ver
y lit
tle sk
in c
are
invo
lved
) Tot
al S
ampl
e
Number of respondents 368 162 167 103 800 % of total sample 46% 20% 21% 13% 100%
The K-means method
#1 #2 #3 #4
Clusters
Rat
iona
lists
Hig
hly
dem
andi
ng
Goo
d qu
ality
at a
fair
pric
e
Onl
y br
and
attra
ctiv
enes
s driv
en
(ver
y lit
tle sk
in c
are
invo
lved
) Tot
al S
ampl
e Number of respondents 154 497 75 74 800 % of total sample 19% 62% 9% 9% 100%
SOM
#1 #2 #3 #4 #5 #6
Clusters
Rat
iona
lists
Goo
d qu
ality
at a
fair
pric
e
Onl
y br
and
attra
ctiv
enes
s dr
iven
(ver
y lit
tle sk
in
care
invo
lved
)
Rat
iona
l dem
andi
ng
Bra
nd g
lam
or d
riven
m
ains
tream
Hig
hly
dem
andi
ng
Tot
al S
ampl
e
Number of respondents 130 54 92 159 154 211 800 % of total sample 16% 7% 12% 20% 19% 26% 100%