Embed Size (px)
Citation preview
Methodological Framework for the analysis and development of a sustainable, integrated, regional energy plan – A French
region case study1 Atom Mirakyana, Dr. Laurent LELAITb, Nikolai Khomenkoc, Igor Kaikovd
a,b,c,d, European Institute for Energy Research, Karlsruhe, Germany Corresponding author: "Atom Mirakyan" < [email protected]>
Because of some changes of energy market particularly uncertainties in the future energy and environmental related issues, the deregulation of national energy sectors and national or international increasing environmental restrictions etc the regional energy planning process became complex. Consequently there is a need to be proactive to develop long term, regional, sustainable energy concept and not simply respond to random growth patterns and there is a need for new planning methodologies and tools in order to propose solutions.
This paper presents a methodological framework, which combines narrative and modeling approaches. This framework gives an opportunity to evaluate alternative pathways and analyze potential outcomes taking into account technical, social, environmental, economic and specific regional aspects. The planning methodology has different phases, steps with iterations and feedback loops. The methodology is oriented towards real applications rather than theoretical discussion. However, the modules and steps of underlying conceptual methodology are explained before the application in the French region.
Methods, tools, and case study presented here are a framework for supporting the discussion and an opportunity for a creative engagement to develop integrated energy concept with different strategies and scenarios.
The most important tools and methods of this modular package are OTSM-TRIZ (The General Theory of Powerful Thinking and Theory of Inventive Problem Solving), LEAP (Long range Energy Alternatives Planning System) and DAM (Decision Analysis Module).
Keywords: Modeling, Regional integrated energy planning (RIEP), OTSM-TRIZ, LEAP, DAM
Content 1 Some results and data are not presented in the publication because of confidential status of these data.
1. Introduction ............................................................................................................................ 3 2. RIEP planning methodology .................................................................................................. 3 3. PHASE I: Preparation and orientation................................................................................... 4
3.1 Objective of Phase I ........................................................................................................ 4 3.2 Sequence of Analysis...................................................................................................... 4 3.3 Underlying Methodologies or tools.................................................................................. 5 3.4 Application in region PACA............................................................................................. 5
3.4.1 Chosen Methodology............................................................................................... 5 3.4.2 Involve the most important stakeholders, experts making possible for them to understand the situation, problems, to learn different interest of different parties............ 5 3.4.3 Analyze the initial (historical and present) situation................................................. 5 3.4.4 Develop pictures of problem networks with existing or potential solutions,............. 5 3.4.5 Propose goals or most desirable result and evaluation/target aspects or parameters........................................................................................................................ 6 3.4.6 Describe the barriers which hinder to reach the goals ............................................ 7
3.5 Conclusion of Phase I ..................................................................................................... 7 4. PHASE II: Detailed analysis and design of regional model................................................... 8
4.1 Objective ......................................................................................................................... 8 4.2 Sequence of Analysis...................................................................................................... 8 4.3 Underlying methodology ................................................................................................. 8 4.4 Application in region PACA............................................................................................. 9
4.4.1 Chosen underling methodology and tools ............................................................... 9 4.4.2 Define aggregation level of analysis ........................................................................ 9 4.4.3 Set up reference energy system (RES) ................................................................. 12 4.4.4 Collect data and information (the analysis require physical, economic, environmental data and qualitative information)............................................................. 14 4.4.5 Analysis of historical tendency and current situation matching supply and demand side.................................................................................................................................. 15 4.4.6 Compile hypotheses, Model likely development reference scenario..................... 16 4.4.7 Sensitivity analysis................................................................................................. 17
4.5 Conclusion of phase II................................................................................................... 19 5. PHASE III Prioritization and decision .................................................................................. 19
5.1 Objectives of Phase III .................................................................................................. 19 5.2 Sequence of analysis .................................................................................................... 19 5.3 Underlining methodology .............................................................................................. 19 5.5 Application in region PACA........................................................................................... 19
5.5.1 Chosen methodologies .......................................................................................... 19 5.5.2 Sequence of analysis for the region ...................................................................... 20
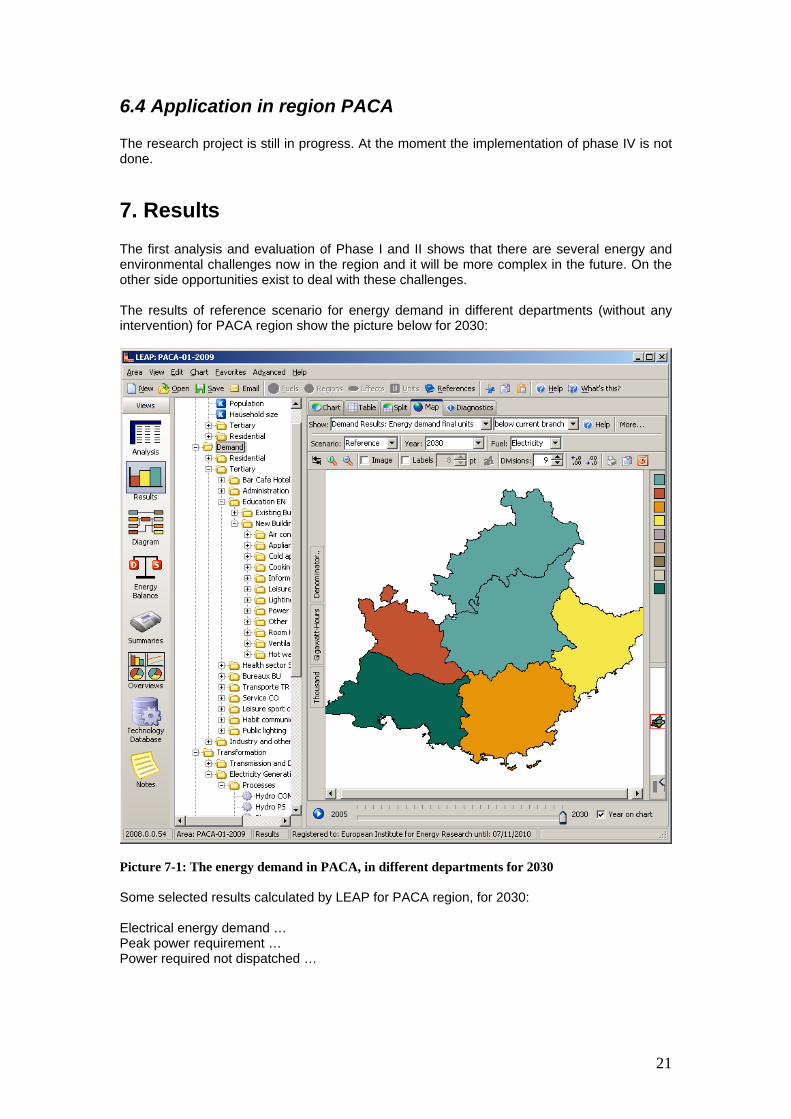
6. PHASE IV Implementation and monitoring ......................................................................... 20 6.1 Objectives of phase IV .................................................................................................. 20 6.2 Sequence of analysis .................................................................................................... 20 6.3 Underlining methodologies............................................................................................ 20 6.4 Application in region PACA........................................................................................... 21
7. Results................................................................................................................................. 21 7.1 Supply side.................................................................................................................... 22 7.2 Demand side ................................................................................................................. 22
8. Conclusion and future research........................................................................................... 22 Appendix.................................................................................................................................. 24 References .............................................................................................................................. 26
2
1. Introduction Integrated energy planning (IEP) was a concept first developed in the 1970s in response to the oil crises as a perceived means of increasing energy diversity and decreasing dependence on foreign oil. Different methodologies of IEP have been used: Integrated Resource Planning (IRP), Integrated Assessment of Supply- and Demand-Side Options (IASDO) or Least -Cost Planning (LCP), mostly at national level. The classical definition following, IRP is long-term energy planning with the goal of comparing the entire resources existence with the prognosticated total requirement energy services to minimum costs, where public consultation occurring only as a last step, when plans are complete [1], [2]. After deregulation of energy markets splitting the generation, transmission and distribution activities, following trends are to see:
• Growing awareness of communities about the environmental impacts • Many decision makers with different interest and preferences take part in the
planning process • Growing interests to use distributed generation technologies based upon
renewable resources and small cogeneration systems. • The energy planning activities as regional concerned instead of national.
Also the planning approaches and tools have been changed and adapted after reorganization of energy markets. IEP is still as an important instrument to specify main regional strategies for sustainable development considering longer-term aspects of energy supply, diversification of energy sources, DSM actions, environmental issues etc. especially at regional level. On the other hand after liberalization of energy markets there is a need to be proactive to develop long term, regional, sustainable energy concept and not simply respond to random growth patterns. This paper proposes a systematic methodological approach RIEP (regional integrated energy planning) to assist the planning process and to analyze alternative context and potential outcomes using different narrative and modeling methods. RIEP can be considered as the next generation of IEP at regional level under liberalized energy market conditions. Three of four phases of RIEP methodology are already applied in case study in the French region PACA (Provence – Alps – Côte d’Azur) at this stage of research. The next section describes the general context of RIEP methodology. The third, fourth, fifth and sixth section describes the proposed RIEP Phases, steps with application in PACA region. The results are presented in seventh section. The last section presents conclusions and future research.
2. RIEP planning methodology RIEP is an approach to find environmentally friendly, institutionally sound, socially acceptable and cost–effective solutions of the best mix of energy supply and demand options for a defined region in order to support long–term regional sustainable development. It is an opportunity for energy planners to present complex, uncertain issues in a structured, holistic and transparent way for interested parties to assess, understand and provide input to planning decisions [3]. RIEP is rather an open process with many decision makers with different interests and preferences, than a well defined single project. The public consultations etc. have the possibility to be involved in the planning process at the very beginning. The planning process is cyclic process as linear, since feedback-loops as well as omitting phases and small cycles of the total process are possible. The figure below shows the whole dynamics of RIEP. Since different phases and steps are interlinked, the steps are not necessarily sequential, and often require iteration. The steps reflect the working steps, the decision-making process etc. The selection of steps can vary from a situation to a situation and from the problem-goal relation. RIEP can be divided into four phases. Different narrative
3

or modeling methods and tools are used in this study. In the Phase I OTSM-TRIZ, in the Phase II LEAP, in the Phase III DAM have been implemented. The development of integrated plan is finished mainly in the phase III therefore the research focus is primary in the first tree phases.
Fig. 2-1: General overview of RIEP procedures
3. PHASE I: Preparation and orientation
3.1 Objective of Phase I The main objectives in Phase I are to analyze the initial situation, define the initial problems and goals, involve and help interested participants to understand the planning issues and to understand each other better. As it is the iterative process, the goals, problems etc. can be reformulated, improved and defined again.
3.2 Sequence of Analysis Following steps for analysis are proposed in Phase I
• Involve the most important stakeholders, experts in the planning process making possible for them to understand the situation, problems, to learn different interests of different parties
• Analyze the initial (historical and present) situation • Develop network of problems with existing or potential solutions • Propose the goals or most desirable result and the evaluation aspects and the
parameters • Describe the barriers, which hinder to reach the goals
4

3.3 Underlying Methodologies or tools In the traditional energy planning there is no specific narrative or modeling tools used in this phase yet. In some studies business management tools like SMART (Specific, Measurable, Achievable, Relevant, Time-bound) or SWOT (Strengths, Weaknesses, Opportunities, Threats) analysis have been used [4], [5].
3.4 Application in region PACA
3.4.1 Chosen Methodology OTSM-TRIZ have been chosen for the analysis here, as it reflects the sequence of analysis in the best way, also it can assess the whole planning process, making not only possible to implement, combine different standard solutions but also to find the innovative solutions going behind the mental inertia of stakeholders and planning participants supporting learning process [see more in Appendix A]. It improves and provides the quality of decision making and collective learning.
3.4.2 Involve the most important stakeholders, experts making possible for them to understand the situation, problems, to learn different interest of different parties There are two workshops or electronic meetings proposed to organize with the most of regional and national stakeholders and interested parties. One workshop is in the phase I the next stockholders workshop is in the phase III. It is important in these workshops to assess scopes, to find out the interests and preferences of all participants making a preference list or diagram. Direct assessment method on a 0 – 1 scale (e.g. 1.0 for best scope, 0.5 second best, the third for 0.25 and 0.12 for fourth etc.), or linear/nonlinear functions for objective measures can be used depending how intensive the stakeholders will be involved in the process. The workshops are proposed to organize in the next few months.
3.4.3 Analyze the initial (historical and present) situation The “Unbundling” decentralization production from transmission, and distribution from transmission has not made it easy to solve the problems in the region because in the long view there is a need for an integrated concept “from resources till energy use” for regions. Also for PACA region could be the same situation. There are also deeper needs for the innovative and systematic approaches for energy analysis. Alternative pathways in an integrated concept are very important if the region is to adequately balance its energy needs with other economic, social, environmental, and land use interests, especially with a growing population, uncertainties of availability of energy recourses and economy change. More see [6], [7].
3.4.4 Develop pictures of problem networks with existing or potential solutions, The energy and environmental related problems in the region are very complex. The development of problems (P) and the existing partial solution (PS) network helped to identify, classify and to reduce considerable amount of problems to be solved. The problems can be classified in many ways; also there is a need for systematic analysis, understanding and redefining the problems. Here is a summary some of problems according to the energy generation, transmission, energy demand etc.
5

3.4.4.1 General (P) = Problem, (PS)=Partial solution (P) Due to liberalization of electricity market, the market itself is responsible for energy Generation etc. in the long term. That is: the responsibility of investment in the long term generating capacity left only to the market. (P) The decentralization of energy markets has made the regional energy planning more interactive. Different participants with different interests and preferences take part in the regional energy planning process. (P) After changing the paradigm from centralized energy planning to decentralized energy planning there are problems to use and adapt aggregated data on regional conditions, which are mostly available at national level or are confidential.
3.4.4.2 Resources (P) Over half of the needed regional energy has to be imported (P) There are no fossil resources in PACA region available (P) There is a need for more close research of potentials and diffusion of local energy recourses to the existing energy system in the long view. (PS) The rapid development of using renewable energy recourses particularly PV and wind power
3.4.4.3 Generation/conversion (P) Because of the lack of suitable sites difficulties in transporting gas and the lack of cooling water, the possibilities for building high capacity plants are limited in the east of the region [7]. (P) It is not certain what will become of the existing capacity for electricity generation produced ca 350 MW by power plants which were constructed in the sixties and seventies [7]. (P) Hydroelectrically power plants produce about 30 % of energy demand. The availability of these facilities is fluctuated due to seasonal changes and environmental constrains: e.g. limits on the amounts of fresh water etc. [7]
3.4.4.4 Energy demand http://www.securite-electrique-paca.fr/, http://www.planecoenergie.org/ (P) Energy demand is very heterogenic in the region. (P) The energy use is very sensitive to the climate conditions 200 MW/°C in winter, 60 MW/°C in summer [7] (PS) The Eco – Energy Plan comprises a very large DSM project. The establishment an internet-site/platform etc. http://www.planecoenergie.org/
3.4.4.5 Transmission and distribution (P) Almost on all high, medium and low voltage level exist network problems due to environmental constrains: protected area, fire etc. . One of the largest problem to remind here is the loss of the 400 kV Néoules – Broc Carros line [6], [7], [8]. (PS) Supply can be maintained for only priority consumers (hospitals etc.).
3.4.5 Propose goals or most desirable result and evaluation/target aspects or parameters The goals or most desirable result (MDR) for PACA region are based on the preferences and interested of stakeholders and participants, on international, national or regional energy and environment related rules, directives etc. As the research project is still in progress the list of
6
preferences of all interested parties is not complete. Basically the goals are, as it defined before for RIEP, to develop environmentally friendly, institutionally sound, socially acceptable and cost – effective solutions of the best mix of energy supply and demand options for the region in order to support long – term regional sustainable development. The initial definition of goals are more qualitative, after iterations the goals or most desirable result can be reformulated precisely and quantified and specified for the region. The developed objectives, evaluation/target parameters will be used in the phase III for the prioritization of different alternatives. The initial evaluation aspects are technical security, environmental friendliness (CO2 emissions, keep natural hydraulic balance of rivers etc.), social/institutional acceptance, economic effectiveness and a time schedule.
3.4.6 Describe the barriers which hinder to reach the goals The barriers can be defined exactly after the definition and specification of the most desirable results of stakeholders and participants. The table below demonstrates initial barriers or potential conflicts of some existing or potential partial or standard solutions. Table 3-1: Initial barriers or potential conflicts of some existing or proposed standard solution Partial or potential solutions
Technical barrier
Environmental barrier
Economic barrier
Social, institutional
barrier
Schedule barrier
Increasing the use of existing hydropower production
X X X?
Construct new thermal power plants in east PACA
X X? X?
Construct new transmission lines
X X
Increase the installation of PV, wind or other DG
X For wind X
X?
DSM measures, load management
X? X
… X = direct barriers, X? = potential barriers After precise analysis the barriers can be changed or expanded.
3.5 Conclusion of Phase I As the RIEP is multi carrier (electricity, gas etc.) multi sectoral (household, tertiary etc.) energy planning which takes into account the different aspects of environment, technical feasibility etc. it is not only complex but also very data intensive therefore a systematic and detailed preparation gives a significant improvement to the planning process. As the planning is iterative the goals, problems etc. will be reformulated again. On the base of this information it will be possible to fix the aggregation level of analysis more accurate: time, a geographical etc. resolution in the phase II. The identification of most important evaluation parameters, barriers etc. at the early stages of analysis avoid unnecessary efforts e.g. collection of not
7
necessarily data, consideration of aspects which are not relevant for solving the problems. Involvement of different stakeholders and interested parties at the early stages makes the planning successful. The phase II based on the results of Phase I e.g. beginning with most significant aspect and iteratively expand the research. Developing scenarios or to chose most relevant parameters for sensitivity analysis in Phase III base also on this preparation.
4. PHASE II: Detailed analysis and design of regional model
4.1 Objective On the base of the analysis and results of Phase I, the focus of analysis here is modeling of regional energy system: define the aggregation level of analysis, collect information required for analysis, fix reference year and develop reference scenario, make a sensitivity analysis, develop and evaluate the systematic changes and impacts resulting from scenarios in the PACA region over the next few decades and present the results in workshops in phase III etc
4.2 Sequence of Analysis Sequence of Analysis here is also iterative with many cycles and feedback loops
• Define the aggregation level of analysis Fix time horizon and time resolution for modeling Define the geographical/administrative scale of analysis (national,
regional, department, community or neighborhood) Select an aspect needed for analysis (physical, economic, ecological
or social aspects) Select branches/sectors respectively to the defined problems and
goals (residential, transport, industry etc.) Select energy recourses and carriers (wind, biomass, gas, electricity
etc.) • Set up the reference energy system (RES) • Collect data and information (an analysis can require physical, economic,
environmental data and qualitative information) • Analysis of historical tendency and the current situation • Model likely development: References Scenario (making assumptions, using methods
like trend analysis, econometric approach for energy demand forecasting, asses impacts etc.) which help to see extend of the recognized problems and understand the dynamics in the future.
• Make sensitivity analysis to find uncertain parameters which can be a chance or a risk for regional energy concept
• Prepare tables, graphs etc. of preliminary results for discussion with experts and stakeholders
4.3 Underlying methodology As the planning process is iterative there is the regular interaction between different steps reviewing and renewing continuously data, information and results. The traditional IEP was rather supply-oriented based macro-economic factors (GDP etc.) on the national level. IEP approach does not take into account e.g. technical issues of integration of DG (distributed generation) closely in the regional or local network or using biomass resources/land or high share of heat pumps in the regional. Also a fully macro-economic
8
analysis on regional level without present of energy intensive branches using top-down approach and national data is also disputable. The const-benefit analysis using in several modeling tools like LEAP can give good results. External cost can bee included optionally depending on interests and preferences of stakeholders and interested parties. For reference scenario for energy demand forecasting time series method can be used if there are consistent set of data over a long duration [11]. For alternative scenarios end-use approach is very suitable on regional level. Supply demand balance and evaluation can bee done iteratively. Also Screening curves method can be implemented for preliminary assessment to filter out inferior alternatives before performing more accurate analysis [1]. The diffusion of new small scale technologies like PV etc. can bee analyzed using system dynamic approach [12]. Sensitivity analysis techniques can provide here an increased transparency in the use of modeling tools. Particularly, it can help: to find mistakes in the model, to identify parameters witch are needed for closely research and to find the robust strategy.
4.4 Application in region PACA
4.4.1 Chosen underling methodology and tools Bottom-up approach has been chosen for analysis. The chosen underlining methodology for demand side is time series method for reference and “end-use” approach based on qualitative expert judgments for alternative scenarios. It is very data intensive but it gives the opportunity for analysis of different end-use systems closely and to incorporate anticipated changes in technology and policy in the region. Supply and demand sides are considered in iterative way and are not optimized simultaneously [1]. The main modeling tool for research is LEAP (Long-range Energy Alternatives Planning System). Key characteristics of LEAP see in Appendix B. LEAP can support the modeling procedure in the best way because the most of parts in LEAP are optional so we can use LEAP and expand the research iteratively, increasing time resolution, including or excluding aspects, branches or energy carrier depending on data availability, change of focus of research etc. In order to provide the direction for the rest of the analysis, focusing on the factors, aspects which influence decisions and have the greatest effect on value, one way sensitivity analysis method: “tornado” technique have been implemented.
4.4.2 Define aggregation level of analysis One of the important steps of planning is to fix an aggregation level expanding or making more accurate the level of aggregation iteratively if needed, because the highest challenge in the planning beside the methods and modeling approaches is to get information and accurate data. Some kinds of data are even inaccessible because of their confidential status (market competition etc.). In general the aggregation level of analysis depend on
• Defined problems and goals • Availability of information • Underlining methodology (endigenization level etc.), modeled structure and • Available recourses for planning (manpower, time etc.)
4.4.2.1 Time horizon and time resolution Time horizon for integrated energy planning is proposed till to 2030, since for the solving of existing problems in the region, there is a need for large investments which need long payback time on the other site analysis of the most expected economic, social, demographic, and technological development happens over a 10 – 20.
9

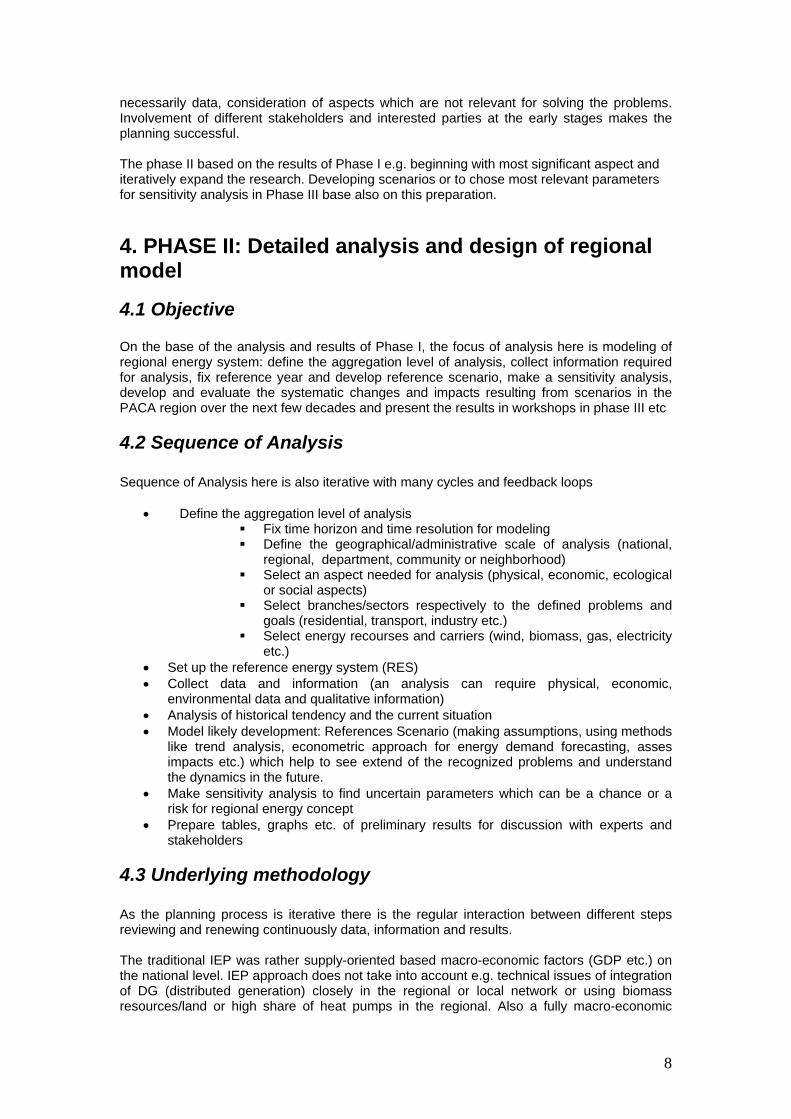
The best time resolution for modeling and long term energy planning is the analysis for each season choosing the representative daily variation of energy demand and supply for each season or month. High resolution can make the analysis more accurate but because of high data intensity and homogeneity of different periods e.g. months or days respectively to energy use yearly resolution have been chosen for the first cycle of analysis. For the next cycle the time resolution will be increased using a seasonal/time-of-day approach in LEAP. The year 2005 has been chosen as a reference year, because it was possible to establish a consistent data set for this year based on different sources. 4.4.2.2 Geographical/administrative scale According to the problems and defined goals the focus of study is at the regional level but because of different dynamics of energy consumption and environmental restrictions particularly for networks the analysis have be done on department level for each six department separately and for the region as a whole selecting or separating group of departments if needed. The departments are not considered as black box. The location, accessibility of local recourses etc. are considered in each department separately but the energy supply and demand balances have been done on department and regional level. Multi Regional approach of LEAP has been applied for each department separate and then aggregated for the whole region. 4.4.2.3 Select aspect needed for analysis (physical, economic, ecological or social aspects) All aspects will be considered in the analysis. For the beginning for the first cycle only physical aspects, particularly electricity sector have been considered since main problems in PACA region (see above) are on physical level. After first iteration and interaction with other experts and stakeholders other aspects will be included iteratively. 4.4.2.4 Select branches/sectors for demand side respectively to the defined problems and goals (residential, transport, industry etc.) Energy consumption for each demand sector is calculated using a set of equations built around technology of energy intensities, saturation/share data, and activity drivers within each sector. Energy consumption in the residential sector is calculated as the product of the total number of different type dwelling (e.g. RP MI PET ANC… typologies of dwelling in France), the saturation of the end use in residential dwelling, the technology share of the end use, and the unit energy consumption of the given technology. Total energy consumption is the sum of individual consumption of each of the different technology categories (heating, cooking, air conditioning etc.). Tertiary consumption is based on the tertiary floor surface for each sub sector (health, education etc.), the share of tertiary floor space of each sub sector, the saturations of end uses within each sub sector, and the fuel intensities on a square meter basis for each sub branch e.g. health or education. Due to lack of data the industry and some other sectors are considered on much aggregated level. The results of historical analysis have shown that in average there was no significant change of energy demand in the industry sector in the last 5 years.
10
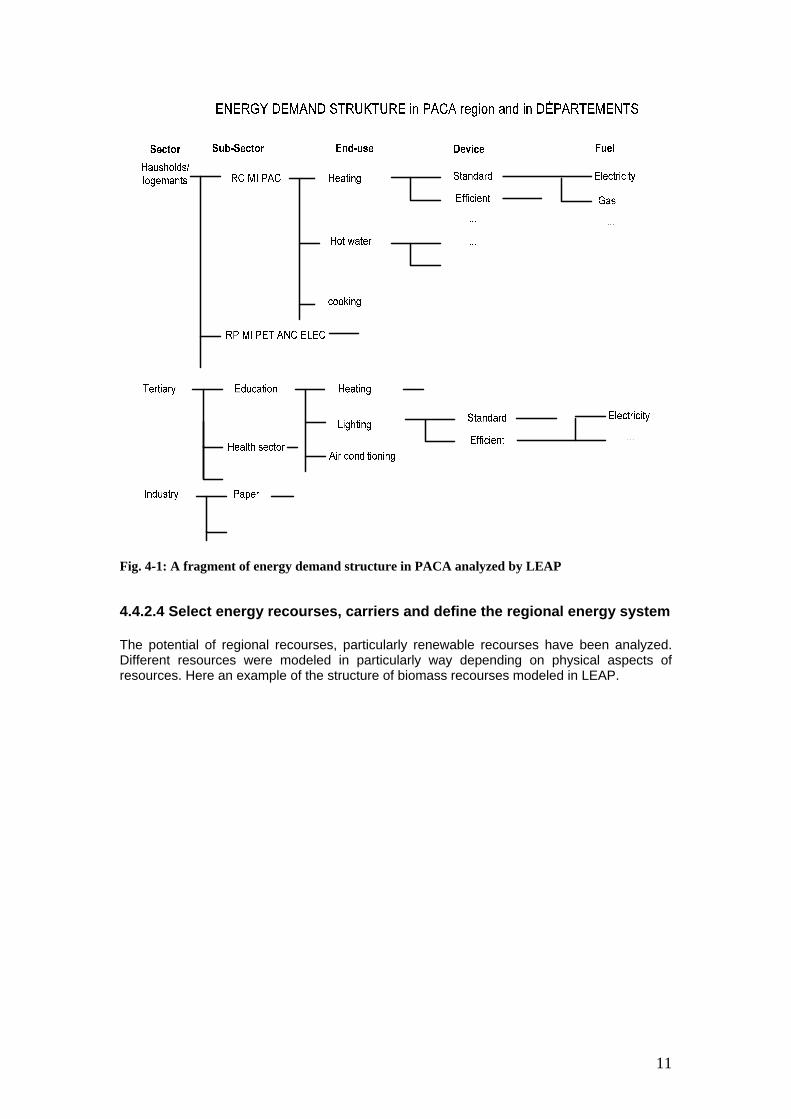
Fig. 4-1: A fragment of energy demand structure in PACA analyzed by LEAP 4.4.2.4 Select energy recourses, carriers and define the regional energy system The potential of regional recourses, particularly renewable recourses have been analyzed. Different resources were modeled in particularly way depending on physical aspects of resources. Here an example of the structure of biomass recourses modeled in LEAP.
11

Fig. 4-2: A fragment of structure of biomass recourses modeled by LEAP
4.4.3 Set up reference energy system (RES) Integrated energy planning considers the region as a whole with all energy systems and carriers. According to the existing problems and defined goals the focus in the first iteration is only electrical energy system from production till the end-user devices. In the next iterations other systems and carriers (like district heating or gas) can be included and evaluated iteratively. RES (Reference Energy System) is represented as a network of energy chain, starting from the primary energy supply and ending in the end-use sectors: useful energy. RES calculated in LEAP include technologies for:
• Energy generation/conversion for large scale and for small-scale e.g., power plants, small CHPs, PV etc.
• End – user devices: almost all end – use devices e.g. heating, cooling • The technology for the exploitation of energy carriers: e.g. Refinery or biogas
production will be considered in the next iteration. RES in PACA has a complex structure consisting of various technologies and subsystems. A Fragment of structure of RES (Reference Energy System) analyzing in LEAP is shown below. Electricity generation is calculated to meet electricity demand requirements of the each demand sectors in each department separately. The electricity generation module uses
12

explicitly specified technology categories and attributes as well as a specified merit order, annual system load curve: load duration curve (see diagram below), and import and export requirements to meet the total annual electricity demand resulting from reference and later of other scenario assumptions in different departments and in PACA as a whole. For these analyses, electricity losses from transmission and distribution were assumed to be 7% [7], and capacity additions were based on an optimal reserve margin of 20%. New capacity additions are added exogenously to the generation sector according existing information about commissioning or construction time.
Load duration curve for PACA region, for reference year
1 435 869 1303 1737 2171 2605 3039 3473 3907 4341 4775 5209 5643 6077 6511 6945 7379 7813 8247 8681
MW
Fig. 4-3 Load duration curve for the region in 2005 [18] In the first iteration the calculation of RES in LEAP was done vertical which consider the whole chain of electricity energy transformations from primary (e.g. wind) to useful energy (e.g. hot water). In the second iteration also horizontal calculation which consider an intersectional analysis of different energy systems will bee examined (e.g. a gas boiler vs. a heat pump or CHP), a multi carry energy planning.
13

Fig. 4-4: A fragment of reference Energy System in the region evaluating in LEAP
4.4.4 Collect data and information (the analysis require physical, economic, environmental data and qualitative information) The collection of reliable data was a major and relatively time consuming aspect of analyses. The most data intensive part is demand side because of chosen end- use approach. But the data intensity was reduced focusing the detailed analysis on sectors and end uses where the problems and potential for solution are most significant. Different kinds of data: quantitative and qualitative information (e. g. social aspects) have been considered for analysis. The data sources were reports of EIFER and other institution, databases: LEAP/TED (Technology and Environmental Database of LEAP), GEMIS (Global Emission Model for Integrated Systems), UDI World Electric Power Plants Data Base (WEPP) etc. The data structure has been defined according to RES (see. Pictures 4; 4).
14

4.4.5 Analysis of historical tendency and current situation matching supply and demand side Analysis of trends of electricity consumption since 1999 gave very valuable information about historical tendency of some aspects, like buildings constructions, energy use e. g. Some of these trends were projected in the future for reference scenario. Overall growth rate of electricity demand was in départements VAR, ALPES MARITIMES much higher then in other départements and in PACA as a whole. For whole region was the growth of electricity demand ca…% in the period between 1999 and 2005.
Historical growth of electricity demand in PACA
1999 2000 2001 2002 2003 2004 2005
Mill
MW
h/a
VAUCLUSE 84
VAR83
HAUTES ALPES 05
BOUCHES DU RHONE 13
ALPES MARITIMES 06
ALPES DE HAUTEPROVENCE 04Total PACA
Fig. 4-5: Historical growth of Electricity demand in the region Electricity demand for industry has not change in the last 5 years significantly because of economic activity reduction and reduction of energy – intensity as in many industrialized courtiers. After establishing the fully data structure, the fully data set have been calibrated to reflect an official reference year energy balance. There was not significant difference of results evaluated in LEAP and current statistic existing data. Energy balance for the region, for reference year 2005 evaluated by LEAP is shown in Table 4-1
15
Import in the region …Electricity Generation …Transmission and Distribution losses …
Energy supply
Total supply …Energy demand Residential …
Tertiary …Industry and other …Total Demand …
Unmet Requirements … Table 4-1: Electrical energy balance in PACA for reference year 2005 Mill MWh/a Modeled peak power requirement was in average 6700 MW in 2005 but it grows in December by 15% to 6910 MW [7].
4.4.6 Compile hypotheses, Model likely development reference scenario In bottom-up approaches like LEAP, the most of future values for the most key driving parameters are exogenous. The most of exogenous driving variables for demand side are based on EIFER-technical reports, expert judgments and using a system dynamics approach for the selected time horizon for the region. The hypotheses include national and regional development plans, demographic projections, sector-specific plans (e. g. development of different lodgments or building stocks), studies of trends in energy use (by sector and by end – use), plans for investments in energy facilities, studies of regional resource availability (e. g. biomass, solar energy). As some data are only for fixed years available LEAP calculates values for intermediate years by interpolation. The hypotheses are compiled using information available during the second half of 2008. The hypotheses for reference scenario can not be considered as the absolute certainties. In the next iterations the hypotheses will be examined and adjusted again developing new scenarios. One of the essential driving parameter in residential sector is further development of dwellings (buildings) which is evaluating according demographic development, sector –specific plans for buildings construction etc. In reference scenario it is expected that the number of dwellings with electrical heating (…ELEC) and with heat pumps (…PAC) will grow and with other heating systems will decrease (…COM). The development of surface in tertiary sector is the next significant driving parameter. The Analysis shows that the growth rate of square meter in tertiary, in “BUREAUX” sector is the highest. Energy balance for 2030 evaluated by LEAP for the region is shown in Table 4-2
16
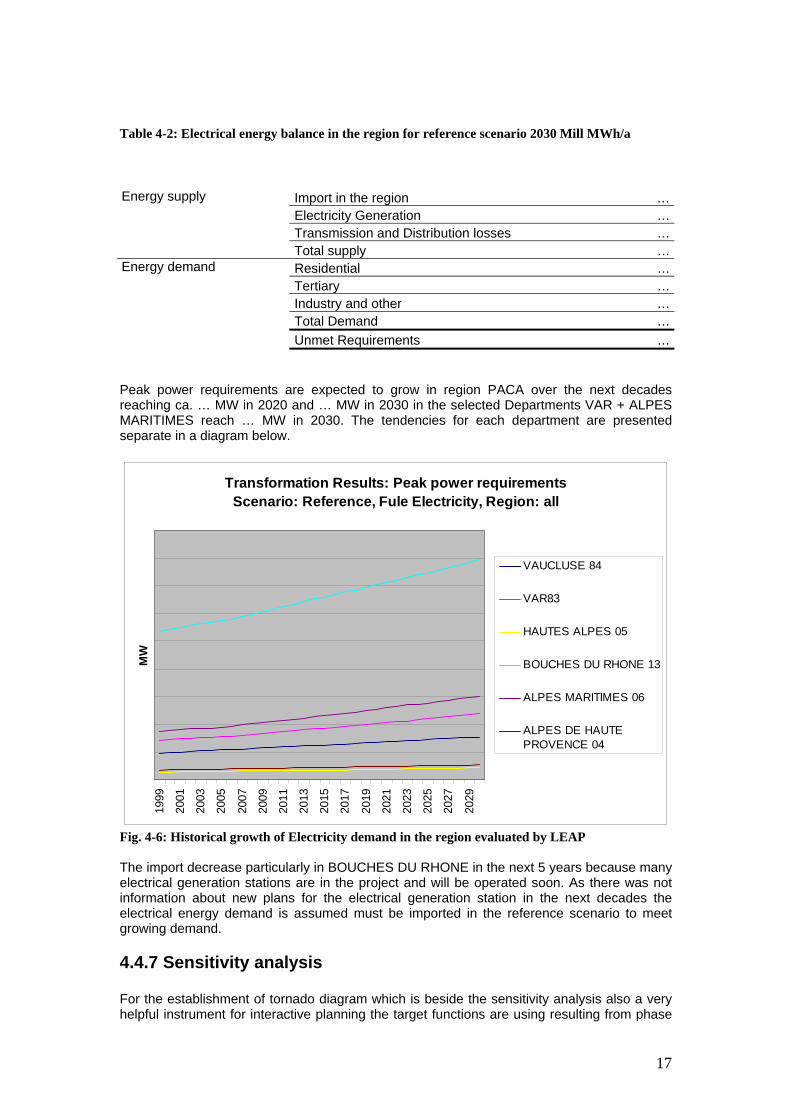
Table 4-2: Electrical energy balance in the region for reference scenario 2030 Mill MWh/a
Import in the region …Electricity Generation …Transmission and Distribution losses …
Energy supply
Total supply …Energy demand Residential …
Tertiary …Industry and other …Total Demand …
Unmet Requirements … Peak power requirements are expected to grow in region PACA over the next decades reaching ca. … MW in 2020 and … MW in 2030 in the selected Departments VAR + ALPES MARITIMES reach … MW in 2030. The tendencies for each department are presented separate in a diagram below.
Transformation Results: Peak power requirementsScenario: Reference, Fule Electricity, Region: all
1999
2001
2003
2005
2007
2009
2011
2013
2015
2017
2019
2021
2023
2025
2027
2029
MW
VAUCLUSE 84
VAR83
HAUTES ALPES 05
BOUCHES DU RHONE 13
ALPES MARITIMES 06
ALPES DE HAUTEPROVENCE 04
Fig. 4-6: Historical growth of Electricity demand in the region evaluated by LEAP The import decrease particularly in BOUCHES DU RHONE in the next 5 years because many electrical generation stations are in the project and will be operated soon. As there was not information about new plans for the electrical generation station in the next decades the electrical energy demand is assumed must be imported in the reference scenario to meet growing demand.
4.4.7 Sensitivity analysis For the establishment of tornado diagram which is beside the sensitivity analysis also a very helpful instrument for interactive planning the target functions are using resulting from phase
17
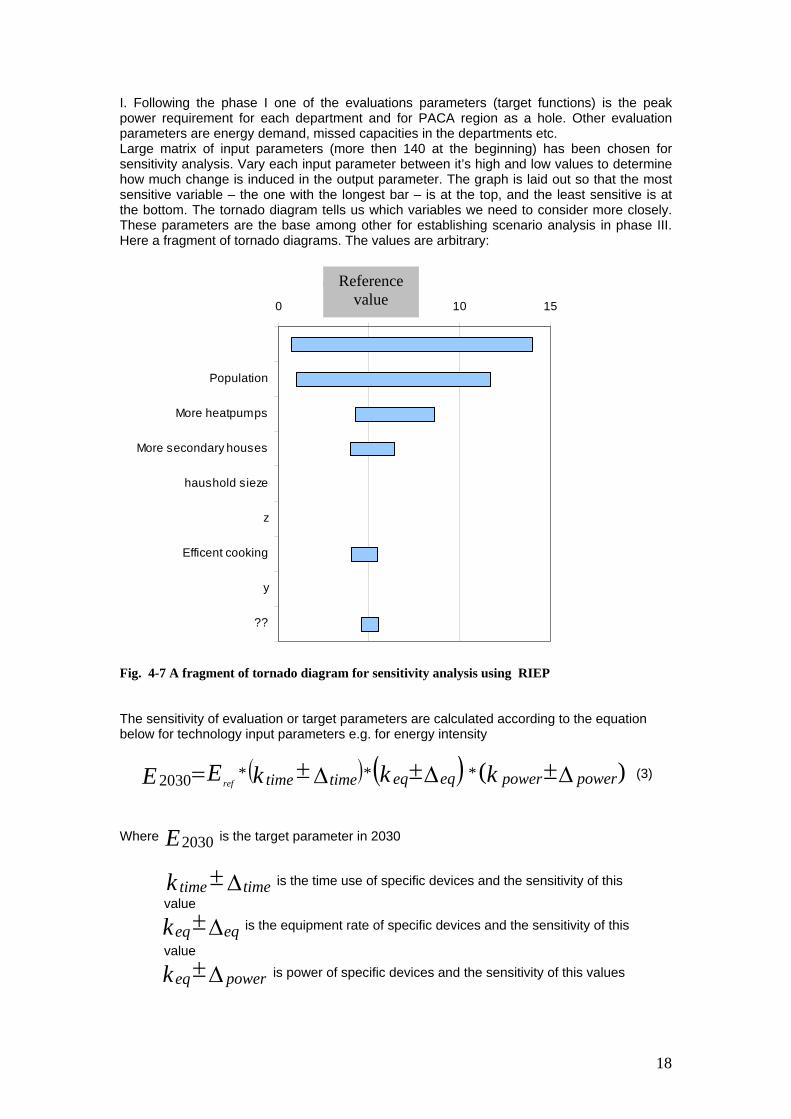
I. Following the phase I one of the evaluations parameters (target functions) is the peak power requirement for each department and for PACA region as a hole. Other evaluation parameters are energy demand, missed capacities in the departments etc. Large matrix of input parameters (more then 140 at the beginning) has been chosen for sensitivity analysis. Vary each input parameter between it’s high and low values to determine how much change is induced in the output parameter. The graph is laid out so that the most sensitive variable – the one with the longest bar – is at the top, and the least sensitive is at the bottom. The tornado diagram tells us which variables we need to consider more closely. These parameters are the base among other for establishing scenario analysis in phase III. Here a fragment of tornado diagrams. The values are arbitrary:
-5 5 10 15
??
y
Efficent cooking
z
haushold sieze
More secondary houses
More heatpumps
Population
0Referen
ce0 5 10 15
??
y
Efficent cooking
z
haushold sieze
More secondary houses
More heatpumps
Population
Reference value
Fig. 4-7 A fragment of tornado diagram for sensitivity analysis using RIEP The sensitivity of evaluation or target parameters are calculated according to the equation below for technology input parameters e.g. for energy intensity
( ) ( ) )(***2030 Δ±Δ±Δ±= powerpowereqeqtimetime kkkEE ref (3)
Where is the target parameter in 2030 E2030 is the time use of specific devices and the sensitivity of this Δ± timetimek value is the equipment rate of specific devices and the sensitivity of this Δ± eqeqk value is power of specific devices and the sensitivity of this values Δ± powereqk
18
4.5 Conclusion of phase II Base on the results or phase I for the first iteration for reference year and reference scenario only the electrical energy system was considered here, for next iteration more sectors and aspects will be included iteratively depending on preference of participants etc. The analysis of the first iteration for PACA shows that the problems with missing capacities, network restrictions etc. will be increase e.g. the peak power requirements expected to growth in PACA region and in departments over the next decades …
5. PHASE III Prioritization and decision
5.1 Objectives of Phase III The main objectives here are:
• Analyze and prioritize all options resulting from previous phases. • Find consent across all interests and preferences of all participants organizing
workshops and using MCDM technique. • Develop strategies for the implementation.
5.2 Sequence of analysis
• In a new workshop interested parties reviews the results of phase I and II the dynamics of problems in a reference year and in a reference scenario, the different options and their impacts
• Fix and reformulate the evaluation parameters (target parameters) defined in the phase I
• Assess weight of evaluation parameters also for the qualitative aspects • Use MCDM (multiple criteria decision making) methods for prioritization • Develop alternative scenarios • Develop tables, graphs etc. of different mix of different options for a presentation and
discussion • Decide the strategies for implementation
5.3 Underlining methodology The increasing uncertainties, technology diversity and different interests and preferences of energy planning participants make use of (MCDM) multiple criteria decision making in the energy planning after deregulation of energy markets inevitable. MCDM methodologies can help organization of the problem solving and building models that can capture how decision-makers think when challenged to compare decision alternatives in terms of several criteria and when the outcomes of those alternatives are uncertain. There are different MCDM methodologies. [13] Indicates that the combination of multiple attribute utility theory (MAUT) with analytic hierarchy process (AHP) (both are MCDM methods) may be more suitable because high complexity and uncertainty are general features in energy planning. Also “These two methods (MAUT and AHP) are among the most well-known and used MCDM methods, and the underlying theory and principles are relatively easy to understand” [14]. The scenario technique is one of the most commonly used approaches in the energy planning. The scenarios provide a set of alternative contexts for exploring different ways that in the future may happen. Decision-makers have here a more participative task, in that they must analyze how different alternatives would perform in different possible futures [15].
5.5 Application in region PACA
5.5.1 Chosen methodologies
19
For Multiple criteria analysis DAM (Decision Analysis Module) has been chosen. It is value measurement module which uses common additive value function. (More see Appendix C).
X wi*xij (1) ∑=
=n
i 1
Were X is a finite set of decision alternatives, and “n” is a finite set of criteria against which the alternatives are evaluated. The corresponding values are denoted xij. A proper combination of methods OTSM-TRIS, DAM and scenario technique can increase the effectiveness of the planning process and make the planning successful. Such complementary integration will help to make use of the strengths of the methods making it well suited for modern energy planning. Scenario technique is preferred here to use considering projections of different institutions, which use variety of techniques and are funding by organization with different goals2. Because of the high sensitivity of energy demand on climate conditions like temperature in PACA region and increasing importance of diversity and security of different energy recourses, a simple index for diversity providing quantitative examine the relationship between category shares and energy diversity will be implemented [28]. The diversity index is calculated as
H (2) ∑=
=n
i 1
2ix
Where is the category fraction from source “i”. Values of H range between 1 and the total number of categories and the higher the value of H, the greater the energy diversity.
ix
5.5.2 Sequence of analysis for the region The research project is still in progress. At the moment the implementation of phase III is not complete.
6. PHASE IV Implementation and monitoring
6.1 Objectives of phase IV The goal aims to assess the implementation of programs. This includes management, marketing field delivery of programs; provide information, quality control procedures and the response of target groups, such as energy user or supplier.
6.2 Sequence of analysis
• Implementation • Monitoring
6.3 Underlining methodologies The implementation of different supply or demand side measures can be very different. Different methods and tools are available for the implementation. Most of these tools are on project level for the subsystem planning for supply side options or for DSM measures. 2 “Accurate data compilation and careful scenario creation are more important to achieving forecasting success than are complex programming or complex mathematics. Instead invest enough time for data compilation and scenario analysis. There is no evidence that more complex models are any more accurate in forecasting the future than are simpler models”: http://arjournals.annualreviews.org/errata/energy
20
6.4 Application in region PACA The research project is still in progress. At the moment the implementation of phase IV is not done.
7. Results The first analysis and evaluation of Phase I and II shows that there are several energy and environmental challenges now in the region and it will be more complex in the future. On the other side opportunities exist to deal with these challenges. The results of reference scenario for energy demand in different departments (without any intervention) for PACA region show the picture below for 2030:
Picture 7-1: The energy demand in PACA, in different departments for 2030 Some selected results calculated by LEAP for PACA region, for 2030: Electrical energy demand … Peak power requirement … Power required not dispatched …
21

According to the defined problem-goal dynamo there are several DSM and supply options for solving problems existing in PACA region. The close analysis of different DSM or supply options will bee done in the next iterations after having workshops with interested parties.
7.1 Supply side The available technical potentials of domestic recourses for electricity generation, produced by adequate marketable technologies have been evaluated.
7.2 Demand side Large number of DSM activates have been done in PACA region and are in progress. The Eco – Energy Plan comprises a very large DSM project. It is probably the largest DSM project in EU: http://www.planecoenergie.org/. Several DSM options are proposed to analyze in the next iterations in this study. Here an example widely spread technology using of controlled switches installed in different devices without active participation of end user/customer. An attractive electrical storage is the thermal (heat or could) energy storage which has more public acceptance then switching off and on lights or TV. With modern management systems for controlling and automating the switching makes some of end user devices for load management are very useful. Here an example for refrigerators using in households.
Storage power [MW] Discharging time [min] Electricity stored [MWh] … 60 …
Table 7-1: Electricity storage capacity of refrigerators in households in 2030 Where: Storage power: is the total expected power of refrigerators in households in PACA region, in 2030. Discharging time: is the average time of discharge of a single “class A” refrigerator using in the household. Also other devices are considered in the similar way like electrical heating, ventilation etc. The final available energy potential taking into account economical potential and social etc. restrictions is less [16]. These potentials will be analyzed and evaluated in the next iterations.
8. Conclusion and future research The Regional Integrated Energy Planning (RIEP) methodology is the next generation of historical Integrated Energy Planning (IEP) on the regional (sub national) level under liberalized energy market conditions. Initial implementation of RIEP shows that the methodology makes the planning process effective and successful because of
• modular structure and optional implementation of different modules and aspects • high interactive capability of methodology for interactive energy planning with different
participants • ability to reduce the complexity of planning tasks and data intensity in iterative way • Creation not only standard solutions but also new innovative mix of different
solutions.
22

It is important to keep in mind that not only the methodology is significant for the quality of planning but also the availability of good data, the experience of the user and willingness of different planning stockholder to be involved in the process actively. The methods, tools, and PACA example presented here are a framework for supporting the discussion and an opportunity for creative engagement to develop integrated energy concept with different strategies and scenarios. At this stage, the recommendations for future research can be summarized as follows: • -In the first iteration the analysis and evaluation have be done vertical which consider the
whole chain of electric energy transformations from primary (e.g. wind) to useful energy (e.g. hot water). In the second iteration horizontal calculation which consider an intersection of different energy systems will be integrated (e.g. gas heating vs. heat pump or CHP), a multi carrier planning.
• Continue the implementation of the methodology using case studies, testing the limits and opportunities of the methodology
• To make sure if there is a need for a new additional tool or module for the planning
23
Appendix A: TRIZ and OTSM TRIZ – Is a. Russian acronym for The Theory of Solving Inventive Problems (In Russian – “Teorija Reshenija Izobretatelskih Zadach”) The theory provide fundamental approach to develop practical instruments for solving non typical complex and complicated problems. Based on the Theory set of instruments was created and evolving. Those instruments are in use by many leaders of industry and research around the world. But the theoretical background of those instruments are not well known yet. OTSM – is a further development of Classical TRIZ. It is Russian acronym for The General Theory of Powerfull Thinking (In Russian “Obschajia Teorjia Silnogo Mishlenia”). This acronym was proposed by the author of TRIZ – Genrich Altshuller. Sources: Altshuller Genrich S., (1984). "Creativity as an exact science: The Theory of the Solution of Inventive Problems". Translated by Anthony Williams. Gordon and Breach Science Publishers, ISBN 0-677-21230-5. Altshuller Genrich S. (1999). “The Innovation Algorithm: TRIZ, systematic innovation, and technical creativity”. Worchester, Massachusetts: Technical Innovation Center. 312 pages, ISBN 0964074044. Kaikov I., Khomenko N., Biomass Gasification process: Analysis, problems and solutions with OTSM-TRIZ approach. Report of EIFER – European Institute for Energy Research. EDF R&D. HN-42/04/007. 2004. – 95 pages. Kaikov I., Bourtourault G., Lelait L., Khomenko N., Installation de Gazéification de biomasse avec dispositif de craquage des goudrons dans le gaz de synthèse produit. Patent France N 2899238, C 10 J 3/84. (31.03.2006). Khomenko N., The inventive problem solving theory. "Handbook for OTSM-TRIZ course. LG-Electronics and Samsung. South Korea, Suwon, (1997-2000). Khomenko, N., Kucharavy, D., (2002). „OTSM-TRIZ problem solving process: Solutions and their classification in Proceedings of TRIZ Future Conference, Strasbourg, France. Khomenko N., (2005). "Utilisation de la théorie TRIZ dans les métiers du BTP". Extrait du Rapport Final pour le Ministère de I' Equipement des Transports, du Logement, du Tourisme et de la Mer. In Journal: Les Cachers de I'INSA de Strasbourg. Numéro l .ISSN 1776-3363. Strasbourg, INSA. Khomenko, N., Shenck, E. and Kaikov I., OTSM-TRIZ problem network technique: application to the history of German high-speed trains. // TRIZ Future 2006 Conference, Belgium, Kortijk. Pages 37-43. B: Overall LEAP Characteristics
• Key Characteristics: Comprehensive, integrated system covering energy demand/supply-side and recourses analysis providing physical, cost and emissions analysis. Model-building system and accounting framework rather than a fixed model. Possibility for sophisticated analysis using API.
• Scope: energy demand, energy supply, resources, environmental loadings, cost-benefit analysis, non-energy sector emissions. Most aspects optional.
• Flexible Approach to Modeling: Basic relationships are all based on non-controversial physical accounting. Choice of modeling methodology, e.g. end-use and/or econometric demand relationships; load curve dispatch with possibility to consider load shapes for each end-use devices or fixed plant chares for electric system.
• Time: medium to long-term; annual/Monthly … time-steps. • Data requirements: Flexible and expandable data structures; can be used under
conditions of limited data. Includes TED Associate technological database with
24

extensive technical, economic and environmental data of ~ 1000 energy technologies.
• Geographic Applicability: (Inter)national, local, regional. • User friendliness: Menu – driven interface and straightforward data entry screens.
Integrated context – sensitive help and full documentation; sophisticated scenario management system with flexible reporting possibilities including built-in graphics.
Sources:
www.energycommunity.com
C: DAM DAM (Decision Analysis Module) was developed to aid decision analysts in solving multi-criteria decision analysis problems by allowing analysis of trade-offs among technical, economic, and environmental concerns. This Windows-based software allows analysts to view a decision problem and find the best solution from different perspectives; performs standard, but time-consuming, tasks quickly and efficiently; offers a range of decision analysis and trade-off methods that cannot be performed manually; and presents results in convenient graphical and numerical formats. DAM also allows for imprecise or interval trade-offs. DAM include visual sensitivity analysis which can be used in an interactive decision analysis procedure. Sources: ENergy and Power Evaluation Program (ENPEP). Brief Model Overview. Argonne National Laboratory, www.energycenter.anl.gov
25
26
References [1] “Guidebook on Analytical Methods and Processes for Integrated Planning”. IEA DSM Implementing Agreement A Report of Task IV, Final Report - October 1996 [2] “Best Practices Guide: Integrated Resource Planning For Electricity”. The Energy group Institute of International Education Washington, DC [3] “Comparative assessment of representative models for regional energy planning” EIFER – technical report, Atom Mirakyan [4] “Regional energy planning through SWOT analysis and strategic planning tools” J. Terrados_, G. Almonacid, L. Hontoria. Research Group IDEA, Polytechnics School, University of Jae´n, 23071 Jae´n, Spain, August 2005. [5] „Auf dem Weg zur 100% REGION. Handbuch für eine nachhaltige Energieversorgung von Regionen“ M. Rischer, Dr. M. Stöhr, M. Lurz, L. Karg. B.A.U.M. 2008 [6] http://www.securite-electrique-paca.fr/, http://www.planecoenergie.org/. [7] GENERATION ADEQUACY REPORT on the electricity supply-demand balance in France Edition 2007 or 2006, RTE, http://www.rte-france.com [8] Bilan 2006 de RTE en région Sud-Est François RICHARD, http://www.rte-france.com [9] ELECTRICAL ENERGY IN FRANCE, Provisional results of power flows on the French power system in 2008. RTE, http://www.rte-france.com [10] “European benefit/cost analysis methodology for DSM and energy efficiency services programs”, Phase II: Benefit/cost calculations Final report EU (DG 17) by international ApS (1995). [11] “The dynamics of regional (subnational) integrated energy planning and requirements for methods and models” International Energy Workshop. Atom Mirakyan, Laurent Lelait, Norbert Lewald and Pierre Imbert. July 2008 at the IEA, Paris, FRANCE [12] “COMPLEX ADAPTIVE SYSTEMS AND THE DIFFUSION OF INNOVATIONS” Everett M. Rogers, Una E. Medina, Mario A. Rivera and Cody J. Wiley. The University of New Mexico, The Public Sector Innovation Journal, Volume 10(3), article 29 [13] “Decision analysis in energy and environmental modeling” Zhou P., B.W. Ang, K.L. Poh 2004. [14] “Multi-Criteria Planning of Local Energy Systems with Multiple Energy Carriers” Norwegian University of Science and Technology Faculty of Information Technology, Mathematics and Electrical Engineering Department of Electric Power Engineering Løken Espen (2007). [15] “The Art of the Long View – Scenario Planning” Schwarz. 1991. [16] „Erneuerbare Energieträger in Deutschland – Potentiale und Kosten“ Martin Kaltschmitt, Andreas Wiese, Springer-Verlag, 1993 [17] “Improving Energy Security in Pacific Asia: Diversification and Risk Reduction for Fossil and Nuclear Fuels [18] «Analyse des consommations d’électricité sur la région » PACA 2002-2006, RTE


![Evaluation Methodological Framework Draft[1]](https://img.dokumen.tips/doc/110x75/62770eb225072e6ada79eae4/evaluation-methodological-framework-draft1.jpg)


