Embed Size (px)
Citation preview

To appear in Handbook of Individual DifferencesTomas Chamorro-Premuzic, Adrian Furnham and Sophie von Stumm (Eds.)
Methodological Advances in Differential Psychology
William RevelleDavid M. Condon
Joshua WiltNorthwestern University
Methods for differential psychologists are the methods of all scientists: describe andtest models of data. What distinguishes our field is what constitutes data and whatare the special analytical tools we use. For the differential psychologist, data comefrom self report, for observations, from physiology, and from behavioral residues.Data are recorded over time and over space. The challenges of collecting data arelimited only by our imagination. Methods of analysis emphasize model fitting andmodel evaluation.
The goals of methods in Differential Psychol-ogy are no different from those of any other sci-ence: descriptive and testable explanations ofphenomena. Methods thus involve the collec-tion and analysis of data. What distinguishesscientific fields from each other, and the fieldof differential psychology in particular is whatconstitutes data, the theories of our data, andthe analytical techniques used to describe andmodel data. This chapter is divided into twomain sections: the kinds and sources of data wecollect and the ways in which we model (ana-lyze) the data. In that entire text books aredevoted to data collection, to design (Shadishet al., 2001), to inference (Pearl, 2000), and toeach of many ways to model data (Judd et al.,2009; Loehlin, 2004; McArdle, 2009; McDonald,1999; Mulaik, 2010; Rasch, 1960), this reviewwill necessarily be of the basic concepts ratherthan the specifics of particular methods. For athorough discussion of research methods of indi-vidual differences that is limited to personalitynarrowly defined (e.g, not including intelligence,interests or values) see the handbook edited byRobins et al. (2007).
contact: William Revelle [email protected] version of May 17, 2010Please do not cite without permission
Data = Model + Error (1)
A revolution in data analysis has occurredover the past thirty years: the recognition thatwe model data and compare alternative modelsto each other (Rodgers, 2010). This approachis summarized in Equation 1 which, if we rec-ognize that our error is someone else’s signal, isbetter expressed as Equation 2:
Data = Model + Residual. (2)
The process of research then is one of findingmodels that fit the data with acceptably smallresidual values. “Models, of course, are nevertrue, but fortunately it is only necessary thatthey be useful. For this it is usually needful thatthey not be grossly wrong.” (Box, 1979, p 2).The current approach goes beyond just askingfor usefulness by asking if the specified model isbetter than alternative models (Rodgers, 2010).
Coomb’s Theory ofData and Cattell’s Data
Box
The left hand sides of Equations 1 and 2 areData. What are the data that we collect? Atan abstract level, data can be organized alongthree different dimensions: type of comparison(order versus proximity), the elements beingcompared (people, objects, people x objects)
1

2 REVELLE, CONDON, AND WILT
and the number of comparisons (one or more)(Coombs, 1964). Within this framework, a per-son can be said to be more than an object (e.g.,if passing an ability test item) or to be near anobject (if endorsing an attitude item), and oneperson can prefer one object to another object(be closer to one attitude than another) or havea stronger preference than someone else. Peo-ple can also differ in the way they group ob-jects. The Coombs (1964) model continues tobe used within psychometrics by virtue of thedistinction between ability and preference itemsin item response theory (Chernyshenko et al.,2007) and in terms of individual differences inmultidimensional scaling of situational stress.
Cattell’s data box (Cattell, 1946) emphasizedthree sources of data: People, Tests, and Oc-casions and considered how correlations can betaken between tests and across people at one oc-casion (R analysis), just as correlations can befound between people across tests (Q analysis),or tests can be correlated within people acrossoccasions (P analysis), etc. Subsequently, Cat-tell (1966) expanded the data box to includeBackground or preceding variables as well asObservers. Applications of the data box con-cept that there are many ways to analyze ourdata have been seen throughout differential psy-chology, but the primary influence has probablybeen on those who study personality and cogni-tive development and change over the life span(McArdle & Bell, 2000; Mroczek, 2007; Nessel-roade, 1984).
Methods of datacollection
Individual differences can be assessed by ask-ing people about themselves (their identity) andother people (their reputation) or by observ-ing behavior (what people or other animals do),physiology and behavioral residues. Of these,the predominant method is probably that of selfreport, through the use of either questionnaires,projective instruments, or narratives.
Self report
“Do you get angry easily?”, ”Do you find itdifficult to approach others?”, “Do you make
people feel at ease?”, “Do you do things ac-cording to a plan?”, “Do you carry the conver-sation to a higher level?”. These are typicalself report items taken from the InternationalPersonality Item Pool (IPIP, Goldberg, 1999).They follow the basic principle that if you wantto know something about someone, ask them.With the instruction to answer the way younormally behave, these measures of trait Neu-roticism, Extraversion, Agreeableness, Consci-entiousness, and Openness show stability overlong periods of time and correlate with suit-able behavioral observations and other reports(Roberts et al., 2007). In contrast to measuresof ability, these items are thought to measuretypical performance. In other words, they mea-sure how one usually thinks, feels and behavesrather than how well one can think.
A similar example would include self-reportitems that allow inference about the internalstates of Energetic Arousal or Tense Arousal(Schimmack & Reisenzein, 2002; Thayer, 2000).When asked about energetic arousal (how alert,active or vigorous one feels in contrast to sleepy,tired or drowsy) or tense arousal (anxious, wor-ried or tense versus calm or relaxed), subjects’scores will change over the day and in responseto factors such as caffeine, exciting or depressingmovies, and exercise (Revelle, 1993).
These items are direct and obvious. Theymay be formed into scales using factoriallyhomogenous keying (Goldberg, 1972), alsoknown as an inductive strategy (Burisch, 1984).Classic examples of such inventories are theEysenck Personality Inventory (EPI, Eysenck& Eysenck, 1968), the NEO-PIR (Costa & Mc-Crae, 1985), and the sixteen Personality Factors(16PF, Cattell & Stice, 1957). Some invento-ries, however are developed using the empiricalor external strategy of finding items that distin-guish known groups from people in general, e.g.,the MMPI (Hathaway & McKinley, 1943) or theStrong Vocational Interest Inventory (Strong,1927). They also differ from rational or deduc-tively constructed tests such as the CaliforniaPsychological Inventory (CPI, Gough, 1957) orthe Personality Research Form (PRF, Jackson,1967).
The advantages and disadvantages of em-pirical, rational, and homogenous keying tech-

METHODS IN DIFFERENTIAL PSYCHOLOGY 3
niques were well reviewed by Goldberg (1972),Hase & Goldberg (1967) and Burisch (1984). Ingeneral, rational and factorial techniques workbetter for predicting more predictable criteria,but empirical/external techniques are betterable to predict very unpredictable criteria (e.g.,dropping out of college). Tests assessing inter-ests (Holland, 1959, 1996; Strong, 1927) havetraditionally used empirical scale constructionmethods and have incremental validity whenpredicting diverse criteria such as success ingraduate school (Kelly & Fiske, 1950).
Some question how self reports can be validgiven the tendency to dissimulate or self en-hance. R. Hogan & Nicholson (1988), R. Hogan& Kaiser (2005), R. Hogan (2007) address thisissue for predicting real life criteria (leadershipeffectiveness in organizations). Self report mea-sures are quite successful at predicting this im-portant criterion. J. Hogan et al. (2007) directlyaddress the problem of faking and report thatit was not a problem for selecting job applicantsfor security positions.
Constructing self report inventories. Practi-cal advice for constructing self report invento-ries for the differential psychologist (e.g., Clark& Watson, 1995; Simms & Watson, 2007; Wat-son, 2005) emphasizes starting with a good the-oretical understanding of the constructs to bemeasures and the population of interest, writingitems that are clear and readable, examining theinternal structure of the items, purify the scalesdeveloped, check for external validity in termsof correlations with criterion groups, further re-finement of items and finally extensive docu-mentation. Issues to consider include breadth ofitems, definition of facets of the construct, clar-ity of wording of items, response analysis usingIRT technique, suitability for the target pop-ulation and evidence for convergent, discrimi-nant, and construct validity. Types of item se-lection techniques include empirical based uponknown groups, homogeneous, based upon thefactor/cluster structure of the domain of items,or just rational choice based upon theory.
Narratives
Narrative approaches to individual differ-ences have grown in popularity in recent years.
Researchers collecting narrative data typicallydo so as a means to assess how people makesense out of their lives (Pasupathi & Hoyt,2009). Therefore, the preferred unit of analysisare life-stories or discrete scenes from one’s life-story. Many narrative researchers work fromthe perspective of narrative identity (McAdams,2008): from this perspective, the psychologicalconstruction and telling of a life story bringstogether one’s remembered past and imaginedfuture into a narrative identity that potentiallyprovides life with some degree of unity, mean-ing, and purpose (Singer, 2004). Life storiesfeature particular scenes occurring at differenttimes in one’s life and, like any good story, con-vey a variety of themes through its structure,characters, and plot (McAdams, 1993).
Due to the massive amount of scenes, events,and memories a person accumulates through-out a lifetime, quantitative analysis of narra-tive identity at first seems a daunting under-taking. Indeed, the cumbersome methods ofthe case study and the study of single lives aremore amenable to qualitative analysis. How-ever, modern narrative researchers have been upto the task, as the past two decades have seensteady growth in creative, quantitative method-ologies to analyze narratives.
One fruitful approach to dealing with theproblem of scene selection is the introduc-tion of the standardized life story interview(McAdams et al., 1997) in which people nar-rate a set of important scenes in their lives (highpoints, low points, turning points, vivid mem-ories from childhood, adolescence, adulthood,and an imagined future scene) and trained hu-man coders assess these scenes for structuraland thematic elements. Studies employingthis approach aggregate scores for such themesas emotional tone, complexity, and coherence(McAdams, 1993). Another approach for ana-lyzing narratives, which focuses on the impor-tance of individual scenes rather than the entirestory, is to have people narrate a self-definingmemory (Singer & Blagov, 2004). Self-definingmemories are especially emotional and vividscenes that communicate how people came to bewho they are today and may be coded similarlyto the scenes in the life story interview. Aninnovative method of assessing narrative data

4 REVELLE, CONDON, AND WILT
is to code how people think about their ownnarratives, termed autobiographical reasoning(Habermas & Bluck, 2000). The process of au-tobiographical reasoning is analogous to tellinga meta-narrative, as people reflect and commenton the meaning of different scenes in their ownnarratives and what implications those scenesmay have (McLean, 2005). Still others obviatethe need for human coders by taking advantageof the ability of computerized text analysis pro-grams to count words relevant to various the-matic categories (Pennebaker et al., 1997). Forexample, researchers interested in how muchpositive emotional content is conveyed in a nar-rative have the ability to count how many pos-itive emotion words such as happy, joy, elated,etc. appear in their participants’ narratives.
Ability tests
The typical self report inventory measureswhat people normally do. Ability tests mea-sure how well they can do. Originally devel-oped as predictors of poor school performance,ability tests such as the SAT and GRE have be-come standard predictors of college and grad-uate student performance (Kuncel et al., 2001,2007). Commercial IQ tests are given in mostclinical assessments. Within the field of cogni-tive abilities, there have been two broad tradi-tions, the psychometric measurement orientedapproach and the cognitive processes approach.With a better understanding of the cognitiveprocesses involved in ability tests, it is thoughtpossible to combine cognitive theory with ad-vanced psychometric principles (e.g., Item Re-sponse Theory) to create more efficient test-ing instruments (Embretson, 1998). Unlike theopen source IPIP (Goldberg, 1999) there doesnot seem to be a public domain set of abilityitems that different labs can use. Rather, thereare sets of commercial tests, both individualizedand group forms that need to be purchased, or“home brew” tests that are unique to particularlab groups.
A fundamental assumption of ability tests isthat performance is not affected by motivationalstate and that all participants are performing atthe best of their ability. This is, however, nottrue. See Revelle (1993) for compelling evidencethat motivational states associated with caffeine
or diurnally variable energetic arousal affectsability test performance by up to one standarddeviation. Individual differences in anxiety andstereotype threat have also been shown to af-fect cognitive performance, even on high stakestesting.
Other report
The ratings of professional psychologists(Fiske, 1949), of teachers (Digman, 1963), ofpeers (Norman, 1963, 1969; Tupes & Christal,1961), or of self show a remarkable degree ofconsistency in identifying 5 broad factors of be-havior (Digman, 1990). These five have becomeknown as the ‘Big 5’ dimensions of personal-ity (Digman, 1990; Goldberg, 1990). However,not all find such a simple five dimensional so-lution. Walker (1967) when comparing teacher,peer and self ratings among elementary schoolchildren showed consistency in identifying a twodimensional circumplex structure with primaryaxes that could be interpreted as activity andneuroticism. With the use of appropriate in-ternet techniques, it is relatively easy is to getuseful informant reports (Vazire, 2006).
Behavioral observation
Self-report and to a lesser extent other-reporthave been the most prominent ways of assess-ing personality, however, perhaps the most in-tuitive way to do so is to observe how people ac-tually behave. This sound reasoning underliesthe use of behavioral observation. Although in-tuitive, behavioral observation has rarely beenemployed, due in part to the relatively highcosts associated with devising a viable behav-ioral observation scheme (Funder, 2001). In-deed, it is much more difficult to develop a sys-tem for coding behavior, train coders, and ac-tually conduct observations than it is to haveindividuals or informants fill out global person-ality ratings (Furr & Funder, 2007). Notwith-standing these costs, behavioral observation isworth pursuing for the simple reason that ac-tual behavior is what psychologists really careabout (Baumeister et al., 2007). Thus, behav-ioral observation may be held as a gold standardin differential psychology.
METHODS IN DIFFERENTIAL PSYCHOLOGY 5
Behavioral observation may occur in naturalsettings or in laboratory settings. A longstand-ing goal of differential psychology is to predictwhat people do in naturally occuring environ-ments, however, it is obviously difficult to col-lect such data in a non-intrusive way. A newmethodology called EAR (Mehl & Pennebaker,2003) relies on a small recording device that isprogrammed to turn on and off throughout theday, recording for a few minutes at a time, pro-ducing objective data in natural environments.Laboratory based methods of behavioral obser-vation by definition lack some of the externalvalidity of naturalistic studies but offer con-trolled environments in which to examine be-havior. The German Observational Study ofAdult Twins (GOSAT) project of Borkenau etal. (2001) has had participants take part indi-vidually in structured laboratory activities de-signed to elicit behaviors relevant to the Big 5.Extending Borkenau et al. (2001) methods, Nof-tle & Fleeson (2010) have recently reported thefirst results of a large scale observational studyof people interacting in group activities; thesestudies observed not only content of behaviorbut how much behavior varies as a function ofage across adulthood. Behavioral observationin the lab is not limited to adults, as exem-plary studies conducted by Emily Durbin andcolleagues (Durbin et al., 2007; Durbin & Klein,2006; Durbin et al., 2005) have used standardlaboratory tasks designed specifically to elicitbehavior related to childhood temperamentalcharacteristics.
In each of the aforementioned studies, re-searchers had to make difficult decisions aboutwhat to observe. Indeed, no one study is largeenough to catalogue all behaviors; thus, it isimportant to carefully consider theoretical rea-sons for choosing variables. Oservational stud-ies may assess discrete behaviors (e.g., smiles)by counting the frequencies of their occurrence,or by having observers make a single ratingof a target on behavioral dimensions (Borke-nau et al., 2004). Coding systems for behav-ior/emotion are available, with the RiversideBehavioral Q-Sort (Funder et al., 2000) and theFacial Action Coding System (FACS) developedby Ekman et al. (1978) as perhaps the bestknown and well-validated measures. Choices
also have to be made about how many observersto employ, who should observe the target behav-ior, and whether observation should be done liveor from videorecordings (Furr & Funder, 2007).These choices should be guided by the theoret-ical questions each study is attempting to an-swer. It is also important to assess the qualityof coded data; indices of inter-rater agreementare typically computed as intraclass correlations(Shrout & Fleiss, 1979), which may be com-puted in various ways in order to best suit thestructure of one’s coding system. The recent in-crease in commitment to behavioral observationand advances in technology making this methodmore feasible are moving differential psychologytoward a becoming a more mature science of ac-tual behavior.
Physiological measures
The utilization of physiological measures istypically done with the purpose of discover-ing the biological basis or etiology of individ-ual differences (Harmon-Jones & Beer, 2009).Neuroimaging techniques are among the mostpopular physiological measures employed; thespecific neuroimaging technique used in a par-ticular study depend on the theoretical ques-tion the study is designed to investigate. Re-searchers interested in how brain structure re-lates to individual differences rely on MagneticResonance Imaging (MRI) in order to generatedetailed images of the brain (DeYoung et al.,in press). Studies concerned with brain activitymay use functional MRI (fMRI) (Canli, 2004).fMRI relies on the blood oxygen level dependent(BOLD) contrast effect to measure blood flow asan indicator of brain activity. Another way thatdifferential psychologists measure brain activity(D. L. Johnson et al., 1999) is Positron EmissionTomography which detects gamma rays emit-ted from a tracer introduced to the body togenerate images. fMRI and PET have goodspatial resolution but poor temporal resolution;therefore, researchers interested in measuringbrain processes as they occur (Wacker et al.,2006) may prefer to use electroencephalogra-phy (EEG). EEG records electical activity alongthe scalp generated by neurons firing in brainand has good temporal resolution but poor spa-tial resolution. A popular physiological measure
6 REVELLE, CONDON, AND WILT
outside of the brain is salivary cortisol (Chida &Steptoe, 2009), which relates to HypothalamicPituiatary Axis stress-response. Other physio-logical measures showing reliable individual dif-ferences include body temperature (Baehr et al.,2000), blood pressure, heart-rate, skin conduc-tance, and eye-blink startle response (Diamond& Otter-Henderson, 2007).
Remote data collection
Perhaps the most challenging methodologi-cal question for personality researchers is thedesire to assess individual differences in a man-ner that holistically reflects all the relevant as-pects of personality through the use of assess-ment tools with fine-grain accuracy. In fact,this is generally not possible due to limitationsregarding the number of items that individualparticipants are willing to take. The historicalresolution of this challenge has been the pursuitof accurate data which is limited to a uniquedomain. Today, it is possible to meet this chal-lenge through the use of remote data collectionprocedures and the combination of responsesfrom vastly greater sample sizes. The techniqueof Synthetic Aperture Personality Assessment(Revelle et al., 2010) gives each participant asmall subset of items from a larger item pool,and then combines these responses across sub-jects to synthetically form very large covariancematrices.
The main source of remote data collectioncomes from survey-oriented, web-based stud-ies. Though the use of internet samples isappealing in terms of the ease of collectionand the diversity of samples (Gosling et al.,2004), this relatively new method does presentsome unique challenges. Of considerable im-portance is the implementation of safeguardsagainst the incidence of repeated participationby the same subject. The incidence of more in-sidious concerns (such as misrepresentation oritem-skipping) is more difficult to avoid andmust therefore be taken into account duringdata analysis (J. A. Johnson, 2005). In addi-tion, traditional paper-and-pencil measures donot always transfer to electronic formats with-out distortion and, even when such migrationsare possible, care must be taken to maintainvalidity (Buchanan et al., 2005). To this end, a
large number of scales are accessible in the pub-lic domain through the central IPIP repository(Goldberg et al., 2006).
While the web-based studies are the primarysource of growth within the use of remote datacollection, several other technologies contributeto this methodology. Some of these measuresare addressed below in the context of longi-tudinal studies. Notably, recent advances in“self-tracking” technologies provide more reli-able replacements to diary-based studies of be-havioral and affective measures. One exampleof this technology is the electronically activatedrecorder (EAR) employed by Mehl et al. (2007).Research based on the use of this device to datehave explored differences in the conversationalhabits across gender and well-being.
National and international surveys
One consideration for researchers who are in-terested in exploring individual differences inlongitudinal research is that data from somestudies are openly accessible. For instance, theU.S. Bureau of Labor Statistics allows free ac-cess to the results of several longitudinal surveys(though some datasets may require applica-tion). Examples of these studies include the Na-tional Longitudinal Survey of Youth (NLSY79),which has tracked about 13,000 young menand women since 1979 and their biological chil-dren since 1988 (Harvey, 1999). Many othercountries (including Britain, Australia, Ko-rea, Switzerland, Canada and Germany) offercomparable datasets which are openly avail-able or can be accessed through the Cross-National Equivalent File (Burkhauser & Lillard,2007). Of course, many research topics are notamenable to the use of pre-existing datasets.When it is appropriate however, these resourcescan be a practical and invaluable means of con-ducting longitudinal or cross sectional analysesin a fraction of the time that is typically re-quired.
In addition to these longitudinal data sets,large scale assessments often make use of multi-ple data collection methods. The Programmefor International Student Assessment (PISA)for example, employs both survey methods (forcollecting information about participants’ back-grounds and opinions) and behavioral methods

METHODS IN DIFFERENTIAL PSYCHOLOGY 7
(for testing participants’ aptitude in mathemat-ics, reading, science and problem-solving skills).The data from PISA assessments, which areconducted with 15 year old participants everythree years in as many as 65 countries, are dis-seminated by the OECD and freely available foranalysis (Anderson et al., 2007). See (e.g., Hunt& Wittmann, 2008) for an examination of therelationships between national intelligence, lev-els of educational attainment and national pros-perity. A variety of other topics are coveredthrough similar assessments by national and in-ternational agencies, including e.g., the Interna-tional Monetary Fund, the World Health Orga-nization and the United Nations. Despite lack-ing the flexibility of customized designs, use ofsuch data allows for insightful comparative anal-yses across countries and large groups.
Animal research
As it has with other fields, the study ofanimal behavior offers individual difference re-searchers the opportunity to design experimentswhich would be impractical or unethical withhuman subjects (Vazire et al., 2007). Untilrecently the use of animal research to studydifferential psychology was primarily in lesionand drug studies (e.g., Gray, 1982; Gray & Mc-Naughton, 2000) or in multi-generation selec-tion studies for reactivity in the rat (Broad-hurst, 1975). Observational studies of ongoingbehavior in non-human animals in unrestrictedenvironments has been relatively limited, hav-ing been constrained by measurement chal-lenges (Gosling & Vazire, 2002) and the“specterof anthropomorphism” (Gosling & John, 1999).Research to date has included such obvious sub-jects as dogs and chimpanzees in addition tomore surprising choices, such as snakes and oc-topi (Gosling, 2001) or the pumpkin seed sun-fish (Coleman & Wilson, 1998). Such animal re-search are currently limited to the use of obser-vational behavioral reports and include a num-ber of unique challenges (Vazire et al., 2007).It is likely however that the ability of animalresearch to contribute to the study of humanpersonality will increase over time as best prac-tices are identified and further developed.
Types of designs
As has been ruefully commented upon manytimes (Cronbach, 1957; Eysenck, 1966; Vale& Vale, 1969), the broad field of psychol-ogy has represented two seemingly antitheti-cal approaches: the experimental and the ob-servational . Reconciliations and unifications ofthese approaches have been repeatedly calledfor (Cronbach, 1957, 1975; Eysenck, 1997) withlimited success (Revelle & Oehleberg, 2008).Both approaches have the same goal: to identify(causal) sources of variance unconfounded withother variables.
The classic difference between these two ap-proaches has been an emphasis upon centraltendencies versus variation, between statisticsemphasizing group differences (t and F ) ver-sus those emphasizing variation and covariation(σ2 and r). But with the realization that thesestatistics are all special cases of the general lin-ear model it became clear that the differencewas not one of analysis, but rather of theorytesting.
Experimentalapproaches
The essence of an experimental approach israndom assignment to condition. Randomiza-tion serves to break the correlation betweenexperimentally manipulated Independent Vari-ables (IVs) from non-observed but potentiallyConfounding Variables (CVs). The set of po-tentially confounding variables is infinite, butincludes individual differences in age, sex, socialstatus, education, prior experience, and moti-vation as well as situational variables such astime of day, immediate past experience, inter-actions between subject variables and experi-menter characteristics (e.g., sex of subject in-teraction with sex of experimenter). By ran-domly assigning participants to experimentalconditions, the expected value of the correla-tion of the IV with the CVs is zero. Althoughnever actually zero, as sample size increases, theunobserved confounding correlations will tendtowards zero.

8 REVELLE, CONDON, AND WILT
Person by condition interactions
Experimental approaches to the study of in-dividual differences would seem oxymoronic, forhow can we randomly assign individual differ-ences? We can not. But we can investigatethe relationship between individual differencesand the experimentally manipulated conditionsto test theories of individual differences. Thepower of interactions between individual dif-ferences (sometimes called Person Variables orPVs) and our experimental IVs is that the PV *IV interaction allows for a clearer understand-ing of the limits of the effects of both. Inter-actions show the limit of an effect. By havingan interaction, we can rule out many extrane-ous explanations. That introversion is associ-ated with better performance on exams could bebecause introverts are smarter than their moreextraverted colleagues. But with a stress ma-nipulation that reverses the rank orders of in-troversion and performance, we can rule out anability explanation (Revelle et al., 1976).
Between-person vs. Within-Person. Individ-ual differences researchers study factors thatvary across individuals (between-person vari-ability) and factors that vary across time andsituation within the same individual (within-person variability)1. It is important to real-ize that, although the between-person relation-ship for two variables will mirror the within-person relationship for those variables in someinstances, this is not a necessarily the case(Fleeson et al., 2002). Thus, for the same reasonthat questions pertaining to between-group andwithin-group relationships must be analyzedseparately, so must investigations of between-person and within-person relationships.
Lab based
The power of interactions of a experimentalvariable with an individual difference variablewas shown in a series of experimental studiesexamining the effect of caffeine induced arousalon cognitive performance. Rather than findingany main effects of individual differences or ofcaffeine it became clear that caffeine enhancedperformance for some of the people, some of thetime. The first study in this series showed that
caffeine and time pressure hindered the perfor-mance on a complex test similar to the Gradu-ate Record Exam about .6 standard deviationsfor the most introverted participants while si-multaneously enhancing performance about thesame amount for the more extraverted partic-pants (Revelle et al., 1976). This was initiallytaken as evidence in favor of the arousal modelof extravesion (Eysenck, 1967). But with fur-ther examination, this effect was true only in themorning, and only true for the impulsivity sub-component of extraversion (Revelle et al., 1980).This led to a rethinking of the arousal model aswell as to a reconceptualization of the measure-ment of extraversion (Rocklin & Revelle, 1981).Indeed, further experiments involving the inter-actions of anxiety with feedback manipulations,and the demonstration of the independence ofthese effects from the caffeine effects led to atheory integrating trait and state individual dif-ferences with situational stressors and cognitiveprocesses (Humphreys & Revelle, 1984).
Lab based studies have long been a stapleof research investigating Reinforcement Sensi-tivity Theory (Corr, 2008). Recent studies at-tempting to integrate theories of functional im-pulsivity with RST (Smillie & Jackson, 2006)and test whether fear and anxiety originate fromseparable neurobehavioral systems described byRST (Perkins et al., 2007) continue in this tra-dition. Additionally, research on individual dif-ferences in anxiety (Wilt et al., in press) exem-plify the wide range of experimental methodsavailable (Armstrong & Olatunji, 2009; Fox etal., 2001) to differential psychologists.
Randomized field studies
Although typically associated with lab basedstudies, experimental design also enhances fieldstudies (Cook et al., 1979). Consider the effectof anxiety on student performance in a gatewayscience course (in this case, a year long coursein biology is a requirement for a major in bio-logical sciences, Born et al., 2002). Prior workhad suggested that performance is enhanced for
1 Sometimes between-person variability is re-ferred to as interindividual variability, whereaswithin-person variability is referred to as intrain-dividual variability

METHODS IN DIFFERENTIAL PSYCHOLOGY 9
women and minority students when assigned tostudy groups. To avoid a confounding witha ‘volunteer effect’, Born et al. (2002) exam-ined how study groups interacted with anxietyand gender by randomly assigning volunteers tostudy groups or a control condition. At theend of the year they were able to disentanglethe study group effect (by comparing those ran-domly assigned to study groups and their ran-domly matched controls) from the volunteer ef-fect (by comparing volunteers not assigned tostudy groups with non-volunteers).
Many long term health studies have ran-domly assigned participants to condition.When analyzing these data, it is tempting justto include those who follow the research proto-col. Unfortunately, this is where individual dif-ferences become very important, for it has beenfound that conscientious placebo takers have re-duced mortality rates compared to their non-adherent counterparts (Gallagher et al., 1993;Horwitz et al., 1990; Irvine et al., 1999) Thatis, the behavioral correlates of personality canswamp any effects due to an experimental ma-nipulation.
Observationalapproaches
In contrast to experimental studies which canexamine the causal relationship between envi-ronmental manipulations and individual perfor-mance, observational studies try to infer latentstates based upon the covariance of various mea-sures at one time or the patterning of resultsacross time.
Cross sectional studies
Far more than any other type of design, cross-sectional studies represent the predominant ap-proach for researching individual differences.When employed to its full potential, a singlecross-sectional design has the power to capturea wide variety of correlations across multiple do-mains and emphasize the relevance of individualdifferences in the process. Most of the publishedliterature reflects this approach and does notneed to be discussed here.
Longitudinal studies
Though substantially outnumbered by cross-sectional designs, longitudinal studies haveplayed a crucial role in the evolution of differen-tial psychology as a field. The primary reasonrelatively few researchers have employed longi-tudinal designs historically is because they re-quire a greater commitment of resources andare therefore thought to introduce incrementalrisk, especially in academic environments wherefunding is uncertain and career development isoften tied to publication. However, it’s alsothe case that carefully constructed longitudi-nal studies can be considerably more power-ful than cross-sectional designs and that thisincremental power should be taken into ac-count when comparing the merits of both ap-proaches (Costa & McCrae, 1992). While lon-gitudinal studies may introduce new confound-ing variables, they typically reduce the varianceof cross-sectional measures of a given constructby virtue of repeated measures. More impor-tantly, they allow researchers to gather data onmany topics (e.g. the stability of traits over thelifespan) which cannot be adequately addressedwith cross-sectional approaches.
Longitudinal methods represent “the longway” of studying personality (Block, 1993), andin some cases those lengths have extended wellbeyond fifty years. Though able to inform anumber of important issues, the explicit - andperhaps most important - goal of these long-term studies is to identify the factors that leadto longer and healthier lives. For instance,several prominent examples of longitudinal re-search have explored the relationship betweenintelligence, morbidity and mortality, a fieldrecently referred to as cognitive epidemiology(Deary, 2009).
Based on the Scottish Mental Health Surveysof 1932 and 1947 and subsequent follow-ups,findings from Deary et al. (2004) demonstratethe higher intelligence levels in youth are pre-dictive of both survival and functional indepen-dence in old age. An earlier example is Ter-man’s Life-Cycle Study, which began in 1921and tracked high IQ school-children until theirdeaths (Friedman et al., 1995; Terman & Oden,1947). Though measures used by Terman were

10 REVELLE, CONDON, AND WILT
less developed than those in use today, theywere progressive for their time and sufficient forcorrelating life expectancy outcomes with sub-sequently developed personality constructs suchas the Big Five. Most notably, the findings in-clude correlations between longevity, conscien-tiousness and a lack of impulsivity.
Within the field of cognitive epidemiology,many researchers are using longitudinal meth-ods to further specify the factors which mediatelife outcomes. In terms of the differential ef-fects of maturational and generational changes,Elder (1998) has performed comparative anal-yses across longitudinal studies with the Ter-man Life-Cycle Study and the Berkeley Insti-tute studies, which tracked children born ap-proximately 10 and 20 years after the“Termites”(Block, 1971; Elder, 1998). On the basis of theage differences across these samples, Elder hasfocused his analysis on the differential devel-opmental impacts of the Great Depression andWorld War II (Elder, 1998; Elder et al., 1994).In the case of WWII, sample participants whowere older when entering military service paida higher price in terms of health outcomes andcareer interruption than those who entered atyounger ages (Elder et al., 1994). His findingssuggest that even global, historical events ofthis nature can have non-uniforms effects acrosspopulations which are largely dependent on age.
While comparison across different longitudi-nal designs is one method of examining cohorteffects, the Seattle Longitudinal Study achievedsimilar comparisons in a single study throughthe use of sampling with replacement (Schaie,1994). In addition to repeated assessment ofthe initial sample, finding from the SLS havebeen meaningfully informed by the addition ofnew participants at each seven-year assessment.In all cases, participants have been drawn fromthe membership of a HMO group in the Seat-tle, Washington area and include a wide vari-ety of professionals (from white- and blue-collarjobs) and their family members. Despite thislimited commonality, each assessment group hasincluded participants reflecting a wide range ofages.
Chief among the findings of the SLS is thepresence of substantial generational differencesacross the six latent constructs according to par-
ticipants’ birth year. In other words, it’s notonly the case that participants’ intellectual abil-ities vary by age but they also vary differentiallyfrom one generational cohort to the next. Whileseveral factors have been proposed to explainthis effect (Flynn, 1987, 1999, 2000), correla-tional data from the SLS suggest that improve-ments and exposure to formal education are ex-planatory factors. In any case, the SLS high-lights the unique power of longitudinal studiesby suggesting that prior cross-sectional studieswhich explored age-related declines in cognitiveability may inaccurately estimate the degree ofdecline due to cohort differences (Schaie, 1994).
Among more recent longitudinal research,the Study of Mathematically Precocious Youth(SMPY) was begun by Stanley in 1971 andcontinued by Benbow, Lubinski, and their col-laborators (Benbow et al., 1996) with the in-tent of identifying and addressing the educa-tional needs of mathematically gifted children.Though the scope of the study was later broad-ened slightly to include the needs of childrenwho are gifted in other domains (Lubinski &Benbow, 2006), SMPY remains distinguishedby the depth with which it has explored therelationship between the ability, temperamentand interests of uniquely gifted children. As-sessment is ongoing, but findings from SMPYwill undoubtedly inform recent efforts to en-courage greater interest among students in sci-ence, technology, engineering and mathematics(the “STEM” areas).
Brief with-in subject studies. The processof tracking subjects over long periods is boththe primary advantage of longitudinal studiesand the primary reason why they are not morewidely implemented. Not only is it more costlyand arduous to maintain contact with partici-pants after the initial phase of data collection,but longitudinal designs seldom produce mean-ingful findings over a short time horizon (Costa& McCrae, 1992). One means of mitigatingthis aspect of longitudinal design is to limit theduration of the study and/or increase the fre-quency of data collection.
When the duration of study and frequency ofdata collection are drastically changed, as oc-curs in brief with-in subject studies, the result-

METHODS IN DIFFERENTIAL PSYCHOLOGY 11
ing design may no longer appear longitudinal innature (though still clearly distinct from cross-sectional). Studies of this type assess partici-pants at very short intervals for a period of daysor weeks and are used to explore the ways thatbehavior is effected by transient affective states,motivational pressures and diurnal rhythms. Ofcourse, these designs cannot assess the long-term stability of attributes like typical longi-tudinal studies but this trade-off is acceptablewhen studying fine-grained behavioral patternsthat are often lost between the infrequent mea-surement intervals of long-range studies.
Historically, experiments of this nature wererestricted to the use of diary formats and suf-fered from issues related to data quality as aresult. Fortunately, the introduction of sev-eral new technologies in recent years has helpedto increase the ease of using this methodology.While cell phones are the most ubiquitous formof these technology, the list includes a broad ar-ray of self-tracking tools capable of measuringan increasing number of behavioral and inter-personal activities.
Of course the use of these technologies withlongitudinal designs of longer durations is pos-sible as well, but there are limits to the partic-ipants’ willingness to devote their free time toacademic research. While some existing tech-nologies are able to collect and upload data viathe Internet with minimal human involvement,the most germane data typically requires a de-gree of self-reflection on behalf of the partici-pant. In this respect, long-term studies withhigh frequencies of data collection are not likelyto employ current personality measures.
Nevertheless, the implementation of newdata collection technologies will almost cer-tainly influence the evolution of data collectiontechniques, and there is reason to believe thiswill be especially true in relation to brief within-subject designs. One hopes that further innova-tive development of these technologies will leadto exciting advances in personality research.
Methods of analysis
If Data = Model + Residual, the fundamen-tal question of analysis is how to estimate themodel? This depends, of course, on what the
model is, but in general the method is to use theappropriate computational tool, whether this isa graphical description of the data or multi-wave, multi-level latent class analysis. For al-most all problems facing the individual differ-ence researcher, the appropriate computationscan be done in the open source statistical sys-tem, R (R Development Core Team, 2009). De-veloped by a dedicated group of excellent statis-ticians, R has become the lingua franca of statis-tics and is becoming more used within psychol-ogy. In addition to the basic core R programwhich is freely available for download from theweb, there are more than 2,000 specialized pack-ages developed for different applications. Agrowing number of these packages are devotedto the problems of data analysis faced by theindividual differences researcher (e.g., the psychpackage by Revelle, 2010). R is not only free butis also very powerful, it is the statistics systemof choice for individual differences research.
Summary statistics and the problem ofscaling
The most simple model of data is just thecentral tendency. But depending upon distri-butional properties such as skew, the two mostcommon estimates (mean and median) can givedrastically different values. Consider the caseof family income in the United States accordingto the U.S. Census from 2008. Although meanfamily income was $66,570, median income wasjust $48,060. Any analysis using income as a co-variate needs to take into account its log-normalcharacteristics. Besides offering graphical toolsto detect such skewness, R has many ways totransform the data to produce “better behaved”data.
Non-linearities of the relationship betweenthe latent variable of interest and the observedvariable can lead to “fan-fold” interactions be-tween ability and experimental manipulations(or just time) that suggest that individuals withhigher initial scores change more or less than in-dividuals with initially lower scores. Considerthe hypothetical effect of one year of collegeupon writing and mathematics performance.Writing scores at one university go from 31 to 70for an increase of 39 points but at another the

12 REVELLE, CONDON, AND WILT
scores go from 1 to 7 for an increase of 6 points.Most people would interpret this interaction (again of 39 versus a gain of 6 points) to reflect ei-ther the quality of instruction or the quality andmotivation of the students. But when the sameschools show that math scores at the first uni-versity improve just 6 points from 93 to 99 whilegoing up 39 points (from 30 to 69) at the theother school, they interpret this change as rep-resenting a ceiling effect for the math test. Butthis interaction is exactly the same (althoughreversed) as the previous one. Such interactionsdue to the properties of the scale are also calledfloor and ceiling effects than can be eliminatedwith the appropriate monotone transformation.Unfortunately, these tend to be applied only ifthe interaction goes against expectation (Rev-elle, 2007).
The correlation coefficient and its near-est relatives
Sir Francis Galton may be credited with de-veloping the theory of the correlation coefficientin his paper on “co-relations and their measure-ment” (Galton, 1888) which followed his paper(Galton, 1886) discussing the “the coefficient ofreversion”. Although the correlation was origi-nally found by graphically fitting slopes to themedians for different values of the predictor(Galton, 1888), Pearson (1896) introduced thecorrelation coefficient bearing his name as theaverage cross product (the covariance) of stan-dard scores
rxy = Covzxzy = Cov xσx
yσy
=Covxy
σxσy(3)
and then Spearman (1904b) introduced the for-mula to psychologists in terms of deviationscores
r = ∑xiyi√∑x2
i ∑y2i
. (4)
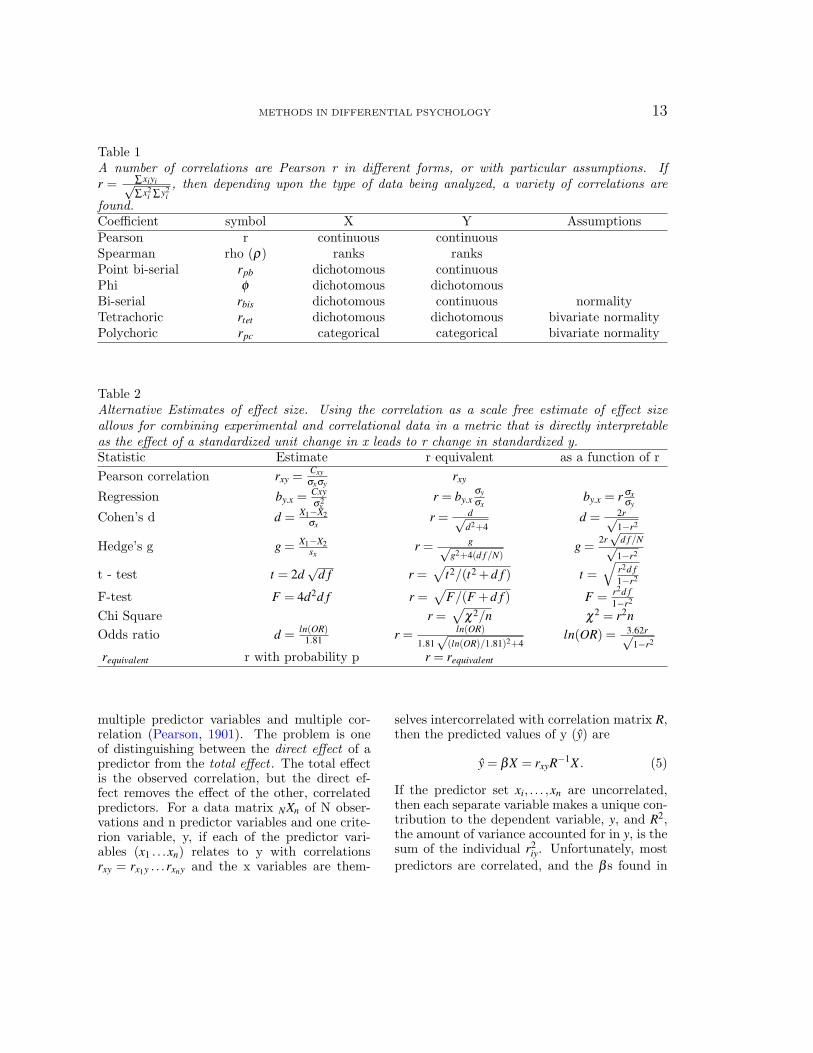
It is Equation 4 that is most useful for seeing therelationship between the Pearson Product Mo-ment Correlation Coefficient and a number ofother measures of correlation (Table 1). Whenthe data are continuous, r is known as a Pearsonr. If the data are expressed in ranks, then this isjust the Spearman rho. If X is dichotomous and
Y continuous, the resulting correlation is knownas a point bi-serial. If both X and Y are dichoto-mous, the correlation is known as Phi (φ). Allof these use the same formula, although thereare shortcuts that used to be used. Three ad-ditional correlation coefficients are listed whichwith the assumption of bivariate normality areequivalent to a Pearson r.
Researchers with an experimental bent tendto report seemingly different statistical esti-mates of the effect of one variable upon another.These are, however, merely transformations ofthe Pearson r (Table 2). Useful reviews of theuse of these and other ways of estimating ef-fect sizes for meta-analysis include Rosnow etal. (2000) and the special issue of PsychologicalMethods devoted to effect sizes (Becker, 2003).
With an appreciation of the different formsof the correlation it is possible to analyze tra-ditional data sets more appropriately and toreach important conclusions. In medicine andclinical psychology for example, diagnoses tendto be categorical (someone is depressed or not,someone has an anxiety disorder or not). Co-occurrence of both of these symptoms is calledcomorbidity . Diagnostic categories vary in theirdegree of comorbidity with other diagnostic cat-egories. From the point of view of correlation,comorbidity is just a name applied to one cellin a four fold table. It is possible to analyze co-morbidity rates by considering the probabilityof the separate diagnoses and the probability ofthe joint diagnosis. This gives the two by twotable needed for a φ or rtet correlation. For in-stance, given the base rates (proportions) of twodiagnostic categories (e.g., anxiety= .2 and de-pression =.15) and their co-occurence (comor-bidity, e.g., .1), it is straightforward to find thetetrachoric correlation between the two diag-noses (.75). By using this basic fact, Krueger(2002) converted the comorbidities of variousmental disorders to a matrix of tetrachoric cor-relations suitable for factor analysis and wasable to argue for a two dimensional structure(internalizing and externalizing disorders) for abroad set of personality disorders.
Multiple R and the General Linear Model
A straight forward generalization of bivari-ate correlation and regression is the problem of
METHODS IN DIFFERENTIAL PSYCHOLOGY 13
Table 1A number of correlations are Pearson r in different forms, or with particular assumptions. Ifr = ∑xiyi√
∑x2i ∑y2
i, then depending upon the type of data being analyzed, a variety of correlations are
found.Coefficient symbol X Y AssumptionsPearson r continuous continuousSpearman rho (ρ) ranks ranksPoint bi-serial rpb dichotomous continuousPhi φ dichotomous dichotomousBi-serial rbis dichotomous continuous normalityTetrachoric rtet dichotomous dichotomous bivariate normalityPolychoric rpc categorical categorical bivariate normality
Table 2Alternative Estimates of effect size. Using the correlation as a scale free estimate of effect sizeallows for combining experimental and correlational data in a metric that is directly interpretableas the effect of a standardized unit change in x leads to r change in standardized y.Statistic Estimate r equivalent as a function of rPearson correlation rxy = Cxy
σxσyrxy
Regression by.x = Cxyσ2
xr = by.x
σyσx
by.x = r σxσy
Cohen’s d d = X1−X2σx
r = d√d2+4
d = 2r√1−r2
Hedge’s g g = X1−X2sx
r = g√g2+4(d f /N)
g = 2r√
d f /N√1−r2
t - test t = 2d√
d f r =√
t2/(t2 + d f ) t =√
r2d f1−r2
F-test F = 4d2d f r =√
F/(F + d f ) F = r2d f1−r2
Chi Square r =√
χ2/n χ2 = r2nOdds ratio d = ln(OR)
1.81 r = ln(OR)1.81√
(ln(OR)/1.81)2+4ln(OR) = 3.62r√
1−r2
requivalent r with probability p r = requivalent
multiple predictor variables and multiple cor-relation (Pearson, 1901). The problem is oneof distinguishing between the direct effect of apredictor from the total effect . The total effectis the observed correlation, but the direct ef-fect removes the effect of the other, correlatedpredictors. For a data matrix NXn of N obser-vations and n predictor variables and one crite-rion variable, y, if each of the predictor vari-ables (x1 . . .xn) relates to y with correlationsrxy = rx1y . . .rxny and the x variables are them-
selves intercorrelated with correlation matrix R,then the predicted values of y (y) are
y = βX = rxyR−1X . (5)
If the predictor set xi, . . . ,xn are uncorrelated,then each separate variable makes a unique con-tribution to the dependent variable, y, and R2,the amount of variance accounted for in y, is thesum of the individual r2
iy. Unfortunately, mostpredictors are correlated, and the β s found in

14 REVELLE, CONDON, AND WILT
Equation 5 are less than the original correla-tions and since
R2 = ∑βirxiy = β′rxy
the R2 will be less as the predictors become morecorrelated. An interesting, but unusual case, isthat of suppression where a predictor, xs doesnot relate to the criterion, y, but does relate tothe other predictors. In this case xs still is usefulbecause it removes the variance in the other pre-dictors not associated with the criterion. Thisleads to an interesting research problem for notonly do we need to look for predictor of ourcriterion variable, we also need to look for non-predictors that predict the predictors!
The predictor set can be made up of any com-bination of variables, including the products orpowers of the original variables. The products(especially when mean centered) represent theinteractions of predictors (Cohen et al., 2003;Judd et al., 2009). Basic regression, multipleregression and graphic displays of residuals areall available in R using the lm or glm functions.The later considers the case when the depen-dent (criterion) variable is dichotomous suchas success or failure (logistic regression), dis-crete count data such as number of days miss-ing school or number of times married (Pois-son, quasi-Poisson, and negative binomial re-gression).
Spurious correlations
Although viewing the correlation coefficientas perhaps his greatest accomplishment, Pear-son (1910) listed a number of sources of spuriouscorrelations (Aldrich, 1995). These are chal-lenges to all kinds of correlation, simple as wellas multiple. Among these is the problem of ra-tios and of sums, and of correlations induced bymixing different groups. For the first problem,if two variables are expressed as ratios of a thirdvariable, they will necessarily be correlated witheach other. A related problem is when scoresare forced to add up to a constant (i.e., theyare ipsatized). In this case, even k uncorrelatedvariables will have a correlation of -1/(k-1) ifthey are ipsatized. As shown by Romer & Rev-elle (1984), the forced ipsatization of behaviorratings done by Shweder & D’Andrade (1980)
led to the false claim of systematic distortion ininterpersonal perception.
If data are pooled across groups, the overallcorrelation can be very different than the pooledwithin group correlation. Recognized as a prob-lem since Yule (1912), Simpsons paradox (Simp-son, 1951) was seen when sex discrimination inadmissions was reported at the University ofCalifornia, Berkeley. In 1973, UCB admittedabout 44% of male applicants but, only about35% of the females. What seems to be obvi-ous sex discrimination in admissions became apaper in Science when it was discovered thatthe individual departments, if discriminating atall, discriminated in favor of women (Bickel etal., 1975). The women were applying to the de-partments which admitted fewer applicants asa percentage of applicants
The human eye and brain are superb pat-tern detectors. Using graphical displays ratherthan numeric tables helps detect strange rela-tionships in one’s data that are due to variousartifact (Anscombe, 1973; Wainer, 1976; Wainer& Thissen, 1981). In a comparison of manystatistical procedures to detect the underlyingcorrelation in the presence of noise, the most ro-bust estimator (least sensitive to noise and mostsensitive to the underlying correlation) was thepooled estimates of a set of students trained tolook at scatter plots (Wainer & Thissen, 1979).
Data quality: Reliability
The correlation of two variables is an indexof the degree that variability in one is associ-ated with variability in the other. It is notan index of causality, nor does it consider thequality of measurement of either variable. ForX may directly cause Y, Y may directly causeX, or both may be caused by an unobservedthird variable, Z. In addition, observed scores Xand Y are probably not perfect representationsof the constructs both are thought to measure.Thinking back to Equation 1, the measure of Xreflects a model of X as well as error in measure-ment. This realization led Spearman (1904b) todevelop the basic concepts of reliability theory.He was the first psychologist to recognize thatobserved correlations are attenuated from thetrue correlation if the observations contain er-ror.

METHODS IN DIFFERENTIAL PSYCHOLOGY 15
Now, suppose that we wish to as-certain the correspondence betweena series of values, p, and another se-ries, q. By practical observation weevidently do not obtain the true ob-jective values, p and q, but only ap-proximations which we will call p’and q’. Obviously, p’ is less closelyconnected with q’, than is p withq, for the first pair only correspondat all by the intermediation of thesecond pair; the real correspondencebetween p and q, shortly rpq hasbeen ”attenuated” into rp′q′ (Spear-man, 1904b, p 90).
To Spearman, the reliability of a test, p’, wasthe correlation with one just like it, p” (a paral-lel test). The problem of how to find test relia-bility has bedeviled psychometricians for morethan 100 years (Spearman, 1904b), (Spearman,1910), (Brown, 1910), (Guttman, 1945), Cron-bach (1951), and we can only hope that we arecoming to a solution (McDonald, 1999; Revelle& Zinbarg, 2009; Sijtsma, 2009).
Classical Test Theory. The solutions to thereliability question in classical test theory (Lord& Novick, 1968; McDonald, 1999) were exten-sions of the original suggestion by Spearman(1904b) for parallel tests. If estimated with twoor more tests, the reliability of the compositeis a function of the number of tests going intothe composite (Brown, 1910; Spearman, 1910).Guttman (1945), although arguing that relia-bility was only meaningful over time, proposedsix different ways of estimating reliability. Oneof these six (λ3) was discussed later by Cron-bach (1951) as coefficient α. Although routinelydismissed as an inappropriate estimate of relia-bility (Cronbach & Shavelson, 2004; McDonald,1999; Revelle, 1979; Sijtsma, 2009; Zinbarg etal., 2005), α remains the most reported estimateof reliability. But α is always less than or equalto the true reliability (Guttman, 1945; Sijtsma,2009) and is a poor way of assessing the homo-geneity of a test. A test can have a substantialα even though the test measures two unrelatedconcepts (McDonald, 1999; Revelle, 1979; Rev-elle & Zinbarg, 2009). With the use of the omegafunction in the psych package, the two estimates
developed by McDonald (1999), ωh and ωt arenow easily calculated. ωh (omega hierarchical)is the amount of variance that a general factoraccounts for in a test and ωt is the total amountof reliable variance in a test (McDonald, 1999;Revelle & Zinbarg, 2009). ωh ≤ α ≤ωt and onlyin the case of a purely one factor test with equalitem correlations will they be equal.
In addition to measures of reliability assessedusing measures of a test’s homogeneity, reliabil-ity is also of concern when measuring the sametrait twice over an extended period of time. Butsuch test-retest reliability or stability is not nec-essarily good for all measures. When assessingability or a personality trait such as extraver-sion, test-retest reliability over extended peri-ods of time is a sign of a stable trait. ThatIQ scores at age 11 correlate .66 with IQ scoresat age 80 is remarkable and shows the stabilityof IQ (Deary et al., 2004). It is important torecognize that reliability is a rank order con-cept and that even with a perfect test-retestcorrelation, all the scores could have increasedor decreased drastically. High test-retest relia-bility is not necessarily a good thing: to finda high test-retest of a measure of mood over afew days would imply that it is not a mood test,but rather a test of trait affectivity. That ratersgive similar ratings as other panel members ona selection board (Goldberg, 1966) is a sign ofinter-rater reliability, a global measure of whichcan be found by using the Intra-Class Correla-tion (Shrout & Fleiss, 1979).
The intraclass correlation expresses the relia-bility of ratings in terms of components of vari-ance associated with raters, targets, and theirinteractions and can be extended to other do-mains. That is, the analysis of variance ap-proach to the measurement of reliability focuseson the relevant facets in an experimental design.If ratings are nested within teachers whom arenested within schools, and are given at differenttimes, then all of these terms and their inter-actions are sources of variance in the ratings.First do an analysis of variance in a general-izability study to identify the variance compo-nents. Then determine which variance compo-nents are relevant for the application in the de-cision study in which one is trying to use themeasure (Cronbach et al., 1972). Similarly, the

16 REVELLE, CONDON, AND WILT
components of variance associated with parts ofa test can be analyzed in terms of the general-izability of the entire test.
Item Response Theory: the new psychomet-rics. Classic psychometrics treats items as ran-dom replicates and models the total score. Assuch, reliability of measurement is a betweenperson concept that does not allow a uniquespecification of the amount of error for each in-dividual. Reliability is enhanced if the test vari-ance goes up, and is meaningless for a single in-dividual. The “new psychometrics” (Embretson& Hershberger, 1999), on the other hand, con-siders the information in each item and thus isable to talk about the precision of estimate for ascore for a single person. Primary advantages ofIRT procedures are that they can identify itemsthat have differential item functioning (DIF)in different groups, test items can be formedinto tests tailored for specific ability groups, andtests can be made adaptive. This ability to tai-lor a test to a particular difficulty level, andeven more importantly, adaptively give itemsto reflect prior response patterns is one of thegreat strengths of IRT. For with a suitable itembank of many items, this allows researchers togive fewer items to any particular subject to ob-tain the same level of precision possible whenusing classical test methods. Examples of usingIRT in clinical assessments include everythingfrom measuring ease of breathing in cardiac pa-tients to assessing psychopathology in the clinic(Reise & Waller, 2009). There has been anexplosion of handbooks (Linden & Hambleton,1997) and textbooks (Bond & Fox, 2007; Em-bretson, 1996; Embretson & Reise, 2000) on IRTand now, with R it is easy to do. However, tocounter some of the enthusiasm for IRT, Mc-Donald (1999) and Zickar & Broadfoot (2009)suggest that classical test theory is still aliveand well and worth using for many applications.In most cases, the correlations of IRT and clas-sical estimates are very high and perhaps theprimary advantage of IRT modeling is the real-ization that observed responses are not linearlyrelated to the latent trait being assessed.
Data usefulness: Validity
That a test or a judge gives the same valuefor a person over time is nice, but what is moreimportant is do they give the right answer? Un-fortunately, this is a much harder question toanswer than is the test reliable. For what is theright answer? (Shooting an arrow into the samepart of a target is reliability, hitting the bull’seye is validity, but this requires having a target.)Assessing validity requires having a criterion.This was the chief problem when selecting spiesfor the Office of Strategic Services (OSS As-sessment Staff, 1948) as well as the selection ofPeace Corps Volunteers (Wiggins, 1973), bothclassics in assessment, and both suffering froman unclear criterion. If the criterion is fuzzy,validity will necessarily be low.
With the focus on data as model plus resid-ual, validity can be said to be measured by howwell the model fits, compared to other mod-els, and compared to what we would expect bychance. We prefer to have models using fewerparameters and not to be “multiplying entitiesbeyond necessity”2. This implies there is notone validity, but rather a process of validation.Is a model useful? Is a model more useful thanothers? Is there a more simple model that doesalmost as well? This has become the domain oflatent variable modeling.
Latent variable modeling
Spearman (1904b) recognized that the ob-served variable is befuddled with error (Equa-tion 2) and that the underlying latent (or unob-served) score should be modeled when correct-ing correlations for unreliability. By disattenu-ating correlations, he hoped to study the under-lying mechanisms. This switch from observed tolatent variables was the basis for factor analysisand the search for a general factor of intelligence(Spearman, 1904a).
2 Although this dictum is probably neither origi-nal with William of Ockham nor directly stated byhim (Thorburn, 1918), Ockham’s razor remains afundamental principal of science.

METHODS IN DIFFERENTIAL PSYCHOLOGY 17
Factor analysis, Components Analysis,Cluster Analysis, Multidimensional scal-ing
Classical test theory is a model of how mul-tiple items all measure a single latent trait. Byknowing the latent variable and the resultingcorrelations of items with that latent variable,it is possible to perfectly predict the covariancesbetween the items by taking the product of therespective correlations with the latent variable.This is the model known as a single factor. If allthe items in a correlation matrix, R, are mea-sures of latent variable, F then the correlationscan be modeled as
R = FF ′+U2 (6)
where F is a vector (a one dimension matrix)of correlations of the variables with the latentfactor, and U2 is a diagonal matrix of residuals.
Even when generalizing this to more thanone factor, Equation 6 remains the same ma-trix equation. Equation 6 when expressed interms of single correlations, the elements of R,becomes for i , j
ri j =c
∑k=1
fik f jk (7)
that is, the correlation between any two vari-ables is the sum of the products of their respec-tive factor loadings on c factors.
Equation 6 is expressed in matrix algebra andis (with modern computational techniques) avery simple problem. As originally developedin terms of operations on tables of correlations(e.g., Equation 7) this was a difficult problemwith one factor and an extremely difficult prob-lem with more than one factor. However, withthe introduction of matrix algebra to psycholo-gists in the 1930s, Thurstone (1935) and oth-ers were able to exploit the power of matrixalgebra (Bock, 2007). Recognizing that factoranalysis (FA) was just a statistical model fit-ting problem and that goodness of fit statis-tics could be applied to the resulting solutions(Lawley & Maxwell, 1963) made factor analy-sis somewhat more respectable. The advent ofpowerful and readily available computers and
computer algorithms to do factor analysis hasled to much more frequent use of this powerfulmodeling technique.
Factor analysis models the observed patternsof correlations between the variables as the sumof the products of factors. At the structurallevel, this is just a problem of solving a set ofsimultaneous equations and (roughly speaking)if there are more correlations than unobservedfactor loadings, the model is defined. Modelswith more or less factors can be compared interms of how well they capture the original co-variance or correlation matrix. However, be-cause the factors are themselves unobservable,they can only be estimated. Thus, althoughcompletely defined at the structural level, fac-tors are undefined at the level of the data.
This indeterminacy has led some to argueagainst factor analysis and in favor of princi-pal components analysis (PCA). PCA forms lin-ear sums of the observed variables to maximizethe variance accounted for by successive compo-nents. These components, since they are linearsums of the observed variables, are completelydetermined. But the components, by summingthe observed data, are no more parsimoniousthan the original data. If, however, just thefirst c components are extracted, then they arethe best set of c independent linear sums todescribe the data. Both factors and compo-nents have the same goal, to describe the orig-inal data and the original correlation matrix.Factor analysis models the off-diagonal elements(the common part) of the correlation matrix,while components model the entire correlationmatrix. Although the two models are concep-tually very different, and will produce very dif-ferent results when examining the structure ofa few (< 20− 30) variables, they are unfortu-nately frequently confused, particularly by someof the major commercial statistical packages.The models are different and should not be seenas interchangeable.
Exploratory Factor Analysis (EFA) is usedto find the structure of correlation matriceswhere items/tests are allowed to freely corre-late with all factors. Rotations towards sim-ple structure attempt to reduce the complex-ity of the solution and to make for more easilyinterpretable results. The factors as extracted

18 REVELLE, CONDON, AND WILT
from a EFA and the components as extractedfrom a PCA are independent. But it they aretransformed to give them a simple structurewhere each item has a high correlation on oneor only a few factors or components, then thefactors/components probably will become cor-related (oblique). What is the best transfor-mation and how best to determine the opti-mal number of factors remains a point of de-bate although there is almost uniform agree-ment among psychometricians that number offactors with eigen values greater than one isthe worst rule for determining the number offactors. This is, unfortunately, the default formany commercial programs.
A model which uses some of the logic of factoranalysis but differs from EFA is cluster anal-ysis. Hierarchical clustering algorithms (e.g.,ICLUST, Revelle, 1979) combine similar pairsof items into clusters and hierarchically combineclusters until some criteria (e.g, β or the worstsplit half reliability) fails to increase. ICLUST,as implement in R has proved useful in form-ing reliable and independent scales in an easilyunderstood manner (Cooksey & Soutar, 2006;Markon, 2010).
An alternative data reduction and descrip-tion technique that can produce drastically dif-ferent solutions from FA or PCA is multidi-mensional scaling (MDS). MDS is also a fittingprocedure, but when working with a correlationmatrix, rather than treat the correlations as de-viating from zero, MDS tries to minimize thedeviations of the correlations from each other.That is to say, it fits the correlation matrix afterremoving the average correlation. The result-ing solutions, particularly when the data have ageneral factor (e.g., ability tests) represent howdifferent tests are from the average test, ratherthan how different correlations are from zero.This can be particularly useful when examin-ing the micro-structure of a battery of highlycorrelated tests.
Structural Equation modeling
Structural Equation Modeling (SEM) com-bines basic regression techniques with factoranalysis modeling of the measurement of vari-ables (Loehlin, 2004). Essentially, it is regres-sion analysis applied to the dis-attenuated co-
variance matrix. In the modeling tradition itforces one to specify a model and then pro-vides statistical estimates of fit that can becompared to alternative models. The powerof SEM is that complex developmental growthmodels (McArdle, 2009), or hierarchical mod-els of ability (Horn & McArdle, 2007) can betested against alternative models. Examplesapplied to personality measurement include aMulti-trait Multi method analysis of the Big 5(Biesanz & West, 2004). Perhaps a disadvan-tage of the ease of running SEM programs, isthat some users are misled about the strengthof their results. Because of the tendency to drawSEM path models with directional arrows, someusers of SEM techniques mistakenly believe thatthey are testing causal models but are disabusedof this when they realize that the models fitequally well when the “causal” direction is re-versed. Other users fail to realize that a goodmodel fit does not confirm a model and that itis necessary to consider fits of the multiplicityof alternative models.
Multi level modeling
The correlation within groups or individu-als is not the same as the correlation betweengroups or individuals. What appears to bea strong relationship across groups can vanishwhen considering the individual within groups(Robinson, 1950; Yule, 1912). What had beenseen as a challenge is now treated using thetechniques of multi-level modeling. The use ofmulti-level modeling techniques (also known asHierarchical Linear Models or mulit-level Ran-dom Coefficient models) disentangle the effectsof individuals from other, grouping effects ineverything from developmental growth curvestudies to studies of organizational effectiveness(Bliese et al., 2007). The clear two-three dimen-sional structure of affect as assessed between in-dividuals (Rafaeli & Revelle, 2006) differs fromindividual to individual in terms of the pattern-ing of affect experience overtime within individ-uals Rafaeli et al. (2007). What appear to besystematic effects of birth order on intelligencedisappear when modeled within families (Wich-man et al., 2006).

METHODS IN DIFFERENTIAL PSYCHOLOGY 19
Computer modeling
Although hard to tell from reading most ofliterature in differential psychology, not all the-ories are tested by data analyzed using the gen-eral linear model. Some theories make predic-tions that are best tested using computer sim-ulations. The theories are tested for reason-ableness of results rather than fits to observa-tions of the behavior of living subjects. The Dy-namics of Action (Atkinson & Birch, 1970) andits reparameterization as the Cues-Tendency-Action (CTA) model (Fua et al., 2010; Revelle,1986) predict dynamic patterning of behaviorthat is a non-linear consequence of the initialparameters. Connectionist models of personal-ity (Read et al., 2010) or computational modelsof individual differences in reinforcement sensi-tivity (Pickering, 2008) make similar non-linearpredictions that show the power of a few basicparameters in producing wide ranging variabil-ity in predicted outcome. Modeling is a methodof research that has proven to very powerful infields ranging from climate research to evolu-tionary biology to cognitive psychology. Withthe ease of use of modeling software we can ex-pect modeling to become a more common re-search method in differential psychology.
Conclusion
Differential Psychology is an extremely broadarea of study. We have reviewed the majorthemes of data collection and methods of dataanalysis with the recognition that each sectionis worthy of a chapter in its own right. The ba-sic theme is that Data = Model + Residual andthe researcher needs to decide what constitutesdata, what is an appropriate model, and whatis reasonable to leave as a residual for someoneelse to model. In terms of data collection weare limited only by our imagination. Althoughgreat progress has been made since Galton andSpearman, the problems of data analysis remainthe same. How to model and evaluate modelsof data.
References
Aldrich, J. (1995). Correlations genuine and spu-rious in Pearson and Yule. Statistical Science,10 (4), 364-376.
Anderson, J., Lin, H., Treagust, D., Ross, S., &Yore, L. (2007). Using large-scale assessmentdatasets for research in science and mathematicseducation: Programme for International StudentAssessment (PISA). International Journal of Sci-ence and Mathematics Education, 5 (4), 591–614.
Anscombe, F. J. (1973). Graphs in statistical anal-ysis. The American Statistician, 27 (1), 17–21.
Armstrong, T., & Olatunji, B. (2009). What theysee is what you get: Eye tracking of attentionin the anxiety disorders. Psychological Science,23 (3).
Atkinson, J. W., & Birch, D. (1970). The dynamicsof action. New York, N.Y.: John Wiley.
Baehr, E. K., Revelle, W., & Eastman, C. I. (2000).Individual differences in the phase and amplitudeof the human circadian temperature rhythm:with an emphasis on morningness-eveningness.Journal of Sleep Research, 9 (2), 117–127.
Baumeister, R. F., Vohs, K. D., & Funder, D. C.(2007). Psychology as the science of self-reportsand finger movements: Whatever happened toactual behavior? Perspectives on PsychologicalScience, 2 (4), 396-403.
Becker, B. J. (2003). Introduction to the specialsection on metric in meta-analysis. PsychologicalMethods, 8 (4), 403-405.
Benbow, C. P., Lubinski, D. J., & Stanley, J. C.(1996). Intellectual talent: psychometric and so-cial issues. Baltimore: Johns Hopkins UniversityPress.
Bickel, P. J., Hammel, E. A., & O’Connell, J. W.(1975). Sex bias in graduate admissions: Datafrom Berkeley. Science, 187 (4175), 398-404.
Biesanz, J. C., & West, S. G. (2004). To-wards understanding assessments of the Big Five:Multitrait-multimethod analyses of convergentand discriminant validity across measurement oc-casion and type of observer. Journal of Person-ality , 72 (4), 845–876.

20 REVELLE, CONDON, AND WILT
Bliese, P. D., Chan, D., & Ployhart, R. E. (2007).Multilevel methods: Future directions in mea-surement, longitudinal analyses, and nonnormaloutcomes. Organizational Research Methods,10 (4), 551-563.
Block, J. (1971). Lives through time. Berkeley:Bancroft Books.
Block, J. (1993). Studying personality the longway. In D. C. Funder, R. Parke, C. Tomlinson-Keasey, & K. Widaman (Eds.), Studying livesthrough time: personality and development (pp.9–41). Washington, D.C.: American Psychologi-cal Association.
Bock, R. D. (2007). Rethinking thurstone. InR. Cudeck & R. C. MacCallum (Eds.), Fac-tor analysis at 100: Historical developmentsand future directions (p. 35-45). Mahwah, NJ:Lawrence Erlbaum Associates Publishers.
Bond, T., & Fox, C. (2007). Applying the Raschmodel: Fundamental measurement in the humansciences (2nd ed.). Mahwah, NJ, US: LawrenceErlbaum.
Borkenau, P., Mauer, N., Riemann, R., Spinath,F. M., & Angleitner, A. (2004). Thin slicesof behavior as cues of personality and intelli-gence. Journal of Personality and Social Psy-chology , 86 (4), 599-614.
Borkenau, P., Riemann, R., Angleitner, A., &Spinath, F. M. (2001). Genetic and environ-mental influences on observed personality: Ev-idence from the german observational study ofadult twins. Journal of Personality and SocialPsychology , 80 (4), 655-668.
Born, W. K., Revelle, W., & Pinto, L. H. (2002).Improving biology performance with workshopgroups. Journal of Science Education and Tech-nology , 11 (4), 347-365.
Box, G. E. P. (1979). Some problems of statis-tics and everyday life. Journal of the AmericanStatistical Association, 74 (365), 1–4.
Broadhurst, P. (1975, 10 29). The maudsley re-active and nonreactive strains of rats: A survey.Behavior Genetics, 5 (4), 299–319.
Brown, W. (1910). Some experimental results in thecorrelation of mental abilities. British Journal ofPsychology , 3 (3), 296-322.
Buchanan, T., Johnson, J. A., & Goldberg, L. R.(2005). Implementing a five-factor personality in-ventory for use on the internet. European Journalof Psychological Assessment , 21 (2), 115-127.
Burisch, M. (1984). Approaches to personalityinventory construction. American Psychologist ,39 (3), 214-227.
Burkhauser, R. V., & Lillard, D. R. (2007). The ex-panded Cross-National Equivalent File: HILDAjoins its international peers. Australian EconomicReview , 40 (2), 208–215.
Canli, T. (2004). Functional brain mapping of ex-traversion and neuroticism: learning from indi-vidual differences in emotion processing. Journalof Personality , 72 (6), 1105-1132.
Cattell, R. B. (1946). Personality structure andmeasurement. I. The operational determinationof trait unities. British Journal of Psychology ,36 , 88-102.
Cattell, R. B. (1966). The data box: Its orderingof total resources in terms of possible relationalsystems. In R. B. Cattell (Ed.), Handbook ofmultivariate experimental psychology (p. 67-128).Chicago: Rand-McNally.
Cattell, R. B., & Stice, G. (1957). Handbook for thesixteen personality factor questionnaire. Cham-paign, Ill.: Institute for Ability and PersonalityTesting.
Chernyshenko, O. S., Stark, S., Drasgow, F., &Roberts, B. W. (2007). Constructing personalityscales under the assumptions of an ideal pointresponse process: Toward increasing the flexibil-ity of personality measures. Psychological Assess-ment , 19 (1), 88-106.
Chida, Y., & Steptoe, A. (2009). Cortisol awakeningresponse and psychosocial factors: a systematicreview and meta-analysis. Biological Psychology ,80 (3), 265-278.
Clark, L. A., & Watson, D. (1995). Constructingvalidity: Basic issues in objective scale develop-ment. Psychological Assessment , 7 (3), 309 - 319.
Cohen, J., Cohen, P., West, S. G., & Aiken, L. S.(2003). Applied multiple regression/correlationanalysis for the behavioral sciences (3rd ed ed.).Mahwah, N.J.: L. Erlbaum Associates.
METHODS IN DIFFERENTIAL PSYCHOLOGY 21
Coleman, K., & Wilson, D. S. (1998). Shyness andboldness in pumpkinseed sunfish: individual dif-ferences are context-specific. Animal Behaviour ,56 (4), 927 - 936.
Cook, T., Campbell, D., & Day, A. (1979). Quasi-experimentation: Design & analysis issues forfield settings. Houghton Mifflin Boston.
Cooksey, R., & Soutar, G. (2006). Coefficientbeta and hierarchical item clustering - an an-alytical procedure for establishing and display-ing the dimensionality and homogeneity of sum-mated scales. Organizational Research Methods,9 , 78-98.
Coombs, C. (1964). A theory of data. New York:John Wiley.
Corr, P. J. (2008). The reinforcement sensitivitytheory of personality (P. J. Corr, Ed.). Cam-bridge: Cambridge University Press.
Costa, P. T., & McCrae, R. R. (1985). NEO PIprofessional manual. Odessa, FL: PsychologicalAssessment Resources, Inc.
Costa, P. T., & McCrae, R. R. (1992). Multipleuses for longitudinal personality data. EuropeanJournal of Personality , 6 (2), 85–102.
Cronbach, L. J. (1951). Coefficient alpha and theinternal structure of tests. Psychometrika, 16 ,297-334.
Cronbach, L. J. (1957). The two disciplines of sci-entific psychology. American Psychologist , 12 ,671-684.
Cronbach, L. J. (1975). Beyond the two disciplinesof scientific psychology. American Psychologist ,30 , 116-127.
Cronbach, L. J., Gleser, G. C., Nanda, H., & Ra-jaratnam, N. (1972). The dependability of be-havioral measurements: Theory of generalizabil-ity for scores and profiles. New York: Wiley.
Cronbach, L. J., & Shavelson, R. J. (2004). My cur-rent thoughts on coefficient alpha and successorprocedures. Educational and Psychological Mea-surement , 64 (3), 391-418.
Deary, I. J. (2009). Introduction to the special issueon cognitive epidemiology. Intelligence, 37 , 517–519.
Deary, I. J., Whiteman, M., Starr, J., Whalley, L.,& Fox, H. (2004). The impact of childhood in-telligence on later life: following up the Scottishmental surveys of 1932 and 1947. Journal of Per-sonality and Social Psychology , 86 (1), 130–147.
DeYoung, C. G., Hirsh, J. B., Shane, M. S., Pa-pademetris, X., Rajeevan, N., & Gray, J. R. (inpress). Testing predictions from personality neu-roscience. Psychological Science.
Diamond, L., & Otter-Henderson, K. D. (2007).Physiological measures. In R. Robins, C. R. Fra-ley, & R. F. Krueger (Eds.), Handbook of researchmethods in personality psychology (p. 370-388).New York: The Guilford Press.
Digman, J. M. (1963). Principal dimensions of childpersonality as inferred from teachers’ judgments.Child Development , 34 (1), 43–60. Available fromhttp://www.jstor.org/stable/1126826
Digman, J. M. (1990). Personality structure: Emer-gence of the five-factor model. Annual Review ofPsychology., 41 , 417-440.
Durbin, C. E., Hayden, E., Klein, D., & Olino, T.(2007). Stability of laboratory-assessed tempera-mental emotionality traits from ages 3 to 7. Emo-tion, 7 (2), 388–399.
Durbin, C. E., & Klein, D. N. (2006). 10-year sta-bility of personality disorders among outpatientswith mood disorders. Journal of Abnormal Psy-chology., 115 (1), 75-84.
Durbin, C. E., Klein, D. N., Hayden, E. P., Buck-ley, M. E., & Moerk, K. C. (2005). Tempera-mental emotionality in preschoolers and parentalmood disorders. Journal of Abnormal Psychol-ogy , 114 (1), 28-37.
Ekman, P., Friesen, W. V., & Hager, J. C. (1978).Facial action coding system. Palo Alto, CA: Con-sulting Psychologists Press.
Elder, G. H. (1998). The life course as developmen-tal theory. Child Development , 69 (1), 1–12.
Elder, G. H., Shanahan, M., & Clipp, E. (1994).When war comes to men’s lives: Life-course pat-terns in family, work, and health. Psychology andAging , 9 (1), 5–16.
Embretson, S. E. (1996). The new rules of measure-ment. Psychological Assessment , 8 (4), 341-349.
22 REVELLE, CONDON, AND WILT
Embretson, S. E. (1998). A cognitive design sys-tem approach to generating valid tests: Applica-tion to abstract reasoning. Psychological Meth-ods, 3 (3), 380 - 396.
Embretson, S. E., & Hershberger, S. L. (1999). Thenew rules of measurement : what every psychol-ogist and educator should know. Mahwah, N.J.:L. Erlbaum Associates.
Embretson, S. E., & Reise, S. P. (2000). Item re-sponse theory for psychologists. Mahwah, N.J.:L. Erlbaum Associates.
Eysenck, H. J. (1966). Personality and experimentalpsychology. Bulletin of the British PsychologicalSociety , 19 , 1-28.
Eysenck, H. J. (1967). The biological basis of per-sonality. Springfield: Thomas.
Eysenck, H. J. (1997). Personality and experimen-tal psychology: The unification of psychology andthe possibility of a paradigm. Journal of Person-ality and Social Psychology , 73 (6), 1224-1237.
Eysenck, H. J., & Eysenck, S. B. G. (1968). Man-ual for the Eysenck Personality Inventory. SanDiego, CA: Educational and Industrial TestingService.
Fiske, D. W. (1949). Consistency of the factorialstructures of personality ratings from differentsources. Journal of Abnormal and Social Psy-chology , 44 , 329-344.
Fleeson, W., Malanos, A. B., & Achille, N. M.(2002). An intraindividual process approach tothe relationship between extraversion and pos-itive affect: Is acting extraverted as “good” asbeing extraverted? Journal of Personality andSocial Psychology , 83 (6), 1409-1422.
Flynn, J. R. (1987). Massive IQ gains in 14 nations:What IQ tests really measure. Psychological Bul-letin, 101 (2), 171-191.
Flynn, J. R. (1999). Searching for justice: Thediscovery of IQ gains over time. American Psy-chologist , 54 (1), 5–20.
Flynn, J. R. (2000). IQ gains and fluid g. AmericanPsychologist , 55 (5), 543.
Fox, E., Russo, R., Bowles, R., & Dutton, K.(2001). Do threatening stimuli draw or hold vi-sual attention in subclinical anxiety? Journal ofExperimental Psychology: General , 130 (4), 681-700.
Friedman, H. S., Tucker, J. S., Schwartz, J. E.,Tomlinson-Keasey, C., Martin, L. R., Wingard,D. L., et al. (1995). Psychosocial and behavioralpredictors of longevity: The aging and death ofthe “termites”. American Psychologist , 50 (2), 69- 78.
Fua, K., Revelle, W., & Ortony, A. (2010). Mod-eling personality and individual differences: theapproach-avoid-conflict triad. In Cogsci 2010.
Funder, D. C. (2001). Personality. Annual Reviewof Psychology , 52 , 197-221.
Funder, D. C., Furr, R., & Colvin, C. (2000). TheRiverside Behavioral Q-sort: A tool for the de-scription of social behavior. Journal of Person-ality , 68 (3), 451-489.
Furr, R., & Funder, D. (2007). Behavioral observa-tion. Handbook of research methods in personalitypsychology , 273–291.
Gallagher, E. J., Viscoli, C. M., & Horwitz, R. I.(1993). The relationship of treatment adherenceto the risk of death after myocardial infarction inwomen. JAMA, 270 (6), 742-744.
Galton, F. (1886). Regression towards mediocrityin hereditary stature. Journal of the Anthropo-logical Institute of Great Britain and Ireland , 15 ,246-263.
Galton, F. (1888). Co-relations and their measure-ment. Proceedings of the Royal Society. LondonSeries, 45 , 135-145.
Goldberg, L. R. (1966). Reliability of peace corpsselection boards: A study of interjudge agree-ment before and after board discussions. Journalof Applied Psychology , 50 (5), 400 - 408.
Goldberg, L. R. (1972). Parameters of personalityinventory construction and utilization: A com-parison of prediction strategies and tactics. Mul-tivariate Behavioral Research Monographs. No72-2 .
Goldberg, L. R. (1990). An alternative “descrip-tion of personality”: The big-five factor struc-ture. Journal of Personality and Social Psychol-ogy , 59 (6), 1216-1229.
Goldberg, L. R. (1999). A broad-bandwidth, pub-lic domain, personality inventory measuring thelower-level facets of several five-factor models. In

METHODS IN DIFFERENTIAL PSYCHOLOGY 23
I. Mervielde, I. Deary, F. De Fruyt, & F. Os-tendorf (Eds.), Personality psychology in Europe(Vol. 7, p. 7-28). Tilburg, The Netherlands:Tilburg University Press.
Goldberg, L. R., Johnson, J. A., Eber, H. W.,Hogan, R., Ashton, M. C., Cloninger, C. R., etal. (2006). The international personality itempool and the future of public-domain personalitymeasures. Journal of Research in Personality ,40 (1), 84-96.
Gosling, S. D. (2001). From mice to men: What canwe learn about personality from animal research?Psychological Bulletin, 127 (1), 45–86.
Gosling, S. D., & John, O. P. (1999). Personality di-mensions in nonhuman animals: A cross-speciesreview. Current Directions in Psychological Sci-ence, 8 (3), 69–75.
Gosling, S. D., & Vazire, S. (2002). Are we bark-ing up the right tree? evaluating a comparativeapproach to personality. Journal of Research inPersonality , 36 (6), 607-614.
Gosling, S. D., Vazire, S., Srivastava, S., & John,O. P. (2004). Should we trust web-based stud-ies? A comparative analysis of six preconcep-tions about internet questionnaires. AmericanPsychologist , 59 (2), 93–104.
Gough, H. G. (1957). Manual for the Californiapsychological inventory. Palo Alto, CA: Consult-ing Psychologists Press.
Gray, J. A. (1982). Neuropsychological the-ory of anxiety: An investigation of the septal-hippocampal system. Cambridge: CambridgeUniversity Press.
Gray, J. A., & McNaughton, N. (2000). Theneuropsychology of anxiety: An enquiry into thefunctions of the septo-hippocampal system (2nded.). Oxford: Oxford University Press.
Guttman, L. (1945). A basis for analyzing test-retest reliability. Psychometrika, 10 (4), 255–282.
Habermas, T., & Bluck, S. (2000). Getting a life:The emergence of the life story in adolescence.Psychological Bulletin(126), 248-269.
Harmon-Jones, E., & Beer, J. S. (2009). Methods insocial neuroscience. New York, NY US: GuilfordPress.
Harvey, E. (1999). Short-term and long-term effectsof early parental employment on children of theNational Longitudinal Survey of Youth. Devel-opmental Psychology , 35 (2), 445–459.
Hase, H. D., & Goldberg, L. R. (1967). Compara-tive validity of different strategies of constructingpersonality inventory scales. Psychological Bul-letin, 67 (4), 231-248.
Hathaway, S., & McKinley, J. (1943). Manual foradministering and scoring the MMPI. Minneapo-lis: University of Minnesota Press.
Hogan, J., Barrett, P., & Hogan, R. (2007). Per-sonality measurement, faking, and employmentselection. Journal of Applied Psychology , 92 (5),1270 - 1285.
Hogan, R. (2007). Personality and the fate of orga-nizations. ix, 167 pp. Mahwah, NJ: Lawrence Erl-baum Associates Publishers Lawrence ErlbaumAssociates Publishers.
Hogan, R., & Kaiser, R. B. (2005). What we knowabout leadership. Review of General Psychology ,9 (2), 169 - 180.
Hogan, R., & Nicholson, R. A. (1988). The meaningof personality test scores. American Psychologist ,43 (8), 621 - 626.
Holland, J. L. (1959). A theory of vocational choice.Journal of Counseling Psychology , 6 (1), 35 - 45.
Holland, J. L. (1996). Exploring careers with atypology: What we have learned and some newdirections. American Psychologist , 51 (4), 397 -406.
Horn, J. L., & McArdle, J. J. (2007). Understandinghuman intelligence since Spearman. In R. Cud-eck & R. C. MacCallum (Eds.), Factor analysisat 100: historical developments and future direc-tions (p. 205-247). Mahwah, N.J.: Erlbaum.
Horwitz, R. I., Viscoli, C. M., Donaldson, R. M.,Murray, C. J., Ransohoff, D. F., Berkman, L., etal. (1990). Treatment adherence and risk of deathafter a myocardial infarction. Lancet , 336 (8714),542-545.
Humphreys, M. S., & Revelle, W. (1984). Per-sonality, motivation, and performance: A the-ory of the relationship between individual differ-ences and information processing. PsychologicalReview , 91 (2), 153-184.
24 REVELLE, CONDON, AND WILT
Hunt, E., & Wittmann, W. (2008). National in-telligence and national prosperity. Intelligence,36 (1), 1 - 9.
Irvine, J., Baker, B., Smith, J., Jandciu, S., Paque-tte, M., Cairns, J., et al. (1999). Poor adherenceto placebo or amiodarone therapy predicts mor-tality: results from the CAMIAT study. Psycho-somatic Medicine, 61 (4), 566-575.
Jackson, D. N. (1967). Personality research formmanual. Research Psychologists Press.
Johnson, D. L., Wiebe, J. S., Gold, S. M., An-dreasen, N. C., Hichwa, R. D., Watkins, G., et al.(1999). Cerebral blood flow and personality: Apositron emission tomography study. AmericanJournal of Psychiatry , 156 (2), 252-257.
Johnson, J. A. (2005). Ascertaining the validity ofindividual protocols from web-based personalityinventories. Journal of Research in Personality ,39 (1), 103-129.
Judd, C. M., McClelland, G. H., & Ryan, C. S.(2009). Data analysis: a model comparison ap-proach (2nd ed ed.). New York: Routledge.
Kelly, E. L., & Fiske, D. W. (1950). The predictionof success in the va training program in clinicalpsychology. American Psychologist , 5 (8), 395 -406.
Krueger, R. F. (2002). Psychometric perspectiveson comorbidity. In J. E. Helzer & J. J. Hudziak(Eds.), Defining psychopathology in the 21st cen-tury: Dsm-v and beyond (p. 41-54). Washington,DC: American Psychiatric Publishing, Inc Amer-ican Psychiatric Publishing, Inc.
Kuncel, N. R., Hezlett, S. A., & Ones, D. S. (2001).A comprehensive meta-analysis of the predictivevalidity of the graduate record examinations: Im-plications for graduate student selection and per-formance. Psychological Bulletin, 127 (1), 162 -181.
Kuncel, N. R., Kuncel, N. R., Crede, M., & Thomas,L. L. (2007). A meta-analysis of the predic-tive validity of the Graduate Management Ad-mission Test (GMAT) and undergraduate gradepoint average (UGPA) for graduate student aca-demic performance. The Academy of Manage-ment Learning and Education, 6 (1), 51-68.
Lawley, D. N., & Maxwell, A. E. (1963). Factoranalysis as a statistical method. London: Butter-worths.
Linden, W. Van der, & Hambleton, R. (1997).Handbook of modern item response theory.Springer Verlag.
Loehlin, J. C. (2004). Latent variable models: anintroduction to factor, path, and structural equa-tion analysis (4th ed.). Mahwah, N.J.: L. Erl-baum Associates.
Lord, F. M., & Novick, M. R. (1968). Statisticaltheories of mental test scores. Reading, Mass.:Addison-Wesley Pub. Co.
Lubinski, D., & Benbow, C. P. (2006). Study ofmathematically precocious youth after 35 years:Uncovering antecedents for the development ofmath-science expertise. Perspectives on Psycho-logical Science, 1 (4), 316–345.
Markon, K. E. (2010). Modeling psychopathologystructure: a symptom-level analysis of axis i andii disorders. Psychological Medicine, 40 , 273-288.
McAdams, D. P. (1993). The stories we live by:Personal myths and the making of the self. NewYork, NY: William Morrow & Co.
McAdams, D. P. (2008). Personal narratives andthe life story. In Handbook of personality: Theoryand research (3rd ed.). New York, NY: GuilfordPress.
McAdams, D. P., Diamond, A., St. Aubin, E. de,& Mansfield, E. (1997). Stories of commit-ment: The psychosocial construction of genera-tive lives. Journal of Personality and Social Psy-chology , 72 (3), 678-694.
McArdle, J. J. (2009). Latent variable modeling ofdifferences and changes with longitudinal data.Annual Review of Psychology. Vol 60 Jan 2009,577-605..
McArdle, J. J., & Bell, R. Q. (2000). Recent trendsin modeling longitudinal data by latent growthcurve methods. In T. D. Little, K. U. Schn-abel, & J. Baumert (Eds.), Modeling longitudinaland multiple-group data: practical issues, appliedapproaches, and scientific examples (p. 69-107).Mahwah, NJ: Erlbaum.
McDonald, R. P. (1999). Test theory: A unifiedtreatment. Mahwah, N.J.: L. Erlbaum Asso-ciates.

METHODS IN DIFFERENTIAL PSYCHOLOGY 25
McLean, K. C. (2005). Late adolescent identity de-velopment: Narrative meaning making and mem-ory telling. Developmental Psychology , 41 (4),683-691.
Mehl, M. R., & Pennebaker, J. W. (2003). Thesounds of social life: A psychometric analysis ofstudents’ daily social environments and naturalconversations. Journal of Personality and SocialPsychology , 84 (4), 857-870.
Mehl, M. R., Vazire, S., Ramirez-Esparza, N.,Slatcher, R. B., & Pennebaker, J. W. (2007). Arewomen really more talkative than men? Science,317 (5834), 82.
Mroczek, D. K. (2007). The analysis of longitudinaldata in personality research. In R. W. Robins,R. C. Fraley, & R. F. Krueger (Eds.), Hand-book of research methods in personality psychol-ogy (p. 543-556). New York, NY: Guilford Press.
Mulaik, S. A. (2010). Foundations of factor analysis(2nd ed ed.). Boca Raton: CRC Press.
Nesselroade, J. R. (1984). Concepts of intrain-dividual variabiilty and change: impressions ofCattell’s influence on lifespan developmental psy-cholgy. Multivariate Behavioral Research, 19 (2),269-286.
Noftle, E. E., & Fleeson, W. (2010). Age differ-ences in big five behavior averages and variabil-ities across the adult life span: Moving beyondretrospective, global summary accounts of per-sonality. Psychology and Aging , 25 (1), 95-107.
Norman, W. T. (1963). Toward an adequate tax-onomy of personality attributes: Replicated fac-tors structure in peer nomination personality rat-ings. Journal of Abnormal and Social Psychology ,66 (6), 574-583.
Norman, W. T. (1969). “to see ourseles as itherssee us”: Relations among self-perceptions, peer-perceptions, and expected peer-perceptions ofpersonality attributes. Multivariate BehavioralResearch, 4 (4), 417-443.
OSS Assessment Staff. (1948). Assessment of men:Selection of personnel for the office of strategicservices. New York: Rinehart.
Pasupathi, M., & Hoyt, T. (2009). The develop-ment of narrative identity in late adolescence andemergent adulthood: The continued importanceof listeners. Developmental Psychology , 45 (2),558-574.
Pearl, J. (2000). Causality: Models, reasoning, andinference. Causality: Models, reasoning, and in-ference xvi, 384 pp New York, NY, US: Cam-bridge University Press.
Pearson, K. P. (1896). Mathematical contributionsto the theory of evolution. iii. regression, hered-ity, and panmixia. Philisopical Transactions ofthe Royal Society of London. Series A, 187 , 254-318.
Pearson, K. P. (1901). On lines and planes of closestfit to systems of points in space. The London, Ed-inburgh and Dublin Philosophical Magazine andJournal , 6 (2), 559-572.
Pearson, K. P. (1910). The grammar of science (3rded.). London: Adam and Charles Black.
Pennebaker, J. W., Mayne, T. J., & Francis, M. E.(1997). Linguistic predictors of adaptive bereave-ment. Journal of Personality and Social Psychol-ogy , 72 (4), 863-871.
Perkins, A. M., Kemp, S. E., & Corr, P. J. (2007).Fear and anxiety as separable emotions: An in-vestigation of the revised reinforcement sensitiv-ity theory of personality. Emotion, 7 (2), 252-261.
Pickering, A. D. (2008). Formal and computa-tional models of reinforcement sensitivity theory.In P. J. Corr (Ed.), The reinforcement sensivitytheory. Cambridge: Cambridge University Press.
R Development Core Team. (2009). R: A languageand environment for statistical computing [Com-puter software manual]. Vienna, Austria. Avail-able from http://www.R-project.org (ISBN3-900051-07-0)
Rafaeli, E., & Revelle, W. (2006). A prematureconsensus: Are happiness and sadness truly op-posite affects? Motivation and Emotion, 30 (1),1-12.
Rafaeli, E., Rogers, G. M., & Revelle, W. (2007).Affective synchrony: Individual differences inmixed emotions. Personality and Social Psychol-ogy Bulletin, 33 (7), 915-932.
Rasch, G. (1960). Probabilistic models forsome intelligence and attainment tests. Chicago:reprinted in 1980 by The University of ChicagoPress /Paedagogike Institut, Copenhagen.

26 REVELLE, CONDON, AND WILT
Read, S. J., Monroe, B. M., Brownstein, A. L.,Yang, Y., Chopra, G., & Miller, L. C. (2010).A neural network model of the structure and dy-namics of human personality. Psychological Re-view , 117 (1), 61 - 92.
Reise, S., & Waller, N. (2009). Item response the-ory and clinical measurement. Annual review ofclinical psychology , 5 , 27–48.
Revelle, W. (1979). Hierarchical cluster-analysisand the internal structure of tests. MultivariateBehavioral Research, 14 (1), 57-74.
Revelle, W. (1986). Motivation and efficiencyof cognitive performance. In D. R. Brown &J. Veroff (Eds.), Frontiers of motivational psy-chology: Essays in honor of J. W. Atkinson(p. 105-131). New York: Springer.
Revelle, W. (1993). Individual differences in per-sonality and motivation: ‘non-cognitive’ deter-minants of cognitive performance. In A. Bad-deley & L. Weiskrantz (Eds.), Attention: Selec-tion, awareness, and control: A tribute to DonaldBroadbent (p. 346-373). New York, NY: Claren-don Press/Oxford University Press.
Revelle, W. (2007). Experimental approaches to thestudy of personality. In R. Robins, R. C. Fra-ley, & R. F. Krueger (Eds.), Handbook of re-search methods in personality psychology. (p. 37-61). New York: Guilford.
Revelle, W. (2010). psych: Procedures forpersonality and psychological research [Com-puter software manual]. Available from http://personality-project.org/r (R package ver-sion 1.0-86)
Revelle, W., Amaral, P., & Turriff, S. (1976).Introversion-extraversion, time stress, and caf-feine: the effect on verbal performance. Science,192 , 149-150.
Revelle, W., Humphreys, M. S., Simon, L., &Gilliland, K. (1980). Interactive effect of per-sonality, time of day, and caffeine - test of thearousal model. Journal of Experimental Psychol-ogy General , 109 (1), 1-31.
Revelle, W., & Oehleberg, K. (2008). Integrat-ing experimental and observational personalityresearch – the contributions of Hans Eysenck.Journal of Personality , 76 (6), 1387-1414.
Revelle, W., Wilt, J., & Rosenthal, A. (2010). Per-sonality and cognition: The personality-cognitionlink. In A. Gruszka, G. Matthews, & B. Szymura(Eds.), Handbook of individual differences in cog-nition: Attention, memory and executive control(p. 27-49). Springer.
Revelle, W., & Zinbarg, R. E. (2009). Coefficientsalpha, beta, omega and the glb: comments onSijtsma. Psychometrika, 74 (1), 145-154.
Roberts, B. W., Kuncel, N. R., Shiner, R., Caspi,A., & Goldberg, L. R. (2007). The power of per-sonality: The comparative validity of personalitytraits, socioeconomic status, and cognitive abilityfor predicting important life outcomes. Perspec-tives on Psychological Science, 2 (4), 313-345.
Robins, R. W., Fraley, R. C., & Krueger, R. F.(2007). Handbook of research methods in person-ality psychology. Handbook of research methodsin personality psychology. xiii, 719 pp. New York,NY: Guilford Press.
Robinson, W. S. (1950). Ecological correlations andthe behavior of individuals. American Sociologi-cal Review , 15 (3), 351–357.
Rocklin, T., & Revelle, W. (1981). The mea-surement of extraversion: A comparison of theEysenck Personality Inventory and the EysenckPersonality Questionnaire. British Journal of So-cial Psychology , 20 (4), 279-284.
Rodgers, J. L. (2010). The epistemology ofmathematical and statistical modeling: A quietmethodological revolution. American Psycholo-gist , 65 (1), 1 - 12.
Romer, D., & Revelle, W. (1984). Personalitytraits: Fact or fiction? a critique of the Shwederand D’Andrade systematic distortion hypothe-sis. Journal of Personality and Social Psychology ,47 (5), 1028-1042.
Rosnow, R. L., Rosenthal, R., & Rubin, D. B.(2000). Contrasts and correlations in effect-sizeestimation. Psychological Science, 11 (6), 446-453.
Schaie, K. W. (1994). The course of adult intellec-tual development. American Psychologist , 49 (4),304–313.
Schimmack, U., & Reisenzein, R. (2002). Expe-riencing activation: Energetic arousal and tensearousal are not mixtures of valence and activa-tion. Emotion, 2 (4), 412-417.
METHODS IN DIFFERENTIAL PSYCHOLOGY 27
Shadish, W. R., Cook, T. D., & Campbell, D. T.(2001). Experimental and quasi-experimental de-signs for generalized causal inference. Boston:Houghton Mifflin.
Shrout, P. E., & Fleiss, J. L. (1979). Intraclasscorrelations: Uses in assessing rater reliability.Psychological Bulletin, 86 (2), 420-428.
Shweder, R. A., & D’Andrade, R. G. (1980).The systematic distortion hypothesis. InR. A. Shweder (Ed.), New directions for method-ology of social and behavior science s (p. 37-58).San Francisco: Jossey-Bass.
Sijtsma, K. (2009). On the use, the misuse, andthe very limited usefulness of cronbach’s alpha.Psychometrika, 74 (1), 107-120.
Simms, L. J., & Watson, D. (2007). The con-struct validation approach to personality scaleconstruction. In R. W. Robins, R. C. Fraley, &R. F. Krueger (Eds.), Handbook of research meth-ods in personality psychology (p. 240-258). NewYork, NY: Guilford Press.
Simpson, E. H. (1951). The interpretation of in-teraction in contingency tables. Journal of theRoyal Statistical Society. Series B (Methodologi-cal), 13 (2), 238–241.
Singer, J. A. (2004). Narrative identity and mean-ing making across the adult lifespan: An intro-duction. Journal of Personality , 72 (3), 437-459.
Singer, J. A., & Blagov, P. (2004). The integrativefunction of narrative processing: Autobiographi-cal memory, self-defining memories, and the lifestory of identity. In The self and memory (p. 117-138). New York, NY: Psychology Press.
Smillie, L., & Jackson, C. (2006). Functional impul-sivity and reinforcement sensitivity theory. Jour-nal of Personality , 74 (1), 47.
Spearman, C. (1904a). “general intelligence,”objec-tively determined and measured. American Jour-nal of Psychology , 15 (2), 201-292.
Spearman, C. (1904b). The proof and measurementof association between two things. The AmericanJournal of Psychology , 15 (1), 72-101.
Spearman, C. (1910). Correlation calculated fromfaulty data. British Journal of Psychology , 3 (3),271-295.
Strong, E. K. (1927). Vocational interest test. Ed-ucational Record , 8 (2), 107-121.
Terman, L. M., & Oden, M. (1947). Genetic stud-ies of genius. Palo Alto, CA: Stanford UniversityPress; Oxford University Press.
Thayer, R. E. (2000). Mood. (2000). Encyclopediaof psychology, Vol. 5. (pp. 294-295). Washington,DC ; New York, NY: American Psychological As-sociation; Oxford University Press 508 pp.
Thorburn, W. M. (1918). The myth of occam’srazor. Mind , 27 , 345-353.
Thurstone, L. L. (1935). The vectors of mind:multiple-factor analysis for the isolation of pri-mary traits. Chicago: Univ. of Chicago Press.
Tupes, E. C., & Christal, R. E. (1961). Recurrentpersonality factors based on trait ratings (Tech.Rep. No. 61-97). Lackland Air Force Base: USAFASD Technical Report.
Vale, J., & Vale, C. (1969). Individual differencesand general laws in psychology: a reconciliation.American Psychologist , 24 (12), 1093–1108.
Vazire, S. (2006). Informant reports: A cheap,fast, and easy method for personality assessment.Journal of Research in Personality , 40 (5), 472-481.
Vazire, S., Gosling, S. D., Dickey, A. S., & Schapiro,S. J. (2007). Measuring personality in nonhu-man animals. In R. W. Robins, R. C. Fraley, &R. F. Krueger (Eds.), Handbook of research meth-ods in personality psychology (p. 190-206). NewYork, NY: Guilford Press.
Wacker, J., Chavanon, M.-L., & Stemmler, G.(2006). Investigating the dopaminergic basis ofextraversion in humans: A multilevel approach.Journal of Personality and Social Psychology ,91 (1), 171-187.
Wainer, H. (1976). Estimating coefficients in linearmodels: It don’t make no nevermind. Psycholog-ical Bulletin, 83 (2), 213-217.
Wainer, H., & Thissen, D. (1979). On the Ro-bustness of a Class of Naive Estimators. AppliedPsychological Measurement , 3 (4), 543-551.
Wainer, H., & Thissen, D. (1981). Graphical dataanalysis. Annual Review of Psychology , 32 , 191- 241.

28 REVELLE, CONDON, AND WILT
Walker, R. N. (1967). Some temperament traits inchildren as viewed by their peers, their teachers,and themselves. Monographs of the Society forResearch in Child Development , 32 (6), iii–36.
Watson, D. (2005). Rethinking the mood and anx-iety disorders: a quantitative hierarchical modelfor DSM-V. Journal of Abnormal Psychology ,114 (4), 522.
Wichman, A., Rodgers, J., & MacCallum, R.(2006). A multilevel approach to the relationshipbetween birth order and intelligence. Personalityand social psychology bulletin, 32 (1), 117.
Wiggins, J. S. (1973). Personality and prediction:principles of personality assessment. Malabar,Fla.: R.E. Krieger Pub. Co.
Wilt, J., Oehleberg, K., & Revelle, W. (in press).Anxiety in personality. Personality and Individ-ual Differences.
Yule, G. U. (1912). On the methods of measuringassociation between two attributes. Journal ofthe Royal Statistical Society , LXXV , 579-652.
Zickar, M. J., & Broadfoot, A. A. (2009). Thepartial revival of a dead horse? comparing clas-sical test theory and item response theory. InC. E. Lance & R. J. Vandenberg (Eds.), Statisti-cal and methodological myths and urban legends:Doctrine, verity and fable in the organizationaland social sciences. (p. 37-59). New York, NY,US: Routledge/Taylor & Francis Group.
Zinbarg, R. E., Revelle, W., Yovel, I., & Li, W.(2005). Cronbach’s α, Revelle’s β , and McDon-ald’s ωH): Their relations with each other andtwo alternative conceptualizations of reliability.Psychometrika, 70 (1), 123-133.