Embed Size (px)
Citation preview

ANNUAL REPORT 2011
Methode is... possibilities.

C O M P A N Y P R O F I L E
Methode Electronics, Inc. (NYSE: MEI) is a global designer and
manufacturer of electro-mechanical devices with manufacturing, design and
testing facilities in China, Germany, India, Malta, Mexico, the Philippines,
Singapore, the United Kingdom and the United States. We design,
manufacture and market devices employing electrical, radio remote control,
electronic, wireless, sensing and optical technologies to control and convey
signals through sensors, interconnections and controls.
Our business is managed on a segment basis, with those segments
being Automotive, Interconnect, Power Products and Other. Our
components are in the primary end markets of the aerospace, appliances,
automotive, construction, consumer and industrial equipment markets,
communications (including information processing and storage, networking
equipment, wireless and terrestrial voice/data systems) and rail and other
transportation industries.
Further information can be found at Methode’s Web site www.methode.com.
Fiscal 2011 Sales By Business Segment
Fiscal 2011 Sales By Geography
40.2% NORTH AMERICA
34.3% EUROPE
25.5% ASIA
52.8% AUTO
32.4% INTERCONNECT
11.8% POWER
3.0% OTHER
K E Y S T A T I S T I C SNYSE: MEI
As of June 30, 2011
MARKET CAP $438.9M
STOCK PRICE $11.61
52-WEEK RANGE $7.85-$13.73
AVERAGE DAILY VOLUME (3 MONTH) 101,098
SHARES OUTSTANDING 37.8M
DIVIDEND AND YIELD $0.28 (2.4%)
As of April 30, 2011
PERCENT HELD BY INSIDERS 4.43%
DEBT $0
CASH $57.4M
REVENUE (FY 11) $428.2M
EBITDA (FY 11) $35.6M
DILUTED EPS (FY 11) (GAAP) $0.52
DILUTED EPS (FY 11) (NON-GAAP) $0.49

1 METHODE ELECTRONICS, INC. ANNUAL REPORT 2011
Dear Fellow Shareholders
We are pleased to report that Methode Electronics delivered sales and earnings growth in Fiscal 2011. The Company recorded sales of $428.2 million for Fiscal 2011, which represents 13 percent growth over Fiscal 2010.
Adjusting our Fiscal 2010 results for the loss of sales to Delphi and planned lower
sales of legacy automotive products, which together totaled $32.3 million in
Fiscal 2010, our Company’s consolidated sales in Fiscal 2011 increased 24 percent.
Methode’s Fiscal 2011 sales results demonstrate the success of our strategy to
offer customers system solutions with brand-differentiating technology across
all segments.
A key point is that in just one year, we have increased Methode’s revenue from
a seven-year low of $378 million in Fiscal 2010, despite the reduction of legacy
automotive products and the loss of the Delphi business - an accomplishment of
which all our employees should be very proud. Our Company is well positioned to
continue revenue growth through our global presence, broadening customer base
and market-leading expertise in certain technologies.
Automotive markets improved globally during our Fiscal 2011, led by a
stronger-than-expected recovery in North America. We were able to capitalize
on this recovery with increased sales of our current business lines and the launch
of new products. Methode’s Fiscal 2011 automotive segment sales of $226.0
million, which accounted for nearly 53 percent of total sales, improved
11 percent, and income from operations increased 17 percent to $13.3 million.
In Interconnect, our investments in TouchSensor and Hetronic continue to
bring us competitive advantages. Fiscal 2011 brought new demand for many
of our customer-focused innovations, as Interconnect segment sales improved
to $138.8 million, or 12 percent, due to higher sales of data, sensor and radio
remote control devices, and represented over 32 percent of Methode’s Fiscal 2011
sales. Importantly, Interconnect’s income from operations improved 82 percent in
Fiscal 2011 to $20 million, primarily because restructuring activities in prior years
have reduced this segment’s cost structure.
Methode’s Fiscal
2011 sales results
demonstrate the
success of our
strategy to offer
customers system
solutions with
brand-differentiating
technology across
all segments.

2 METHODE ELECTRONICS, INC. ANNUAL REPORT 2011
D E A R F E L L O W S H A R E H O L D E R S ( C o n t i n u e d )
In our Power Products segment, Methode serves as a valued partner in
developing technology-based solutions for its global customer base. Sales
improved to $50.4 million, or 24 percent, in Fiscal 2011, representing almost 12
percent of total sales for the year, and income from operations improved 6 percent
to $3.6 million. During the year, Methode acquired a 70 percent ownership stake
in Eetrex Incorporated, a Boulder, CO, based developer of chargers, inverters, and
battery systems for hybrid and plug-in hybrid electric vehicles. Already, Eetrex’s
power electronics technology, coupled with Methode’s automotive engineering and
manufacturing expertise, resulted in a production award in Fiscal 2011 that will
launch in Fiscal 2012.
Operationally, we faced some challenges in Fiscal 2011. Vendor production and
delivery issues, as well as higher designing, developing and engineering costs to
support products expected to launch in Fiscal 2013, negatively impacted results.
Because of these vendor production and delivery issues, we have decided to
vertically integrate a portion of these processes and have them in-house and online
as we enter Fiscal 2013. Additionally, we do expect to carry higher designing,
developing and engineering costs in Fiscal 2012 to support products scheduled to
launch in Fiscal 2013.
Each year brings a new set of manufacturing challenges. We will continue
to implement operational improvements as necessary to ensure that we are
capitalizing on each of our opportunities.
We continued to grow in key product areas as evidenced by our global business
awards during Fiscal 2011.
In the first quarter of Fiscal 2011, Methode was awarded the contract to provide
a top tier automotive manufacturer with a custom sensor for the measurement
of the clutch plate position in a new, fuel-efficient, dual clutch, six-speed
transmission for several platforms. This program is expected to launch in the
second half of Fiscal 2014, ramping to full production in Fiscal 2016. Methode’s
patented “Magneto-Elastic” sensing solutions are designed to enhance mechanical
performance by providing a variety of operational measurements, including torque,
speed, horsepower, linear position, load and force. This non-contact sensing
technology is rugged, reliable, and designed to operate under harsh environmental
conditions.
Further, in our Automotive segment, we were awarded additional transmission lead
frame business during Fiscal 2011 that will begin production in the first quarter of
Fiscal 2012 and has a program life of five years. In addition, we were awarded a
Each year
brings a
new set of
manufacturing
challenges. We
will continue
to implement
operational
improvements
as necessary to
ensure that we
are capitalizing
on each of our
opportunities.

Warren L. Batts Donald W. DudaChairman of the Board President and Chief Executive Officer
August 1, 2011
Methode provides
our customers
with progressive
solutions while
maintaining
our original
values: a focus
on customers,
high-caliber
performance and
innovation with
financial stability.
“next generation” center console program (consisting of the control assembly, radio
and HVAC control module) for multiple vehicle platforms starting in Fiscal 2013,
with an expected five-year program life.
Finally, our Power Products segment was awarded a program to provide an
on-board integrated power unit based on Eetrex’s power electronics technology
for a purely electric commercial truck. This program will launch in the latter half
of Fiscal 2012, ramping to full production in Fiscal 2014. This segment was also
awarded a program to provide three unique busbar sub-assemblies to be used to
connect lithium-ion battery cells to form battery modules making up the battery
pack on an electric vehicle. The product is expected to launch in Fiscal 2013
with an expected program life of six years.
The new business awards we received in Fiscal 2010 and 2011 are expected to
add to Methode’s revenue stream, with our goal to exceed Methode’s historical
revenue high of $555 million in Fiscal 2014.
Our work — producing highly customized engineered solutions —
has never been and will never be simple. Through it all, we endeavor to
thrive in the face of today’s challenges and uncertainties and retain the
distinctions that make us unique.
Methode provides our customers with progressive solutions while maintaining
our original values: a focus on customers, high-caliber performance and
innovation with financial stability. These fundamentals serve to minimize
risk as we continue our growth.
We want to thank our employees for their hard work and dedication in bringing
about improved results over the past year, as well as our board of directors for its
engagement and support. We remain confident that our actions and commitment
to build our business will successfully drive us to higher levels of performance. Our
overall outlook for Fiscal 2012 is cautiously optimistic, and we are very excited by
the opportunity to build upon the momentum we established in Fiscal 2011.
3 METHODE ELECTRONICS, INC. ANNUAL REPORT 20112 METHODE ELECTRONICS, INC. ANNUAL REPORT 2011
D E A R F E L L O W S H A R E H O L D E R S ( C o n t i n u e d )

4 METHODE ELECTRONICS, INC. ANNUAL REPORT 2011
A B O U T T H E C O V E R
The onboard radar systems for aircraft such as the F-22, F-16, and Global Hawk, described as the aircraft’s most technically complex system, utilize Methode’s laminated busbars, which allow precise alignment of the radar subsystems.
Hetronic safety radio remote controls can control cranes, earth moving equipment, concrete pumps, utility equipment and many other types of machinery. Hetronic’s controls make the operations of construction equipment safer for the operator and more economical for the equipment owner.
Magneto-elastic technology provides a torque-sensing solution to determine the need for power assist on electric bicycles available in Europe. Methode’s sensor determines the load on the pedal crankshaft and then communicates with the control module, allowing the bicycle to maintain constant speed without further energy from the rider.
As light rail transportation becomes faster, Methode’s multi-layer laminated busbars are used to supply the power distribution for electric and diesel/electric locomotives. Capable of operating in extreme environments, the busbars’ precision tolerances and electrical capabilities perform in concert with modern power electronics.
Methode’s customers use our laminated busbars, flexible cables and TribotekTM low resistance power connectors in their power conversion units to optimize efficiencies, putting as much of the wind energy as possible into the electrical grid.
Methode provides the power distribution inside the gradient amplifiers which create the variable magnetic field for the MRI process. Our manufacturing methods create robust and high performance components, key requirements for today’s medical devices.
Methode’s patented TouchSensor™ technology allowed Ford to introduce a completely new and innovative User Interface panel in their vehicles. Through the elimination of traditional mechanical buttons, TouchSensor™ technology enables sleek and sophisticated styling along with exceptional performance and reliability.
Commercial aircraft require lightweight and highly efficient power distribution systems. Methode’s laminated busbars, usually made from aluminum for these applications to save weight, meet the aircraft’s rigorous life demands.
Working closely with Whirlpool Corporation’s product development teams, TouchSensor™ introduced a first of its kind user-interface panel for the new Jenn-Air wall oven, which includes a high-resolution touchscreen as well as back-lit discrete keys to provide a robust and innovative solution.
Magneto-elastic technology provides real-time torque data integral to the steering system for on-road and off-road vehicles available globally. Methode’s sensor communicates with the vehicle control module to enable real-time adjustments for various riding conditions.
Methode’s power distribution products are used on helicopters and designed to withstand the high centrifugal forces generated by the rotor blades. During operation, power is distributed to the heater elements at the blades’ leading edge to de-ice the aircraft.

UNITED STATES SECURITIES AND EXCHANGE COMMISSION
Washington, D.C. 20549
FORM 10-K
ANNUAL REPORT PURSUANT TO SECTION 13 OR 15 (d) OF THESECURITIES EXCHANGE ACT OF 1934
For the fiscal year ended April 30, 2011 Commission File Number 0-2816
METHODE ELECTRONICS, INC.(Exact name of Registrant as specified in its charter)
Delaware(State or other jurisdiction ofincorporation or organization)
36-2090085(IRS Employer
Identification No.)
7401 West Wilson AvenueChicago, Illinois
(Address of Principal Executive Offices)
60706-4548(Zip Code)
Registrant’s telephone number (including area code): (708) 867-6777 Securities registered pursuant to Section 12(b) of the Act:
Title of each ClassCommon Stock, $0.50 Par Value
Name of each exchangeon which registered
New York Stock ExchangeSecurities registered pursuant to Section 12(g) of the Act:
None(Title of Class)
Indicate by check mark if the Registrant is a well-known seasoned issuer, as defined in Rule 405 of the Securities Act. Yes No
Indicate by check mark if the Registrant is not required to file reports pursuant to Section 13 or Section 15(d) of the Act. Yes No
Indicate by check mark whether the Registrant (1) has filed all reports required to be filed by Section 13 or 15 (d) of the Securities Exchange Act of 1934 during the preceding 12 months (or for such shorter period that the Registrant was required to file such reports), and (2) has been subject to such filing requirements for the past 90 days. Yes No
Indicate by check mark whether the registrant has submitted electronically and posted on its corporate Web site, if any, every Interactive Data File required to be submitted and posted pursuant to Rule 405 of Regulation S-T during the preceding 12 months (or for such shorter period that the registrant was required to submit and post such files). Yes No
Indicate by check mark if disclosure of delinquent filers pursuant to Item 405 of Regulation S-K is not contained herein, and will not be contained, to the best of Registrant’s knowledge, in definitive proxy or information statements incorporated by reference in Part III of this Form 10-K or any amendment to this Form 10-K.
Indicate by check mark whether the registrant is a large accelerated filer, an accelerated filer, a non-accelerated filer, or a smaller reporting company. See definitions of “large accelerated filer,” “accelerated filer,” and “smaller reporting company” in Rule 12b-2 of the Exchange Act. (Check one):
Large accelerated filer Non-accelerated filer
Accelerated filer Smaller reporting company
Indicate by check mark whether the registrant is a shell company (as defined in Rule 12b-2 of the Act). Yes No The aggregate market value of common stock, $0.50 par value, held by non-affiliates of the Registrant on October 30,
2010, based upon the average of the closing bid and asked prices on that date as reported by the New York Stock Exchange was $331.6 million.
Registrant had 36,991,530 shares of common stock, $0.50 par value, outstanding as of June 30, 2011.
DOCUMENTS INCORPORATED BY REFERENCEPortions of the proxy statement for the annual shareholders meeting to be held September 15, 2011 are incorporated by
reference into Part III.

METHODE ELECTRONICS, INC.FORM 10-K
April 30, 2011
TABLE OF CONTENTS
PART IItem 1.Item 1A.Item 2.Item 3.
PART IIItem 5.
Item 6.Item 7.Item 7A.Item 8.Item 9A.
PART IIIItem 10.Item 11.Item 12.Item 13.Item 14.
PART IVItem 15.
BusinessRisk FactorsPropertiesLegal Proceedings
Market for Registrant’s Common Equity, Related Stockholder Matters and Issuer Purchases of EquitySecuritiesSelected Financial DataManagement’s Discussion and Analysis of Financial Condition and Results of OperationsQuantitative and Qualitative Disclosures About Market RiskFinancial Statements and Supplementary DataControls and Procedures
Directors, Executive Officers and Corporate GovernanceExecutive CompensationSecurity Ownership of Certain Beneficial Owners and Management and Related Stockholder MattersCertain Relationships and Related Transactions, and Director IndependencePrincipal Accounting Fees and Services
Exhibits, Financial Statement Schedules
1389
10
1112333333
3535353535
36

PART I
Item 1. Business
Methode Electronics, Inc. was incorporated in 1946 as an Illinois corporation and reincorporated in Delaware in 1966. As used herein, “we,” “us,” “our,” the “Company” or “Methode” mean Methode Electronics, Inc. and its subsidiaries.
We are a global designer and manufacturer of electro-mechanical devices. We design, manufacture and market devices employing electrical, radio remote control, electronic, wireless and sensing technologies. Our components are found in the primary end markets of the aerospace, appliance, automotive, construction, consumer and industrial equipment markets, communications (including information processing and storage, networking equipment, wireless and terrestrial voice/data systems), rail and other transportation industries.
We maintain our financial records on the basis of a fifty-two or fifty-three week fiscal year ending on the Saturday
closest to April 30. Due to the timing of our fiscal calendar, the fiscal years ended April 30, 2011, May 1, 2010 and May 2, 2009 represent 52 weeks of results.
Segments. Our business is managed and our financial results are reported on a segment basis, with those segments being Automotive, Interconnect, Power Products and Other.
The Automotive segment supplies electronic and electromechanical devices and related products to automobile OEMs,
either directly or through their tiered suppliers. Our products include control switches for electrical power and signals, connectors for electrical devices, integrated control components, switches and sensors that monitor the operation or status of a component or system, and packaging of electrical components.
The Interconnect segment provides a variety of copper and fiber-optic interconnect and interface solutions for the
aerospace, appliance, commercial, computer, construction, consumer, material handling, medical, military, mining, networking, storage, and telecommunications markets. Solutions include connectors, conductive polymer, thick film inks, custom cable assemblies, industrial safety radio remote controls, solid-state field effect interface panels, optical and copper transceivers, PC and express card packaging and terminators. Services include the design and installation of fiber optic and copper infrastructure systems, and manufacturing active and passive optical components.
The Power Products segment manufactures braided flexible cables, current-carrying laminated bus devices, custom
power-product assemblies, high-current low voltage flexible power cabling systems and powder coated bus bars that are used in various markets and applications, including aerospace, computers, industrial and power conversion, inverters and battery systems, insulated gate bipolar transistor solutions, military, telecommunications, and transportation.
The Other segment includes a designer and manufacturer of magnetic torque sensing products, and independent
laboratories that provide services for qualification testing and certification, and analysis of electronic and optical components. Financial results by segment are summarized in Note 14 to the consolidated financial statements.
Sales. The following table reflects the percentage of net sales of the segments of the Company for the last three fiscal years.
AutomotiveInterconnectPower ProductsOther
Year EndedApril 30,
2011
52.8%32.4%11.8%3.0%
May 1,2010
53.4%33.3%10.8%2.5%
May 2,2009
57.2%30.8%10.0%1.9%
Our sales activities are directed by sales managers who are supported by field application engineers and other
engineering personnel who work with customers to design our products into their systems. Our field application engineers also help us identify emerging markets and new products. Our products are sold through in-house sales staff and through independent manufacturers’ representatives with offices throughout the world. Information about our sales and operations in
1

different geographic regions is summarized in Note 14 to the consolidated financial statements. Sales are made primarily to OEMs, either directly or through their tiered suppliers as well as selling partners and distributors.
Sources and Availability of Materials. Principal materials that we purchase include coil and bar stock, die castings, ferrous and copper alloy sheets, glass, plastic molding materials, precious metals, application-specific integrated circuits, light-emitting diode (LED) displays and silicon. All of these items are available from several suppliers and we generally rely on more than one supplier for each item. We have experienced some shortages for specific electrical components in fiscal 2011, however, we have not experienced any other significant shortages of raw materials and normally do not carry inventories of raw materials or finished products in excess of those reasonably required to meet production and shipping schedules. We experienced significant price increases in fiscal 2011 for copper, precious metals and petroleum-based raw materials. We did not experience significant price increases in fiscal 2010 and 2009 related to those items.
Patents; Licensing Agreements. We have numerous United States and foreign patents and license agreements covering certain of our products and manufacturing processes, several of which are considered significant to our business. Our ability to compete effectively with other companies depends, in part, on our ability to maintain the proprietary nature of our technology. Although we have been awarded, have filed applications for, or have been licensed under numerous patents in the United States and other countries, there can be no assurance concerning the degree of protection afforded by these patents or the likelihood that pending patents will be issued.
Seasonality. A significant portion of our business is dependent on automotive sales and the vehicle production schedules of our customers. The automotive market is cyclical and depends on general economic conditions, interest rates, fuel prices and consumer spending patterns. Historically, our business was moderately seasonal as our North American automotive customers halt operations for approximately two weeks in July for model changeovers and for one to two weeks during the December holiday period.
Material Customers. During the fiscal year ended April 30, 2011, shipments to Ford Motor Company (“Ford”) and General Motors Corporation (“GM”), or their tiered suppliers, represented 17.9% and 17.6%, respectively, of consolidated net sales. Such shipments included a wide variety of our automotive component products.
Backlog. Our backlog of orders was approximately $82.2 million at April 30, 2011, and $59.3 million at May 1, 2010. It is expected that most of the total backlog at April 30, 2011 will be shipped within fiscal 2012.
Competitive Conditions. The markets in which we operate are highly competitive and characterized by rapid changes
due to technological improvements and developments. We compete with a large number of other manufacturers in each of our product areas; many of these competitors have greater resources and sales. Price, service and product performance are significant elements of competition in the sale of our products.
Research and Development. We maintain a research and development program involving a number of professional employees who devote a majority of their time to the enhancement of existing products and to the development of new products and processes. Senior management of our Company participates directly in the program. Expenditures for such activities amounted to $19.5 million, $18.4 million and $22.0 million for fiscal 2011, 2010 and 2009, respectively.
Environmental Matters. Compliance with foreign, federal, state and local provisions regulating the discharge of materials into the environment has not materially affected our capital expenditures, earnings or our competitive position. Currently, we do not have any environmental related lawsuits or material administrative proceedings pending against us. Further information as to environmental matters affecting us is presented in Note 9 to the consolidated financial statements.
Employees. At April 30, 2011 and May 1, 2010, we had 2,743 and 2,315 employees, respectively. We also from time to time employ part-time employees and hire independent contractors. As of April 30, 2011, our employees from our Malta and Mexico facilities, which account for about 60% of the total number of employees, are represented by collective bargaining agreements. We have never experienced a work stoppage and we believe that our employee relations are good.
Segment Information and Foreign Sales. Information about our operations by segment and in different geographic regions is summarized in Note 14 to the consolidated financial statements.
Available Information. We are subject to the informational requirements of the Securities Exchange Act of 1934 (Exchange Act) and file periodic reports, proxy statements and other information with the Securities and Exchange Commission (SEC). Such reports may be obtained by visiting the Public Reference Room of the SEC at 100 F Street, NE, Washington, D.C. 20549, or by calling the SEC at (800) SEC-0330. In addition, the SEC maintains an internet site(www.sec.gov) that contains reports, proxy and information statements and other information.
2

Financial and other information can also be accessed on the investor section of our website at www.methode.com. We
make available, free of charge, copies of our annual report on Form 10-K, quarterly reports on Form 10-Q, current reports on Form 8-K, and amendments to those reports filed or furnished pursuant to Section 13(a) or 15(d) of the Exchange Act as soon as reasonably practicable after filing such material electronically or otherwise furnishing it to the SEC. Also posted on our website are the Company’s Corporate Governance Guidelines, Code of Conduct and the charters of the Audit Committee, Compensation Committee, Nominating and Governance Committee and Technology Committee. Copies of these documents are also available free of charge by sending a request to Methode Electronics, Inc., 7401 West Wilson Avenue, Chicago, Illinois 60706, Attention: Investor Relations Department. Information on our website is not incorporated into this Form 10-K or our other securities filings and is not a part of them.
Certifications. As required by the rules and regulations of the New York Stock Exchange (“NYSE”), we delivered to
the NYSE a certification signed by our Chief Executive Officer, Donald W. Duda, certifying that Mr. Duda was not aware of any violation by the Company of the NYSE’s corporate governance listing standards as of October 20, 2010.
As required by the rules and regulations of the SEC, the Sarbanes-Oxley Act Section 302 certifications regarding the
quality of our public disclosures are filed as exhibits to this Annual Report on Form 10-K.
Item 1A. Risk Factors
Certain statements in this report are forward-looking statements that are subject to certain risks and uncertainties. We undertake no duty to update any such forward-looking statements to conform to actual results or changes in our expectations. Our business is highly dependent upon two large automotive customers and specific makes and models of automobiles. Our results will be subject to many of the same risks that apply to the automotive, appliance, computer and telecommunications industries, such as general economic conditions, interest rate fluctuations, consumer spending patterns and technological changes. Other factors, which may result in materially different results for future periods, include the following risk factors. These risk factors should be considered in connection with evaluating the forward-looking statements contained in this report because these factors could cause our actual results and condition to differ materially from those projected in forward-looking statements. The forward-looking statements in this report are subject to the safe harbor protection provided under the securities laws and are made as of the date of this report. We undertake no duty to update any such forward-looking statements.
We depend on a small number of large customers, specifically two large automotive customers. If we were to lose either of these customers or experienced a significant decline in the volume of products purchased by these customers, or if any of the customers declare bankruptcy, our future results could be adversely affected.
During the year ended April 30, 2011, shipments to Ford and GM, or their tiered suppliers, each represented 17.9% and 17.6% of consolidated net sales. The contracts we have entered into with these customers provide for supplying the customers’ requirements for a particular model, rather than for manufacturing a specific quantity of products. Such contracts range from one year to the life of the model, which is generally three to seven years. Therefore, the loss of a contract for a major model or a significant decrease in demand for certain key models or group of related models sold by Ford or GM could have a material adverse impact on our results of operations and financial condition. We also compete to supply products for successor models and are subject to the risk that Ford or GM will not select us to produce products on any such model, which could have a material adverse impact on our results of operations and financial condition. Because we derive a substantial portion of our revenues from customers in the automotive, appliance, computer and communications industries, we are susceptible to trends and factors affecting those industries.
Our components are found in the primary end markets of the automotive, communications (including information processing and storage, networking equipment, wireless and terrestrial voice/data systems), aerospace, rail and other transportation industries, appliances and the consumer and industrial equipment markets. Factors negatively affecting these industries and the demand for products also negatively affect our business, financial condition and operating results. In fiscal 2010 and 2009, we experienced slow-downs in all significant segments due to the recession. Any adverse occurrence, including additional industry slowdown, recession, rising interest rates, political instability, costly or constraining regulations, armed hostilities, terrorism, excessive inflation, prolonged disruptions in one or more of our customers’ production schedules or labor disturbances, that results in significant decline in the volume of sales in these industries, or in an overall downturn in the business and operations of our customers in these industries, could materially adversely affect our business, financial condition and operating results.
3

Further downturns in the automotive industry or the bankruptcy of certain automotive customers could reduce the sales and profitability of our business.
Currently, approximately 53% of our business is dependent on automotive sales and the vehicle production schedules of our customers. The automotive market is cyclical and depends on general economic conditions, interest rates and consumer spending patterns. Any significant reduction in vehicle production by our customers would have a material adverse effect on our business. Traditionally, in prior fiscal years, our business was moderately seasonal as our North American automotive customers historically halt operations for approximately two weeks in July for model changeovers and one to two weeks during the December holiday period.
In addition, we have significant receivable balances related to these customers that would be at risk in the event of their bankruptcy. Due to the financial stresses within the worldwide automotive industry, certain automakers and suppliers have already declared bankruptcy or may be susceptible to bankruptcy. In the event of the bankruptcy of any of our customers with significant receivable balances, our financial condition and operating results could be adversely affected. Our technology-based business and the markets in which we operate are highly competitive. If we are unable to compete effectively, our sales will decline.
The markets in which we operate are highly competitive and characterized by rapid changes due to technological improvements and developments. We compete with a large number of other manufacturers in each of our product areas; many of these competitors have greater resources and sales. Price, service and product performance are significant elements of competition in the sale of our products. Competition may intensify further if more companies enter the markets in which we operate. Our failure to compete effectively could materially adversely affect our business, financial condition and operating results. We face risks relating to our international operations.
Because approximately 60% of our sales come from our international operations, our operating results and financial condition could be adversely affected by economic, political, health, regulatory and other factors existing in foreign countries in which we operate. Our international operations are subject to inherent risks, which may adversely affect us, including: fluctuations in exchange rates; political and economic instability; expropriation, or the imposition of government controls; changes in government regulations; export license requirements; trade restrictions; earnings expatriation restrictions; exposure to different legal standards; less favorable intellectual property laws; health conditions and standards; currency controls; increases in duties and taxes; high levels of inflation or deflation; greater difficulty in collecting our accounts receivable and longer payment cycles; changes in labor conditions and difficulties in staffing and managing our international operations; limitations on insurance coverage against geopolitical risks, natural disasters and business operations; and communication among and management of international operations. In addition, these same factors may also place us at a competitive disadvantage to some of our foreign competitors. We are dependent on the availability and price of materials.
We require substantial amounts of materials, including petroleum-based products, glass, copper and precious metals, application-specific integrated circuits, light-emitting diode (LED) displays, and all materials we require are purchased from outside sources. The availability and prices of materials may be subject to curtailment or change due to, among other things, new laws or regulations, suppliers’ allocations to other purchasers, interruptions in production by suppliers, changes in exchange rates and worldwide price levels. Any change in the availability of, or price for, these materials could materially affect our results of operations and financial condition. We experienced significant price increases in fiscal 2011 for copper, precious metals and petroleum-based raw materials. We did not experience significant price increases in fiscal 2010 and 2009 related to those items. Recent events in the Middle East may result in significantly higher oil prices, which could result in higher prices for oil-based materials, such as resins. Disruption of our supply chain could have an adverse effect on our business, financial condition and results of operations.
Our ability, including manufacturing or distribution capabilities, and that of our suppliers, business partners and contract manufacturers, to make, move and sell products is critical to our success. Damage or disruption to our or their manufacturing or distribution capabilities due to weather, including any potential effects of climate change, natural disaster, fire or explosion, terrorism, pandemics, strikes, repairs or enhancements at our facilities, or other reasons, could impair our ability to manufacture or sell our products. Failure to take adequate steps to mitigate the likelihood or potential impact of such events,
4

or to effectively manage such events if they occur, could adversely affect our business, financial condition and results of operations, as well as require additional resources to restore our supply chain.
We may be unable to keep pace with rapid technological changes, which would adversely affect our business.
The technologies relating to some of our products have undergone, and are continuing to undergo, rapid and significant changes. Specifically, end markets for electronic components and assemblies are characterized by technological change, frequent new product introductions and enhancements, changes in customer requirements and emerging industry standards. These changes could render our existing products unmarketable before we can recover any or all of our research, development and other expenses. Furthermore, the life cycles of our products vary, may change and are difficult to estimate. If we are unable, for technological or other reasons, to develop and market new products or product enhancements in a timely and cost-effective manner, our business, financial condition and operating results could be materially adversely affected. Products we manufacture may contain design or manufacturing defects that could result in reduced demand for our products or services and liability claims against us.
Despite our quality control and quality assurance efforts, defects may occur in the products we manufacture due to design or manufacturing errors or component failure. Product defects may result in delayed shipments and reduced demand for our products. We may be subject to increased costs due to warranty claims on defective products. Product defects may result in product liability claims against us where defects cause, or are alleged to cause, property damage, bodily injury or death. We may be required to participate in a recall involving products that are, or are alleged to be, defective. We carry insurance for certain legal matters involving product liability, however, we do not have coverage for all costs related to product defects or recalls and the costs of such claims, including costs of defense and settlement, may exceed our available coverage. If we are unable to protect our intellectual property or we infringe, or are alleged to infringe, on another person’s intellectual property, our business, financial condition and operating results could be materially adversely affected.
We have numerous United States and foreign patents and license agreements covering certain of our products and manufacturing processes, several of which are considered significant to our business. Our ability to compete effectively with other companies depends, in part, on our ability to maintain the proprietary nature of our technology. Although we have been awarded, have filed applications for, or have been licensed under numerous patents in the United States and other countries, there can be no assurance concerning the degree of protection afforded by these patents or the likelihood that pending patents will be issued. The loss of any significant patents and trade secrets could adversely affect our sales, margins, profitability and, as a result, share price.
We may become involved in litigation in the future to protect our intellectual property or because others may allege that we infringe on their intellectual property. These claims and any resulting lawsuit could subject us to liability for damages and invalidate our intellectual property rights. If an infringement claim is successfully asserted by a holder of intellectual property rights, we may be required to cease marketing or selling certain products, pay a penalty for past infringement and spend significant time and money to develop a non-infringing product or process or to obtain licenses for the technology, process or information from the holder. We may not be successful in the development of a non-infringing alternative, or licenses may not be available on commercially acceptable terms, if at all, in which case we may lose sales and profits. In addition, any litigation could be lengthy and costly and could materially adversely affect us even if we are successful in the litigation. We are subject to continuing pressure to lower our prices. Over the past several years we have experienced, and we expect to continue to experience, pressure to lower our prices. In order to maintain our margins, we must continue to reduce our costs by similar amounts. Continuing pressures to reduce our prices could have a material adverse effect on our financial condition, results of operations and cash flows.
We were awarded new North American automotive business in fiscal 2011 for programs that will not begin production until fiscal 2013. We anticipate that it will take a significant amount of our cash and resources to launch these programs.
During fiscal 2011, we were awarded a next generation center stack program for multiple GM vehicle platforms as well as transmission lead-frame assemblies for GM transmissions. Both programs are expected to be manufactured in our plant in Monterrey, Mexico. We anticipate that these programs will require a significant amount of cash for the purchase of equipment, tooling and initial inventory as well as additional staffing for the development and launching of the programs. We
5

expect to begin production and generate sales on these programs in fiscal 2013. Therefore, we anticipate our cash balances may decline due to the launching of these programs without a corresponding increase in sales.
We currently have a significant amount of our cash located outside the U.S.
We believe our current world-wide cash balances together with expected future cash flows to be generated from operations will be sufficient to support current operations. However, due to the shifting of operations from the U.S. to foreign locations, a significant amount of cash and expected future cash flows are located outside of the U.S. No provision has been made, except for our Ireland business, for income taxes on undistributed net income of foreign operations, as we currently expect them to be indefinitely reinvested in our foreign operations. However, if we change our position and the cash is repatriated back to the U.S., it may have an adverse affect on our U.S. federal and state taxes, by lowering our net operating loss positions or potentially creating a tax liability.
A significant fluctuation between the U.S. dollar and other currencies could adversely impact our operating results.
Although our financial results are reported in U.S. dollars, a significant portion of our sales and operating costs are realized in other currencies, mainly in Europe and China. Our profitability is affected by movements of the U.S. dollar against the euro and Chinese yuan in which we generate revenue and incur expenses. Significant long-term fluctuations in relative currency values, in particular an increase in the value of the U.S. dollar against foreign currencies, could have an adverse effect on our profitability and financial condition.
We may acquire businesses or divest business operations. These transactions may pose significant risks and may materially adversely affect our business, financial condition and operating results.
We intend to explore opportunities to acquire other businesses or technologies that could complement, enhance or expand our current business or product lines or that might otherwise offer growth opportunities. Any transactions that we are able to identify and complete may involve a number of risks, including: the diversion of our management’s attention from our existing business to integrate the operations and personnel of the acquired or combined business or joint venture; possible adverse effects on our operating results during the integration process; and our possible inability to achieve the intended objectives of the transaction. In addition, we may not be able to successfully or profitably integrate, operate, maintain and manage our newly acquired operations or employees. We may not be able to maintain uniform standards, controls, procedures and policies, and this may lead to operational inefficiencies. In addition, future acquisitions may result in dilutive issuances of equity securities, a reduction of cash or the incurrence of debt.
We have in the past, and may in the future, consider divesting certain business operations. Divestitures may involve a number of risks, including the diversion of management’s attention, significant costs and expenses, the loss of customer relationships and cash flow, and the disruption of operations in the affected business. Failure to timely complete or to consummate a divestiture may negatively affect the valuation of the affected business or result in restructuring charges.
We could suffer significant business interruptions.
Our operations and those of our suppliers may be vulnerable to interruption by natural disasters such as earthquakes, tsunamis, typhoons, or floods, or other disasters such as fires, explosions, acts of terrorism or war, disease or failures of our management information or other systems. If a business interruption occurs, our business could be materially and adversely affected.
Unfavorable tax law changes may adversely affect results.
We are subject to income taxes in the U.S. and in various foreign jurisdictions. Domestic and international tax liabilities are subject to the allocation of income among various tax jurisdictions. Our effective tax rate could be adversely affected by changes in the mix of earnings among countries with differing statutory tax rates or changes in the tax laws. We cannot ensure that the newly acquired Eetrex business will be successful or that we can implement and profit from any new applications of the acquired technology.
We acquired 70% of Eetrex as of April 30, 2011. As a result of this acquisition, we now design and manufacture chargers, inverters and battery systems for hybrid and plug-in hybrid electronic vehicles. The market for these products is competitive and rapidly developing. If we do not keep pace with technological innovations in the industry, our products may not be competitive and we may not benefit from future revenue and earnings. Furthermore, while we intend to expand the
6

Eetrex business by integrating the technology into additional applications, we can make no guarantee that such ventures will be successful or profitable.
The future trading price of our common stock could be subject to wide fluctuations in response to a variety of factors.
The market price of our common stock has fluctuated significantly in the past and is likely to fluctuate in the future. The future trading price of our common stock could be subject to wide fluctuations in response to a variety of factors, including, but not limited to:
• quarterly variations in our operating results and the operating results of other technology companies;• actual or anticipated announcements of technical innovations or new products by us or our competitors;• changes in analysts’ estimates of our financial performance or buy/sell recommendations;• any acquisitions or divestitures we pursue or complete;• general conditions in the aerospace, appliance, automotive, consumer and industrial equipment markets and
communications, rail and other transportation industries; and• global economic and financial conditions.
In addition, the stock market has from time to time experienced significant price and volume fluctuations that have
affected the market prices for many companies and that often have been unrelated to the operating performance of such companies. These broad market fluctuations and other factors have harmed and may harm the market price of our common stock.
7

Item 2. Properties
We operate the following manufacturing and other facilities, all of which we believe to be in good condition and adequate to meet our current and reasonably anticipated needs:
Location
Chicago, Illinois
Automotive Segment:
Carthage, IllinoisMriehel, MaltaShanghai, ChinaMcAllen, TexasMonterrey, MexicoSouthfield, MichiganBangalore, IndiaGau-Algesheim, GermanyBurnley, EnglandSin El Fil, Lebanon
Interconnect Segment:
Chicago, IllinoisMriehel, MaltaRichardson, TexasOklahoma City, OklahomaLaguna, PhilippinesWheaton, IllinoisShanghai, ChinaSan Jose, CaliforniaSingapore
Power Products Segment:
Rolling Meadows, IllinoisShanghai, ChinaMosta, MaltaSan Jose, California
Other Segment:
Palatine, IllinoisHunt Valley, MarylandChicago, Illinois
Use
Corporate Headquarters
ManufacturingManufacturingManufacturingWarehousingManufacturingSales and Engineering Design CenterEngineering Design CenterSales and Engineering Design CenterEngineering Design CenterEngineering Design Center
ManufacturingManufacturingManufacturingManufacturing/Design CenterManufacturingManufacturingManufacturingSales and DesignSales and Administrative
ManufacturingManufacturingManufacturingPrototype and Design Center
Test LaboratoryTest LaboratoryManufacturing
Owned/Leased
Owned
OwnedLeasedLeasedLeasedLeasedOwnedLeasedLeasedLeasedLeased
OwnedLeasedLeasedLeasedLeasedLeasedLeasedLeasedLeased
OwnedLeasedLeasedLeased
OwnedOwnedOwned
Approximate Square Footage
15,000
261,000259,22055,48538,00036,00017,0009,8608,1005,9002,300
38,40032,50025,70024,70022,80022,50015,0007,2501,250
52,00040,00032,5007,250
27,00016,00010,000
8

Item 3. Legal Proceedings
Other than as described below, as of April 30, 2011, we were not involved in any material legal proceedings or any legal proceedings or material administrative proceedings with governmental authorities pertaining to the discharge of materials into the environment or otherwise.
In March 2010, DPH Holdings Corp. and certain of its affiliated debtors, as successors to Delphi Corporation and certain of its affiliates (“Delphi”), served the Company with a complaint seeking to recover approximately $19.7 million in alleged preference payments that Delphi made to the Company within the 90-day period preceding Delphi’s bankruptcy filing in October 2005 (the “Complaint”). Delphi is pursuing similar preference complaints against approximately 175 other, unrelated third-parties. The Complaint, dated September 28, 2007, was originally filed under seal with the United States Bankruptcy Court for the Southern District of New York (titled as Delphi Corporation, et al. v. Methode Electronics, Inc, Adversary Proceeding No. 07-2432) and pursuant to certain court orders, the Complaint was not unsealed and served upon the Company until March 2010. The Company has filed a joinder to third-parties’ motions to dismiss the Delphi preference complaints based on violations of due process and other defenses connected to the unusual manner that Delphi filed and served the preference complaints. Additionally, the Company possesses several other substantive defenses to the Complaint including, but not limited to, the affirmative defenses available under the Bankruptcy Code, statute of limitations, setoff, waiver and estoppel. Although the outcome of potential legal actions and claims cannot be determined, it is the opinion of our management, based on the information available, that we have adequate reserves for these liabilities and that the ultimate resolution of these matters will not have a material adverse effect on our consolidated financial statements.
Executive Officers of the Registrant
Name
Donald W. Duda
Douglas A. Koman
Thomas D. Reynolds
Timothy R. Glandon
Joseph. E. Khoury
Theodore P. Kill
Ronald L.G. Tsoumas
Age
55
61
48
47
47
60
50
Offices and Positions Held and Length of Service as Officer
Chief Executive Officer of the Company since 2004. President and Director of theCompany since 2001. Prior thereto Mr. Duda was Vice President-Interconnect Groupsince March 2000. Prior thereto Mr. Duda was with Amphenol Corporation throughNovember 1998 as General Manager of its Fiber Optic Products Division since 1988.
Chief Financial Officer of the Company since 2004. Vice President, Corporate Finance,of the Company since 2001. Prior thereto Mr. Koman was Assistant Vice President-Financial Analysis since December 2000. Prior thereto Mr. Koman was with IllinoisCentral Corporation through March 2000 as Controller since November 1997 andTreasurer since July 1991.
Chief Operating Officer, of the Company since June 2010. Senior Vice President,Worldwide Automotive Operations, of the Company since 2006. Vice President andGeneral Manager, North American Automotive Operations, of the Company sinceOctober 2001. Prior thereto Mr. Reynolds was with Donnelly Corporation throughOctober 2001 as Senior Manager of Operations since 1999, and as Director ofTransnational Business Unit from 1995 to 1999.
Vice President and General Manager, North American Automotive, of the Companysince 2006. Prior thereto Mr. Glandon was General Manager of Automotive SafetyTechnologies since 2001. Prior thereto Mr. Glandon was Vice President and GeneralManager with American Components, Inc. from 1996 to 2001.
Vice President and General Manager, European Automotive, of the Company since 2004.Prior thereto Mr. Khoury was General Manager of Methode Electronics International,GMBH since 2000.
Vice President, Worldwide Automotive Sales, of the Company since August 2006. Priorthereto Mr. Kill was a principal with Kill and Associates from 2003 to 2006. Prior theretoMr. Kill was a principal with Kill and Bolton Associates from 1995 to 2003.
Controller and Treasurer of the Company since 2007. Prior thereto Mr. Tsoumas wasAssistant Controller of the Company since July 1998.
All executive officers are elected by the Board of Directors and serve a term of one year or until their successors are duly elected and qualified.
9

PART II
Item 5. Market for Registrant’s Common Equity, Related Stockholder Matters and Issuer Purchases of Equity Securities
The following is a tabulation of high and low sales prices for the periods indicated as reported by the New York Stock Exchange.
Fiscal Year ended April 30, 2011First QuarterSecond QuarterThird QuarterFourth Quarter
Fiscal Year ended May 1, 2010First QuarterSecond QuarterThird QuarterFourth Quarter
Sales Price Per ShareHigh
$ 11.7811.0313.7312.74
$ 8.189.75
12.7514.32
Low
$ 9.317.859.10
11.26
$ 5.286.926.999.70
DividendsPaid
Per Share
$ 0.070.070.070.07
$ 0.070.070.070.07
On June 23, 2011, the Board declared a dividend of $0.07 per share of common stock, payable on July 29, 2011, to
holders of record on July 15, 2011.
As of June 30, 2011, the number of record holders of our common stock was 574.
Equity Compensation Plan Information
The following table provides information about shares of our common stock that may be issued upon exercise of stock options or granting of stock awards under all of the existing equity compensation plans as of April 30, 2011.
Plan category
Equity compensation plans approved by security holdersEquity compensation plans not approved by security holders
Total
Number of securitiesto be issued upon
exercise ofoutstanding options,warrants and rights
1,131,267—
1,131,267
Weighted-averageexercise price of
outstanding options,warrants and rights
$ 7.43—
$ 7.43
Number of securitiesremaining availablefor future issuance
under equitycompensation plans(excluding securitiesreflected in the first
column)
1,261,931—
1,261,931
Purchase of Equity Securities by the Company and Affiliated Purchasers
Period
January 30, 2011 through February 26, 2011February 27, 2011 through April 2, 2011April 3, 2011 through April 30, 2011
TotalNumber of
SharesPurchased (1)
—205
5,1735,378
AveragePrice PaidPer Share
$ —11.82
$ 12.36$ 12.34
Total Number ofShares Purchased as
Part of PubliclyAnnounced Plans
or Programs
——
Maximum Number ofShares that
May Yet Be PurchasedUnder the Plans or
Programs
——
_________________________________(1) The amount includes the repurchase and cancellation of shares of common stock redeemed by the Company for the payment of minimum withholding taxes on the value of restricted stock awards vesting during the period.
10

Item 6. Selected Financial Data The following selected financial data should be read in conjunction with “Management’s Discussion and Analysis of Financial Condition and Results of Operations” and the Company’s Consolidated Financial Statements and related notes included elsewhere in this report. The consolidated statement of operations data for fiscal 2011, 2010 and 2009, and the consolidated balance sheet data as of April 30, 2011 and May 1, 2010, are derived from, and are qualified by reference to, the Company’s audited consolidated financial statements included elsewhere in this report. The consolidated statement of operations data for fiscal 2008 and 2007, and the consolidated balance sheet data as of May 2, 2009, May 3, 2008 and April 28, 2007, are derived from audited consolidated financial statements not included in this report. Due to the timing of our fiscal calendar, fiscal 2008 represents 53 weeks of results. Fiscal 2011, 2010, 2009 and 2007 represent 52 weeks of results.
Income Statement Data:Net salesIncome/(loss) before income taxesIncome tax expense/(benefit)Income/(loss) from continuingoperationsIncome from discontinuedoperations, net of taxCumulative effect of accountingchange, net of taxNet income/(loss) applicable toMethode Electronics, Inc.
Per Common Share:Basic net income/(loss) fromcontinuing operationsBasic net income/(loss) fromdiscontinued operationsBasic net income/(loss) applicableto Methode Electronics, Inc.
Diluted net income/(loss) fromcontinuing operationsDiluted net income/(loss) fromdiscontinued operationsDiluted net income/(loss)applicable to Methode Electronics,Inc.
DividendsBook Value
Long-term DebtRetained EarningsFixed Assets (net)Total AssetsReturn on Average EquityPre-tax Income/(loss) as aPercentage of SalesNet Income/(loss) as a Percentage ofSales
Fiscal Year Ended
April 30,2011
(In Millions, Except Percentages and Per Share Amounts)
$ 428.214.5(4.1)
18.5
0.6
—
19.5
0.51
0.02
0.53
0.50
0.02
0.52
0.286.95
—156.0
61.5334.7
7.9%
3.4%
4.6%
(1)
(1)
(1)
(1)
(1)
(1)
(1)
(1)
(1)
(1)
(1)
(1)
May 1,2010
$ 377.67.8
(6.0)
13.8
—
—
13.7
0.37
—
0.37
0.37
—
0.37
0.286.43
—146.8
61.9310.8
6.0%
2.1%
3.6%
(2)
(2)
(2)
(2)
(2)
(2)
(2)
(2)
(2)
(2)
(2)
May 2,2009
$ 428.8(110.5)
1.7
(112.1)
—
—
(112.5)
(3.05)
—
(3.05)
(3.05)
—
(3.05)
0.266.28
—143.669.9
305.3(37.2)%
(25.8)%
(26.2)%
(3)
(3)
(3)
(3)
(3)
(3)
(3)
(3)
(3)
(3)
(3)
May 3, 2008
(53wks)
$ 555.049.8
9.7
39.8
—
—
39.8
1.07
—
1.07
1.06
—
1.06
0.209.93
—265.890.3
470.211.4%
9.0%
7.2%
(4)
(4)
(4)
(4)
(4)
(4)
(4)
(4)
(4)
(4)
(4)
April 28,2007
$ 450.035.59.8
26.1
—
0.1
26.1
0.72
—
0.72
0.71
—
0.71
0.208.69
—233.7
86.9411.7
8.5%
7.9%
5.8%
(5)
(5)
(5)
(5)
(5)
(5)
(5)
(5)
(5)
(5)
(5)
11

(1) Fiscal 2011 results includes an after-tax gain on the sale of a business of $0.6 million. In addition, fiscal 2011 includes $4.8 million of pre-tax legal expense relating to the Delphi supply agreement and patent lawsuit.
(2) Fiscal 2010 results include a pre-tax charge of $7.8 million relating to restructuring activities. In addition, fiscal 2010 includes $5.8 million of pre-tax legal expense relating to the Delphi supply agreement and patent lawsuit. Income tax includes a $8.4 million loss carry-back benefit related to losses in our U.S.-based businesses.
(3) Fiscal 2009 results include a pre-tax charge of $94.4 million relating to goodwill and other asset impairments. In
addition, fiscal 2009 results include a pre-tax charge of $25.3 million relating to restructuring activities. The income tax expense includes a $28.0 million valuation charge related to the uncertainty of the future realization of our deferred tax assets.
(4) Fiscal 2008 results include a pre-tax charge of $5.2 million relating to a restructuring of our U.S.-based automotive
operations and the decision to discontinue producing certain legacy products in the Interconnect segment. (5) Fiscal 2007 results include a pre-tax and an after-tax restructuring charge of $2.0 million related to the closing of
our Scotland automotive parts manufacturing plant and transfer of production lines from that facility to our automotive parts manufacturing facility in Malta.
Item 7. Management’s Discussion and Analysis of Financial Condition and Results of Operations Overview
We are a global manufacturer of component and subsystem devices with manufacturing, design and testing facilities in China, Germany, India, Lebanon, Malta, Mexico, the Philippines, Singapore, Switzerland, the United Kingdom and the United States. We are a global designer and manufacturer of electronic and electro-mechanical devices. We design, manufacture and market devices employing electrical, radio remote control, electronic, wireless, sensing and optical technologies. Our business is managed on a segment basis, with those segments being Automotive, Interconnect, Power Products and Other. For more information regarding the business and products of these segments, see “Item 1. Business.”
Our components are found in the primary end markets of the aerospace, appliance, automotive, construction, consumer and industrial equipment markets, communications (including information processing and storage, networking equipment, wireless and terrestrial voice/data systems), rail and other transportation industries Recent Transactions
In May 2010, we paid $1.0 million for a 15% equity investment in Eetrex Incorporated to facilitate our development into the electric vehicle market. Eetrex is located in Boulder, Colorado and is a developer and manufacturer of chargers, inverters and battery systems for hybrid and plug-in hybrid electronic vehicles. In March 2011, we paid an additional $1.1 million, for a total investment of $2.1 million, to acquire an additional 36% of the stock of Eetrex. In April 2011, we paid an additional $0.7 million and acquired an additional 19% of their stock, for a total 70% ownership. Under the agreements, the Company has additional opportunities to acquire the remaining Eetrex shares in the future.
In March 2011, we sold our 75% ownership interest in Optokon, our Czech optical operation, to the minority shareholder for $10.0 million. The net assets of our 75% ownership interest had a book value of $9.9 million. We recorded a net gain of $4.1 million related to sale of the net assets, primarily attributable to the cumulative translation gains since the date of the initial investment. We also recorded income taxes related to the sale of $3.5 million, resulting in a gain after taxes of $0.6 million. In the sale, we received $5.9 million in cash as well as a collateralized note for $4.1 million.
Management concluded the Optokon results of operations for fiscal 2011, 2010 and 2009 were not material to the consolidated or segment level financial statements for those periods presented to be separately reported as a discontinued operations in accordance with ASC 205-20, "Presentation of Financial Statements".
Delphi Litigation
In March 2010, DPH Holdings Corp., as successor to Delphi Corporation, served the Company with a complaint seeking to recover approximately $19.7 million in alleged preference payments that Delphi made to the Company within the 90-day preference period preceding Delphi's bankruptcy filing. The Company is seeking to dismiss the Delphi preference complaint based on violations of due process and the Company possesses several other substantive defenses.
12

In June 2006, the Company sold certain unsecured claims it had against Delphi in Delphi’s bankruptcy proceeding to Credit Suisse for $3.1 million pursuant to a Transfer Agreement. These claims were subsequently assigned by Credit Suisse to Blue Angel Claims LLC (“Blue Angel”). On July 20, 2010, Blue Angel delivered a demand letter to the Company contending that under the terms of the Transfer Agreement, the unsecured claims had been objected to by Delphi in the Delphi bankruptcy proceeding and therefore the Company owed Blue Angel $3.1 million plus interest. The litigation was subsequently settled for$2.1 million in fiscal 2011. As part of the settlement agreement, Blue Angel retains ownership of the unsecured claims.
Business Outlook Our overall outlook for fiscal 2012 is cautiously optimistic. While fiscal 2011 production levels in China, Europe and North America were strong, our European businesses may experience some softness in fiscal 2012 as economic austerity programs continue to roll through Europe affecting both European and export demand. We expect our North American automotive production to continue to improve in the Automotive segment in fiscal 2012 as new programs are launched. However, recent events in the Middle East may result in significantly higher oil prices and corresponding increases in prices for oil-based material, such as resins. Any such increases could negatively impact the profitability of our business. We expect sales in our Power Products segment to increase in fiscal 2012. While we expect that Interconnect segment sales will modestly increase in fiscal 2012, sales to our customers in the appliance industry will continue to be soft until unemployment and home sales improve. While our prior restructuring activities have reduced our cost structure, we do expect higher designing, developing and engineering costs in fiscal 2012 to support programs scheduled to launch in fiscal 2013. During fiscal 2011, we experienced additional costs due to vendor supply issues for new automotive products that began ramping up in the second quarter of fiscal 2011 that are expected to continue until those manufacturing capabilities are brought in-house. We may continue to experience manufacturing inefficiencies due to multiple product launches, component shortages, and supplier issues that could negatively affect our results. The Company maintains a positive long-term outlook for its global business and is committed to developing new product solutions for our customers and to making strategic capital investments as it pursues its growth strategy.
Results may differ materially from what is expressed or forecasted. See “ Item 1A Risk Factors” herein.
13

Results of Operations Results of Operations for the Fiscal Year Ended April 30, 2011, as Compared to the Fiscal Year Ended May 1, 2010. Consolidated Results Below is a table summarizing results for the years ended:(in millions)("N/M" equals not meaningful)
Net sales
Cost of products sold
Gross margins
RestructuringSelling and administrative expensesAmortization of intangiblesInterest (income)/expense, netOther, net - (income)/expenseIncome taxes benefitGain on sale of discontinued business, net of taxNet income/(loss) attributable to noncontrolling interestNet income attributable to Methode Electronics, Inc.
Percent of sales:
Net salesCost of products soldGross marginsRestructuringSelling and administrative expensesAmortization of intangiblesInterest (income)/expense, netOther, net - (income)/expenseIncome taxes benefitGain on sale of discontinued business, net of taxNet income/(loss) attributable to noncontrolling interestNet income attributable to Methode Electronics, Inc.
April 30,2011
$ 428.2
339.0
89.2
—70.82.40.21.3
(4.1)(0.6)(0.3)
$ 19.5
April 30,2011
100.0 %79.2 %20.8 %
— %16.5 %0.6 %— %0.3 %
(1.0)%(0.1)%(0.1)%4.6 %
May 1,2010
$ 377.6
297.7
79.9
7.862.42.30.1
(0.5)(6.0)
—0.1
$ 13.7
May 1,2010
100.0 %78.8 %21.2 %2.1 %
16.5 %0.6 %— %
(0.1)%(1.6)%
— %— %3.6 %
0
Net Change
$ 50.6
41.3
9.3
(7.8)8.40.10.11.81.9
(0.6)(0.4)
$ 5.8
Net Change
13.4%
13.9%
11.6%
N/M13.5%4.3%
100.0%N/MN/MN/MN/M
42.3%
Net Sales. Consolidated net sales increased $50.6 million, or 13.4%, to $428.2 million for fiscal 2011, from $377.6
million for fiscal 2010. The Automotive segment net sales increased $22.8 million, or 11.2%, to $226.0 million for fiscal 2011, from $203.2 million for fiscal 2010. The Interconnect segment net sales increased $14.6 million, or 11.8%, to $138.8 million for fiscal 2011, compared to $124.2 million for fiscal 2010. The Power Products segment net sales increased $9.9 million, or 24.4%, to $50.4 million for fiscal 2011, as compared to $40.5 million for fiscal 2010. The Other segment net sales increased $3.7 million, or 39.8%, to $13.0 million for fiscal 2011, as compared to $9.3 million for fiscal 2010. Included in net sales is other income, which consisted primarily of earnings from engineering design fees and royalties. Other income decreased $0.3 million, or 6.7%, to $4.2 million for fiscal 2011, from $4.5 million for fiscal 2010. The decrease relates to engineering design
14

fees in our European automotive business. Translation of foreign operations net sales for fiscal 2011 decreased reported net sales by $4.2 million or 1.1% due to average currency rates for fiscal 2011, compared to the average currency rates for fiscal 2010.
Cost of Products Sold. Consolidated cost of products sold increased $41.3 million, or 13.9%, to $339.0 million for fiscal 2011, compared to $297.7 million for fiscal 2010. Consolidated cost of products sold as a percentage of sales were 79.2% in fiscal 2011, compared to 78.8% in fiscal 2010. During fiscal 2011, we recorded a negotiated program termination charge of $1.3 million for certain products manufactured in our Malta facility and $0.4 million for customer cancellation of certain products manufactured in our U.S. facility. In addition, we incurred $2.3 million in additional costs due to a certain vendor's production and delivery issues for new products that began ramping up production during fiscal 2011. The increases were more than offset by cost efficiencies experienced in our Asian businesses, and higher sales volumes as well as a change in sales mix within the Interconnect segment in fiscal 2011, as compared to fiscal 2010. Included in the cost of products sold for fiscal 2010 is $0.7 million of asset write-downs related to the termination of the Delphi supply agreement.
Gross Margins. Consolidated gross margins increased $9.3 million, or 11.6%, to $89.2 million for fiscal 2011, as
compared to $79.9 million for fiscal 2010. Gross margins as a percentage of net sales decreased to 20.8% for fiscal 2011, compared to 21.2% for fiscal 2010. Gross margins as a percentage of sales declined due to loss of the Delphi business, the one-time reversal of pricing contingencies in fiscal 2010, the customer negotiated program cancellation and other customer cancellation charges, lower other income and costs due to a certain vendor's production and delivery issues, but were partially offset by higher sales volumes, a favorable change in sales mix within the Interconnect segment and cost efficiencies from our Asian businesses, for fiscal 2011, compared to fiscal 2010.
Restructuring. During fiscal 2010, we completed all of our planned restructuring initiatives. During fiscal 2010, we
recorded a total restructuring charge of $7.8 million, which consisted of $4.3 million for employee severance, $1.5 million for accelerated depreciation and $2.0 million for other costs.
Amortization of Intangibles. Amortization of intangibles increased $0.1 million, to $2.4 million for fiscal 2011,
compared to $2.3 million for fiscal 2010.
Selling and Administrative Expenses. Selling and administrative expenses increased $8.4 million, or 13.5%, to $70.8 million for fiscal 2011, compared to $62.4 million for fiscal 2010. During fiscal 2011, we recorded a settlement of $2.1 million for litigation regarding unsecured claims sold to Blue Angel LLC in June 2006, related to the Delphi bankruptcy. See the Overview section for more information regarding this matter. Stock option and stock award amortization increased by $2.1 million, to $3.0 million in fiscal 2011, compared to $0.9 million in fiscal 2010. Delphi litigation expenses decreased $1.0 million, to $4.8 million for fiscal 2011, compared to $5.8 million for fiscal 2010. Selling and marketing expenses increased in our North American and Asian automotive businesses, partially offset by lower commissions and professional fees in fiscal 2011, compared to fiscal 2010. Selling and administrative expenses as a percentage of net sales were 16.5% for both fiscal 2011 and 2010.
Interest Expense, Net. Interest expense, net increased $0.1 million, to $0.2 million for fiscal 2011, compared to $0.1
million for fiscal 2010. Interest income was $0.6 million for fiscal 2011, compared to $0.4 million for fiscal 2010. Interest expense was $0.8 million for fiscal 2011, compared to $0.5 million for fiscal 2010. The increase in interest expense relates to borrowings against our credit facility during fiscal 2011.
Other, Net. Other, net increased $1.8 million to an expense of $1.3 million for fiscal 2011, compared to income of $0.5 million for fiscal 2010. Fiscal 2011 included income of $1.2 million for life insurance polices in connection with the deferred compensation plan. In addition, fiscal 2011 includes a gain on investment of business of $0.2 million, related to the original $1.0 million investment in Eetrex. Fiscal 2010 included income of $0.6 million related to an enhanced cash fund, as well as income of $1.1 million for life insurance polices in connection with the deferred compensation plan. All other amounts for both fiscal 2011 and fiscal 2010, relate to currency rate fluctuations. The functional currencies of these operations are the British pound, Czech koruna, Chinese yuan, Euro, Indian Rupee, Mexican peso, Singapore dollar and Swiss Franc. Some foreign operations have transactions denominated in currencies other than their functional currencies, primarily sales in U.S. dollars and Euros, creating exchange rate sensitivities.
Income Tax Benefit. Income tax benefit from continuing operations decreased by $1.9 million to $4.1 million for fiscal 2011, compared to $6.0 million for fiscal 2010. Fiscal 2011 includes a benefit for an intraperiod tax allocation related to the sale of Optokon of $3.5 million, a benefit of $2.7 million related to the expiration of uncertain tax positions and interest from prior periods, partially offset by a net income tax expense on foreign profits of $2.1 million. Fiscal 2010 includes taxes
15

on foreign profits of $1.1 million, book to income tax return adjustments of $2.8 million and other adjustments of $1.6 million. In addition, a benefit of $2.7 million was recorded due to the settlement of uncertain tax positions and related interest from prior periods.
Gain on the Sale of Discontinued Business, Net of Tax. In March 2011, we sold our 75% ownership in Optokon, to the minority shareholder for $10.0 million. The net assets of our 75% ownership had a book value of $9.9 million. We recorded a gain of $4.1 million to sale of the net assets, primarily attributable to the cumulative translation gains since the date of the initial investment. We also recorded income taxes related to the sale of $3.5 million, resulting in a gain net of taxes of $0.6 million. The tax expense was based on the amount sold of $10.0 million less our initial investment of $1.2 million, resulting in a taxable gain of $8.8 million. In the sale, we received $5.9 million in cash as well as a collateralized note for $4.1 million.
Net Income Attributable to Methode Electronics, Inc. Net income attributable to Methode Electronics, Inc. increased $5.8 million, or 42.3%, to $19.5 million for fiscal 2011, compared to $13.7 million for fiscal 2010. The increase is primarily due to higher net sales and gross margins, no restructuring expenses, gain on the sale of a business, partially offset by the Blue Angel unsecured claims charge, higher stock option and stock award amortization, lower tax benefits, the one-time reversal of pricing contingencies in fiscal 2010, customer negotiated cancellation and other customer cancellation costs, costs related to a certain vendor's production and delivery issues, higher development costs and higher foreign currency exchange expenses in fiscal 2011, compared to fiscal 2010.
Operating Segments Automotive Segment Results Below is a table summarizing results for the years ended:(in millions)("N/M" equals not meaningful)
Net sales
Cost of products sold
Gross margins
RestructuringSelling and administrative expensesIncome from operations
Percent of sales:Net salesCost of products soldGross marginsRestructuringSelling and administrative expensesIncome from operations
April 30,2011
$ 226.0
186.3
39.7
—26.4
$ 13.3
April 30,2011
100.0%82.4%17.6%
—%11.7%5.9%
May 1,2010
$ 203.2
166.7
36.5
5.619.6
$ 11.3
May 1,2010
100.0%82.0%18.0%2.8%9.6%5.6%
Net Change
$ 22.8
19.6
3.2
(5.6)6.8
$ 2.0
Net Change
11.2%
11.8%
8.8%
N/M34.7%17.7%
16

Below is a table showing the changes in the North America automotive net sales in fiscal 2011, compared to fiscal 2010:
North America Automotive net sales for fiscal 2010Termination of certain Ford legacy products at our Reynosa, Mexico facilityTermination of Delphi supply agreementTransfer of transmission lead-frame product to Shanghai, China facility
SubtotalFord center console program
North American Automotive net sales for fiscal 2011
$ 55.7(18.2)(14.1)(11.4)12.021.4
$ 33.4
Net Sales. Automotive segment net sales increased $22.8 million, or 11.2%, to $226.0 million for fiscal 2011, from $203.2 million for fiscal 2010. Net sales increased in Asia by 107.6%, to $77.0 million and increased in Europe by 4.8%, to $111.6 million, however, net sales from North America declined by 40.0%, to $33.4 million in fiscal 2011, compared to fiscal 2010. The increase in Asia is primarily due to increased sales for the transmission lead-frame and steering angle sensor products. In North America, there were no sales to Delphi Corporation in fiscal 2011, as compared to net sales of $14.1 million in fiscal 2010 due to the cancellation of the supply agreement on September 10, 2009. Net sales also declined in North America by $11.4 million due to the planned transfer of production from our U.S. facility to our facility in Shanghai, China in the third quarter of fiscal 2010, as well as by $18.2 million due to the termination of production of certain Ford legacy products at our Reynosa, Mexico facility at the end of the second quarter of fiscal 2010, as well as declines in sales of service parts. The decrease in North America automotive sales was partially offset by sales of $21.4 million in fiscal 2011, compared to fiscal 2010, due to the Ford Center Console Program, which launched at the end of the first quarter. Net sales benefited by $1.7 million in fiscal 2010, related to a one-time reversal of pricing contingencies which were accrued over several years and were no longer required. Included in net sales is other income, which consisted primarily of earnings from engineering design fees and royalties. Other income increased $0.1 million, or 2.6%, to $4.0 million for fiscal 2011, from $3.9 million for fiscal 2010. Translation of foreign operations net sales for fiscal 2011 decreased reported net sales by $4.1 million, or 2.0%, due to average currency rates in fiscal 2011, compared to the average currency rates in fiscal 2010.
Cost of Products Sold. Automotive segment cost of products sold increased $19.6 million, or 11.8%, to $186.3 million for fiscal 2011, from $166.7 million for fiscal 2010. Fiscal 2011 includes a charge of $1.3 million for negotiated program termination costs for certain products manufactured in our Malta facility. In addition, we incurred $2.3 million in additional costs due to a vendor's production and delivery issues for new products during fiscal 2011. The Automotive segment cost of products sold as a percentage of sales were 82.4% in fiscal 2011, compared to 82.0% in fiscal 2010. The increase in cost of products sold as a percentage of sales were also due to customer program cancellation charges and costs related to a certain vendor's production and delivery issues and the loss of the Delphi business, partially offset by higher sales volumes and improvements in cost of products sold in Asia. In addition, increasing costs of products sold as a percentage of sales primarily relates to the development of new products in North America, which are expected to begin shipping in future periods. Included in the cost of products sold for fiscal 2010 is $0.7 million of asset write-downs relating to the termination of the Delphi supply agreement.
Gross Margins. Automotive segment gross margins increased $3.2 million, or 8.8%, to $39.7 million for fiscal 2011, as compared to $36.5 million for fiscal 2010. The Automotive segment gross margins as a percentage of net sales were 17.6% for fiscal 2011, as compared to 18.0% for fiscal 2010. Gross margins as a percentage of sales decreased in fiscal 2011, compared to fiscal 2010, due to the loss of the Delphi business, increasing costs on the remaining North American business, customer program cancellation charges and costs related to a vendor's production and delivery issues, partially offset by higher sales volumes and cost efficiencies in Asia.
Restructuring. During fiscal 2010, we completed all of our planned restructuring initiatives. During fiscal 2010, we recorded a total restructuring charge of $5.6 million, which consisted of $3.4 million for employee severance, $1.4 million for accelerated depreciation and $0.8 million for other costs.
Selling and Administrative Expenses. Selling and administrative expenses increased $6.8 million, or 34.7%, to $26.4 million for fiscal 2011, compared to $19.6 million for fiscal 2010. During fiscal 2011, we recorded a settlement of $2.1 million for litigation regarding unsecured claims sold to Blue Angel LLC in June 2006, related to the Delphi bankruptcy. See the Overview section for more information regarding this matter. Delphi litigation expenses decreased $1.0 million, to $4.8 million for fiscal 2011, compared to $5.8 million for fiscal 2010. In addition, selling and marketing expenses increased in our North American and Asian automotive businesses primarily due to new product development efforts in fiscal 2011, compared to fiscal 2010. Selling and administrative expenses as a percentage of net sales were 11.7% for fiscal 2011 and 9.6% for fiscal 2010.
17

Income From Operations. Automotive segment income from operations increased $2.0 million or 17.7%, to $13.3 million for fiscal 2011, compared to $11.3 million for fiscal 2010 due to the lack of restructuring charges, higher sales and gross margins, partially offset by the Blue Angel unsecured claims charge, the one-time reversal of pricing contingencies in fiscal 2010, higher selling and marketing expenses, increased development costs in North America, and negotiated program termination costs in fiscal 2011, compared to fiscal 2010. Interconnect Segment Results Below is a table summarizing results for the years ended:(in millions)("N/M" equals not meaningful)
Net sales
Cost of products sold
Gross margins
RestructuringSelling and administrative expensesIncome from operations
Percent of sales:Net salesCost of products soldGross marginsRestructuringSelling and administrative expensesIncome from operations
April 30,2011
$ 138.8
96.8
42.0
—22.0
$ 20.0
April 30,2011
100.0%69.7%30.3%
—%15.9%14.4%
May 1,2010
$ 124.2
88.6
35.6
1.623.0
$ 11.0
May 1,2010
100.0%71.3%28.7%1.3%
18.5%8.9%
Net Change
$ 14.6
8.2
6.4
(1.6)(1.0)
$ 9.0
Net Change
11.8 %
9.3 %
18.0 %
N/M(4.3)%81.8 %
Net Sales. Interconnect segment net sales increased $14.6 million, or 11.8%, to $138.8 million for fiscal 2011, from
$124.2 million for fiscal 2010. Net sales increased 12.5% and 19.3% in North America and Europe, respectively, however, net sales declined in Asia by 2.4% in fiscal 2011, compared to fiscal 2010. The increase in North America is due to increased sales for our data, sensor and radio remote control devices and the increase in Europe is due to increased sales for radio remote control devices. The decrease in Asia relates to lower sales for legacy products due to the planned exit of this product line in fiscal 2011, compared to fiscal 2010. Translation of foreign operations net sales in fiscal 2011 decreased reported net sales by $0.1 million, due to average currency rates in fiscal 2011, compared to the average currency rates in fiscal 2010.
Cost of Products Sold. Interconnect segment cost of products sold increased $8.2 million, or 9.3%, to $96.8 million for fiscal 2011, compared to $88.6 million for fiscal 2010. Interconnect segment cost of products sold as a percentage of net sales decreased to 69.7% for fiscal 2011, compared to 71.3% for fiscal 2010. The decrease is primarily due to a favorable change in sales mix within the segment as well as the overall increase in net sales in fiscal 2011, compared to fiscal 2010. Gross Margins. Interconnect segment gross margins increased $6.4 million, or 18.0%, to $42.0 million for fiscal 2011, as compared to $35.6 million for fiscal 2010. Gross margins as a percentage of net sales increased to 30.3% for fiscal 2011, from 28.7% for fiscal 2010. The increase in gross margins as a percentage of net sales primarily relates to higher sales volumes as well as a favorable change in sales mix within the segment in fiscal 2011, compared to fiscal 2010.
Restructuring. During fiscal 2010, we completed all of our planned restructuring initiatives. During fiscal 2010, we recorded a total restructuring charge of $1.6 million, which consisted of $0.7 million for employee severance, $0.2 million for accelerated depreciation and $0.7 million for other costs.
18

Selling and Administrative Expenses. Selling and administrative expenses decreased $1.0 million, or 4.3%, to $22.0
million for fiscal 2011, compared to $23.0 million for fiscal 2010. The decrease is due to lower professional fees in our remote control business. Selling and administrative expenses as a percentage of net sales decreased to 15.9%, due to higher sales volumes, in fiscal 2011, from 18.5% for fiscal 2010.
Income From Operations. Interconnect segment income from operations increased $9.0 million, or 81.8%, to $20.0 million for fiscal 2011, compared to $11.0 million for fiscal 2010, due to increased net sales and gross margins, no restructuring expenses and lower selling and administrative expenses.
Power Products Segment Results Below is a table summarizing results for the years ended:(in millions)("N/M" equals not meaningful)
Net sales
Cost of products sold
Gross margins
RestructuringSelling and administrative expensesIncome from operations
Percent of sales:Net salesCost of products soldGross marginsRestructuringSelling and administrative expensesIncome from operations
April 30,2011
$ 50.4
39.8
10.6
—7.0
$ 3.6
April 30,2011
100.0%79.0%21.0%
—%13.9%7.1%
May 1,2010
$ 40.5
30.0
10.5
0.66.5
$ 3.4
May 1,2010
100.0%74.1%25.9%1.5%
16.0%8.4%
Net Change
$ 9.9
9.8
0.1
(0.6)0.5
$ 0.2
Net Change
24.4%
32.7%
1.0%
N/M7.7%5.9%
Net Sales. Power Products segment net sales increased $9.9 million, or 24.4%, to $50.4 million for fiscal 2011,
compared to $40.5 million for fiscal 2010. Net sales increased in fiscal 2011, as compared to fiscal 2010 by 4.6% in North America and by 65.2% in Asia. The increase in Asia was due to an increased demand for our busbar products. In North America, higher demand for our flexible cabling and heat sink products was offset with lower demand for our busbar products. We also began selling busbar products in Europe in fiscal 2011, which accounted for $2.6 million in net sales, compared to no net sales in fiscal 2010.
Cost of Products Sold. Power Products segment cost of products sold increased $9.8 million, or 32.7%, to $39.8 million for fiscal 2011, compared to $30.0 million for fiscal 2010. The Power Products segment cost of products sold as a percentage of sales increased to 79.0% for fiscal 2011, from 74.1% for fiscal 2010. Fiscal 2011 includes an inventory and equipment charge of $0.4 million, relating to the customer cancellation of certain products manufactured in the U.S. The increase in the cost of products sold as a percentage of sales is primarily due to new product development, as well as customer cancellation charges, partially offset by lower costs in our Asian business.
Gross Margins. Power Products segment gross margins increased $0.1 million, or 1.0%, to $10.6 million for fiscal 2011, compared to $10.5 million for fiscal 2010. Gross margins as a percentage of net sales decreased to 21.0% for fiscal 2011 from 25.9% for fiscal 2010. The decrease in gross margins as a percentage of sales is primarily due to the increased costs due to new product development for the Eetrex products, as well as customer cancellation charges, partially offset by lower costs in our Asian business.
19

Restructuring. During fiscal 2010, we completed all of our planned restructuring initiatives. During fiscal 2010, we recorded a restructuring charge of $0.6 million, which consisted of $0.1 million for employee severance and $0.5 million related to other costs.
Selling and Administrative Expenses. Selling and administrative expenses increased $0.5 million, or 7.7%, to $7.0 million for fiscal 2011, compared to $6.5 million for fiscal 2010. Selling and administrative expenses increased due to increased selling and professional fees in our U.S.-based busbar and heat sink businesses as well as increased expenses due to the purchase of 70% of Eetrex in fiscal 2011, as compared to fiscal 2010. Selling and administrative expenses as a percentage of net sales decreased to 13.9% in fiscal 2011, from 16.0% for fiscal 2010.
Income From Operations. Power Products segment income from operations increased $0.2 million, or 5.9%, to $3.6 million for fiscal 2011, compared to $3.4 million for fiscal 2010, due to higher net sales and gross profit, no restructuring charges, partially offset with expenses related to new product development and expenses related to Eetrex, customer cancellation charges and higher selling and administrative expenses.
Other Segment Results Below is a table summarizing results for the years ended:(in millions)("N/M" equals not meaningful)
Net sales
Cost of products sold
Gross margins
Selling and administrative expenses
Loss from operations
Percent of sales:Net salesCost of products soldGross marginsSelling and administrative expensesLoss from operations
April 30,2011
$ 13.0
12.0
1.0
3.0
$ (2.0)
April 30,2011
100.0 %92.3 %7.7 %
23.1 %(15.4)%
May 1,2010
$ 9.3
9.5
(0.2)
2.1
$ (2.3)
May 1,2010
100.0 %102.2 %
(2.2)%22.6 %
(24.7)%
Net Change
$ 3.7
2.5
1.2
0.9
$ 0.3
Net Change
39.8%
26.3%
N/M
42.9%
N/M
Net Sales. The Other segment net sales increased $3.7 million, or 39.8%, to $13.0 million for fiscal 2011, compared to
$9.3 million for fiscal 2010. Net sales from our torque-sensing business increased 178.2% in fiscal 2011, compared to fiscal 2010. Net sales from our testing facilities decreased 13.8% in fiscal 2011, compared to fiscal 2010.
Cost of Products Sold. Other segment cost of products sold increased $2.5 million to $12.0 million for fiscal 2011, compared to $9.5 million for fiscal 2010. Cost of products sold as a percentage of sales decreased to 92.3% in fiscal 2011, compared to 102.2% in fiscal 2010 primarily due to increased sales from our torque-sensing business.
Gross Margins. The Other segment gross margins increased to $1.0 million for fiscal 2011, compared to a loss of $0.2 million for fiscal 2010. Gross margins as a percentage of sales increased to 7.7% in fiscal 2011, compared to negative 2.2% in fiscal 2010 primarily due to increased sales from our torque-sensing business.
Selling and Administrative Expenses. Selling and administrative expenses increased $0.9 million, or 42.9%, to $3.0 million for fiscal 2011, compared to $2.1 million for fiscal 2010. Selling and administrative expenses as a percentage of net sales increased to 23.1% for fiscal 2011, from 22.6% for fiscal 2010.
20

Loss from Operations. The Other segment loss from operations decreased $0.3 million, to $2.0 million for fiscal 2011,
compared to $2.3 million for fiscal 2010, due to increased sales and gross profit, partially offset by higher selling and administrative expenses.
Results of Operations for the Fiscal Year Ended May 1, 2010 as Compared to the Fiscal Year Ended May 2, 2009 Consolidated Results Below is a table summarizing results for the years ended:(in millions)("N/M" equals not meaningful)
Net sales
Cost of products sold
Gross margins
RestructuringImpairment of goodwill and other assetsSelling and administrative expensesAmortization of intangiblesInterest (income)/expense, netOther (income)/expense, netIncome taxes - (benefit)/expenseNet income attributable to noncontrolling interestNet income/(loss)
Percent of sales:Net salesCost of products soldGross marginsRestructuringImpairment of goodwill and other assetsSelling and administrative expensesAmortization of intangiblesInterest (income)/expense, netOther (income)/expense, netIncome taxes - (benefit)/expenseNet income attributable to noncontrolling interestNet income/(loss)
May 1,2010
$ 377.6
297.7
79.9
7.8—
62.42.30.1
(0.5)(6.0)0.1
$ 13.7
May 1,2010
100.0 %78.8 %21.2 %2.1 %— %
16.5 %0.6 %— %
(0.1)%(1.6)%
— %3.6 %
May 2,2009
$ 428.8
356.4
72.4
25.394.457.26.9
(1.4)0.51.70.3
$ (112.5)
May 2,2009
100.0 %83.1 %16.9 %5.9 %
22.0 %13.3 %1.6 %
(0.3)%0.1 %0.4 %0.1 %
(26.2)%
Net Change
$ (51.2)
(58.7)
7.5
(17.5)(94.4)
5.2(4.6)1.5
(1.0)(7.7)(0.2)
$ 126.2
Net Change
(11.9)%
(16.5)%
10.4 %
(69.2)%N/M9.1 %
(66.7)%N/MN/MN/M
(66.7)%N/M
Net Sales. Consolidated net sales decreased $51.2 million, or 11.9%, to $377.6 million for fiscal 2010 from $428.8
million for fiscal 2009. The Automotive segment net sales declined $42.9 million or 17.4% to $203.2 million for fiscal 2010 from $246.1 million for fiscal 2009. The decline is primarily attributable to lower sales to Delphi, Ford and Chrysler and the weak economic environment. The Interconnect segment net sales decreased $7.0 million, or 5.3% to $124.2 million for fiscal 2010 as compared to $131.2 million for fiscal 2009. The Power Products segment net sales decreased $2.2 million, or 5.2% to $40.5 million for 2010 as compared to $42.7 million for fiscal 2009. The Other segment net sales increased $1.1 million, or 13.4%, to $9.3 million for fiscal 2010, as compared to $8.2 million for fiscal 2009. Included in net sales is other income, which consisted primarily of earnings from engineering design fees and royalties. Other income increased $1.3 million, or 40.6%, to
21

$4.5 million for fiscal 2010, from $3.2 million for fiscal 2009. The increase relates to engineering design fees in our European automotive business. Translation of foreign operations net sales for fiscal 2010 increased reported net sales by $1.0 million or 0.3% due to currency rate fluctuations.
Cost of Products Sold. Consolidated cost of products sold decreased $58.7 million, or 16.5%, to $297.7 million for fiscal 2010 compared to $356.4 million for fiscal 2009. The decrease is due to the lower sales volumes. Consolidated cost of products sold as a percentage of sales were 78.8% for fiscal 2010, compared to 83.1% for fiscal 2009. The decrease relates to restructuring and consolidation efforts that were undertaken in prior periods to reduce inefficiencies in the business.
Gross Margins. Consolidated gross margins increased $7.5 million, or 10.4%, to $79.9 million for fiscal 2010
compared to $72.4 million for fiscal 2009. Gross margins as a percentage of net sales were 21.2% for fiscal 2010 compared to 16.9% for fiscal 2009. The increase relates to higher other income in fiscal 2010 as well as restructuring and consolidation efforts that were undertaken in prior periods.
Restructuring. In March 2009, we announced additional restructuring actions to consolidate manufacturing facilities
to reduce costs. During fiscal 2010, we recorded a restructuring charge of $5.3 million related to this restructuring initiative, which consisted of $3.6 million for employee severance and $1.7 million relating to other costs. During fiscal 2009, we recorded a restructuring charge of $7.3 million related to this restructuring initiative, which consisted of $0.1 for employee severance, $1.4 million for the impairment of fixed assets, $5.4 million for the impairment of customer funded tooling and $0.4 million for other costs. All of the restructuring actions related to the March 2009 restructuring initiative are now complete.
In January 2008, we announced a restructuring of our U.S.-based automotive operations and the decision to
discontinue producing certain legacy products in the Interconnect segment. During fiscal 2010, we recorded a restructuring charge of $2.5 million related to this restructuring initiative, which consisted of $0.7 million for employee severance, $1.5 million for the impairment and accelerated depreciation and $0.3 million relating to other costs. During fiscal 2009, we recorded a restructuring charge of $18.0 million related to this restructuring initiative, which consisted of $6.1 million for employee severance, $10.8 million for impairment and accelerated depreciation, $0.2 million for inventory write-downs and $0.9 million relating to other costs. All of the restructuring actions related to the January 2008 restructuring initiative are now complete.
Impairment of Goodwill and Other Assets. During fiscal 2009, in accordance with Accounting Standards Codification,
(“ASC”) No. 350, “Intangibles-Goodwill and Other,” we performed goodwill impairment testing and concluded that goodwill was impaired. Therefore, during fiscal 2009, we recorded a goodwill impairment charge of $25.8 million in our Automotive segment, $30.8 million in our Interconnect segment, $5.4 million in our Power Products segment and $1.2 million in our Other segment for a total of $63.2 million related to these assets.
Also during the third quarter of fiscal 2009, in accordance with ASC No. 360, “Property, Plant and Equipment,” it was
determined that certain identifiable assets of our businesses were impaired. Therefore, during fiscal 2009, we recorded an impairment charge of $4.6 million in our Automotive segment, $26.2 million in our Interconnect segment and $0.4 million in our Other segment for a total of $31.2 million related to these assets.
Selling and Administrative Expenses. Selling and administrative expenses increased $5.2 million, or 9.1%, to $62.4
million for fiscal 2010 compared to $57.2 million for fiscal 2009. The increase is due to $5.8 million in legal fees relating to the Delphi supply agreement and patent dispute. In addition, selling and administrative expenses were negatively impacted by $1.4 million due to $0.8 million of stock-based compensation in fiscal 2010, compared to a net reversal of expense of $0.6 million in fiscal 2009. The net reversal in fiscal 2009 was due to performance-based shares not meeting certain financial targets. Selling and administrative expenses were lower by $2.0 million due to restructuring and consolidation efforts from previous periods. Selling and administrative expenses as a percentage of net sales increased to 16.5% for fiscal 2010 from 13.3% for fiscal 2009.
Amortization of Intangibles. Amortization of intangibles decreased $4.6 million, or 66.7%, to $2.3 million for fiscal 2010, compared to $6.9 million for fiscal 2009. The decrease is due to the impairment of certain intangible assets in fiscal 2009.
Interest Income/(Expense), Net. Net interest income/(expense) decreased $1.5 million for fiscal 2010 to an expense of
$0.1 million as compared to income of $1.4 million for fiscal 2009. The average cash balance in fiscal 2010 was $62.5 million compared to an average cash balance of $81.4 million for fiscal 2009. The decrease in the average cash balance relates primarily to the Hetronic acquisition during the second quarter of fiscal 2009. The average interest rate earned for fiscal 2010
22

was 0.59% compared to 2.22% for fiscal 2009. Interest expense was $0.5 million and $0.4 million for fiscal 2010 and fiscal 2009, respectively. The interest expense in fiscal 2010 includes $0.1 million of fees related to the amendment of our bank agreement.
Other Income/(Expense), Net. Other income/(expense), net increased $1.0 million to income of $0.5 million for fiscal
2010 compared to an expense of $0.5 million for fiscal 2009. Fiscal 2010 included a $1.1 million gain recorded from life insurance policies owned by the Company in connection with an employee deferred compensation plan. During fiscal 2010, our net currency exchange losses increased due to the strengthening of the U.S. dollar versus the Euro and Czech koruna, resulting in exchange losses. During fiscal 2009, we recorded $2.5 million of unrealized currency exchange losses arising from an intercompany loan between our corporate headquarters and one of our foreign subsidiaries in conjunction with the acquisition of Hetronic, partially offset by currency exchange gains recorded in the same period. The functional currencies of these operations are the British pound, Chinese yuan, Czech koruna, euro, Indian rupee, Mexican peso and Singapore dollar. Some foreign operations have transactions denominated in currencies other than their functional currencies, primarily sales in U.S. dollars and Euros, creating exchange rate sensitivities.
During fiscal 2009 and the first half of fiscal 2010, we were invested in an enhanced cash fund sold as an alternative to
traditional money-market funds. At May 1, 2010 there was zero invested in the fund. For fiscal 2010 we recorded a gain of $0.6 million, and for fiscal 2009 we recorded a loss of $1.2 million.
Income Taxes — Expense/(Benefit). Income taxes — expense/(benefit) decreased by $7.7 million to a benefit of $6.0
million for fiscal 2010, compared to an expense of $1.7 million for fiscal 2009. The $6.0 million for fiscal 2010, includes taxes on foreign profits of $0.5 million, book to income tax return expense adjustments of $2.9 million and other expense of $1.7 million. In addition, a benefit of $3.2 million was recorded due to the settlement of uncertain tax positions and related interest from prior periods. For fiscal 2010, we had a loss before income taxes in our U.S.-based businesses. Therefore, we recorded a tax carry-back benefit of $7.9 million in fiscal 2010. The effective tax rates for both the fiscal 2010 and 2009 periods reflect utilization of foreign investment tax credits and the effect of lower tax rates on income of the Company’s foreign operations and a higher percentage of earnings at those foreign operations.
Net Income/(Loss) Attributable to Methode Electronics, Inc. Net income/(loss) attributable to Methode Electronics, Inc. increased $126.2 million to net income of $13.7 million for fiscal 2010, compared to a net loss of $112.5 million for fiscal 2009, primarily due to zero goodwill and other asset write-offs for fiscal 2010 versus $94.4 million in write-offs for fiscal 2009. Income taxes were favorable by $7.7 million in fiscal 2010 compared to fiscal 2009, related to a tax loss carry-back for our U.S.-based businesses. In addition, restructuring charges, amortization expense and other expense were lower, and we had lower overall manufacturing costs due to restructuring efforts. In addition, fiscal 2010 selling and administrative expenses were higher due to the Delphi supply agreement and patent litigation.
23

Operating Segments Automotive Segment Results Below is a table summarizing results for the years ended:(in millions)("N/M" equals not meaningful)
Net sales
Cost of products sold
Gross margins (including other income)
RestructuringImpairment of goodwill and other assetsSelling and administrative expensesIncome/(loss) from operations
Percent of sales:Net salesCost of products soldGross margins (including other income)RestructuringImpairment of goodwill and other assetsSelling and administrative expensesIncome/(loss) from operations
May 1,2010
$ 203.2
166.7
36.5
5.6—
19.6$ 11.3
May 1,2010
100.0%82.0%18.0%2.8%—%9.6%5.6%
May 2,2009
$ 246.1
206.0
40.1
19.330.514.6
$ (24.3)
May 2,2009
100.0 %83.7 %16.3 %7.8 %
12.4 %5.9 %
(9.9)%
Net Change
$ (42.9)
(39.3)
(3.6)
(13.7)(30.5)
5.0$ 35.6
Net Change
(17.4)%
(19.1)%
(9.0)%
(71.0)%N/M
34.2 %N/M
Net Sales. Automotive segment net sales decreased $42.9 million, or 17.4%, to $203.2 million for fiscal 2010 from
$246.1 million for fiscal 2009. Net sales to Delphi Corporation decreased $27.1 million, or 65.8%, to $14.1 million for fiscal 2010 compared to $41.2 million for fiscal 2009 due to the cancellation of the supply agreement on September 10, 2009. The Automotive segment net sales were also negatively impacted by planned lower Chrysler sales volumes of $1.0 million for fiscal 2010, compared to $14.8 million for fiscal 2009. In addition, the decline is attributable to the softness of the U.S. economic environment. Net sales declined by 60.2% in North America and increased by 19.8% and 154.2% in Europe and Asia, respectively for fiscal 2010 compared to fiscal 2009. Included in net sales is other income, which consisted primarily of earnings from engineering design fees and royalties. Other income increased $1.4 million, or 56.0%, to $3.9 million for fiscal 2010, from $2.5 million for fiscal 2009. The increase relates to engineering design fees in our European automotive business. Translation of foreign operations net sales for fiscal 2010 increased reported net sales by $1.0 million, or 0.5%, due to currency rate fluctuations.
Cost of Products Sold. Automotive segment cost of products sold decreased $39.3 million, or 19.1%, to $166.7 million for fiscal 2010 from $206.0 million for fiscal 2009. The decrease primarily relates to lower sales volumes. Included in the cost of products sold for fiscal 2010 is $0.7 million of asset write-downs relating to the termination of the Delphi supply agreement. The Automotive segment cost of products sold as a percentage of sales were 82.0% for fiscal 2010, compared to 83.7% for fiscal 2009. The decrease relates to restructuring and consolidation efforts in previous periods, partially offset by inefficiencies caused by automotive manufacturers extending plant shut-downs during the first quarter of fiscal 2010.
Gross Margins. Automotive segment gross margins decreased $3.6 million, or 9.0%, to $36.5 million for fiscal 2010, compared to $40.1 million for fiscal 2009. Gross margins as a percentage of net sales increased to 18.0% for fiscal 2010 from 16.3% for fiscal 2009. The increase relates to higher other income for fiscal 2010 as well as restructuring and consolidation efforts that occurred in prior periods, partially offset by inefficiencies caused by automotive manufacturers extending plant shut-downs during the first quarter of fiscal 2010.
24

Restructuring. During fiscal 2010, we recorded a restructuring charge of $3.3 million related to our March 2009
restructuring initiative, which consisted of $2.7 million for employee severance and $0.6 million relating to other costs. During fiscal 2009, we recorded a restructuring charge of $6.5 million, which consisted of $1.0 million for impairment and accelerated depreciation for buildings and improvements and machinery and equipment and $5.4 million for customer funded tooling and $0.1 million in forfeited security deposits related to the cancellation of the new GM business. All of the restructuring actions related to the March 2009 restructuring initiatives are now complete.
During fiscal 2010, the Automotive segment recorded a restructuring charge of $2.3 million for our January 2008 restructuring initiative, which consisted of $0.7 million for employee severance, $1.4 million for the impairment and accelerated depreciation for machinery and equipment and $0.2 million in other costs. During fiscal 2009, we recorded a restructuring charge of $12.8 million, which consisted of $4.7 million for employee severance, $7.4 million for impairment and accelerated depreciation for buildings, building improvements and machinery and equipment and $0.7 million for other costs. All of the restructuring actions related to the January 2008 restructuring initiatives are now complete.
Impairment of Goodwill and Other Assets. During the third quarter of fiscal 2009, in accordance with ASC No. 350, “Intangibles - Goodwill and Other,” we performed goodwill impairment testing and concluded that goodwill was impaired. Therefore, during fiscal 2009, we recorded a goodwill impairment charge of $30.5 million in our Automotive segment related to these assets.
Selling and Administrative Expenses. Selling and administrative expenses increased $5.0 million, or 34.2%, to $19.6 million for fiscal 2010 compared to $14.6 million for fiscal 2009. Selling and administrative expenses increased in fiscal 2010 due to $5.8 million of legal fees associated with the Delphi supply agreement termination and patent litigation, partially offset by restructuring and consolidation efforts. Selling and administrative expenses as a percentage of net sales were 9.6% for fiscal 2010 and 5.9% for fiscal 2009.
Income/(Loss) From Operations. Automotive segment income/(loss) from operations increased $35.6 million to income of $11.3 million for fiscal 2010 compared to a loss of $24.3 million for fiscal 2009 due to zero goodwill and intangible asset write-off for fiscal 2010 versus $30.5 million in write-offs for fiscal 2009, lower restructuring expenses, lower costs relating to prior restructuring and consolidation efforts, offset by lower sales and gross margins (including other income) and legal fees relating to the termination of the Delphi supply agreement.
25

Interconnect Segment Results Below is a table summarizing results for the years ended:(in millions)("N/M" equals not meaningful)
Net sales
Cost of products sold
Gross margins
RestructuringImpairment of goodwill and other assetsSelling and administrative expensesIncome/(loss) from operations
Percent of sales:Net salesCost of products soldGross marginsRestructuringImpairment of goodwill and other assetsSelling and administrative expensesIncome/(loss) from operations
May 1,2010
$ 124.2
88.6
35.6
1.6—
23.0$ 11.0
May 1,2010
100.0%71.3%28.7%1.3%—%
18.5%8.9%
May 2,2009
$ 131.2
99.7
31.5
5.556.931.0
$ (61.9)
May 2,2009
100.0 %76.0 %24.0 %4.2 %
43.4 %23.6 %
(47.2)%
Net Change
$ (7.0)
(11.1)
4.1
(3.9)(56.9)(8.0)
$ 72.9
Net Change
(5.3)%
(11.1)%
13.0 %
(70.9)%N/M
(25.8)%N/M
Net Sales. Interconnect segment net sales decreased $7.0 million, or 5.3%, to $124.2 million for fiscal 2010 from
$131.2 million for fiscal 2009. Net sales were favorably impacted by the Hetronic acquisition on September 30, 2008. European net sales increased 21.7% and North American and Asia declined 5.1% and 28.2%, respectively for fiscal 2010 as compared to fiscal 2009. The net sales decline in North America and Asia was primarily due to the restructuring of our legacy Interconnect segment businesses, which included exiting certain businesses during the fourth quarter of fiscal 2008 and the first quarter of fiscal 2009. There was no impact to net sales for fiscal 2010 compared to fiscal 2009 due to currency rate fluctuations.
Cost of Products Sold. Interconnect segment cost of products sold decreased $11.1 million, or 11.1%, to $88.6 million for fiscal 2010 compared to $99.7 million for fiscal 2009. Interconnect segment cost of products sold as a percentage of net sales decreased to 71.3% for fiscal 2010 compared to 76.0% for fiscal 2009. The decrease in cost of products sold as a percentage of net sales primarily relates to restructuring efforts undertaken in previous periods, partially offset by lower sales volumes in fiscal 2010 as compared to fiscal 2009.
Gross Margins. Interconnect segment gross margins increased $4.1 million, or 13.0%, to $35.6 million for fiscal 2010 as compared to $31.5 million for fiscal 2009. Gross margins as a percentage of net sales increased to 28.7% for fiscal 2010 from 24.0% for fiscal 2009. The increase in gross margins (including other income) as a percentage of net sales primarily relates to restructuring efforts undertaken in previous periods, partially offset by lower sales volumes for fiscal 2010 compared to fiscal 2009.
Restructuring. During fiscal 2010, the Interconnect segment recorded a restructuring charge of $1.4 million related to our March 2009 restructuring initiative, which consisted of $0.7 million for employee severance and $0.7 million for other costs. During fiscal 2009, we recorded a restructuring charge of $0.3 million, which consisted of $0.1 million for employee severance and $0.2 million relating to professional fees. All of the restructuring actions related to the March 2009 restructuring initiatives are now complete.
26

During fiscal 2010, the Interconnect segment recorded a restructuring charge of $0.2 million related to our January 2008 restructuring initiative, which consisted of $0.2 million in accelerated depreciation. During fiscal 2009, we recorded a restructuring charge of $5.2 million, which consisted of $1.4 million for employee severance, $3.4 million for impairment and accelerated depreciation for buildings, building improvements and machinery and equipment, $0.2 million for inventory write-downs and $0.2 million relating to other costs.
Impairment of Goodwill and Other Assets. During the third quarter of fiscal 2009, in accordance with ASC No. 350,
“Intangibles - Goodwill and Other,” we performed goodwill impairment testing and concluded that goodwill was impaired. Therefore, during fiscal 2009, we recorded a goodwill impairment charge of $30.8 million in our Interconnect segment related to these assets.
Also during fiscal 2009, in accordance with ASC No. 360, “Property, Plant and Equipment,” it was determined that
certain identifiable assets of our Interconnect businesses were impaired. Therefore, during fiscal 2009, we recorded an impairment charge of $26.1 million for these assets.
Selling and Administrative Expenses. Selling and administrative expenses decreased $8.0 million, or 25.8%, to $23.0
million for fiscal 2010 compared to $31.0 million for fiscal 2009. Selling and administrative expenses are lower due to reduced intangible asset amortization expenses, partially offset by higher selling and administrative expenses due to the Hetronic acquisition. In addition, selling and administrative expenses (not including Hetronic) were lower due to the restructuring efforts undertaken in the first and second quarters of fiscal 2009. Selling and administrative expenses as a percentage of net sales decreased to 18.5% for fiscal 2010 from 23.6% for fiscal 2009.
Income/(Loss) From Operations. Interconnect segment income/(loss) from operations increased $72.9 million to income of $11.0 million for fiscal 2010 compared to a loss of $61.9 million for fiscal 2009 due to zero goodwill and intangible asset write-off for fiscal 2010 versus $56.9 million in write-offs for fiscal 2009. In addition, income/(loss) from operations increased due to lower intangible asset amortization expenses, lower selling and administrative expenses due to prior restructuring efforts, lower restructuring expenses, partially offset by lower sales and gross margins.
27

Power Products Segment Results Below is a table summarizing results for the years ended:(in millions)("N/M" equals not meaningful)
Net sales
Cost of products sold
Gross margins
RestructuringImpairment of goodwill and other assetsSelling and administrative expensesIncome/(loss) from operations
Percent of sales:Net salesCost of products soldGross marginsRestructuringImpairment of goodwill and other assetsSelling and administrative expensesIncome/(loss) from operations
May 1,2010
$ 40.5
30.0
10.5
0.6—6.5
$ 3.4
May 1,2010
100.0%74.1%25.9%1.5%—%
16.0%8.4%
May 2,2009
$ 42.7
37.2
5.5
0.55.45.1
$ (5.5)
May 2,2009
100.0 %87.1 %12.9 %1.2 %
12.6 %11.9 %
(12.9)%
Net Change
$ (2.2)
(7.2)
5.0
0.1(5.4)1.4
$ 8.9
Net Change
(5.2)%
(19.4)%
90.9 %
20.0 %N/M
27.5 %N/M
Net Sales. Power Products segment net sales decreased $2.2 million, or 5.2% to $40.5 million for fiscal 2010
compared to $42.7 million for fiscal 2009. Net sales declined in fiscal 2010 as compared to fiscal 2009 by 9.8% in North America and increased by 14.1% in Asia. The overall decline was driven by lower demand for our flexible cabling and heat sink products in the U.S.
Cost of Products Sold. Power Products segment cost of products sold decreased $7.2 million, or 19.4%, to $30.0 million for fiscal 2010 compared to $37.2 million for fiscal 2009. The Power Products segment cost of products sold as a percentage of sales decreased to 74.1% for fiscal 2010 from 87.1% for fiscal 2009. The decrease is due to restructuring and consolidation efforts for our Power Products businesses in the U.S. during the fourth quarter of fiscal 2009 and the first quarter of fiscal 2010.
Gross Margins. Power Products segment gross margins increased $5.0 million, or 90.9%, to $10.5 million for fiscal 2010, compared to $5.5 million for fiscal 2009. Gross margins as a percentage of net sales increased to 25.9% for fiscal 2010 from 12.9% for fiscal 2009. The increase is due to restructuring and consolidation efforts for our Power Products businesses in the U.S. during the fourth quarter of fiscal 2009 and the first quarter of fiscal 2010.
Restructuring. During fiscal 2010, the Power Products segment recorded a restructuring charge of $0.6 million
related to our March 2009 restructuring initiative, which consisted of $0.1 million for employee severance and $0.5 million relating to real estate taxes and other facility related costs. During fiscal 2009, we recorded a restructuring charge of $0.5 million, which consisted of $0.4 million for impairment and accelerated depreciation for buildings and improvements and machinery and equipment and $0.1 million relating to other costs. All of the restructuring actions related to the March 2009 restructuring initiative are now complete.
Impairment of Goodwill and Other Assets. During fiscal 2009, in accordance with ASC No. 350, “Intangibles - Goodwill and Other,” we performed goodwill impairment testing and concluded that goodwill was impaired. Therefore, during fiscal 2009, we recorded a goodwill impairment charge of $5.4 million in our Power Products segment related to these assets.
28
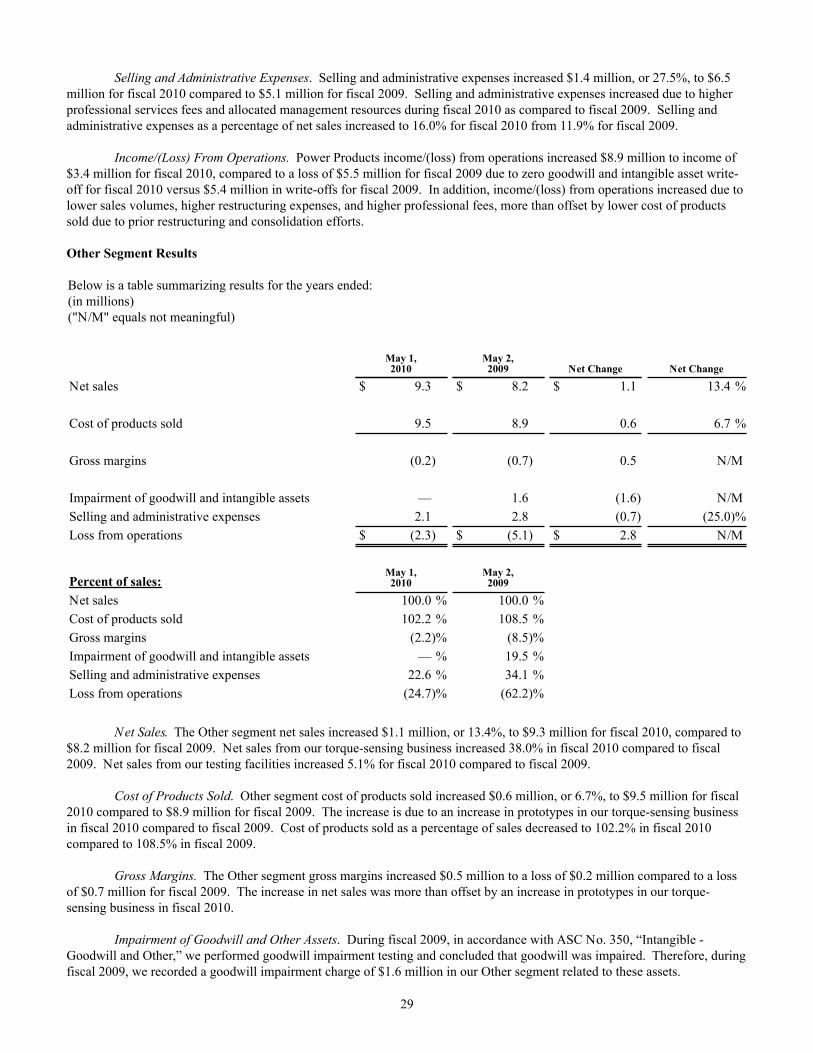
Selling and Administrative Expenses. Selling and administrative expenses increased $1.4 million, or 27.5%, to $6.5
million for fiscal 2010 compared to $5.1 million for fiscal 2009. Selling and administrative expenses increased due to higher professional services fees and allocated management resources during fiscal 2010 as compared to fiscal 2009. Selling and administrative expenses as a percentage of net sales increased to 16.0% for fiscal 2010 from 11.9% for fiscal 2009.
Income/(Loss) From Operations. Power Products income/(loss) from operations increased $8.9 million to income of $3.4 million for fiscal 2010, compared to a loss of $5.5 million for fiscal 2009 due to zero goodwill and intangible asset write-off for fiscal 2010 versus $5.4 million in write-offs for fiscal 2009. In addition, income/(loss) from operations increased due to lower sales volumes, higher restructuring expenses, and higher professional fees, more than offset by lower cost of products sold due to prior restructuring and consolidation efforts.
Other Segment Results Below is a table summarizing results for the years ended:(in millions)("N/M" equals not meaningful)
Net sales
Cost of products sold
Gross margins
Impairment of goodwill and intangible assetsSelling and administrative expensesLoss from operations
Percent of sales:Net salesCost of products soldGross marginsImpairment of goodwill and intangible assetsSelling and administrative expensesLoss from operations
May 1,2010
$ 9.3
9.5
(0.2)
—2.1
$ (2.3)
May 1,2010
100.0 %102.2 %
(2.2)%— %
22.6 %(24.7)%
May 2,2009
$ 8.2
8.9
(0.7)
1.62.8
$ (5.1)
May 2,2009
100.0 %108.5 %
(8.5)%19.5 %34.1 %
(62.2)%
Net Change
$ 1.1
0.6
0.5
(1.6)(0.7)
$ 2.8
Net Change
13.4 %
6.7 %
N/M
N/M(25.0)%
N/M
Net Sales. The Other segment net sales increased $1.1 million, or 13.4%, to $9.3 million for fiscal 2010, compared to
$8.2 million for fiscal 2009. Net sales from our torque-sensing business increased 38.0% in fiscal 2010 compared to fiscal 2009. Net sales from our testing facilities increased 5.1% for fiscal 2010 compared to fiscal 2009.
Cost of Products Sold. Other segment cost of products sold increased $0.6 million, or 6.7%, to $9.5 million for fiscal 2010 compared to $8.9 million for fiscal 2009. The increase is due to an increase in prototypes in our torque-sensing business in fiscal 2010 compared to fiscal 2009. Cost of products sold as a percentage of sales decreased to 102.2% in fiscal 2010 compared to 108.5% in fiscal 2009.
Gross Margins. The Other segment gross margins increased $0.5 million to a loss of $0.2 million compared to a loss of $0.7 million for fiscal 2009. The increase in net sales was more than offset by an increase in prototypes in our torque-sensing business in fiscal 2010.
Impairment of Goodwill and Other Assets. During fiscal 2009, in accordance with ASC No. 350, “Intangible - Goodwill and Other,” we performed goodwill impairment testing and concluded that goodwill was impaired. Therefore, during fiscal 2009, we recorded a goodwill impairment charge of $1.6 million in our Other segment related to these assets.
29

Selling and Administrative Expenses. Selling and administrative expenses decreased $0.7 million, or 25.0%, to $2.1
million for fiscal 2010, compared to $2.8 million for fiscal 2009. Selling and administrative expenses as a percentage of net sales decreased to 22.6% for fiscal 2010 from 34.1% for fiscal 2009.
Loss From Operations. The Other segment loss from operations decreased $2.8 million to $2.3 million for fiscal 2010, compared to $5.1 million for fiscal 2009 due to zero goodwill and intangible asset write-off for fiscal 2010 versus $1.6 million in write-offs for fiscal 2009. In addition, the loss before income taxes decreased due to higher net sales and gross margins, as well as lower selling and administrative expenses.
Financial Condition, Liquidity and Capital Resources
We believe our current world-wide cash balances together with expected future cash flows to be generated from operations will be sufficient to support current operations. However, due to the shifting of operations from the U.S. to foreign locations, a significant amount of cash and expected future cash flows are located outside of the U.S. No provision has been made, except for our Ireland business, for income taxes on undistributed net income of foreign operations, as we currently expect them to be indefinitely reinvested in our foreign operations. However, if we change our position and the cash is distributed back to the U.S., it may have an adverse affect on our U.S. federal and state taxes, by lowering our net operating loss positions or potentially creating a tax liability.
During fiscal 2011, we were awarded a next generation center stack program for multiple GM vehicle platforms as well as transmission lead-frame assemblies for GM transmissions. Both programs are expected to be manufactured in our plant in Monterrey, Mexico. We anticipate that these programs will require a significant amount of cash for the purchase of equipment, tooling and initial inventory as well as additional staffing for the development and launching of the programs. We expect to begin production and generate sales on these programs in fiscal 2013. Therefore, we anticipate our cash balances may decline due to the launching of these programs without a corresponding increase in sales.
We had an agreement with our primary bank for a revolving credit facility to provide up to $75.0 million of ready financing for general corporate purposes, including acquisition opportunities that may become available. The bank credit agreement, which was scheduled to expire on February 28, 2011, required maintenance of certain financial ratios and a minimum net worth level.
On February 25, 2011, we entered into an Amended and Restated Credit Agreement with Bank of America, N.A., as administrative agent, and certain other financial institutions, which amends and restates our previous credit facility and extends the maturity to February 25, 2016. The new credit facility is in the aggregate principal amount of $75.0 million, with an option to increase the principal amount by an additional $25.0 million subject to customary conditions and approval of the lender(s) providing new commitment(s). The new credit facility provides for variable rates of interest based on the type of borrowing and the Company's debt to EBITDA financial ratio. The Amended and Restated Credit Agreement is guaranteed by certain of our U.S. subsidiaries. At April 30, 2011, we were in compliance with the covenants of the agreement. During fiscal 2011, we had borrowings of $18.0 million and payments of $18.1 million, under this credit facility. As of April 30, 2011, there were no outstanding balances due against the credit facility.
During fiscal 2009 and the first half of fiscal 2010, we were invested in an enhanced cash fund sold as an alternative to traditional money-market funds. We had historically invested a portion of our on hand cash balances in this fund. These investments are subject to credit, liquidity, market and interest rate risk. In December 2007, the fund was overwhelmed with withdrawal requests from investors and was closed with a restriction placed upon the cash redemption ability of its holders. In September 2009, we received the remaining principal in the fund. The balance in the fund as of May 1, 2010 was zero. For fiscal 2010, we recorded a gain of $0.6 million and for fiscal 2009, we recorded a loss of $1.2 million.
30
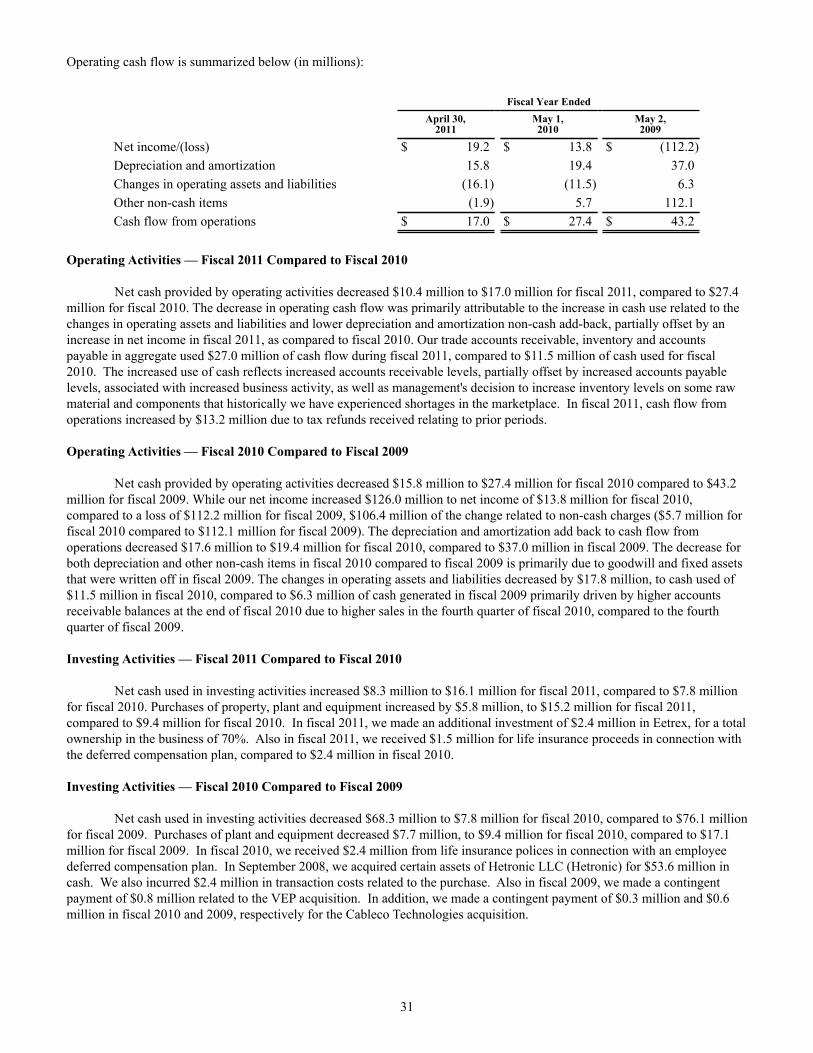
Operating cash flow is summarized below (in millions):
Net income/(loss)Depreciation and amortizationChanges in operating assets and liabilitiesOther non-cash itemsCash flow from operations
Fiscal Year EndedApril 30,
2011
$ 19.215.8
(16.1)(1.9)
$ 17.0
May 1,2010
$ 13.819.4
(11.5)5.7
$ 27.4
May 2,2009
$ (112.2)37.06.3
112.1$ 43.2
Operating Activities — Fiscal 2011 Compared to Fiscal 2010 Net cash provided by operating activities decreased $10.4 million to $17.0 million for fiscal 2011, compared to $27.4 million for fiscal 2010. The decrease in operating cash flow was primarily attributable to the increase in cash use related to the changes in operating assets and liabilities and lower depreciation and amortization non-cash add-back, partially offset by an increase in net income in fiscal 2011, as compared to fiscal 2010. Our trade accounts receivable, inventory and accounts payable in aggregate used $27.0 million of cash flow during fiscal 2011, compared to $11.5 million of cash used for fiscal 2010. The increased use of cash reflects increased accounts receivable levels, partially offset by increased accounts payable levels, associated with increased business activity, as well as management's decision to increase inventory levels on some raw material and components that historically we have experienced shortages in the marketplace. In fiscal 2011, cash flow from operations increased by $13.2 million due to tax refunds received relating to prior periods.
Operating Activities — Fiscal 2010 Compared to Fiscal 2009
Net cash provided by operating activities decreased $15.8 million to $27.4 million for fiscal 2010 compared to $43.2 million for fiscal 2009. While our net income increased $126.0 million to net income of $13.8 million for fiscal 2010, compared to a loss of $112.2 million for fiscal 2009, $106.4 million of the change related to non-cash charges ($5.7 million for fiscal 2010 compared to $112.1 million for fiscal 2009). The depreciation and amortization add back to cash flow from operations decreased $17.6 million to $19.4 million for fiscal 2010, compared to $37.0 million in fiscal 2009. The decrease for both depreciation and other non-cash items in fiscal 2010 compared to fiscal 2009 is primarily due to goodwill and fixed assets that were written off in fiscal 2009. The changes in operating assets and liabilities decreased by $17.8 million, to cash used of $11.5 million in fiscal 2010, compared to $6.3 million of cash generated in fiscal 2009 primarily driven by higher accounts receivable balances at the end of fiscal 2010 due to higher sales in the fourth quarter of fiscal 2010, compared to the fourth quarter of fiscal 2009.
Investing Activities — Fiscal 2011 Compared to Fiscal 2010 Net cash used in investing activities increased $8.3 million to $16.1 million for fiscal 2011, compared to $7.8 million for fiscal 2010. Purchases of property, plant and equipment increased by $5.8 million, to $15.2 million for fiscal 2011, compared to $9.4 million for fiscal 2010. In fiscal 2011, we made an additional investment of $2.4 million in Eetrex, for a total ownership in the business of 70%. Also in fiscal 2011, we received $1.5 million for life insurance proceeds in connection with the deferred compensation plan, compared to $2.4 million in fiscal 2010.
Investing Activities — Fiscal 2010 Compared to Fiscal 2009
Net cash used in investing activities decreased $68.3 million to $7.8 million for fiscal 2010, compared to $76.1 million for fiscal 2009. Purchases of plant and equipment decreased $7.7 million, to $9.4 million for fiscal 2010, compared to $17.1 million for fiscal 2009. In fiscal 2010, we received $2.4 million from life insurance polices in connection with an employee deferred compensation plan. In September 2008, we acquired certain assets of Hetronic LLC (Hetronic) for $53.6 million in cash. We also incurred $2.4 million in transaction costs related to the purchase. Also in fiscal 2009, we made a contingent payment of $0.8 million related to the VEP acquisition. In addition, we made a contingent payment of $0.3 million and $0.6 million in fiscal 2010 and 2009, respectively for the Cableco Technologies acquisition.
31

Financing Activities — Fiscal 2011 Compared to Fiscal 2010 Net cash used for financing activities decreased $1.0 million to $9.3 million for fiscal 2011, compared to $10.3 million for fiscal 2010. We paid dividends of $10.3 million and $10.4 million for fiscal 2011 and 2010, respectively. In addition, fiscal 2011 included $1.0 million of proceeds for the exercise of stock options, compared to $0.2 million for fiscal 2010.
Financing Activities — Fiscal 2010 Compared to Fiscal 2009
Net cash used in financing activities was $10.3 million for fiscal 2010, compared to $15.1 million for fiscal 2009. We paid cash dividends of $10.4 million in fiscal 2010, compared to $9.8 million in fiscal 2009. In fiscal 2009, we purchased 669,480 shares for $5.3 million pursuant to our stock repurchase plan. There were no shares purchased in fiscal 2010 and the plan has terminated. Contractual Obligations
The following table summarizes contractual obligations and commitments, as of April 30, 2011 (in thousands):
Operating leasesPurchase obligationsDeferred compensation
Total
Payments Due By Period
Total
$ 6,48851,3004,910
$ 62,698
Less than 1 year
$ 2,48051,300
344$ 54,124
1-3 years
$ 3,098—
1,331$ 4,429
4-5 years
$ 910—
293$ 1,203
More than 5 years
$ ——
2,942$ 2,942
Off-Balance Sheet Arrangements
We do not have any off-balance sheet arrangements, other than the operating leases and purchase obligations noted in the preceding table.
Critical Accounting Policies and Estimates
Management’s discussion and analysis of financial condition and results of operations is based upon our consolidated financial statements, which have been prepared in accordance with accounting principles generally accepted in the United States. The preparation of these financial statements requires us to make estimates and judgments that affect the reported amounts of assets, liabilities, revenues and expenses and related disclosure of contingent assets and liabilities. Actual results may differ from these estimates under different assumptions or conditions; however, we do not believe that it is reasonably likely that changes will occur. We believe the following critical accounting policies affect our more significant judgments and estimates used in the preparation of our consolidated financial statements.
Revenue Recognition. We recognize revenue on product sales when (i) persuasive evidence of an agreement exists,
(ii) the price is fixed or determinable, (iii) delivery has occurred or services have been rendered, and (iv) collection of the sales proceeds is reasonably assured. Revenue from our product sales not requiring installation, net of trade discounts and estimated sales allowances, is recognized when title passes, which is generally upon shipment. We do not have any additional obligations or customer acceptance provisions after shipment of such products. We handle returns by replacing, repairing or issuing credit for defective products when returned. Revenue from cabling infrastructure systems installations is recognized when the installation is completed, tested and accepted by the customer.
Allowance for Doubtful Accounts. We maintain an allowance for doubtful accounts for estimated losses resulting from
the inability of customers to make required payments. The amount of the allowance is based on the age of unpaid amounts, information about the creditworthiness of customers, and other relevant information. Estimates of uncollectible amounts are revised each period, and changes are recorded in the period they become known. If the financial condition of our customers were to deteriorate, resulting in an impairment of their ability to make payments, additional allowances may be required.
In addition, our revenues and accounts receivable are concentrated in a relatively small number of customers. A
significant change in the liquidity or financial position of any one of these customers or a deterioration in the economic
32

environment or automotive industry, in general, could have a material adverse impact on the collectability of our accounts receivable and our future operating results, and additional allowances for doubtful accounts.
Allowance for Excess and Obsolete Inventory. Inventories are valued at the lower of cost or market value and have
been reduced by allowances for excess and obsolete inventories. The estimated allowances are based on our review of inventories on hand compared to estimated future usage and sales, using assumptions about future product life cycles, product demand and market conditions. If actual product life cycles, product demand and market conditions are less favorable than those projected by us, additional inventory write-downs may be required.
Intangible Assets. We have significant intangible assets related to goodwill and other acquired intangibles. The determination of related estimated useful lives and whether these assets are impaired involves significant judgment. In assessing the recoverability of our intangibles, we must make assumptions regarding estimated future cash flows and other factors to determine the fair value of the respective assets. If these estimates or their related assumptions change in the future, we may be required to record impairment charges for these assets. In accordance with ASC No. 350, “Goodwill and Other Assets,” on May 1, 2002, we ceased amortizing goodwill. In lieu of amortization, we are required to perform an annual impairment review (see Note 4 to the Consolidated Financial Statements).
Income Taxes. As part of the process of preparing our Consolidated Financial Statements, we are required to estimate
income taxes in each of the jurisdictions in which we operate. The process involves estimating actual current tax expense along with assessing temporary differences resulting from differing treatment of items for book and tax purposes. These temporary differences result in deferred tax assets and liabilities, which are included in our consolidated balance sheet. We record a valuation allowance to reduce our deferred tax assets to the amount that is more likely than not to be realized. We have considered future taxable income and ongoing tax planning strategies in assessing the need for the valuation allowance. The tax laws of Malta provide for investment tax credits of 50% of certain qualified expenditures. Unused credits can be carried forward indefinitely. We have accumulated investment tax credits in excess of amounts more likely than not to be realized based upon projections of taxable income to be generated within a reasonable time period. Valuation allowances have been provided for this excess.
Contingencies. We are subject to various investigations, claims, legal and administrative proceedings covering a wide
range of matters that arise in the ordinary course of business activities. A significant amount of judgment and use of estimates is required to quantify our ultimate exposure in these matters. For those matters that we can estimate a range of loss, we have established reserves at levels within that range to provide for the most likely scenario based upon available information. The valuation of reserves for contingencies is reviewed on a quarterly basis to assure that the Company is properly reserved. Reserve balances are adjusted to account for changes in circumstances for ongoing issues and the establishment of additional reserves for emerging issues. While we believe that the current level of reserves is adequate, changes in the future could impact these determinations. Item 7A. Quantitative and Qualitative Disclosures About Market Risk
Certain of our foreign operations enter into transactions in currencies other than their functional currency, primarily the U.S. dollar and the Euro. A 10% change in foreign currency exchange rates from balance sheet date levels could impact our income before income taxes by $3.8 million and $4.7 million at April 30, 2011 and May 1, 2010, respectively. We also have foreign currency exposure arising from the translation of our net equity investment in our foreign operations to U.S. dollars. We generally view our investments in foreign operations with functional currencies other than the U.S. dollar as long-term. The currencies to which we are exposed are the British pound, Chinese yuan, Indian rupee, Mexican peso, Singapore dollar and Swiss Franc. A 10% change in foreign currency exchange rates from balance sheet date levels could impact our net foreign investments by $17.9 million at April 30, 2011 and $12.8 million at May 1, 2010.
Item 8. Financial Statements and Supplementary Data
See Item 15 for an Index to Financial Statements and Financial Statement Schedule. Such Financial Statements and Schedule are incorporated herein by reference. Item 9A. Controls and Procedures Evaluation of Disclosure Controls and Procedures
As of the end of the period covered by this annual report on Form 10-K, we performed an evaluation under the supervision and with the participation of our management, including our Chief Executive Officer and our Chief Financial
33

Officer, of our “disclosure controls and procedures” (as defined in Rules 13a-15(e) and 15d-15(e) of the Securities Exchange Act of 1934 (the “Exchange Act”)). Our disclosure controls and procedures are designed to ensure that the information required to be disclosed by us in the reports that we file or submit under the Exchange Act is recorded, processed, summarized and reported within the time periods specified in the Securities and Exchange Commission’s applicable rules and forms. As a result of this evaluation, our Chief Executive Officer and Chief Financial Officer have concluded that, as of the end of the period covered by this report, our disclosure controls and procedures were effective. Management’s Report on Internal Control over Financial Reporting
Our management is responsible for establishing and maintaining adequate internal control over financial reporting, as such term is defined in Exchange Act Rules 13a-15(f) and 15d-15(f). Under the supervision and with the participation of our management, including our Chief Executive Officer and Chief Financial Officer, we conducted an evaluation of the effectiveness of our internal control over financial reporting as of April 30, 2011 based on the guidelines established in Internal Control — Integrated Framework issued by the Committee of Sponsoring Organizations of the Treadway Commission (COSO). Our internal control over financial reporting includes policies and procedures that provide reasonable assurance regarding the reliability of financial reporting and the preparation of financial statements for external reporting purposes in accordance with U.S. generally accepted accounting principles.
Based on the results of our evaluation, our management concluded that our internal control over financial reporting
was effective as of April 30, 2011. Management reviewed the results of its assessment with the Audit Committee. Our independent registered public accounting firm, Ernst and Young LLP, has issued an attestation report on our internal control over financial reporting. This report is included on page F-2 of this report on Form 10-K.
Changes in Internal Control over Financial Reporting
There were no changes in our internal control over financial reporting identified in connection with the evaluation required by paragraph (d) of Exchange Act Rules 13a-15 or 15d-15 that was conducted during the last fiscal quarter that have materially affected, or are reasonably likely to materially affect, our internal control over financial reporting.
Inherent Limitations on Effectiveness of Controls
Our management, including our Chief Executive Officer and Chief Financial Officer, do not expect that our disclosure controls or our internal control over financial reporting will prevent all errors and all fraud. A control system, no matter how well conceived and operated, can provide only reasonable, not absolute, assurance that the objectives of the control system are met. Further, the design of a control system must reflect the fact that there are resource constraints, and the benefits of controls must be considered relative to their costs. Because of the inherent limitations in all control systems, no evaluation of controls can provide absolute assurance that all control issues and instances of fraud, if any, within the Company have been detected. These inherent limitations include the realities that judgments in decision-making can be faulty, and that breakdowns can occur because of a simple error or mistake. Additionally, controls can be circumvented by the individual acts of some persons, by collusion of two or more people or by a management override of the controls. The design of any system of controls also is based in part upon certain assumptions about the likelihood of future events, and there can be no assurance that any design will succeed in achieving its stated goals under all potential future conditions; over time, controls may become inadequate because of changes in conditions, or the degree of compliance with policies or procedures may deteriorate. Because of the inherent limitations in a cost-effective control system, misstatements due to error or fraud may occur and not be detected.
34

PART III
Item 10. Directors, Executive Officers and Corporate Governance
Information regarding our directors will be included under the captions “Proposal One: Election of Directors” and “Corporate Governance” in the definitive proxy statement for our 2011 annual meeting to be held on September 15, 2011, and is incorporated herein by reference. Information regarding our executive officers is included under a separate caption in Part I hereof, and is incorporated herein by reference, in accordance with General Instruction G(3) to Form 10-K and Instruction 3 to Item 401(b) of Regulation S-K. Information regarding compliance with Section 16(a) of the Exchange Act and information regarding our Audit Committee will be included under the captions “Section 16(a) Beneficial Ownership Reporting Compliance” and “Audit Committee Matters,” respectively, in the definitive proxy statement for our 2011 annual meeting and is incorporated herein by reference.
We have adopted a Code of Business Conduct (the “Code”) that applies to our directors, our principal executive officer, principal financial officer, principal accounting officer or controller and persons performing similar functions, as well as other employees. The Code is publicly available on our website at www.methode.com. If we make any substantive amendments to the Code or grant any waiver, including any implicit waiver, from a provision of the Code to our principal executive officer, principal financial officer, principal accounting officer or controller or persons performing similar functions, we will disclose the nature of such amendment or waiver on our website or in a report on Form 8-K in accordance with applicable rules and regulations. Item 11. Executive Compensation
Information regarding the above will be included under the caption “Compensation Discussion and Analysis,” “Compensation Committee Report,” “Executive Compensation Tables” and “Director Compensation” in the definitive proxy statement for our 2011 annual meeting to be held on September 15, 2011, and is incorporated herein by reference. Item 12. Security Ownership of Certain Beneficial Owners and Management and Related Stockholder Matters
Information regarding the above will be included under the caption “Security Ownership” in the definitive proxy statement for our 2011 annual meeting to be held on September 15, 2011, and is incorporated herein by reference. Item 13. Certain Relationships and Related Transactions, and Director Independence
Information regarding the above will be included under the caption “Corporate Governance” in the definitive proxy statement for our 2011 annual meeting to be held on September 15, 2011, and is incorporated herein by reference. Item 14. Principal Accounting Fees and Services
Information regarding the above will be included under the caption “Audit Committee Matters” in the definitive proxy statement for our 2011 annual meeting to be held on September 15, 2011, and is incorporated herein by reference.
35

PART IV
Item 15. Exhibits and Financial Statement Schedule (a) The documents included in the following indexes are filed as part of this annual report on Form 10-K. (1) (2) The response to this portion of Item 15 is included in this report under the captions “Financial Statements” and “Financial Statement Schedule” below, which is incorporated herein by reference. (3) See “Index to Exhibits” immediately following the financial statement schedule. (b) See “Index to Exhibits” immediately following the financial statement schedule. (c) See “Financial Statements” and “Financial Statement Schedule.”
36

SIGNATURES
Pursuant to the requirements of Section 13 or 15 (d) of the Securities Exchange Act of 1934, the Registrant has duly caused this report to be signed on its behalf by the undersigned, thereunto duly authorized.
METHODE ELECTRONICS, INC.(Registrant) By:Douglas A. KomanChief Financial Officer(Principal Accounting and Financial Officer)
/s/ DOUGLAS A. KOMAN
Dated: June 30, 2011
37

Pursuant to the requirements of the Securities Exchange Act of 1934, this report has been signed below by the following persons on behalf of the Registrant and in the capacities and on the dates indicated.
Signature
/s / WARREN L. BATTSWarren L. Batts /s / CHRISTOPHER J. HORNUNGChristopher J. Hornung
/s/ DONALD W. DUDADonald W. Duda /s / DOUGLAS A. KOMANDouglas A. Koman /s / WALTER J. ASPATOREWalter J. Aspatore /s/ J. EDWARD COLGATEJ. Edward Colgate /s/ DARREN M. DAWSONDarren M. Dawson /s / STEPHEN F. GATESStephen F. Gates
/s / ISABELLE C. GOOSSENIsabelle C. Goossen /s / PAUL G. SHELTONPaul G. Shelton /s / LAWRENCE B. SKATOFFLawrence B. Skatoff
Title
Chairman of the Board
Vice Chairman of the Board
Chief Executive Officer, President & Director(Principal Executive Officer) Chief Financial Officer
Director
Director
Director
Director
Director
Director
Director
Date
June 30, 2011
June 30, 2011
June 30, 2011
June 30, 2011
June 30, 2011
June 30, 2011
June 30, 2011
June 30, 2011
June 30, 2011
June 30, 2011
June 30, 2011
38

METHODE ELECTRONICS, INC. AND SUBSIDIARIES
FORM 10-K
ITEM 15 (a) (1) and (2)
(1)
(2)
Financial Statements The following consolidated financial statements of Methode Electronics, Inc. and subsidiaries areincluded in Item 8: Report of Independent Registered Public Accounting Firm Report of Independent Registered Public Accounting Firm on Internal Control over Financial Reporting Consolidated Balance Sheets — April 30, 2011 and May 1, 2010 Consolidated Statements of Operations — Years Ended April 30, 2011, May 1, 2010 and May 2, 2009 Consolidated Statements of Shareholders’ Equity — Years Ended April 30, 2011, May 1, 2010 andMay 2, 2009 Consolidated Statements of Cash Flows — Years Ended April 30, 2011, May 1, 2010 and May 2, 2009 Notes to Consolidated Financial Statements Financial Statement Schedule Schedule II — Valuation and Qualifying Accounts
F-1
F-2
F-3
F-4
F-5
F-6
F-7
F-33
All other schedules for which provision is made in the applicable accounting regulation of the Securities and
Exchange Commission are not required under the related instructions or are immaterial and, therefore, have been omitted.
39

REPORT OF INDEPENDENT REGISTERED PUBLIC ACCOUNTING FIRM
Board of Directors and ShareholdersMethode Electronics, Inc.
We have audited the accompanying consolidated balance sheets of Methode Electronics, Inc. and subsidiaries as of April 30, 2011 and May 1, 2010, and the related consolidated statements of operations, shareholders’ equity and cash flows for each of the three fiscal years in the period ended April 30, 2011. Our audits also included the financial statement schedule listed in the Index at Item 15(a)(2). These financial statements and schedule are the responsibility of the Company’s management. Our responsibility is to express an opinion on these financial statements and schedule based on our audits.
We conducted our audits in accordance with the standards of the Public Company Accounting Oversight Board (United States). Those standards require that we plan and perform the audit to obtain reasonable assurance about whether the financial statements are free of material misstatement. An audit includes examining, on a test basis, evidence supporting the amounts and disclosures in the financial statements. An audit also includes assessing the accounting principles used and significant estimates made by management, as well as evaluating the overall financial statement presentation. We believe that our audits provide a reasonable basis for our opinion.
In our opinion, the financial statements referred to above present fairly, in all material respects, the consolidated financial position of Methode Electronics, Inc. and subsidiaries at April 30, 2011 and May 1, 2010, and the consolidated results of their operations and their cash flows for each of the three fiscal years in the period ended April 30, 2011, in conformity with U.S. generally accepted accounting principles. Also, in our opinion, the related financial statement schedule, when considered in relation to the basic financial statements taken as a whole, presents fairly in all material respects the information set forth therein.
We also have audited, in accordance with the standards of the Public Company Accounting Oversight Board (United States), Methode Electronics, Inc. and Subsidiaries’ internal control over financial reporting as of April 30, 2011, based on criteria established in Internal Control — Integrated Framework issued by the Committee of Sponsoring Organizations of the Treadway Commission and our report dated June 30, 2011 expressed an unqualified opinion thereon.
Chicago, IllinoisJune 30, 2011
/s/ ERNST & YOUNG LLP
F-1

REPORT OF INDEPENDENT REGISTERED PUBLIC ACCOUNTING FIRM
Board of Directors and ShareholdersMethode Electronics, Inc.
We have audited Methode Electronics, Inc. and Subsidiaries' internal control over financial reporting as of April 30, 2011, based on criteria established in Internal Control—Integrated Framework issued by the Committee of Sponsoring Organizations of the Treadway Commission (the COSO criteria). Methode Electronics, Inc. and Subsidiaries' management is responsible for maintaining effective internal control over financial reporting, and for its assessment of the effectiveness of internal control over financial reporting included in the accompanying Management's Report on Internal Control Over Financial Reporting. Our responsibility is to express an opinion on the company’s internal control over financial reporting based on our audit.
We conducted our audit in accordance with the standards of the Public Company Accounting Oversight Board (United States). Those standards require that we plan and perform the audit to obtain reasonable assurance about whether effective internal control over financial reporting was maintained in all material respects. Our audit included obtaining an understanding of internal control over financial reporting, assessing the risk that a material weakness exists, testing and evaluating the design and operating effectiveness of internal control based on the assessed risk, and performing such other procedures as we considered necessary in the circumstances. We believe that our audit provides a reasonable basis for our opinion.
A company’s internal control over financial reporting is a process designed to provide reasonable assurance regarding
the reliability of financial reporting and the preparation of financial statements for external purposes in accordance with generally accepted accounting principles. A company’s internal control over financial reporting includes those policies and procedures that (1) pertain to the maintenance of records that, in reasonable detail, accurately and fairly reflect the transactions and dispositions of the assets of the company; (2) provide reasonable assurance that transactions are recorded as necessary to permit preparation of financial statements in accordance with generally accepted accounting principles, and that receipts and expenditures of the company are being made only in accordance with authorizations of management and directors of the company; and (3) provide reasonable assurance regarding prevention or timely detection of unauthorized acquisition, use, or disposition of the company’s assets that could have a material effect on the financial statements.
Because of its inherent limitations, internal control over financial reporting may not prevent or detect misstatements.
Also, projections of any evaluation of effectiveness to future periods are subject to the risk that controls may become inadequate because of changes in conditions, or that the degree of compliance with the policies or procedures may deteriorate.
In our opinion, Methode Electronics, Inc. and Subsidiaries maintained, in all material respects, effective internal
control over financial reporting as of April 30, 2011, based on the COSO criteria. We also have audited, in accordance with the standards of the Public Company Accounting Oversight Board (United
States), the consolidated balance sheets of Methode Electronics, Inc. and Subsidiaries as of April 30, 2011 and May 1, 2010, and the related consolidated statements of operations, shareholders’ equity, and cash flows for each of the three fiscal years in the period ended April 30, 2011 and our report dated June 30, 2011 expressed an unqualified opinion thereon.
Chicago, IllinoisJune 30, 2011
/s/ ERNST & YOUNG LLP
F-2

METHODE ELECTRONICS, INC. AND SUBSIDIARIESCONSOLIDATED BALANCE SHEETS
(in thousands, except share data)
ASSETSCURRENT ASSETS
Cash and cash equivalentsAccounts receivable, less allowance (2011 — $1,140; 2010 —$1,102)Inventories:
Finished productsWork in processMaterials
Deferred income taxesPrepaid and refundable income taxesPrepaid expenses and other current assets
TOTAL CURRENT ASSETSPROPERTY, PLANT AND EQUIPMENT
LandBuildings and building improvementsMachinery and equipment
Less allowances for depreciation
OTHER ASSETSGoodwillOther intangibles, less accumulated amortizationCash surrender value of life insuranceDeferred income taxesPre-production costsOther
TOTAL ASSETS
LIABILITIES AND SHAREHOLDERS’ EQUITYCURRENT LIABILITIES
Accounts payableSalaries, wages and payroll taxesOther accrued expensesIncome taxes
TOTAL CURRENT LIABILITIES
OTHER LIABILITIESDEFERRED COMPENSATION
SHAREHOLDERS’ EQUITYCommon stock, $0.50 par value, 100,000,000 shares authorized, 38,312,243 and38,149,946 shares issued as of April 30, 2011 and May 1, 2010, respectivelyAdditional paid-in capitalAccumulated other comprehensive incomeTreasury stock, 1,342,188 as of April 30, 2011 and May 1, 2010Retained earnings
TOTAL METHODE ELECTRONICS, INC. SHAREHOLDERS’ EQUITYNoncontrolling interest
TOTAL EQUITYTOTAL LIABILITIES AND EQUITY
April 30, 2011
$ 57,44588,036
6,27110,98121,30538,5573,778
8517,294
195,961
3,13545,522
249,597298,254236,74361,511
16,42218,42310,0284,456
14,64513,29877,272
$ 334,744
$ 37,1528,364
16,0031,336
62,855
8,1382,607
19,15672,11323,152
(11,377)155,989259,033
2,111261,144
$ 334,744
May 1, 2010
$ 63,82168,649
5,4877,686
16,58729,7602,272
13,9566,138
184,596
3,24049,398
228,112280,750218,87461,876
12,09618,8119,3913,657
11,9848,412
64,351$ 310,823
$ 29,7438,252
18,2832,467
58,745
10,2511,885
19,07565,99116,247
(11,377)146,818236,754
3,188239,942
$ 310,823
See notes to consolidated financial statements.
F-3

METHODE ELECTRONICS, INC. AND SUBSIDIARIESCONSOLIDATED STATEMENTS OF OPERATIONS
(in thousands, except per share data)
Net sales
Cost of products sold
Gross margins
RestructuringImpairment of goodwill and other assetsSelling and administrative expensesAmortization of intangibles
Income/(loss) from operations
Interest (income)/expense, netOther (income)/expense, net
Income/(loss) before income taxes
Income tax expense/(benefit)
Income from continuing operationsGain on sale of discontinued operation, net of tax ($4,148 less taxes of $3,493)
Net income/(loss)Less: Net income/(loss) attributable to noncontrolling interestNET INCOME/(LOSS) ATTRIBUTABLE TO METHODEELECTRONICS, INC.
Basic income/(loss) per share:Continuing operationsDiscontinued operations
Basic income/(loss) per share
Diluted income/(loss) per share:Continuing operationsDiscontinued operations
Diluted income/(loss) per share
Cash dividends per share:Common stock
Fiscal Year EndedApril 30, 2011
$ 428,215
339,042
89,173
(21)—
70,8482,402
15,944
1981,284
14,462
(4,076)
18,538655
19,193(307)
$ 19,500
$ 0.51$ 0.02$ 0.53
$ 0.50$ 0.02$ 0.52
$ 0.28
May 1, 2010
$ 377,646
297,711
79,935
7,770—
62,4272,297
7,441
139(515)
7,817
(5,964)
13,781—
13,781126
$ 13,655
$ 0.37$ —$ 0.37
$ 0.37$ —$ 0.37
$ 0.28
May 2, 2009
$ 428,846
356,496
72,350
25,27894,37457,1286,933
(111,363)
(1,382)479
(110,460)
1,680
(112,140)—
(112,140)343
$ (112,483)
$ (3.05)$ —$ (3.05)
$ (3.05)$ —$ (3.05)
$ 0.26
See notes to consolidated financial statements.
F-4

METHODE ELECTRONICS, INC. AND SUBSIDIARIESCONSOLIDATED STATEMENTS OF SHAREHOLDERS’ EQUITY
Years Ended April 30, 2011, May 1, 2010 and May 2, 2009(Dollar amounts in thousands, except share data)
Balance at May 3, 2008Release of restriction pursuant to acquisitionEarned portion of restricted stock awardsStock award and stock option amortizationVested stock awards withheld for payrollExercise of optionsCommon stock repurchasedTax expense from stock optionsForeign currency translation adjustmentsNet income/(loss) for yearCash dividends on common stockBalance at May 2, 2009Cancellation of shares pursuant to acquisition earn-out
Release of restriction pursuant to acquisitionEarned portion of restricted stock awardsStock award and stock option amortizationVested stock awards withheld for payrollExercise of optionsTreasury shares issued for minority sharesPurchase of non-controlling interest in Hetronic AsiaSale of minority interest in Hetronic AsiaTax expense from stock optionsForeign currency translation adjustmentsNet income for yearCash dividends on common stockBalance at May 1, 2010Earned portion of restricted stock awardsStock award and stock option amortizationVested stock awards withheld for payrollExercise of optionsTreasury shares issued for minority sharesPurchase of non-controlling interest - Hetronic Swiss
Sale of OptokonPurchase of EetrexForeign currency translation adjustmentsNet income/(loss) for yearCash dividends on common stockBalance at April 30, 2011
CommonStockShares
38,225,379(53,012)120,041
—(20,721)19,089
—————
38,290,776(239,695)
—62,140
—(10,923)17,64830,000
——————
38,149,94647,600
—(5,378)
150,075(30,000)
——————
38,312,243
CommonStock
$
$ 19,113(27)60—
(11)10—————
$ 19,145(120)
—31—(5)9
15——————
$ 19,07524—(3)75
(15)——————
$ 19,156
UnearnedCommon
StockIssuances
$ (4,257)625—————————
$ (3,632)3,307
325———————————
$ ————————————
$ —
AdditionalPaid-inCapital
$ 69,953(598)(60)
(553)(130)103—
(209)———
$ 68,506(3,187)
—(31)871(99)176
(214)——
(31)———
$ 65,991(46)
3,0063
95315——
2,191———
$ 72,113
CurrencyTranslation
Adjustments
$ 28,381———————
(12,706)——
$ 15,675——————————
572——
$ 16,247——————
(4,057)—
10,962——
$ 23,152
TreasuryStock
$ (6,243)—————
(5,252)————
$ (11,495)——————
118——————
$ (11,377)———————————
$ (11,377)
RetainedEarnings
$ 265,838————————
(112,483)(9,778)
$ 143,577———————————
13,655(10,414)
$ 146,818—————————
19,500(10,329)
$ 155,989
Non-Controlling
Interest
$ 3,344———————
(704)485—
$ 3,125———————
150(324)
—111126—
$ 3,188—————29
(3,256)2,175
282(307)
—$ 2,111
TotalShareholders
Equity
$ 376,129——
(553)(141)113
(5,252)(209)
(13,410)(111,998)
(9,778)$ 234,901
—325—
871(104)185(81)150
(324)(31)683
13,781(10,414)
$ 239,942(22)
3,006—
1,028—29
(7,313)4,366
11,24419,193
(10,329)$ 261,144
See notes to consolidated financial statementsF-5

METHODE ELECTRONICS, INC. AND SUBSIDIARIESCONSOLIDATED STATEMENTS OF CASH FLOWS
(in thousands)
OPERATING ACTIVITIESNet income/(loss)Adjustments to reconcile net income/(loss) to net cash provided byoperating activities:
(Gain)/loss on sale of fixed assetsGain on the sale of discontinued businessGain on investment in businessProvision for depreciationAmortization of intangible assetsImpairment of tangible assetsImpairment of goodwill and other assetsStock-based compensationProvision for bad debtDeferred income taxesChanges in operating assets and liabilities:
Accounts receivableInventoriesPrepaid expenses and other current assetsAccounts payable and accrued expenses
NET CASH PROVIDED BY OPERATING ACTIVITIES
INVESTING ACTIVITIESPurchases of property, plant and equipmentAcquisition of businessesAcquisition of technology licensesProceeds from life insurance policiesOtherNET CASH USED IN INVESTING ACTIVITIES
FINANCING ACTIVITIESPurchase of common stockProceeds from exercise of stock optionsTax expense from stock options and awardsCash dividendsNET CASH USED IN FINANCING ACTIVITIES
Effect of foreign currency exchange rate changes on cashINCREASE (DECREASE) IN CASH AND CASH EQUIVALENTSCash and cash equivalents at beginning of year
CASH AND CASH EQUIVALENTS AT END OF YEAR
Fiscal Year EndedApril 30,
2011
$ 19,193
73(4,148)
(165)13,3542,4021,299
—3,006
249(5,207)
(17,846)(8,710)13,841
(301)17,040
(15,223)(2,470)
—1,515
—(16,178)
—1,028
—(10,329)(9,301)2,063
(6,376)63,821
$ 57,445
May 1,2010
$ 13,781
———
17,1122,297
710—
871142
3,992
(12,436)645(39)291
27,366
(9,379)(325)(530)
2,464—
(7,770)
—185(31)
(10,414)(10,260)
4559,791
54,030$ 63,821
May 2,2009
$ (112,140)
(407)——
30,1036,933
10,31394,374
(553)120
8,078
33,34719,918
(16,086)(30,832)43,168
(17,064)(57,469)(1,575)
—(14)
(76,122)
(5,252)113
(209)(9,778)
(15,126)(2,195)
(50,275)104,305
$ 54,030
See notes to condensed consolidated financial statements.
F-6

METHODE ELECTRONICS, INC. AND SUBSIDIARIES
NOTES TO CONSOLIDATED FINANCIAL STATEMENTS
(Dollar amounts in thousands, except per share data)
1. Significant Accounting Policies
Principles of Consolidation. The consolidated financial statements include the accounts and operations of Methode Electronics, Inc. and its subsidiaries (“the Company”). As used herein, “we,” “us,” “our,” the “Company” or “Methode” means Methode Electronics, Inc. and its subsidiaries.
Financial Reporting Periods. We maintain our financial records on the basis of a fifty-two or fifty-three week fiscal
year ending on the Saturday closest to April 30. Fiscal 2011, 2010 and 2009 all represent fifty-two weeks of results.
Cash Equivalents. All highly liquid investments with a maturity of three months or less when purchased are carried at their fair value and classified in the consolidated balance sheets as cash equivalents.
Accounts Receivable and Allowance for Doubtful Accounts. We carry accounts receivable at their face amounts less
an allowance for doubtful accounts. On a regular basis, we record an allowance for uncollectible receivables based upon past transaction history with customers, customer payment practices and economic conditions. Actual collection experience may differ from the current estimate of net receivables. A change to the allowance for uncollectible amounts may be required if a future event or other change in circumstances results in a change in the estimate of the ultimate collectability of a specific account. We do not require collateral for our accounts receivable balances. Accounts are written off against the allowance account when they are determined to be no longer collectible.
Inventories. Inventories are stated at the lower-of-cost (first-in, first-out method) or market. Property, Plant and Equipment. Properties are stated on the basis of cost. We amortize such costs by annual charges
to income, computed on the straight-line method using estimated useful lives of 5 to 40 years for buildings and improvements and 3 to 15 years for machinery and equipment for financial reporting purposes. Accelerated methods are generally used for income tax purposes.
Income Taxes. Deferred tax assets and liabilities are determined based on differences between financial reporting and
tax bases of assets and liabilities and are measured using the enacted tax rates and laws that will be in effect when the differences are expected to reverse.
Revenue Recognition. We recognize revenue on product sales when i) persuasive evidence of an agreement exists, ii)
the price is fixed or determinable, iii) delivery has occurred or services have been rendered, and iv) collection of the sales proceeds is reasonably assured. Revenue from our product sales not requiring installation, net of trade discounts and estimated sales allowances, is recognized when title passes, which is generally upon shipment. We do not have any additional obligations or customer acceptance provisions after shipment of such products. We handle returns by replacing, repairing or issuing credit for defective products when returned. Return costs were not significant in fiscal 2011, 2010 or 2009. Revenue from cabling infrastructure systems installations is recognized when the installation is completed, tested and accepted by the customer.
Shipping and Handling Fees and Costs. Shipping and handling fees billed to customers are included in net sales, and
the related costs are included in cost of products sold. Foreign Currency Translation. The functional currencies of the majority of our foreign subsidiaries are in their local
currencies. The results of operations of these foreign subsidiaries are translated into U.S. dollars using average exchange rates during the year, while the assets and liabilities are translated using period-end exchange rates. Adjustments from the translation process are classified as a component of shareholders’ equity. Exchange gains and losses arising from transactions denominated in a currency other than the functional currency of the foreign subsidiary are included in the Consolidated Statements of Operations in other, net. In fiscal 2011, 2010 and 2009, we had foreign exchange losses of $2,280, $1,151 and $479, respectively.
Long-Lived Assets. We continually evaluate whether events and circumstances have occurred which indicate that the remaining estimated useful lives of our intangible assets, excluding goodwill, and other long-lived assets, may warrant revision or that the remaining balance of such assets may not be recoverable. In the event that the undiscounted cash flows resulting
F-7

METHODE ELECTRONICS, INC. AND SUBSIDIARIES
NOTES TO CONSOLIDATED FINANCIAL STATEMENTS
(Dollar amounts in thousands, except per share data)
from the use of the asset group is less than the carrying amount, an impairment loss equal to the excess of the asset’s carrying amount over its fair value is recorded.
Goodwill and Intangibles. Costs assigned to the fair value of intangible assets acquired with finite lives are being amortized over periods ranging from 3 to 20 years, generally on a straight-line basis or accelerated basis, depending on the nature of the intangible asset. The fair value of certain intangible assets is being amortized over projected revenues used to initially value such intangible assets. Goodwill represents the excess of purchase price over the estimated fair value of net assets of acquired companies, which has not been allocated to other intangible assets.
The Company evaluates goodwill and indefinite-lived intangible assets for impairment at the reporting unit level,
which is one level below the operating segment level (herein referred to as the reporting unit). The impairment test for goodwill is a two-step process. The first step is to compare the fair value of a reporting unit with its carrying amount, including goodwill. If the fair value of a reporting unit exceeds its carrying amount, goodwill of the reporting unit is not considered impaired. If the carrying amount of the reporting unit exceeds its fair value, the second step of the goodwill test is performed to measure the amount of the impairment loss, if any. In this second step, the implied fair value of the reporting unit’s goodwill is compared with the carrying amount of the goodwill. If the carrying amount of the reporting unit’s goodwill exceeds the implied fair value of that goodwill, an impairment loss is recognized in an amount equal to that excess, not to exceed the carrying amount of the goodwill. We performed “step one” of the goodwill impairment test on the reporting units that had goodwill as of April 30, 2011 and based on the results of the testing, we concluded that there was no impairment of goodwill.
Research and Development Costs. Costs associated with the enhancement of existing products and the development of new products are charged to expense when incurred. Research and development costs for the fiscal years ended April 30, 2011, May 1, 2010 and May 2, 2009 amounted to $19,506, $18,412 and $21,995, respectively.
Stock-Based Compensation. See Note 5, Shareholders’ Equity for a description of our stock-based compensation
plans.
Use of Estimates. The preparation of financial statements in conformity with accounting principles generally accepted in the United States requires management to make estimates and assumptions that affect the amounts reported in the financial statements and accompanying notes. Actual results could differ from those estimates.
Fair Value of Other Financial Instruments. The carrying values of our short-term financial instruments, including
cash and cash equivalents, accounts receivable and accounts payable approximate their fair values because of the short maturity of these instruments.
Recently Adopted Accounting Pronouncements
In December 2010, the Financial Accounting Standards Board (“FASB”) issued authoritative guidance regarding ASC No. 350, "Goodwill and Other Intangible Assets," by eliminating an entity's ability to assert that a reporting unit is not required to perform Step 2 because the carrying amount of the reporting unit is zero or negative despite the existence of qualitative factors that indicate the goodwill is more likely than not impaired. Under ASC No. 350, testing for goodwill impairment is a two-step test. In Step 1, an entity must assess whether the carrying amount of a reporting unit exceeds its fair value. If it does, an entity must perform an additional test to determine whether goodwill has been impaired and to calculate the amount of the impairment, Step 2. This guidance became effective for our fourth quarter of fiscal 2011. The adoption of this guidance did not have a material impact on our financial statements.
In January 2010, the FASB issued Accounting Standards Update (“ASU”) 2010-06, “Improving Disclosures about Fair Value Measurements.” ASU 2010-06 requires additional disclosures about fair value measurements, including transfers in and out of Levels 1 and 2, and a higher level of disaggregation for the different types of financial instruments. For the reconciliation of Level 3 fair value measurements, information about purchases, sales, issuances and settlements are presented separately. This standard is effective for interim and annual reporting periods beginning after December 15, 2009, with the exception of revised Level 3 disclosure requirements which are effective for interim and annual reporting periods beginning after December 15, 2010. Comparative disclosures are not required in the year of adoption. We adopted the provisions of the standard on May 2, 2010, which did not have a material impact on our financial statements.
F-8

METHODE ELECTRONICS, INC. AND SUBSIDIARIES
NOTES TO CONSOLIDATED FINANCIAL STATEMENTS
(Dollar amounts in thousands, except per share data)
In June 2009, the FASB issued ASC No. 810, “Consolidation,” regarding the consolidation of variable interest entities
(formerly SFAS No. 167, “Amendments to FASB Interpretation No. 46(R)”). ASC 810 is intended to improve financial reporting by providing additional guidance to companies involved with variable interest entities and by requiring additional disclosures about a company's involvement in variable interest entities. This standard is effective for interim and annual periods beginning after November 15, 2009. We adopted the provisions of the standard on May 2, 2010, which did not have a material impact on our financial statements.
In June 2009, the FASB issued ASC 860, “Transfers and Servicing” (formerly SFAS No. 166, “Accounting for
Transfers of Financial Assets”). ASC 860 requires more information about transfers of financial assets where companies have continuing exposure to the risk related to transferred financial assets. It eliminates the concept of a qualifying special purpose entity, changes the requirements for derecognizing financial assets, and requires additional disclosure. This standard is effective for interim and annual periods beginning after November 15, 2009. We adopted the provisions of the standard on May 2, 2010, which did not have a material impact on our financial statements.
Recently Issued Accounting Pronouncements
In May 2011, the FASB issued ASU 2011-04, "Amendments to Achieve Common Fair Value Measurement and Disclosure Requirements in U.S. GAAP and IFRS," which results in common fair value measurement and disclosure requirements in U.S. GAAP and IFRS. Consequently, the amendments change the wording used to describe many of the requirements in U.S. GAAP for measuring fair value and for disclosing information about fair value measurements. ASU 2011-04 is effective for interim and annual periods beginning after December 15, 2011, which will be our fiscal 2012 quarter ending January 28, 2012. The adoption is not expected to have a material impact on our financial statements.
In December 2010, the FASB issued authoritative guidance regarding ASC No. 805, "Business Combinations," on the
disclosure of supplementary pro forma information for business combinations. ASC No. 805 requires a public entity to disclose pro forma information for business combinations that occurred in the current reporting period. The disclosures include pro forma revenue and earnings of the combined entity for the current reporting period as though the acquisition date for all business combinations that occurred during the year had been of the beginning of the annual reporting period.
If comparable financial statements are presented, the pro forma revenue and earnings of the combined entity for the comparable prior reporting period should be reported as though the acquisition date for all business combinations that occurred during the current year had been as of the beginning of the comparable prior annual reporting period. This guidance specifies that if a public entity presents comparative financial statements, the entity should disclose revenue and earnings of the combined entity as though the business combinations that occurred during the current year had occurred as of the beginning of the comparable prior annual reporting period only. This guidance is effective prospectively for business combinations for which the acquisition date is on or after the beginning of the first annual reporting period beginning on or after December 15, 2010, which will be our fiscal 2012, beginning on May 1, 2011. We do not anticipate the adoption of this update to have a material impact on our financial statements.
2. Restructurings March 2009 Restructuring
In March 2009, we announced additional restructuring actions to consolidate manufacturing facilities to reduce costs. All of the restructuring actions were complete at the end of fiscal 2010.
In total, this additional restructuring affected approximately 850 employees worldwide. We recorded a total pre-tax
charge of $12,511 during fiscal 2009 and 2010 related to this restructuring. During fiscal 2010, we recorded a restructuring charge of $5,248, which consisted of $3,512 for employee severance,
$279 in the cancellation of lease agreements and $1,457 for other costs.
F-9

METHODE ELECTRONICS, INC. AND SUBSIDIARIES
NOTES TO CONSOLIDATED FINANCIAL STATEMENTS
(Dollar amounts in thousands, except per share data)
During fiscal 2009, we recorded a restructuring charge of $7,263, which consisted of $100 for employee severance, $1,373 in impairment for buildings and improvements and machinery and equipment, $5,418 for impairment of customer funded tooling and $133 in forfeited security deposits related to the transfer of the certain new GM business and $239 related to professional fees.
As of May 1, 2010, we had an accrued restructuring liability of $420 reflected in the current liabilities section of our
consolidated balance sheet. During fiscal 2011, we paid out $140 of the liability, with $280 remaining as of April 30, 2011. We expect this liability to be paid out during fiscal 2012.
The table below reflects the activity related to the March 2009 restructuring for fiscal 2009, 2010 and 2011.
Accrued balance at May 3, 2008
FY 2009 restructuring chargesPayments and asset write-downsAccrued balance at May 2, 2009
FY 2010 restructuring chargesPayments and asset write-downsAccrued balance at May 1, 2010
PaymentsAccrued balance at April 30, 2011
One-TimeEmployeeSeverance
$ —
100—
$ 100
3,512(3,612)
$ —
—$ —
AssetWrite-Downs
$ —
6,924(6,924)
$ —
——
$ —
—$ —
OtherCosts
$ —
239(198)
$ 41
1,736(1,357)
$ 420
(140)$ 280
Total
$ —
7,263(7,122)
$ 141
5,248(4,969)
$ 420
(140)$ 280
January 2008 Restructuring
In January 2008, we announced a restructuring of our U.S.-based automotive operations and a decision to discontinue producing certain legacy products in the Interconnect segment. The Automotive and Interconnect segment restructuring was completed during fiscal 2010. We record the expense in the restructuring section of our consolidated statement of operations. We recorded a total pre-tax charge of $25,696 during fiscal 2008, 2009 and 2010 related to this restructuring initiative.
During fiscal 2010, we recorded a restructuring charge of $2,522, which consisted of $697 for employee severance,
$1,564 for accelerated depreciation for buildings and equipment, and $261 related to other costs. During fiscal 2009, we recorded a restructuring charge of $18,015, which consisted of $6,099 for employee severance,
$3,522 and $7,276 in impairments and accelerated depreciation, respectively, for buildings and improvements and machinery and equipment, $153 in inventory write-downs and $965 related to professional fees.
During fiscal 2008, we recorded a restructuring charge of $5,159, which consisted of $3,355 for employee severance,
$1,346 in impairments and accelerated depreciation for buildings and improvements and machinery and equipment and $458 related to professional fees.
At the end of fiscal 2010, we had an accrued restructuring liability of $155 reflected in the current liabilities section of our consolidated balance sheet. There were $134 of payments made against this liability during fiscal 2011. The remaining accrual balance of $21 was reversed to the statement of operations. The accrued restructuring balance is zero as of April 30, 2011.
F-10

METHODE ELECTRONICS, INC. AND SUBSIDIARIES
NOTES TO CONSOLIDATED FINANCIAL STATEMENTS
(Dollar amounts in thousands, except per share data)
The table below reflects the January 2008 restructuring activity for fiscal 2009, 2010 and 2011.
Accrued balance at May 3, 2008
Fiscal 2009 restructuring chargesFiscal 2009 payments and asset write-downsAccrued balance at May 2, 2009
Fiscal 2010 restructuring chargesFiscal 2010 payments and asset write-downsAccrued balance at May 2, 2009
Fiscal 2011 paymentsAccrual reversal in fiscal 2011Accrued balance at April 30, 2011
One-TimeEmployeeSeverance
$ 3,152
6,099(7,402)1,849
697(2,429)
$ 117
(96)(21)
$ —
AssetWrite-Downs
$ —
10,951(10,951)
—
1,564(1,564)
$ —
——
$ —
OtherCosts
$ 24
965(989)
—
261(223)
$ 38
(38)—
$ —
Total
$ 3,176
18,015(19,342)
1,849
2,522(4,216)
$ 155
(134)(21)
$ —
3. Acquisitions and Divestitures Fiscal 2011 Acquisitions
In May 2010, we paid $1,000 for an 15% equity investment in Eetrex Incorporated to facilitate our entry into the electric vehicle market. Eetrex is located in Boulder, Colorado and is a developer and manufacturer of chargers, inverters and battery systems for hybrid and plug-in hybrid electronic vehicles. In March 2011, we paid an additional $1,070, for a total investment of $2,070, to acquire an additional 36% of the stock of Eetrex. In April 2011, we paid an additional $650 and acquired an additional 19% of their stock, for a total 70% ownership. In March 2011, we recognized a gain of $165 on our initial investment of $1,000, at the date control was obtained. We have additional options to acquire an additional 20% of Eetrex between July 1, 2011 and October 31, 2011 for $1,080. In the event we exercise the option to purchase the additional 20%, each of the existing stockholders of Eetrex will have the right to exercise put options, requiring us to purchase their remaining shares after the end of fiscal 2014 or 2016, and we will have an option to purchase any remaining shares after the end of fiscal 2016. The purchase price will be based on a percentage of net sales recorded since March 2011 of between 2.0% and 3.5%.
Based on a third-party valuation report, management determined that 100% of the net assets of Eetrex had a fair value
of $6,600 as of the date that control was obtained in March 2011. Additionally in March 2011, we also recorded $3,234 of non-controlling interest related to the transaction. The fair values assigned to intangible assets acquired were $2,000 for the technology valuation, and tangible net assets of $274, resulting in $4,326 of goodwill. The technology valuation will be amortized over 10 years. The accounts and transactions of Eetrex have been included in the Power Products segment in the consolidated financial statements from the effective date of the acquisition. We do not expect any of the goodwill of $4,326 to be deductible for income tax purposes.
Fiscal 2011 Divestitures
In March 2011, we sold our 75% ownership interest in Optokon, a manufacturer of optical cabling and test equipment, located in the Czech Republic, to the minority shareholder for $9,950. The net assets of our 75% ownership interest had a book value of $9,859. We recorded a gain of $4,148 related to sale of the net assets, primarily attributable to the cumulative translation gains since the date of the initial investment. We recorded income taxes related to the sale of $3,493, resulting in a gain net of taxes of $655. We received $5,896 in cash as well as a collateralized note for $4,054. The note is a 15-year, interest bearing note. As of April 30, 2011, the current portion of the note of $156 is reflected in the prepaid and other current assets and the long-term portion of the note of $3,867 in the other long-term assets in our consolidated balance sheets.
F-11
METHODE ELECTRONICS, INC. AND SUBSIDIARIES
NOTES TO CONSOLIDATED FINANCIAL STATEMENTS
(Dollar amounts in thousands, except per share data)
We concluded the Optokon results of operations for fiscal 2011, 2010 and 2009 were not material to the consolidated or segment level financial statements for those periods presented to be separately reported as a discontinued operations in accordance with ASC 205-20, "Presentation of Financial Statements".
Fiscal 2009 Acquisitions
On September 30, 2008, we acquired certain assets of Hetronic LLC (Hetronic) for $53,639 in cash. We also incurred $2,447 in transaction costs related to the purchase. Hetronic is a global leader in industrial safety radio remote controls with locations in the U.S., Malta, the Philippines and Germany. Hetronic is represented in 45 countries by direct sales associates, licensed partners, distributors and representatives. Hetronic provides application specific and standard controls to many different industries, such as material handling, transportation, mining, military, agriculture and construction.
Based on a third-party valuation report, management determined that the tangible net assets had a fair value of
$20,533. The fair values assigned to intangible assets acquired were $12,170 for customer relationships, $2,700 for the trade name and trademarks, $1,450 for technology valuation, and $170 for non-competes, resulting in $19,063 of goodwill. The customer relationships, technology valuation and non-competes are being amortized over 5 to approximately 12 years. The trade name and trademarks are not subject to amortization but are subject to periodic impairment testing. The accounts and transactions of Hetronic have been included in the Interconnect segment in the consolidated financial statements from the effective date of the acquisition. See Note 4 for information about the Hetronic intangible asset and goodwill write-off in fiscal 2009.
4. Intangible Assets and Goodwill
We review our goodwill and other intangible assets for impairment whenever events or changes in circumstances indicate that the carrying amount of these assets may not be recoverable, and we also review our goodwill and indefinite-lived intangibles annually in accordance with ASC No. 350, “Intangibles - Goodwill and Other.” The values assigned to goodwill intangible assets are normally based on estimates and judgments regarding expectations for the success and life cycle of products and technologies acquired. A severe decline in expectations, future cash flows, a change in strategic direction or our market capitalization remaining below our net book value for a significant period of time could result in significant impairment charges, which could have a material adverse effect on our financial condition and results of operations. We performed the annual goodwill and indefinite-lived intangible asset impairment analysis as of April 30, 2011 and May 1, 2010, using a discounted cash flow model for each reporting unit based forecasted budgets using the business conditions which existed as of the testing date. The goodwill test was completed on two reporting units in the Power Products segment and one business unit in the Interconnect segment. In addition, we performed impairment analysis for indefinitely-lived intangible assets on one reporting unit in the Interconnect segment. Based on the results of the test, we concluded that there was no impairment of goodwill or indefinite-lived intangible assets as of April 30, 2011 and May 1, 2010.
In fiscal 2009, based on events and general business declines, we performed “step one” of the goodwill impairment
test in accordance with ASC No. 350, on the reporting units. Based on this test, we determined that the fair value was less than the carrying value of the net assets for certain reporting units. We completed “step two” of the goodwill test and concluded that goodwill was impaired. Therefore, for fiscal 2009, we recorded a goodwill impairment charge of $25,838 in our Automotive segment, $30,752 in our Interconnect segment, $5,358 in our Power Products segment and $1,203 in our Other segment for a total of $63,151 related to these assets.
Also, in accordance with ASC No. 360, “Property, Plant and Equipment”, we record impairment losses on long-lived
assets used in operations when events and circumstances indicate that long-lived assets might be impaired and the undiscounted cash flows estimated to be generated by those assets are less than the carrying amounts of those assets. During fiscal 2009, based on our future estimates of the undiscounted cash flows, it was determined that certain identifiable intangible assets of our TouchSensor and Hetronic businesses in the Interconnect segment, the Automotive Safety Technologies business in our Automotive segment and Magna-Lastic Devices, Inc. from our Other segment were impaired. Therefore, we recorded an impairment charge of $26,176 in the Interconnect segment, $4,626 in the Automotive segment and $421 in the Other segment for a total of $31,063 for these assets.
F-12

METHODE ELECTRONICS, INC. AND SUBSIDIARIES
NOTES TO CONSOLIDATED FINANCIAL STATEMENTS
(Dollar amounts in thousands, except per share data)
Goodwill increased $4,326 in fiscal 2011, related to the purchase of 70% of the stock of Eetrex. Please see Note 3 for more information.
Goodwill increased $325 in fiscal 2010, related to a final payout for the 2005 acquisition of Cableco Technologies Corporation. We had originally issued 623,526 shares of restricted common stock in connection with the contingent payments related to this transaction. The contingent payments were to be earned if certain operational and financial milestones were met, depending on certain factors. In fiscal 2010, the sellers earned 27,567 of the restricted shares. Since acquisition, including the 27,567 shares earned in fiscal 2010, the sellers earned a total of 383,831 of the restricted shares. The remaining 239,695 restricted shares were canceled in fiscal 2010.
The following table shows the roll-forward of goodwill in the financial statements resulting from our acquisition and impairment activities for fiscal 2009, 2010 and 2011.
Balance as of May 3, 2008
Attibutable to 2009 acquisitionsAdjustments due to earn-outAdjustments due to finalization of purchase priceallocationImpairment
Balance as of May 2, 2009
Adjustments due to earn-outBalance as of May 1, 2010
Attibutable to 2011 acquisitionsBalance as of April 30, 2011
Automotive
$ 25,838
——
—(25,838)
$ —
—$ —
—$ —
Interconnect
$ 22,835
19,063—
—(30,752)
$ 11,146
—$ 11,146
—$ 11,146
PowerProducts
$ 4,600
—625
758(5,358)
$ 625
325$ 950
4,326$ 5,276
Other
$ 1,203
——
—(1,203)
$ —
—$ —
—$ —
Total
$ 54,476
19,063625
758(63,151)
$ 11,771
325$ 12,096
4,326$ 16,422
Intangible Assets
The following tables present details of our remaining identifiable intangible assets:
Customer relationships and agreementsTrade names, patents and technology licensesCovenants not to compete
Total
As of April 30, 2011
Gross
$ 14,99525,774
480$ 41,249
AccumulatedAmortization
$ 13,4178,978
431$ 22,826
Net
$ 1,57816,796
49$ 18,423
Wtd. Avg. Remaining
AmortizationPeriods (Years)
12.712.40.8
F-13

METHODE ELECTRONICS, INC. AND SUBSIDIARIES
NOTES TO CONSOLIDATED FINANCIAL STATEMENTS
(Dollar amounts in thousands, except per share data)
Customer relationships and agreementsTrade names, patents and technology licensesCovenants not to compete
Total
As of May 1, 2010
Gross
$ 14,99523,774
480$ 39,249
AccumulatedAmortization
$ 13,0666,991
381$ 20,438
Net
$ 1,92916,783
99$ 18,811
Wtd. Avg. Remaining
AmortizationPeriods (Years)
13.713.01.8
The estimated aggregate amortization expense for each of the five succeeding fiscal years is as follows:
20122013201420152016
$1,8041,5251,4811,4691,317
As of April 30, 2011, the trade names, patents and technology licenses include $1,800 of trade names that are not
subject to amortization.
5. Shareholders’ Equity
Preferred Stock. We have 50,000 authorized shares of Series A Junior Participating Preferred Stock, par value $100 per share, of which none were outstanding during any of the periods presented.
Common Stock. The number of shares of common stock, par value $0.50 per share, authorized, issued and in treasury,
was as follows:
AuthorizedIssuedIn treasury
April 30, 2011
100,000,00038,312,2431,342,188
May 1, 2010
100,000,00038,149,9461,342,188
Dividends
We paid quarterly dividends totaling $10,329, $10,414 and $9,778 during fiscal 2011, 2010 and 2009, respectively. We intend to retain the remainder of our earnings not used for dividend payments to provide funds for the operation and expansion of our business.
2010 Stock Plan
Our Board of Directors, on the recommendation of our Compensation Committee, adopted the Methode Electronics, Inc. 2010 Stock Plan (the "2010 Stock Plan"). The 2010 Stock Plan was voted on and approved by the shareholders at our annual shareholders meeting on October 14, 2010.
The 2010 Stock Plan permits a total of 2,000,000 shares of our common stock to be awarded to participants in the form of nonqualified stock options, incentive stock options, restricted stock units, stock appreciation rights, and performance share units. The 2010 Stock Plan is designed to allow for "performance-based compensation" under Section 162(m) of the Code. As such, qualified awards payable pursuant to the 2010 Stock Plan should be deductible for federal income tax purposes under most circumstances. As of April 30, 2011, there were 912,000 shares still available for award under the 2010 Stock Plan.
F-14

METHODE ELECTRONICS, INC. AND SUBSIDIARIES
NOTES TO CONSOLIDATED FINANCIAL STATEMENTS
(Dollar amounts in thousands, except per share data)
Below are key elements related to the stock options, performance-based restricted stock awards and time-based restricted stock units issued in fiscal 2011 under the 2010 Stock Plan:
Bonus in Lieu of Dividends - For the performance-based restricted stock awards, bonuses in lieu of dividends will not be paid until the restrictions lapse (i.e., not in first 5 years). At such time as the restrictions lapse, the executive will be paid a “dividend catch-up” bonus calculated based on the dividends declared during the restricted period and the number of shares earned. The shares will count towards the executive's minimum stock ownership requirements once the restrictions lapse (to the extent the shares continue to be held). For the time-based restricted stock units, once the restricted stock units vest and until the shares are delivered, the executive will be paid a quarterly bonus in lieu of dividends calculated based on declared dividends and the total number of vested restricted stock units held. Tandem Cash Award - The executives were also be granted RSA Tandem Cash Awards. These cash incentive awards will become payable if performance under the RSAs described above exceeds target performance. If the performance measure target for the RSAs is exceeded, the amount payable under the RSA tandem cash bonus will equal the product of the closing price of our common stock as of May 1, 2015 and the number of shares awarded to such executive officer not to exceed 40% of the awarded shares.
Change of Control (Performance-based Restricted Stock Awards) - In the event of a Change of Control, Grantee shall vest in the percentage of Restricted Shares that, extrapolated from the Company's external enterprise value as of the date of the Change of Control, would have vested on the Vesting Date. External enterprise value equals the fair market value per share of the Company's Common Stock as determined by the bona fide offer for the Company's Common Stock causing the Change of Control.
Change of Control (Time-based Restricted Stock Units) - In the event of a change in control prior to the end of the 5-year period, the vesting accelerates and the restrictions on any unvested shares will lapse.
Change of Control (Stock Options) - In the event of a change, the vesting of all outstanding option awards will be accelerated.
Stock Options Awarded Under the 2010 Stock Plan
During fiscal 2011, the Compensation Committee approved the award of options to purchase 128,000 shares of our common stock to our executive officers under the 2010 Stock Plan. The stock options have a ten-year term and vest 33.3% each year over a three-year period. The exercise price is the closing price on the date granted. The following tables summarize the stock option activity and related information for the stock options granted under the 2010 Stock Plan for fiscal 2011:
Outstanding at May 1, 2010AwardedExercisedCancelled
Outstanding at April 30, 2011
Summary of Option Activity
Shares
—128,000
——
128,000
Wtd. Avg.Exercise Price
$ —9.24
——
$ 9.24
Options Outstandingat April 30, 2011
Shares
128,000Exercise Price
$ 9.24Avg. Remaining Life (Years)
9.5
F-15

METHODE ELECTRONICS, INC. AND SUBSIDIARIES
NOTES TO CONSOLIDATED FINANCIAL STATEMENTS
(Dollar amounts in thousands, except per share data)
The options outstanding had an intrinsic value of $399 at April 30, 2011. The intrinsic value represents the total pre-tax intrinsic value (the difference between the Company's closing stock price on the last trading day of fiscal 2011 and the exercise price, multiplied by the number of in-the-money options) that would have been received by the option holders had all options holders exercised their options on April 30, 2011.
We estimated the fair value of these stock options on the date of grant using the Black-Scholes option-pricing model with the following assumptions:
Average expected volatilityAverage risk-free interest rateDividend yieldExpected life of optionsWeighted-average grant-date fair value
2010 Stock PlanFiscal 2011
Awards
85.83%0.60%3.49%
7.03 years$ 5.19
Expected volatility was based on the monthly changes in our historical common stock prices over the expected life of the award. The risk-free rate is based on the U.S. Treasury yield curve in effect at the time of the grant corresponding to the expected life of the options. Our dividend yield is based on the average dividend yield for the previous two years from the date of grant. The expected life of options is based on historical stock option exercise patterns and the terms of the options.
We recognized pre-tax compensation expense for stock options awarded under the 2010 Stock Plan of $200 for fiscal 2011. We record the compensation expense related to the stock options in the selling and administrative section of our statement of operations.
Restricted Stock Awards and Restricted Stock Units Awarded Under the 2010 Stock Plan
During fiscal 2011, the Compensation Committee awarded 640,000 shares of common stock subject to performance-based restricted stock awards ("RSAs") to certain members of management. The performance measure will be the Company's internal enterprise value at the end of fiscal 2015. The internal enterprise value shall equal the product of (i) fiscal 2015 EBITDA and (ii) 7.5 (the historic multiple of EBITDA), subject to an adjustment for cash, short-term investments, debt, preferred stock, certain equity issuances, certain acquisitions and the changes in the dividend rate. The restricted stock awards will vest, i.e., the restrictions will lapse, at the end of the five-year performance period to the extent the performance goals have been achieved. The remaining shares will be forfeited.
During fiscal 2011, our Compensation Committee awarded 320,000 shares of common stock subject to time-based restricted stock units ("RSUs") to certain members of management. The restricted stock units will vest 20% each year on the last day of our fiscal year and be 100% vested on the last day of fiscal 2015, provided the executive remains employed. The Shares of Common Stock underlying the vested RSUs will not be delivered to the employee until after the employee terminates employment from the Company.
The following table summarizes the RSA and RSU activity for fiscal 2011 for the RSAs awarded under the 2010 Stock Plan:
Unvested and unissued at May 1, 2010AwardedVestedForfeited and CancelledUnvested and unissued at April 30, 2011
RSA Shares
—640,000
——
640,000
RSU Shares
—320,000
——
320,000
F-16

METHODE ELECTRONICS, INC. AND SUBSIDIARIES
NOTES TO CONSOLIDATED FINANCIAL STATEMENTS
(Dollar amounts in thousands, except per share data)
Grant Fiscal Year
2011
2011
Number of Shares
640,000
320,000
Vesting Period
5-year RSA cliff, performance based5-year RSU, equal annualinstallments
WeightedAverage Value
$ 9.70
9.70
ProbableUnearned
CompensationExpense at
April 30, 2011
$ 5,137
1,857
Target UnearnedCompensation
Expense atApril 30, 2011
$ 5,137
1,857
We recognized pre-tax compensation expense for RSAs and RSUs of $1,675 in fiscal 2011. We record the expense in the selling and administrative expenses section of our consolidated statement of operations.
2007 Stock Plan
In June 2007, our Board of Directors, on the recommendation of our Compensation Committee, adopted the Methode Electronics, Inc. 2007 Stock Plan (the “2007 Stock Plan”). The Stock Plan was voted on and approved by the shareholders at our annual meeting in September 2007. Upon adoption of the Stock Plan, our board of directors elected to terminate the 2004 Plan and the 2000 Plan with respect to the shares reserved under these plans that are not subject to outstanding awards.
The 2007 Stock Plan permits a total of 1,250,000 shares of our common stock to be awarded to participants. Shares
issued under the Stock Plan may be either authorized but unissued shares, or treasury shares. If any award terminates, expires, is canceled or forfeited as to any number of shares of common stock, new awards may be granted with respect to such shares. The total number of shares with respect to which awards may be granted to any participant in any calendar year shall not exceed 200,000 shares. As of April 30, 2011 there were 349,931 shares still available for award under the 2007 Stock Plan.
The Board of Directors has determined that the 2007 Stock Plan will only be used for equity awards to our independent directors and non-executive employees.
Stock Options Granted Awarded the 2007 Stock Plan
In fiscal 2009, the Compensation Committee approved the award of options to purchase 285,000 shares of our common stock to our executive officers under the 2007 Stock Plan. The fiscal 2009 awards vest on the third anniversary of the date of grant. In fiscal 2010, the Compensation Committee approved the award of options to purchase 275,000 shares of our common stock to our executive officers and other members of management under the same plan. The awards vest one-third per year on each anniversary of the date of grant. Additionally, the Compensation Committee approved the award of options to purchase 35,500 shares of our common stock to some members of the management team that vest on the third anniversary of the date of grant. In fiscal 2011, the Compensation Committee approved the award of options to purchase 125,000 shares of our common stock to some non-executive members of the management team that vest on the third anniversary of the date of grant. The stock options awarded under the 2007 Stock Plan have a ten-year term.
F-17

METHODE ELECTRONICS, INC. AND SUBSIDIARIES
NOTES TO CONSOLIDATED FINANCIAL STATEMENTS
(Dollar amounts in thousands, except per share data)
The following tables summarize the stock option activity and related information for the stock options granted under the 2007 Stock Plan as of April 30, 2011:
Outstanding at May 2, 2009
GrantedExercisedCancelled
Outstanding at May 1, 2010
GrantedExercisedCancelled
Outstanding at April 30, 2011
Summary of Option Activity
Shares
285,000
310,500——
595,500
125,000——
720,500
Wtd. Avg.Exercise Price
$ 2.72
6.65——
$ 4.77
10.55——
$ 5.77
Options Outstandingat April 30, 2011
Shares
285,000275,00035,500
125,000720,500
Exercise Price
$ 2.726.468.13
10.55$ 5.77
Avg.RemainingLife (Years)
7.98.28.69.2
We estimated the fair value of these stock options on the date of grant using the Black-Scholes option-pricing model
with the following assumptions:
Average expected volatilityAverage risk-free interest rateDividend yieldExpected life of optionsWeighted-average grant-date fair value
Fiscal 2009Awards
69.58%1.39%2.26%
6.87 years$ 1.46
Fiscal 2010Awards
86.88%1.43%2.77%
6.87 years$ 4.02
Fiscal 2011Awards
85.59%1.09%3.63%
7.03 years$ 5.88
We recognized pre-tax compensation expense for stock options awarded under the 2007 Stock Plan of $788, $450 and
$17 in fiscal 2011, 2010 and 2009, respectively. We record the expense in the selling and administrative section of our consolidated statement of operations.
Restricted Stock Awards Awarded Under the 2007 Stock Plan
In April 2007, 225,000 shares of common stock subject to performance-based RSAs granted to our CEO in fiscal 2006 and 2007 were converted to RSUs. The RSUs were subject to the same vesting schedule and other major provisions of the RSAs they replaced, except the shares for stock underlying the RSUs will not be issued and delivered until the earlier of:
F-18

METHODE ELECTRONICS, INC. AND SUBSIDIARIES
NOTES TO CONSOLIDATED FINANCIAL STATEMENTS
(Dollar amounts in thousands, except per share data)
(1) thirty days after the CEO’s date of termination of employment with the Company and all of its subsidiaries and affiliates; or (2) the last day of our fiscal year in which the payment of common stock in satisfaction of the RSUs becomes deductible to the Company under Section 162(m) of the Internal Revenue Code. The RSUs are not entitled to voting rights or the payment of dividends. The RSU’s were fully vested as of April 30, 2011. As of April 30, 2011, no shares have been delivered in connection with the RSUs.
At the beginning of fiscal 2011, there were 25,350 shares of common stock subject to time-based RSAs outstanding, all of which vested as of April 30, 2011. The time-based RSAs vest in three equal annual installments from the grant date. All of the unvested RSAs are entitled to voting rights and to payment of dividends. During fiscal 2011, the Compensation Committee awarded 24,000 restricted shares to our independent directors, all of which vested immediately upon grant.
During fiscal 2010, it was determined that based on the current economic environment, the performance shares
granted in fiscal 2008 and 2009 were not meeting the revenue growth and return on invested capital targets. Due to the performance shares not meeting financial targets, all of the 382,769, performance-based stock awards granted in fiscal 2008 and fiscal 2009 were canceled. There was no adjustment to the pre-tax compensation expense to reflect the performance shares not meeting current and future anticipated revenue growth and return on invested capital targets because the compensation expense was fully reversed in fiscal 2009. We recognized pre-tax compensation expense for RSAs of $343 and $421in fiscal 2011 and 2010, respectively and a pre-tax compensation expense reversal of $570 for fiscal 2009. We record the expense in the selling and administrative expenses section of our consolidated statement of operations. The following table summarizes the RSA activity under the 2007 Stock Plan:
Unvested at beginning of fiscal yearAwardedVestedCancelledForfeited
Unvested at end of period
Fiscal Year2011
25,35024,000
(47,600)—
(1,750)—
2010
453,28724,000
(62,140)(382,769)
(7,028)25,350
2009
357,298356,665
(105,522)(120,750)(34,404)453,287
2000 and 2004 Stock Plans
Stock Options Awarded Under the 2000 and 2004 Stock Plans
Options to purchase 282,767 shares of our common stock were granted in previous years under the 2000 and 2004 Stock Plans and are outstanding and exercisable as of April 30, 2011. There was no compensation expense related to these options in fiscal 2011, 2010 or 2009. Options to purchase 96,934 shares of our common stock expired during fiscal 2011.
F-19

METHODE ELECTRONICS, INC. AND SUBSIDIARIES
NOTES TO CONSOLIDATED FINANCIAL STATEMENTS
(Dollar amounts in thousands, except per share data)
The following tables summarize the stock option activity and related information for the stock options granted under the 2000 and 2004 Stock Plans for fiscal 2011, 2010 and 2009:
May 3, 2008
GrantedExercisedCancelled
May 2, 2009
GrantedExercisedCancelled
May 1, 2010
GrantedExercisedCancelled
April 30, 2011
Options Outstanding
Shares
689,689
—(19,089)(44,967)625,633
—(17,648)(78,209)529,776
—(150,075)(96,934)282,767
Wtd. Avg.Exercise
Price
$ 10.26
—5.90
10.65$ 10.36
—10.6212.0810.10
—6.85
13.03$ 10.82
Exercisable Options
Shares
689,689
625,633
529,776
282,767
Wtd. Avg.Exercise
Price
$ 10.26
$ 10.36
10.10
$ 10.82
Options Outstanding andExercisable at April 30, 2011
Range ofExercise Prices
$7.45 - $7.69$9.03 - $11.44
Shares
12,725270,042282,767
Wtd. Avg. Exercise
Price
$ 7.6410.9710.82
Avg.RemainingLife (Years)
0.11.6
6. Employee 401(k) Savings Plan
We have an Employee 401(k) Savings Plan covering substantially all U.S. employees to which we make contributions equal to 3% of eligible compensation. Our contributions to the Employee 401(k) Savings Plan were $1,261, $1,429 and $1,950 in fiscal 2011, 2010 and 2009, respectively.
F-20

METHODE ELECTRONICS, INC. AND SUBSIDIARIES
NOTES TO CONSOLIDATED FINANCIAL STATEMENTS
(Dollar amounts in thousands, except per share data)
7. Income Taxes
Significant components of our deferred tax assets and liabilities were as follows:
Deferred tax liabilities:Accelerated tax depreciationUnremitted earningsDeferred income
Deferred tax assets:Deferred compensation and stock award amortizationInventory valuation differencesProperty valuation differencesAccelerated book amortizationEnvironmental reservesBad debt reservesVacation accrualsRestructuring accrualsForeign investment tax creditNet operating loss carryoversOther accruals
Less valuation allowanceTotal deferred tax assets
Net deferred tax assetsBalance sheet classification:
Current assetNon-current asset
April 30,2011
$ 2,7312,6791,4176,827
2,8451,2004,523
17,4471,868
494926150
26,41112,404
80869,07654,01515,061
$ 8,234
$ 3,7784,456
$ 8,234
May 1,2010
$ 2,978——
2,978
1,8751,3644,456
19,7381,569
710855197
23,9331,3121,300
57,30948,4028,907
$ 5,929
$ 2,2723,657
$ 5,929
In addition to the deferred tax assets listed in the table above, the Company had an unrecorded tax benefit of $309 at
April 30, 2011, primarily attributable to the difference between the amount of the financial statement expense and the allowable tax deduction for the Company's common stock issued under the Company's stock compensation plans. Although not recognized for financial reporting purposes, this unrecognized tax benefit is available to reduce future income and is incorporated into our federal and state net operating loss carry forwards, which are discussed below.
At April 30, 2011, we had valuation allowances against our deferred tax assets of $54,015. In accordance with ASC No. 740, “Income Taxes”, a valuation allowance is required to be recorded when it is more likely than not that deferred tax assets will not be realized. In fiscal 2010, we utilized all ability to carry-back federal U.S. losses to prior years. Future realization depends on the existence of sufficient taxable income within the carry forward period available under the tax law. Sources of future taxable income include future reversals of taxable temporary differences, future taxable income exclusive of reversing taxable differences, taxable income in carry back years and tax planning strategies. These sources of positive evidence of realizability must be weighed against negative evidence, such as cumulative losses in recent years.
In forming a judgment about the future realization of our deferred tax assets, we considered both the positive and
negative evidence of realizability and gave significant weight to the negative evidence from our recent cumulative loss. We will continue to assess this situation and make appropriate adjustments to the valuation allowance based on our evaluation of the positive and negative evidence existing at the time. We are currently unable to forecast when there will be sufficient positive evidence for us to reverse the remainder of the valuation allowances that we have recorded.
F-21

METHODE ELECTRONICS, INC. AND SUBSIDIARIES
NOTES TO CONSOLIDATED FINANCIAL STATEMENTS
(Dollar amounts in thousands, except per share data)
The valuation allowance is associated with the deferred tax assets for the differences between book and tax that result
from net operating losses (NOL), foreign investment tax credits with unlimited carryovers generated in the current and prior years and temporary differences which become deductible when the related asset is recovered or related liability is settled.
The federal and state NOL carry forwards relate to the current years’ NOLs, which may be used to reduce tax
liabilities in future years. If not realized, the federal tax benefits of $10,255 expire over a twenty year period. If not realized, the state tax benefits of $2,149 expire over a twelve to twenty year period.
Income taxes from continuing operations consisted of the following:
CurrentFederalForeignState
Deferred
Fiscal Year EndedApril 30,
2011
$ (2,703)4,179(345)
1,131(5,207)
$ (4,076)
May 1,2010
$ (11,356)1,339
61(9,956)3,992
$ (5,964)
May 2,2009
$ (6,956)867
(309)(6,398)8,078
$ 1,680
A reconciliation of the consolidated provisions for income taxes from continuing operations to amounts determined by
applying the prevailing statutory federal income tax rate to pre-tax earnings/(loss) is as follows:
Income tax at statutory rateEffect of:
State income taxes, net of federal benefitForeign operations with lower statutory ratesForeign losses with no tax benefitForeign investment tax credit (FTC)Change in tax contingency reserveResearch and development creditGoodwillTrue-up of refundable receivable estimateValuation allowanceOther, netIncome tax provision
Fiscal Year EndedMay 1,2010
$ 5,169
84(10,640)
289(1,276)(2,716)
———
5,613(599)
$ (4,076)
35.0 %
0.6 %(72.1)%
2.0 %(8.6)%
(18.4)%— %— %— %
38.0 %(4.1)%
(27.6)%
May 1,2010
$ 2,693
637(4,723)
532(337)
(3,344)(293)
—1,714
(2,975)132
$ (5,964)
35.0 %
8.3 %(61.4)%
6.9 %(4.4)%
(43.5)%(3.8)%
— %22.3 %
(38.6)%1.7 %
(77.5)%
May 2,2009
$ (38,779)
(2,559)(2,578)13,498(2,027)
37(255)
6,422—
27,953(32)
$ 1,680
35.0 %
2.3 %2.3 %
(12.2)%1.8 %— %0.2 %
(5.8)%— %
(25.1)%— %
(1.5)%
We paid income taxes of $5,187 in fiscal 2011, $1,392 in 2010 and $8,280 in fiscal 2009. In fiscal 2011 and 2010, we
received a tax refund of $13,208 and $9,334, respectively in the U.S. Except for $7,653 in our Ireland subsidiary, no provision has been made for income taxes on undistributed net income of foreign operations, as we expect them to be indefinitely reinvested in our foreign operations. If the undistributed net income of $104,845 were distributed as dividends, we would be subject to foreign tax withholdings and incur additional income tax expense of approximately $41,938, before available foreign tax credits. It is not practical to estimate the amount of foreign tax withholdings or foreign tax credits that may be available. We record investment tax credits using the "flow through" method.
F-22

METHODE ELECTRONICS, INC. AND SUBSIDIARIES
NOTES TO CONSOLIDATED FINANCIAL STATEMENTS
(Dollar amounts in thousands, except per share data)
Income tax provision (benefit) allocated to allocated to continuing operations and discontinued operations were as follows for the years ended:
Continuing operationsDiscontinued operationsTotal tax provision
Fiscal Year2011
$ (4,076)3,493
$ (583)
2010
$ (5,964)—
$ (5,964)
2009
$ 1,680—
$ 1,680
As of April 30, 2011, our gross unrecognized tax benefits totaled $375. After considering the federal impact on the state issues, $375 of this total would favorably affect the effective tax rate if resolved in our favor.
The following table presents a reconciliation of the beginning and ending amounts of unrecognized tax benefits:
Balance at May 1, 2010Increases for positions related to the current yearDecreases for positions related to the prior yearsLapsing of statutes of limitationsBalance at April 30, 2011
$ 2,78250
(674)(1,783)
$ 375
We believe that it is reasonably possible that the total amount of unrecognized tax benefits will change within the next
twelve months. We have certain tax return years subject to statutes of limitation, which will close within twelve months from the end of the fiscal 2011. Unless challenged by tax authorities, the closure of those statutes of limitation is expected to result in the recognition of uncertain tax positions of $50.
The U.S. federal statute of limitations remains open for fiscal year ended May 3, 2008. Generally, the fiscal years ended May 3, 2008 and forward remain open under the state statute of limitations.
The continuing practice of the Company is to recognize interest and penalties related to income tax matters in the provision for income taxes. We had $324 accrued for interest and no accrual for penalties at April 30, 2011. We recorded an interest expense reversal related to unrecognized tax provision of $779 in fiscal 2011 and no expense for penalties. 8. Earnings/(Loss) Per Share Attributable to Methode Shareholders
Basic earnings/(loss) per share attributable to Methode shareholders ("basic earnings/(loss) per share") is calculated by dividing net earnings/(loss) by the weighted average number of common shares outstanding for the applicable period. Diluted income/(loss) per share attributable to Methode shareholders ("diluted earnings/(loss) per share") is calculated after adjusting the denominator of the basic income/(loss) per share calculation for the effect of all potential dilutive common shares outstanding during the period.
F-23

METHODE ELECTRONICS, INC. AND SUBSIDIARIES
NOTES TO CONSOLIDATED FINANCIAL STATEMENTS
(Dollar amounts in thousands, except per share data)
The following table sets forth the computation of basic and diluted earnings/(loss) per share:
Numerator:Income/(loss) from continuing operations, net of taxIncome from discontinued operations, net of taxNet income/(loss) attributable to Methode Electronics, Inc.
Denominator:Denominator for basic earnings/(loss) per share-weighted averageshares
Dilutive potential common shares-employee and director stockoptions, restricted stock awards and restricted stock units
Denominator for diluted earnings/(loss) per share adjusted weightedaverage shares and assumed conversions
Basic income/(loss) per share:Continuing operationsDiscontinued operations
Basic income/(loss) per share
Diluted income/(loss) per share:Continuing operationsDiscontinued operationsDiluted income/(loss) per share
Fiscal Year EndedApril 30,
2011
$ 18,845655
$ 19,500
37,128,157
710,511
37,838,668
$ 0.51$ 0.02$ 0.53
$ 0.50$ 0.02$ 0.52
May 1,2010
$ 13,655—
$ 13,655
36,711,925
219,679
36,931,604
$ 0.37$ —$ 0.37
$ 0.37$ —$ 0.37
May 2,2009
$ (112,483)—
$ (112,483)
36,879,233
—
36,879,233
$ (3.05)$ —$ (3.05)
$ (3.05)$ —$ (3.05)
Options to purchase 135,990, 369,651 and 625,633 shares of common stock were outstanding at April 30, 2011, May 1, 2010 and May 2, 2009, respectively, but were not included in the computation of diluted earnings per share because the exercise price was greater than the average market price of the common shares; therefore, the effect would have been anti-dilutive. Potential common shares have not been included in the calculation of diluted net loss per share, as the effect would be anti-dilutive. As such, the numerator and the denominator used in computing both basic and diluted net loss per share for the fiscal year ended May 2, 2009 are the same.
9. Environmental Matters
We are not aware of any potential unasserted environmental claims that may be brought against us. We are involved in environmental investigation and/or remediation at two of our plant sites no longer used for operations. We use environmental consultants to assist us in evaluating our environmental liabilities in order to establish appropriate accruals in our financial statements. Accruals are recorded when environmental remediation is probable and the costs can be reasonably estimated. A number of factors affect the cost of environmental remediation, including the determination of the extent of contamination, the length of time remediation may require, the complexity of environmental regulations and the advancement of remediation technology. Considering these factors, we have estimated (without discounting) the costs of remediation, which will be incurred over a period of several years. Recovery from insurance or other third parties is not anticipated. We are not yet able to determine when such remediation activity will be complete, but estimates for certain remediation efforts are projected through fiscal 2015.
At April 30, 2011 and May 1, 2010, we had accruals, primarily based upon independent engineering studies, for environmental matters of $4,669 and $4,017, respectively, of which $500 was classified in other accrued expenses and the
F-24

METHODE ELECTRONICS, INC. AND SUBSIDIARIES
NOTES TO CONSOLIDATED FINANCIAL STATEMENTS
(Dollar amounts in thousands, except per share data)
remainder was included in other long-term liabilities on our consolidated balance sheet. We believe the provisions made for environmental matters are adequate to satisfy liabilities relating to such matters, however it is reasonably possible that costs could exceed accrued amounts if the selected methods of remediation do not reduce the contaminates at the sites to levels acceptable to federal and state regulatory agencies.
In fiscal 2011, we spent $527 on remediation cleanups and related studies compared with $474 in fiscal 2010 and $685
in fiscal 2009. The costs associated with environmental matters as they relate to day-to-day activities were not material in fiscal 2011, 2010 or 2009.
10. Comprehensive Income/(Loss)
The components of our comprehensive income/(loss) for fiscal 2011, 2010 and 2009 include net income/(loss) and adjustments to shareholders equity for foreign currency translations. The foreign currency translation adjustment was due to exchange rate fluctuations in our foreign affiliates’ local currency versus the U.S. dollar.
The following table presents details of our comprehensive income/(loss):
Net income/(loss)Translation adjustmentTotal comprehensive income(loss)
Fiscal 2011
Total
$ 19,1937,187
$ 26,380
MethodeShareholders
$ 19,5006,905
$ 26,405
NoncontrollingInterest
$ (307)282
$ (25)
Net incomeTranslation adjustmentTotal comprehensive income
Fiscal 2010
Total
$ 13,781682
$ 14,463
MethodeShareholders
$ 13,655572
$ 14,227
NoncontrollingInterest
$ 126110
$ 236
Net income/(loss)Translation adjustmentTotal comprehensive loss
Fiscal 2009
Total
$ (112,140)(13,268)
$ (125,408)
MethodeShareholders
$ (112,483)(12,706)
$ (125,189)
NoncontrollingInterest
$ 343(562)
$ (219)
11. Pending Litigation
Certain litigation arising in the normal course of business is pending against us. We, from time to time, are subject to various legal actions and claims incidental to our business, including those arising out of alleged defects, breach of contracts, employment-related matters and environmental matters. We consider insurance coverage and third party indemnification when determining required accruals for pending litigation and claims. Although the outcome of potential legal actions and claims cannot be determined, it is the opinion of our management, based on the information available, that we have adequate reserves for these liabilities and that the ultimate resolution of these matters will not have a material adverse effect on our consolidated financial statements.
F-25

METHODE ELECTRONICS, INC. AND SUBSIDIARIES
NOTES TO CONSOLIDATED FINANCIAL STATEMENTS
(Dollar amounts in thousands, except per share data)
Delphi Related Litigation
On September 4, 2008, Methode and Delphi Automotive Systems LLC (“Delphi”) entered into a supply agreement pursuant to which Methode was to supply all of Delphi’s requirements for the seat bladders used in Delphi’s occupant restraint system from October 1, 2008 through September 30, 2011. On August 26, 2009, Delphi notified us that effective September 10, 2009, our supply arrangement was terminated. We are contesting Delphi’s right to terminate this long-term supply arrangement and the parties are engaged in litigation regarding this supply agreement and our related intellectual property.
In March 2010, DPH Holdings Corp., as successor to Delphi Corporation, served the Company with a complaint seeking to recover approximately $19,726 in alleged preference payments that Delphi made to the Company within the 90-day preference period preceding Delphi’s bankruptcy filing. The Company is seeking to dismiss the Delphi preference complaint based on violations of due process and the Company possesses several other substantive defenses. In June 2006, the Company sold certain unsecured claims it had against Delphi in Delphi’s bankruptcy proceeding to Credit Suisse for $3,137 pursuant to a Transfer Agreement. These claims were subsequently assigned by Credit Suisse to Blue Angel Claims LLC (“Blue Angel”). On July 20, 2010, Blue Angel delivered a demand letter to the Company contending that under the terms of the Transfer Agreement, the unsecured claims had been objected to by Delphi in the Delphi bankruptcy proceeding and therefore the Company owed Blue Angel $3,137 plus interest. During the second quarter of fiscal 2011, an expense of $3,834 was recorded for these unsecured claims sold to Blue Angel, which includes interest. The litigation was subsequently settled for $2,068 causing a reversal of expense of $1,766 in the third quarter of fiscal 2011. As part of the settlement agreement, Blue Angel retains ownership of the unsecured claims.
12. Material Customers
Sales to two customers in the Automotive segment, either directly or through their tiered suppliers, represented a
significant portion of our business. Net sales to these two customers approximated 17.9% and 17.6% of consolidated net sales in fiscal 2011; two customers accounted for 18.2% and 13.9% of consolidated net sales, respectively in fiscal 2010 and two customers accounted for 18.8% and 9.7% of consolidated net sales in fiscal 2009.
At April 30, 2011 and May 1, 2010, accounts receivable from customers in the automotive industry were approximately $44,428 and $11,300, respectively, which included $8,077 and $5,682, respectively, at our Maltese subsidiary. Accounts receivable are generally due within 30 to 60 days. Credit losses relating to all customers generally have been within management’s expectation.
13. Line of Credit We had an agreement with our primary bank for a revolving credit facility to provide up to $75,000 of ready financing for general corporate purposes, including acquisition opportunities that may become available. The bank credit agreement, which was scheduled to expire on February 28, 2011, required maintenance of certain financial ratios and a minimum net worth level.
On February 25, 2011, we entered into an Amended and Restated Credit Agreement with Bank of America, N.A., as administrative agent, and certain other financial institutions, which amends and restates our previous credit facility and extends the maturity to February 25, 2016. The new credit facility is in the aggregate principal amount of $75,000, with an option to increase the principal amount by an additional $25,000 subject to customary conditions and approval of the lender(s) providing new commitment(s). The new credit facility provides for variable rates of interest based on the type of borrowing and the Company's debt to EBITDA financial ratio. The Amended and Restated Credit Agreement is guaranteed by certain of our U.S. subsidiaries. At April 30, 2011, we were in compliance with the covenants of the agreement. During fiscal 2011, we had borrowings of $18,000 and payments of $18,143, which includes $143 of interest under this credit facility. As of April 30, 2011, there were no outstanding balances due against the credit facility.
F-26
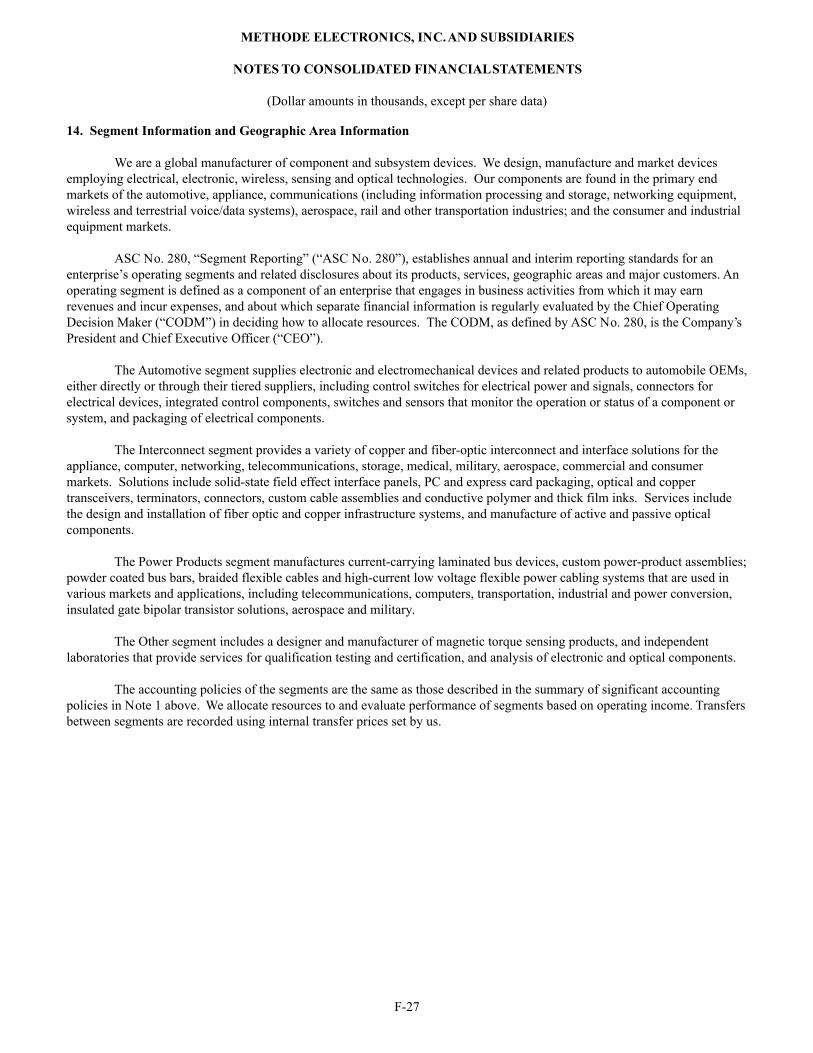
METHODE ELECTRONICS, INC. AND SUBSIDIARIES
NOTES TO CONSOLIDATED FINANCIAL STATEMENTS
(Dollar amounts in thousands, except per share data)
14. Segment Information and Geographic Area Information
We are a global manufacturer of component and subsystem devices. We design, manufacture and market devices employing electrical, electronic, wireless, sensing and optical technologies. Our components are found in the primary end markets of the automotive, appliance, communications (including information processing and storage, networking equipment, wireless and terrestrial voice/data systems), aerospace, rail and other transportation industries; and the consumer and industrial equipment markets.
ASC No. 280, “Segment Reporting” (“ASC No. 280”), establishes annual and interim reporting standards for an
enterprise’s operating segments and related disclosures about its products, services, geographic areas and major customers. An operating segment is defined as a component of an enterprise that engages in business activities from which it may earn revenues and incur expenses, and about which separate financial information is regularly evaluated by the Chief Operating Decision Maker (“CODM”) in deciding how to allocate resources. The CODM, as defined by ASC No. 280, is the Company’s President and Chief Executive Officer (“CEO”).
The Automotive segment supplies electronic and electromechanical devices and related products to automobile OEMs,
either directly or through their tiered suppliers, including control switches for electrical power and signals, connectors for electrical devices, integrated control components, switches and sensors that monitor the operation or status of a component or system, and packaging of electrical components.
The Interconnect segment provides a variety of copper and fiber-optic interconnect and interface solutions for the
appliance, computer, networking, telecommunications, storage, medical, military, aerospace, commercial and consumer markets. Solutions include solid-state field effect interface panels, PC and express card packaging, optical and copper transceivers, terminators, connectors, custom cable assemblies and conductive polymer and thick film inks. Services include the design and installation of fiber optic and copper infrastructure systems, and manufacture of active and passive optical components.
The Power Products segment manufactures current-carrying laminated bus devices, custom power-product assemblies;
powder coated bus bars, braided flexible cables and high-current low voltage flexible power cabling systems that are used in various markets and applications, including telecommunications, computers, transportation, industrial and power conversion, insulated gate bipolar transistor solutions, aerospace and military.
The Other segment includes a designer and manufacturer of magnetic torque sensing products, and independent
laboratories that provide services for qualification testing and certification, and analysis of electronic and optical components.
The accounting policies of the segments are the same as those described in the summary of significant accounting policies in Note 1 above. We allocate resources to and evaluate performance of segments based on operating income. Transfers between segments are recorded using internal transfer prices set by us.
F-27

METHODE ELECTRONICS, INC. AND SUBSIDIARIES
NOTES TO CONSOLIDATED FINANCIAL STATEMENTS
(Dollar amounts in thousands, except per share data)
The tables below presents information about our reportable segments:
Net salesTransfers between segmentsNet sales to unaffiliated customers
Income/(loss) from operationsInterest (income)/expense, netOther (income)/expense, netIncome/(loss) before income taxes
Depreciation and amortization
Identifiable assets
Fiscal Year Ended April 30, 2011
Automotive
$ 228,362(2,315)
$ 226,047
$ 13,325(311)
2,067$ 11,569
$ 7,704
$ 167,991
Inter-Connect
$ 139,877(1,096)
$ 138,781
$ 19,989(121)(593)
$ 20,703
$ 3,579
$ 122,687
PowerProducts
$ 50,768(353)
$ 50,415
$ 3,6301
174$ 3,455
$ 2,283
$ 42,330
Other
$ 13,052(71)
$ 12,981
$ (2,032)—4
$ (2,036)
$ 698
$ 8,726
Eliminations/Corporate
$ (3,844)3,835
$ (9)
$ (18,968)629
(368)$ (19,229)
$ 1,492
$ (6,990)
Consolidated
$ 428,215—
$ 428,215
$ 15,944198
1,284$ 14,462
$ 15,756
$ 334,744
Net salesTransfers between segmentsNet sales to unaffiliated customers
Segment income (loss) from operationsbefore restructuring charge, impairmentof goodwill and intangible assetsRestructuringSegment income (loss) from operationsInterest, (income)/expense, netOther (income)/expenseIncome/(loss) before income taxes
Depreciation and amortization
Identifiable assets
Fiscal Year Ended May 1, 2010
Automotive
$ 203,229—
$ 203,229
$ 16,971(5,649)
$ 11,322(87)232
11,177
$ 10,691
$ 127,613
Inter-Connect
$ 124,619(355)
$ 124,264
$ 12,589(1,552)
$ 11,037(185)925
10,297
$ 4,756
$ 125,133
PowerProducts
$ 40,871(342)
$ 40,529
$ 3,919(569)
$ 3,350—(7)
3,357
$ 1,672
$ 31,081
Other
$ 9,388(55)
$ 9,333
$ (2,298)—
$ (2,298)—1
(2,299)
$ 760
$ 7,659
Eliminations/Corporate
$ (461)752
$ 291
$ (15,970)—
$ (15,970)411
(1,666)(14,715)
$ 1,530
$ 19,337
Consolidated
$ 377,646—
$ 377,646
$ 15,211(7,770)
$ 7,441139
(515)$ 7,817
$ 19,409
$ 310,823
F-28

METHODE ELECTRONICS, INC. AND SUBSIDIARIES
NOTES TO CONSOLIDATED FINANCIAL STATEMENTS
(Dollar amounts in thousands, except per share data)
Net salesTransfers between segmentsNet sales to unaffiliated customers
Segment income (loss) from operationsbefore restructuring charge, impairmentof goodwill and intangible assetsRestructuringImpairment of goodwill and intangibleassetsSegment loss from operationsInterest (income)/expense, netOther (income)/expense, netLoss before income taxes
Depreciation and amortization
Identifiable assets
Fiscal Year Ended May 2, 2009
Automotive
$ 246,194—
$ 246,194
$ 25,503(19,283)
(30,466)$ (24,246)
8(287)
(23,967)
$ 17,408
$ 121,572
Inter-Connect
$ 132,190(952)
$ 131,238
$ 847(5,468)
(56,926)$ (61,547)
(526)(651)
(60,370)
$ 15,262
$ 115,085
PowerProducts
$ 43,146(399)
$ 42,747
$ 327(527)
(5,358)$ (5,558)
—190
(5,748)
$ 2,153
$ 23,925
Other
$ 8,355(103)
$ 8,252
$ (3,501)—
(1,624)$ (5,125)
—5
(5,130)
$ 1,019
$ 6,613
Eliminations/Corporate
$ (1,039)1,454
$ 415
$ (14,887)—
—$ (14,887)
(864)1,222
(15,245)
$ 1,194
$ 38,093
Consolidated
$ 428,846—
$ 428,846
$ 8,289(25,278)
(94,374)$ (111,363)
(1,382)479
$ (110,460)
$ 37,036
$ 305,288
F-29

METHODE ELECTRONICS, INC. AND SUBSIDIARIES
NOTES TO CONSOLIDATED FINANCIAL STATEMENTS
(Dollar amounts in thousands, except per share data)
The following table sets forth certain geographic financial information for fiscal years ended April 30, 2011, May 1, 2010 and May 2, 2009. Geographic net sales and income are determined based our sales and income from our various operational locations.
Net Sales:North AmericaAsia PacificMaltaEurope, excluding Malta
Income (loss) before income taxes:North AmericaAsia PacificEuropeIncome and expenses not allocated
Property, Plant and Equipment:North AmericaAsia PacificMaltaEurope, excluding Malta
Fiscal Year EndedApril 30,
2011
$ 172,082109,049136,74410,340
$ 428,215
$ (33,953)34,30614,307
(198)$ 14,462
$ 26,5057,867
26,939200
$ 61,511
May 1,2010
$ 168,12170,159
128,57410,792
$ 377,646
$ (18,183)14,65711,482
(139)$ 7,817
$ 23,0858,968
25,0424,781
$ 61,876
May 2,2009
$ 260,13753,541
103,03512,133
$ 428,846
$ (81,985)(30,610)
7531,382
$ (110,460)
$ 32,5897,523
24,5615,244
$ 69,917
15. Lease Commitments
We lease certain office and manufacturing properties under non-cancelable operating leases expiring at various dates through fiscal 2015. Rental expense under non-cancelable operating leases amounted to $4,313, $4,191 and $4,841 in fiscal 2011, 2010 and 2009, respectively.
Our aggregate minimum rental commitments under all non-cancelable operating leases are summarized in the table below for the next succeeding five fiscal years:
20122013201420152016
$ 2,4801,7971,301
611299
16. Pre-Production Costs Related to Long-Term Supply Arrangements
We incur pre-production tooling costs related to products produced for our customers under long-term supply agreements. We had $14,645 and $11,984 as of the fiscal year ended April 30, 2011 and May 1, 2010, respectively, of pre-production tooling costs related to customer-owned tools for which reimbursement is contractually guaranteed by the customer
F-30

METHODE ELECTRONICS, INC. AND SUBSIDIARIES
NOTES TO CONSOLIDATED FINANCIAL STATEMENTS
(Dollar amounts in thousands, except per share data)
or for which the customer has provided a non-cancelable right to use the tooling. The unreimbursed costs incurred related to customer-owned tooling, for which we have the right to use, that are not subject to reimbursement are capitalized and depreciated over the expected life of the tooling or the life of the related vehicle program, whichever is shorter. Engineering, testing and other costs incurred in the design and development of production parts are expensed as incurred, unless the costs are reimbursable, as specified in a customer contract. These amounts are included in our other assets section in the consolidated balance sheets. Net revenues and costs on projects are deferred and recognized over the life of the related long-term supply agreement. 17. Fair Value Measurements
Accounting standards define fair value based on an exit price model, establish a framework for measuring fair value where our assets and liabilities are required to be carried at fair values and provide for certain disclosures related to the valuation methods used within a valuation hierarchy as established by the accounting standards. The hierarchy prioritizes the inputs into three broad levels as follows:
• Level 1 — Quoted prices in active markets for identical assets and liabilities.
• Level 2 — Quoted prices in active markets for similar assets and liabilities, or other inputs that are observable for the asset or liability, either directly or indirectly, for substantially the full term of the financial instrument.
• Level 3 — Unobservable inputs that are supported by little or no market activity and that are significant to the fair value of the assets and liabilities. This includes certain pricing models, discounted cash flow methodologies and similar techniques that use significant unobservable inputs.
Below is a table that summarizes the fair value of assets and liabilities as of April 30, 2011:
Assets:Cash and cash equivalents (1)Assets related to deferred compensation planTotal assets at fair value
Liabilities:Liabilities related to deferred compensation planTotal liabilities at fair value
Fair Value Measurement Used
RecordedValue
$ 57,4454,051
$ 61,496
$ 3,085$ 3,085
Quoted prices in active
markets foridentical
instruments(Level 1)
$ 57,445—
$ 57,445
$ 3,085$ 3,085
Quoted prices in active
markets forsimilar
instruments(Level 2)
$ —4,051
$ 4,051
$ —$ —
Otherunobservable
inputs(Level 3)
$ ——
$ —
$ —$ —
______________________________________(1) Includes cash, money-market investments and certificates of deposit.
F-31

METHODE ELECTRONICS, INC. AND SUBSIDIARIES
NOTES TO CONSOLIDATED FINANCIAL STATEMENTS
(Dollar amounts in thousands, except per share data)
18. Summary of Quarterly Results of Operations (Unaudited)
The following is a summary of unaudited quarterly results of operations for the two years ended April 30, 2011 and May 1, 2010:
Net salesGross profit
Income/(loss) from continuing operations, net of taxIncome from discontinued operations, net of taxNet income/(loss) attributable to MethodeElectronics, Inc.
Basic income/(loss) per share:Continuing operationsDiscontinued operationsBasic income/(loss) per share
Diluted income/(loss) per share:Continuing operationsDiscontinued operationsDiluted income/(loss) per share
Fiscal 2011Quarter Ended
July 31
$ 98,97319,444
4,065—
$ 4,065
$ 0.11$ —$ 0.11
$ 0.11$ —$ 0.11
October 30
$ 107,71623,643
(513)—
$ (513)
$ (0.01)$ —$ (0.01)
$ (0.01)$ —$ (0.01)
January 29
$ 102,10219,434
5,883—
$ 5,883
$ 0.16$ —$ 0.16
$ 0.16$ —$ 0.16
April 30
$ 119,42426,652
9,410655
$ 10,065
$ 0.25$ 0.02$ 0.27
$ 0.24$ 0.02$ 0.26
Net salesGross profitNet income/(loss) attributable to MethodeElectronics, Inc.Net income/(loss) per basic common share
Fiscal 2010Quarter Ended
August 1
$ 91,16320,254
(19)$ —
October 31
$ 99,56821,784
2,052$ 0.05
January 30
$ 90,24315,319
(4,475)$ (0.12)
May 1
$ 96,67222,578
16,097$ 0.44
Significant Items for Fiscal 2011
The second quarter of fiscal 2011 includes a pre-tax charge of $3,834 for litigation regarding unsecured claims related to the Delphi bankruptcy. The litigation was settled in the third quarter of fiscal 2011for $2,068, resulting in a reversal of expense of $1,766. The fourth quarter of fiscal 2011 includes an after tax gain on the sale of a business of $655. In addition, the first, second, third and fourth quarter of fiscal 2011 includes pre-tax legal fees relating to the Delphi supply agreement and patent lawsuit of $1,474, $924, $1,123 and $1,247, respectively.
Significant Items for Fiscal 2010
The first, second, third and fourth quarters of fiscal 2010 include a pre-tax restructuring charge of $3,611, $3,156, $559 and $444, respectively. In addition, the first, second, third and fourth quarters of fiscal 2010 include pre-tax legal fees relating to the Delphi supply agreement and patent lawsuit of $440, $1,489, $2,356 and $1,481, respectively.
F-32

METHODE ELECTRONICS, INC. AND SUBSIDIARIES
NOTES TO CONSOLIDATED FINANCIAL STATEMENTS
(Dollar amounts in thousands, except per share data)
Significant Items for Fiscal 2009
The first, second, third and fourth quarters of fiscal 2009 include a pre-tax restructuring charge of $4,917, $6,284, $3,796 and $10,281, respectively. In addition, the third and fourth quarters of fiscal 2009 include impairment charges for goodwill and intangible assets write-down of $32,678 and $61,696, respectively.
F-33

SCHEDULE II—VALUATION AND QUALIFYING ACCOUNTS
METHODE ELECTRONICS, INC. AND SUBSIDIARIES
(in thousands)
COL. A
Description
YEAR ENDED APRIL 30,2011:
Reserves and allowancesdeducted from asset accounts:
Allowance for uncollectibleaccountsDeferred tax valuationallowance
YEAR ENDED MAY 1, 2010:Reserves and allowancesdeducted from asset accounts:
Allowance for uncollectibleaccountsDeferred tax valuationallowance
YEAR ENDED MAY 2, 2009:Reserves and allowancesdeducted from asset accounts:
Allowance for uncollectibleaccountsDeferred tax valuationallowance
COL. B
Balance at Beginning of
Period
$ 1,102
48,402
$ 1,444
51,377
$ 2,309
31,164
COL. CAdditions
Charged to Costs and Expenses
$ 249
7,088
$ 142
943
$ 120
27,506
Charged to Other Accounts—
Describe
$ 304
582
$ 25
1,880
$ 625
(7,293)
(1)
(1)
(1)
(1)
(1)
(1)
COL. D.
Deductions—Describe
$ 515
2,057
$ 509
5,798
$ 360
(2)
(2)
(3)
(2)
COL. E
Balance at End of Period
$ 1,140
54,015
$ 1,102
48,402
$ 1,444
51,377
______________________________________(1) Impact of foreign currency translation and other reclassifications.(2) Uncollectible accounts written off, net of recoveries.(3) Reduction of valuation allowances on foreign tax assets with no effect on net income.
F-34

INDEX TO EXHIBITS
Exhibit Number
3.13.24.1
4.2
10.1*
10.2*10.3*10.4*
10.5
10.6
10.7*
10.8*
10.9
10.10*
10.11*
10.12*
10.13*
10.14*
10.15*
10.16*10.17*
10.18*
10.19
10.20*
10.21*
10.22*
10.23*10.24*
Description
Certificate of Incorporation of Registrant, as amended and currently in effect (1)
Bylaws of Registrant, as amended and currently in effect (26)
Article Fourth of Certificate of Incorporation of Registrant, as amended and currently in effect (included in Exhibit 3.1) (1)
Rights Agreement dated as of January 8, 2004 between Methode Electronics, Inc. and Mellon Investor Services LLC, which includes as Exhibit A thereto, the Certificate of Designation of Series A Junior Participating Preferred Stock of Methode Electronics, Inc.; as Exhibit B thereto, the Form of Right Certificate; as Exhibit C thereto, the Summary of Rights to Purchase Preferred Shares. (2)
Methode Electronics, Inc. Managerial Bonus and Matching Bonus Plan (also referred to as the Longevity Contingent Bonus Program) (3)
Methode Electronics, Inc. 2000 Stock Plan (4)
Methode Electronics, Inc. 2004 Stock Plan (5)
Form of Methode Electronics, Inc. Restricted Stock Award Agreement (Executive Award/Cliff Vesting) under the 2000 Stock Plan (23)
Credit Agreement dated as of December 19, 2002 among Methode Electronics, Inc. as the Borrower, Bank of America, N.A., as Administrative Agent and L/C Issuer, and The Other Lenders Party Thereto (7)
Amendment to Credit Agreement dated as of November 2005 among Methode Electronics, Inc. as the Borrower, Bank of America, N.A., as Administrative Agent and L/C Issuer, and The Other Lenders Party Thereto (6)
Form of Methode Electronics, Inc. Restricted Stock Award Agreement (Outside Director) under the 2004 Stock Plan (8)
Form of Methode Electronics, Inc. Restricted Stock Award Agreement (Executive Award/Performance Based) under the 2004 Stock Plan (8)
Amendment to Credit Agreement dated as of January 31, 2006, among Methode Electronics, Inc., the Borrower, Bank of America, N.A., as Administrative Agent, and L/C Issuer, and The Other Lenders Party Thereto (9)
Change in Control Agreement dated September 1, 2006 between Methode Electronics, Inc. and Donald W. Duda (10)
Change in Control Agreement dated September 1, 2006 between Methode Electronics, Inc. and Douglas A. Koman (10)
Change in Control Agreement dated September 1, 2006 between Methode Electronics, Inc. and Thomas D. Reynolds (10)
Change in Control Agreement dated September 1, 2006 between Methode Electronics, Inc. and Paul E. Whybrow (10)
Change in Control Agreement dated September 14, 2006 between Methode Electronics, Inc. and Theodore P. Kill (11)
Change in Control Agreement dated September 14, 2006 between Methode Electronics, Inc. and Timothy R. Glandon (11)
First Amendment to Methode Electronics, Inc. 2000 Stock Plan effective as of December 14, 2006 (12)
Amended and Restated Restricted Stock Unit Award Agreement (Executive Award/Performance Based) effective as of June 18, 2004 between Methode Electronics, Inc. and Donald W. Duda (12)
Amended and Restated Restricted Stock Unit Award Agreement (Executive Award/Cliff Vesting) effective as of June 18, 2004 between Methode Electronics, Inc. and Donald W. Duda (12)
Waiver and Amendment dated as of February 28, 2007 among Methode Electronics, Inc., the Borrower, Bank of America, N.A., as Administrative Agent, and L/C Issuer, and The Other Lenders Party Thereto (13)
Amended Cash Bonus Agreement effective as of April 6, 2007 between Methode Electronics, Inc. and Donald W. Duda (14)
Amended and Restated Restricted Stock Unit Award Agreement (Executive Award/Performance Based) effective as of June 15, 2005 between Methode Electronics, Inc. and Donald W. Duda (14)
Amended and Restated Restricted Stock Unit Award Agreement (Executive Award/Performance Based) effective as of August 7, 2006 between Methode Electronics, Inc. and Donald W. Duda (14)
Methode Electronics, Inc. 2007 Stock Plan (15)
Form Performance Based RSA Award Agreement (15)

Exhibit Number
Description
10.25*10.26*10.27*
10.28*
10.2910.30*10.31*10.32*10.33*10.34*10.35*10.36*10.37*10.38*10.39*10.40*
10.41
10.42
2123
31.131.232
Form Annual Cash Bonus Award Agreement (15)
Form RSA Tandem Cash Award Agreement (15)
Form Director RSA Award Agreement (15)
Change in Control Agreement dated July 15, 2008 between Methode Electronics, Inc. and Ronald L. G. Tsoumas (17)
Fourth Amendment and Waiver to Credit Agreement, effective as of May 2, 2009, among the Company as the Borrower, Bank of America, N.A. (19)
Form of Methode Electronics, Inc. Restricted Stock and Tandem Cash Award Cancellation Agreement (20)
Form of Non-Qualified Stock Option Award Agreement (21)
Form of Amendment to Change in Control Agreement (22)
Methode Electronics, Inc. 2010 Cash Incentive Plan (24)
Methode Electronics, Inc. 2010 Stock Plan (24)
Form of Methode Electronics, Inc. Non-Qualified Stock Option Form Award Agreement (24)
Form of Methode Electronics, Inc. Performance Based Restricted Stock Form Award Agreement (25)
Form of Methode Electronics, Inc. Restricted Stock Unit Form Award Agreement (25)
Form of Methode Electronics, Inc. RSA Tandem Cash Award Form Award Agreement (25)
Form of Methode Electronics, Inc. Cash Bonus Form Award Agreement (25)
Form of Methode Electronics, Inc. Form of Amendment to Change in Control Agreement (25)
Amendment to Credit Agreement, dated as of January 28, 2011, among the Company as the Borrower, Bank of America, N.A., as Administrative Agent and L/C issuer, and the Other Lenders party hereto (27)
Amended and Restated Credit Agreement dated as of February 25, 2011 among Methode Electronics, Inc. as the Borrower, Bank of America N.A., as Administrative Agent and Other Lenders party thereto (18)
Subsidiaries of Methode Electronics, Inc.Consent of Ernst & Young LLPRule 13a-14(a)/15d-14(a) Certification of Principal Executive OfficerRule 13a-14(a)/15d-14(a) Certification of Principal Financial OfficerCertification of Periodic Financial Report Pursuant to 18 U.S.C. Section 1350
____________________________________________(1) Previously filed with Registrant’s Form 8-K filed January 9, 2004, and incorporated herein by reference.(2) Previously filed with Registrant’s Form 8-A filed January 8, 2004, and incorporated herein by reference.(3) Previously filed with Registrant’s Form 10-K for the year ended April 30, 2005, and incorporated herein by
reference.(4) Previously filed with Registrant’s Form 10-Q for the three months ended October 31, 2000, and incorporated
herein by reference.(5) Previously filed with Registrant’s Form 8-K filed December 7, 2004, and incorporated herein by reference.(6) Previously filed with Registrant’s Form 10-Q for the three months ended October 31, 2005, and incorporated
herein by reference.(7) Previously filed with Registrant’s Form 10-Q for the three months ended January 31, 2003, and incorporated
herein by reference.(8) Previously filed with Registrant’s Form 8-K filed August 11, 2006, and incorporated herein by reference.(9) Previously filed with Registrant’s Form 8-K filed February 3, 2006, and incorporated herein by reference.(10) Previously filed with Registrant’s Form 8-K filed September 6, 2006, and incorporated herein by reference.(11) Previously filed with Registrant’s Form 8-K filed September 18, 2006, and incorporated herein by reference.(12) Previously filed with Registrant’s Form 10-Q for the three months ended January 27, 2007, and incorporated
herein by reference.(13) Previously filed with Registrant’s Form 8-K filed March 12, 2007, and incorporated herein by reference.(14) Previously filed with Registrant’s Form 8-K filed April 6, 2007, and incorporated herein by reference.(15) Previously filed with Registrant’s Form 8-K filed September 19, 2007, and incorporated herein by reference.(16) Previously filed with Registrant’s Form 8-K filed November 2, 2007, and incorporated herein by reference.(17) Previously filed with Registrant’s Form 10-K filed July 17, 2008, and incorporated herein by reference.

(18) Previously filed with Registrant’s Form 10-Q filed March 3, 2011, and incorporated herein by reference.(19) Previously filed with Registrant’s Form 10-Q for the three months ended August 1, 2009, and incorporated
herein by reference.(20) Previously filed with Registrant’s Form 8-K filed December 18, 2009, and incorporated herein by reference.(21) Previously filed with Registrant’s Form 8-K filed July 9, 2009, and incorporated herein by reference.(22) Previously filed with Registrant’s Form 8-K filed July 20, 2009, and incorporated herein by reference.(23) Previously filed with Registrant’s Form 10-Q for the three month ended October 31, 2004, and incorporated
herein by reference.(24) Previously filed with Registrant's Form 8-K filed October 20, 2010, and incorporated herein by reference.(25) Previously filed with Registrant's Form 8-K filed November 12, 2010, and incorporated herein by reference.(26) Previously filed with Registrant's Form 8-K filed December 17, 2010, and incorporated herein by reference.(27) Previously filed with Registrant's Form 8-K filed February 1, 2011, and incorporated herein by reference.
________________________________________* Management Compensatory Plan

Exhibit 21
SUBSIDIARIES OF METHODE ELECTRONICS, INC.
Subsidiary (1)
ABAS, Inc.Automotive Safety Technologies, Inc.Cableco Technologies, Inc.Duel Systems, Inc.Eetrex, Inc.Hetronic International, Inc.Hetronic USA, Inc.Hetronic Asia Holding, Inc.Hetronic Asia Manufacturing and Trading Corporation.Hetronic Swiss AGKBA, Inc.Magna-Lastic Devices, Inc.Methode Development CompanyMethode Electronics Aftermarket, Ltd.Methode Electronics Asia Pte, Ltd.Methode Electronics Connectivity Technologies, Inc.Methode Electronics Europe, LimitedMethode Electronics Far East Pte., Ltd.Methode Electronics India, Private Ltd.Methode Electronics International GmbHMethode Electronics Ireland LimitedMethode Electronics Malta Holdings LtdMethode Electronics Malta Ltd.Methode Electronics MediterraneanMethode Electronics (Shanghai) Co. Ltd.Methode Electronics U.K. Ltd.Methode Mexico, S.A. de C.V.Methode Middle East, S.A.L.TouchSensor Technolgies, L.L.C.Trace Laboratories, Inc.Value Engineered Products, Inc.
Jurisdiction of Incorporation
DelawareDelawareDelawareDelawareDelawareDelawareDelawareDelaware
The PhilippinesSwitzerlandDelawareDelawareDelaware
MaltaSingaporeDelaware
United KingdomSingapore
IndiaGermanyIrelandMaltaMaltaMaltaChina
United KingdomMexicoLebanonDelawareDelawareDelaware
(1) All subsidiaries are 100% owned, except Eetrex, which is 70% owned and Hetronic Swiss which is 67% owned.

Exhibit 23
Consent of Independent Registered Public Accounting Firm
We consent to the incorporation by reference in the following Registration Statements:
(1) Registration Statement (Form S-8 No. 333-170959) pertaining to the Methode Electronics, Inc. 2010 Stock Plan,
(2) Registration Statement (Form S-8 No. 333-146709) pertaining to the Methode Electronics, Inc. 2007 Stock Plan,
(3) Registration Statement (Form S-8 No. 333-121090) pertaining to the Methode Electronics, Inc. 2004 Stock Plan,
(4) Registration Statement (Form S-8 No. 333-71042) pertaining to the Methode Electronics, Inc. 2000 Stock Plan, (5) Registration Statement (Form S-8 No. 333-48356) pertaining to the Methode Electronics, Inc. 401(k) Savings
Plan, (6) Registration Statement (Form S-3 No. 333-123806) of Methode Electronics, Inc.
of our reports dated June 30, 2011, with respect to the consolidated financial statements and schedule of Methode Electronics, Inc. and Subsidiaries and the effectiveness of internal control over financial reporting of Methode Electronics, Inc. and Subsidiaries included in this Annual Report (Form 10-K) of Methode Electronics, Inc. for the year ended April 30, 2011.
/s/ Ernst & Young LLP
Chicago, IllinoisJune 30, 2011

Exhibit 31.1Certification of Chief Executive Officer
Pursuant to Section 302 of the Sarbanes-Oxley Act of 2002
I, Donald W. Duda certify that:
1. I have reviewed this annual report on Form 10-K of Methode Electronics, Inc.;
2. Based on my knowledge, this report does not contain any untrue statement of a material fact or omit to state a material fact necessary to make the statements made, in light of the circumstances under which such statements were made, not misleading with respect to the period covered by this report;
3. Based on my knowledge, the financial statements, and other financial information included in this report, fairly present in all material respects the financial condition, results of operations and cash flows of the registrant as of, and for, the periods presented in this report;
4. The registrant's other certifying officer and I are responsible for establishing and maintaining disclosure controls and procedures (as defined in Exchange Act Rules 13a-15(e) and 15d-15(e)) and internal control over financial reporting (as defined in Exchange Act Rules 13a-15(f) and 15d-15(f)) for the registrant and have:
a) Designed such disclosure controls and procedures, or caused such disclosure controls and procedures to be designed under our supervision, to ensure that material information relating to the registrant, including its consolidated subsidiaries, is made known to us by others within those entities, particularly during the period in which this report is being prepared;
b) Designed such internal control over financial reporting, or caused such internal control over financial reporting to be designed under our supervision, to provide reasonable assurance regarding the reliability of financial reporting and the preparation of financial statements for external purposes in accordance with generally accepted accounting principles;
c) Evaluated the effectiveness of the registrant's disclosure controls and procedures and presented in this report our conclusions about the effectiveness of the disclosure controls and procedures, as of the end of the period covered by this report based on such evaluation; and
d) Disclosed in this report any change in the registrant's internal control over financial reporting that occurred during the registrant's most recent fiscal quarter (the registrant's fourth fiscal quarter in the case of an annual report) that has materially affected, or is reasonably likely to materially affect, the registrant's internal control over financial reporting; and
5. The registrant's other certifying officer and I have disclosed, based on our most recent evaluation of internal control over financial reporting, to the registrant's auditors and the audit committee of the registrant's board of directors (or persons performing the equivalent functions):
a) All significant deficiencies and material weaknesses in the design or operation of internal control over
financial reporting which are reasonably likely to adversely affect the registrant's ability to record, process, summarize and report financial information; and
b) Any fraud, whether or not material, that involves management or other employees who have a significant role in the registrant's internal control over financial reporting.
Dated:
June 30, 2011
/s/ Donald W. DudaChief Executive Officer(principal executive officer)

Exhibit 31.2Certification of Chief Executive Officer
Pursuant to Section 302 of the Sarbanes-Oxley Act of 2002
I, Douglas A. Koman certify that:
1. I have reviewed this annual report on Form 10-K of Methode Electronics, Inc.;
2. Based on my knowledge, this report does not contain any untrue statement of a material fact or omit to state a material fact necessary to make the statements made, in light of the circumstances under which such statements were made, not misleading with respect to the period covered by this report;
3. Based on my knowledge, the financial statements, and other financial information included in this report, fairly present in all material respects the financial condition, results of operations and cash flows of the registrant as of, and for, the periods presented in this report;
4. The registrant's other certifying officer and I are responsible for establishing and maintaining disclosure controls and procedures (as defined in Exchange Act Rules 13a-15(e) and 15d-15(e)) and internal control over financial reporting (as defined in Exchange Act Rules 13a-15(f) and 15d-15(f)) for the registrant and have:
a) Designed such disclosure controls and procedures, or caused such disclosure controls and procedures to be designed under our supervision, to ensure that material information relating to the registrant, including its consolidated subsidiaries, is made known to us by others within those entities, particularly during the period in which this report is being prepared;
b) Designed such internal control over financial reporting, or caused such internal control over financial reporting to be designed under our supervision, to provide reasonable assurance regarding the reliability of financial reporting and the preparation of financial statements for external purposes in accordance with generally accepted accounting principles;
c) Evaluated the effectiveness of the registrant's disclosure controls and procedures and presented in this report our conclusions about the effectiveness of the disclosure controls and procedures, as of the end of the period covered by this report based on such evaluation; and
d) Disclosed in this report any change in the registrant's internal control over financial reporting that occurred during the registrant's most recent fiscal quarter (the registrant's fourth fiscal quarter in the case of an annual report) that has materially affected, or is reasonably likely to materially affect, the registrant's internal control over financial reporting; and
5. The registrant's other certifying officer and I have disclosed, based on our most recent evaluation of internal control over financial reporting, to the registrant's auditors and the audit committee of the registrant's board of directors (or persons performing the equivalent functions):
a) All significant deficiencies and material weaknesses in the design or operation of internal control over
financial reporting which are reasonably likely to adversely affect the registrant's ability to record, process, summarize and report financial information; and
b) Any fraud, whether or not material, that involves management or other employees who have a significant role in the registrant's internal control over financial reporting.
Dated:
June 30, 2011
/s/ Douglas A. KomanChief Financial Officer(principal executive officer)

Exhibit 32
METHODE ELECTRONICS, INC.
Certification of Periodic Financial Report
Pursuant to 18 U.S.C. Section 1350
Pursuant to 18 U.S.C. Section 1350, as adopted pursuant to Section 906 of the Sarbanes-Oxley Act of 2002, each of the undersigned officers of Methode Electronics, Inc. (the “Company”) certifies that the Annual Report on Form 10-K of the Company for the year ended April 30, 2011 fully complies with the requirements of Section 13(a) or 15(d) of the Securities Exchange Act of 1934 and information contained in that Form 10-K fairly presents, in all material respects, the financial condition and results of operations of the Company.
Dated: June 30, 2011
Dated: June 30, 2011
/s/ Donald W. DudaDonald W. DudaPresident and Chief Executive Officer
/s/ Douglas A. KomanDouglas A. KomanChief Financial Officer
A signed original of this written statement required by Section 906 has been provided to the Company and will be retained by the Company and furnished to the Securities and Exchange Commission or its staff upon request.

Comparison of Five-Year Cumulative Total Returns Performance Graph for
METHODE ELECTRONICS, INC.
The following graph sets forth a five-year comparison of the cumulative total stockholder returns for the following: (1) Methode’s common stock; (2) the NYSE Stock Market (US Companies) index; (3) a previously used custom peer group of publicly traded companies; and (4) a custom peer group that management believes better reflects the business and prospects of Methode Electronics.
The “New Peer Group” includes companies that design and manufacture electrical and electronic devices, sub-assemblies, sensors and controls for the automotive, computer, communications systems, and other markets. The New Peer Group includes the companies in the Old Peer Group, as well as four other companies added following the acquisitions of Merix Corp. and Nu Horizons Electronics, Corp., as noted below. The New Peer Group consists of the following companies: Bel Fuse, Inc., CTS Corp., Franklin Electric Co., Inc., Gentex Corp., LaBarge, Inc., Littelfuse, Inc., Powell Industries, Pulse Electronics Corp., Richardson Electronics, Inc., Rogers Corp., Semtech Corp., SL Industries, Inc., Standard Motor Products, Inc., and Stoneridge, Inc.
The “Old Peer Group” consists of the following companies: CTS Corp., Franklin Electric Co., Inc., Gentex Corp., LaBarge, Inc., Littelfuse, Inc., Powell Industries, Richardson Electronics, Inc., Rogers Corp., Standard Motor Products, Inc., and Stoneridge, Inc. The Old Peer Group no longer includes Merix Corp. and Nu Horizons Electronics, Corp., as both were acquired in 2010.
0
20
40
60
80
100
120
140
160
201120102009200820072006
NYSE Stock Market (US Companies)
2006 2007 2008 2009 2010 2011Methode Electronics, Inc. 100.00 164.01 119.15 67.98 125.60 143.02 NYSE Stock Market (US Companies) 100.00 117.08 112.30 71.42 99.52 118.32Old Peer Group 100.00 108.50 102.11 66.99 111.53 154.93New Peer Group 100.00 104.77 98.34 60.99 97.39 134.92
Methode Electronics, Inc.NYSE Stock Market (US Companies)Old Peer GroupNew Peer Group
$180
New Peer Group
Old Peer Group

Walter J. AspatoreChairman Emeritus and Co-Founder of Amherst Partners, LLC
Director since 2008Audit committeeTechnology committee
Warren L. BattsChairman of the Board, Methode Electronics, Inc.
Retired Chairman and Chief Executive Officer, Tupperware Corporation
Director since 2001Compensation committeeNominating and Governance committee
Dr. J. Edward ColgateAllen and Johnnie Breed University Professor of Design, Northwestern University
Director since 2004Nominating and Governance committeeTechnology committee*
Dr. Darren M. DawsonMcQueen Quattlebaum Professor, Holcombe Department of Electrical and Computer Engineering, Clemson University
Director since 2004Compensation committeeTechnology committee
Donald W. DudaPresident and Chief Executive Officer, Methode Electronics, Inc.
Director since 2001
Donald W. Duda President and Chief Executive Officer
Timothy R. GlandonVice President and General Manager, North American Automotive Operations
Joseph E. KhouryVice President, Methode Europe
Stephen F. GatesSenior Counsel, Mayer Brown LLPDirector since 2010Audit committeeNominating and Governance committee
Isabelle C. GoossenVice President for Finance and Administration, Chicago Symphony Orchestra Association
Director since 2004Audit committeeCompensation committeeTechnology committee
Christopher J. HornungChief Executive Officer, Next Testing, Inc. Director since 2004Compensation committeeNominating and Governance committee*Technology committee
Paul G. SheltonRetired Vice President and Chief Financial Officer, FleetPride, Inc.
Director since 2004Audit committeeCompensation committee*
Lawrence B. SkatoffRetired Executive Vice President and Chief Financial Officer, BorgWarner, Inc.
Director since 2004Audit committee*Nominating and Governance committee
BOARD OF DIRECTORS
CORPORATE EXECUTIVES
S H A R E H O L D E R I N F O R M AT I O N
Transfer Agent and RegistrarContinental Stock Transfer & Trust Co.17 Battery Place8th FloorNew York, NY 10004212-509-4000Toll-Free 800-509-5586 www.continentalstock.com
Corporate CounselLocke Lord Bissell & Liddell LLP111 South Wacker DriveChicago, IL 60606
Independent AuditorsErnst & Young LLP155 North Wacker DriveChicago, IL 60606
Corporate HeadquartersMethode Electronics, Inc.7401 West Wilson AvenueChicago, IL 60706708-867-6777Toll-Free 877-316-7700www.methode.com
Annual MeetingThe Annual Meeting of Shareholders will be held at 11:00 A .M. Central Time on September 15, 2011, at: Methode Electronics, Inc. 7401 West Wilson Avenue Chicago, IL 60706
MarketThe shares are traded on the New York Stock Exchange under the symbol MEI.
Theodore P. KillVice President, Worldwide Automotive Sales
Douglas A. KomanVice President, Corporate Finance and Chief Financial Officer
Thomas D. ReynoldsSenior Vice President andChief Operating Officer
Ronald L. G. TsoumasTreasurer and Controller
*Committee Chairperson

Corporate Headquarters7401 West Wilson AvenueChicago, Illinois 60706Phone: (708) 867-6777Fax: (708) 867-3288
www.methode.com
U N I T E D S TA T E S
Automotive Electronic ControlsManufacturing Plant111 West Buchanan StreetCarthage, IL 62321
Automotive Electronic ControlsSales and Engineering Office24585 Evergreen RoadSouthfield, MI 48075
Connectivity Technologies, Inc.1111 Digital DriveRichardson, TX 75081
dataMate Products7401 West Wilson AvenueChicago, IL 60706
Hetronic International, Inc. andHetronic USA, Inc.3905 NW 36th Street Oklahoma City, OK 73112
Magna-lastic Devices, Inc.7401 West Wilson AvenueChicago, IL 60706
I N T E R N AT I O N A L
Methode Development Company7401 West Wilson AvenueChicago, IL 60706
Power Solutions GroupSales and Engineering Office1750 Junction Avenue, Suite 150San Jose, CA 95112
Power Solutions Group1700 Hicks RoadRolling Meadows, IL 60008
TouchSensor Technologies, LLC203 North Gables BoulevardWheaton, IL 60187
Trace Laboratories, Inc.1150 West Euclid Avenue Palatine, IL 60067and 5 North Park DriveHunt Valley, MD 21030
Hetronic Asia Manufacturing & Trading Corp.
Laguna Technopark 121 East Main Avenue L4, P5 Binan, Laguna Philippines
Hetronic Malta Mriehel Industrial EstateMriehel QRM09Malta
Methode Electronics International GmbH
Rhein Strasse 4855435 Gau-AlgesheimGermany
Methode Electronics U.K., Ltd.Design Office Prestige Park Active Way Burnley, Lancashire BB11 1BSEngland
Methode Mexico, S.A. de C.V.Calle Spectrum #200 Suite “D”Parque Industrial Finsa-MonterreyApodaca, Nuevo Leon, C.P. 66600Mexico
Methode Electronics Far East Pte., Ltd.60 Alexandra Terrace#02-09A The ComtechSingapore 118502
Methode Electronics India Private LimitedRaj Driva, 99/A 3rd Floor, 5th BlockKHB Colony, KoramangalaBangalore, India 560095
Methode Electronics Malta, Ltd.Mriehel Industrial EstateMriehel QRM09Malta
Methode Electronics (Shanghai) Co., Ltd.Interconnect OperationsNo. 40B (T40B-7) No. 1765 Jin Qiao Export Processing ZonePudong Shanghai 201206People’s Republic of China
Methode Electronics (Shanghai) Co., Ltd.Automotive and Power Products
211 Qin Qiao RoadBuilding T71-5 EastJin Qiao Export Processing ZonePudong Shanghai 201206People’s Republic of China
M E T H O D E E L E C T R O N I C S , I N C . B U S I N E S S U N I T S