Embed Size (px)
Citation preview

INTERNATIONAL SEED TESTING ASSOCIATION (ISTA) Secretariat, Zürichstrasse 50, 8303 Bassersdorf, CH-Switzerland Phone: +41-44-838 60 00, Fax: +41-44-838 60 01, Email: [email protected], http://www.seedtest.org
Document OGM18-07
Method Validation Reports on Rules Proposals for the International Rules for Seed Testing 2019 Edition Validation study for Eustoma exaltatum (L.) Salisb. ex G. Don to support Rules proposals B.1.1 .......... 2
Validation study for Felicia heterophylla (Cass.) Grau to support Rules proposals B.1.2 ..................... 13
Validation study to support the germination method for dormant seed lots of Raphanus sativus proposal C.5.1. ....................................................................................................................................... 24
Validation study to support a modification to the evaluation criteria for normal seedlings of Spinacia oleracea Rules proposal C.5.3. .............................................................................................................. 32
Validation study to use bio-PCR and seed extract PCR for pre-screening in the detection of Xanthomonas campestris pv. campestris and pv. raphani in Brassica seed; supporting the proposal C.7.1 to modify Seed Health Method 7-019a. ....................................................................................... 51
Validation study to add TaqMan PCR as an option to the conventional PCR test for the identification of Xanthomonas campestris pv. campestris and pv. raphani in Brassica seed supporting the proposal C.7.1 to modify Seed Health Method 7-019a. ..................................................................................... 112
Validation study for the addition of Cicer arietinum (Desi type) as a species to which the conductivity test for seed vigour can be applied to support Rules proposal C.15.1 ............................................... 152

ISTA Method validation reports for 2019 Edition of ISTA Rules
OGM18-07 ISTA Method Validation Reports Page 2/164 Approved ECOM Decision 18025
Validation study for Eustoma exaltatum (L.) Salisb. ex G. Don to support Rules proposals B.1.1 1 Rita Zecchinelli and 2Anton Grim
1CREA DC - Sede di Tavazzano - Via Emilia km 307 - 26838 Tavazzano (LO) Italy ([email protected]) 2 NAKTUINBOUW – Sotaweg 22 - 2371 GD Roelofarendsveen - The Netherlands ([email protected])
Abstract
The object of this validation study was to provide thousand seed weight data to support a %purity working sample weight proposal and introduce a seed germination test method for Eustoma exaltatum (L.) Salisb. ex G. Don, a new species to be introduced into the ISTA Rules. Based on the thousand seed weight values a percentage purity test working sample weight of 0.2g was recommended for Table 2A to ensure 2 500 seeds are tested. Six ISTA laboratories from five different countries participated in the study using three seed lots and three test methods. The test methods were: Top of Paper (TP), at either 20, 25 or 20<=>30°C with a first count at 4-7 days and final count at 21 days; together with the recommendation to use light. The statistical analysis included all the germination results obtained by all the participants and showed the repeatability and reproducibility for the three methods. Based on the results of the statistical analysis one laboratory was excluded from the analysis due to inter-laboratory variability. The germination method for Eustoma exaltatum that gave acceptable repeatability and reproducibility values and is therefore proposed to be included in the ISTA Rules as a new germination method for Chapter 5, Table 5A, part 3 is: TP; 20 <=> 30 °C; first count 7 days, final count 21 days, with the recommendation to use light. Introduction
Eustoma exaltatum is an herbaceous annual species belonging to the family Gentianaceae, native to the warm areas of Americas, where it is a well-known native species. It is an annual plant, known with the common names lisianthus and prairie gentian. The genus name derives from the Greek words eu (good) and stoma (mouth). The name reflects the wide opening of the corolla tube which is typical for lisianthus flowers. Indeed, even lisianthus comes from the ancient Greek and lissos means smooth, anthos means flower. Lisianthus is cultivated mainly as a cut flower, but can be used as a potted and bedding plant as well. The inclusion of the validation study in the 2013-2016 working programme of the ISTA Flower Seed Testing Committee (FSC) was approved by the members and Anton Grim from the Naktuinbouw laboratory in The Netherlands accepted to organize the study as test leader. For the validation study, three seed samples were used. Basing on the information provided by the experienced laboratories of the FSC members, the FSC approved the proposal of the test leader to focus on the three following testing methods, where the temperature regime represented the only difference between the three.

ISTA Method validation reports for 2019 Edition of ISTA Rules
OGM18-07 ISTA Method Validation Reports Page 3/164 Approved ECOM Decision 18025
TP; 20°C (first count 4-7 days; final count: 21 days). Additional treatment: Light recommended TP; 25°C (first count 4-7 days; final count: 21 days). Additional treatment: Light recommended TP; 20 <=>30°C (first count 4-7 days; final count: 21 days). Additional treatment: Light recommended The validation study was performed through a multi-laboratory comparative test, which took place in 2016. Results of the laboratories are here reported anonymously.
Material and methods
Seed material Three samples of untreated seed of Eustoma exaltatum were used in the study, all originated from The Netherlands. The three samples were drawn from commercial lots intended for marketing. Participant laboratories Six laboratories participated in the study: Sakata Seed (Japan), Starke Ayres (South Africa), CREA-DC (Italy), Vulcani Center (Israel), Naktuinbouw (The Netherlands), Takii Europe (The Netherlands). The test was organized by Anton Grim (Naktuinbouw, The Netherlands). Additional treatments No additional treatments were used, but the participants were asked to germinate the seed in the light. This suggestion came from the test leader. Germination method For each test and sample, 400 seeds were tested in replicates of 100 or 50 seeds. Top of Paper (TP) was used as the substrate, three temperature regimes were investigated, constant temperature of 20 °C and 25°C, alternating temperature of 20 °C (for 16 hours) and 30 °C (for 8 hours). Following the test plan, germination counts were made after 4 or 7 days (first count) and 21 days (final count). Participants were asked to base the evaluation of the seedlings on seedling group A-2-1-1-1, the same approved for Gentiana belonging to the same family Gentianaceae. The participants were asked to provide a description of the abnormal seedlings.
Results Thousand seed weight The thousand seed weights (TSW) for 30 Eustoma exaltatum seed lots ranged between 0.0255 and 0.0600g (Table 1), therefore the range for the weight of 2 500 seeds was 0.06 to 0.15g. A percentage purity test working sample weight of 0.2g was recommended to ensure 2 500 seeds are tested.

ISTA Method validation reports for 2019 Edition of ISTA Rules
OGM18-07 ISTA Method Validation Reports Page 4/164 Approved ECOM Decision 18025
Table 1: Thousand seed weights (TSW) for 30 seed lots. Source Lot Year TSW (g)
Source Lot Year TSW (g)
Lab 1 1 2017 0.0421
Lab 1 16 2017 0.0379
Lab 1 2 2017 0.0471
Lab 1 17 2017 0.0370
Lab 1 3 2017 0.0386
Lab 1 18 2017 0.0398
Lab 1 4 2017 0.0313
Lab 1 19 2017 0.0279
Lab 1 5 2017 0.0255
Lab 1 20 2017 0.0468
Lab 1 6 2017 0.0309
Lab 2 1 2017 0.0260
Lab 1 7 2017 0.0402
Lab 2 2 2017 0.0600
Lab 1 8 2017 0.0350
Lab 2 3 2017 0.0500
Lab 1 9 2017 0.0270
Lab 2 4 2017 0.0460
Lab 1 10 2017 0.0376
Lab 2 5 2017 0.0410
Lab 1 11 2017 0.0367
Lab 2 6 2017 0.0360
Lab 1 12 2017 0.0446
Lab 2 7 2017 0.0310
Lab 1 13 2017 0.0510
Lab 2 8 2017 0.0490
Lab 1 14 2017 0.0397
Lab 2 9 2017 0.0360
Lab 1 15 2017 0.0310
Lab 2 10 2017 0.0350
Germination The comparative test involved a total of nine germination tests completed by each participant. The data received were checked for completeness and accuracy and then submitted for statistical analysis (see below). Data were checked to confirm that the sum of the percentages was always equal to 100%; for some data (method 1, lot 2, laboratory 1; method 1, lot 3, laboratory 1; method 3, lot 3, laboratory 1), this could not be confirmed and the results needed to be adjusted according to the ISTA Rules. One result (method 3, lot 2, laboratory 4) was found out of tolerance. The participants also provided a description of the abnormal seedlings. The laboratories agreed that the most frequent abnormalities were the following: 00/09 (seedling decayed as a result of a primary infection); 11/03 (primary root retarded) 11/04 (primary root missing). More rarely, other abnormalities were also reported: 00/08 (seedling glassy); 11/01 (primary root stunted); 21/01 (hypocotyl short and thick). Some participants wanted to underline that the germination at 20 °C was slower compared to the other temperature regimes. One laboratory suggested that the first count should not be performed before 14 days of germination; these comments are associated with the fact that seedling size in Eustoma is very small. Statistical analysis of the germination results The analysis was performed by the ISTA Statistics Committee. Germination results by seed lots
For the three seed samples, the figure 1 presents the overall data of the percentage of normal seedlings obtained for all methods, by all laboratories. As shown by the median value in the side-by side boxplots, lot 1 gives 89% of normal seedlings, lot 2 gives 88% of normal seedlings and the lot 3 gives 89.5% of normal seedlings. The overall average percentage of normal seedlings is 88.3%, 82.6%, 84.8% respectively.

ISTA Method validation reports for 2019 Edition of ISTA Rules
OGM18-07 ISTA Method Validation Reports Page 5/164 Approved ECOM Decision 18025
Germination results by laboratory Figure 2 shows the data of the percentage of normal seedlings for all samples and all methods, by each laboratory. Figure 3 shows the data of the percentage of normal seedlings for all methods, by laboratory and lot. The data show low values reported by Lab 3 for lots 2 and 3. For this reason, two statistical analyses were performed, one including and one excluding Lab 3.
Figure 1. Percentage of normal seedlings for all methods and all laboratories, per lot.

ISTA Method validation reports for 2019 Edition of ISTA Rules
OGM18-07 ISTA Method Validation Reports Page 6/164 Approved ECOM Decision 18025
Figure 3. Percentage of normal seedlings for all methods, per each laboratory and lot.
Figure 2. Percentage of normal seedlings for all lots and all methods, per each laboratory.
ISTA Method validation reports for 2019 Edition of ISTA Rules
OGM18-07 ISTA Method Validation Reports Page 7/164 Approved ECOM Decision 18025
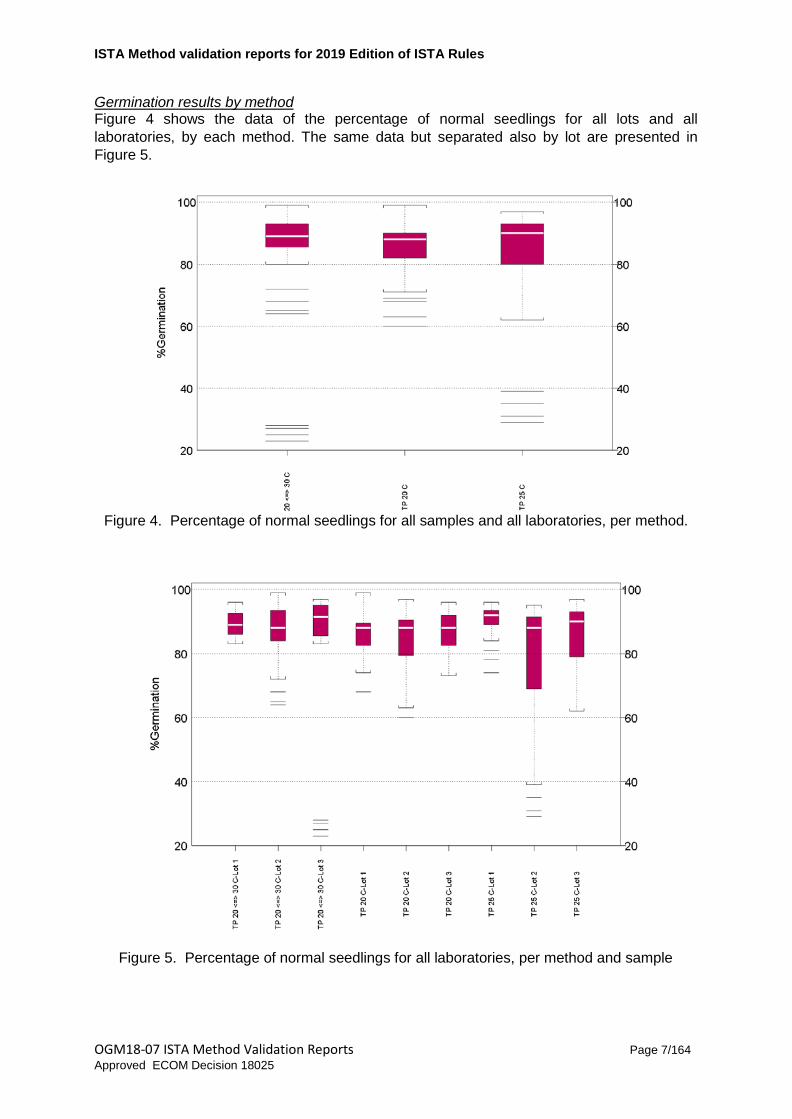
Germination results by method Figure 4 shows the data of the percentage of normal seedlings for all lots and all laboratories, by each method. The same data but separated also by lot are presented in Figure 5.
Figure 4. Percentage of normal seedlings for all samples and all laboratories, per method.
Figure 5. Percentage of normal seedlings for all laboratories, per method and sample

ISTA Method validation reports for 2019 Edition of ISTA Rules
OGM18-07 ISTA Method Validation Reports Page 8/164 Approved ECOM Decision 18025
Results of data checking Data checking was performed according to the ISTA Rules by computing tolerances for germination test replicates. Results: TP 20 <=> 30 C
Lot 1 Lab1 Lab2 Lab3 Lab4 Lab5 Lab6
Max Tol range 14 10 13 12 11 13
Obs range 6 3 3 7 6 4
Mean 85.00 94.50 86.75 88.75 92.00 87.50
Lot 2 Lab1 Lab2 Lab3 Lab4 Lab5 Lab6
Max Tol range 13 12 18 11 7 14
Obs range 6 6 8 10 5 13
Mean 88.50 89.00 67.25 92.50 96.75 85.50
Lot 3 Lab1 Lab2 Lab3 Lab4 Lab5 Lab6
Max Tol range 10 11 17 11 10 14
Obs range 4 7 5 9 5 5
Mean 94.00 91.75 25.75 92.50 94.25 85.75

ISTA Method validation reports for 2019 Edition of ISTA Rules
OGM18-07 ISTA Method Validation Reports Page 9/164 Approved ECOM Decision 18025
TP 20 C
Lot 1 Lab1 Lab2 Lab3 Lab4 Lab5 Lab6
Max Tol range 14 17 14 10 13 13
Obs range 11 12 6 10 1 4
Mean 84.75 75.25 84.50 93.75 88.50 88.50
Lot 2 Lab1 Lab2 Lab3 Lab4 Lab5 Lab6
Max Tol range 13 19 15 13 10 12
Obs range 12 11 6 8 7 5
Mean 87.75 65.75 80.75 88.00 93.00 89.00
Lot 3 Lab1 Lab2 Lab3 Lab4 Lab5 Lab6
Max Tol range 12 16 15 12 11 10
Obs range 10 9 7 5 7 6
Mean 89.00 78.25 82.00 88.75 91.00 93.25
TP 25 C
Lot 1 Lab1 Lab2 Lab3 Lab4 Lab5 Lab6
Max Tol range 12 16 10 11 11 10
Obs range 9 12 7 4 5 2
Mean 90.00 79.75 93.75 92.00 91.75 92.75
Lot 2 Lab1 Lab2 Lab3 Lab4 Lab5 Lab6
Max Tol range 13 18 18 13 10 12
Obs range 8 14 10 15 3 2
Mean 88.50 70.00 33.50 88.00 93.75 88.75
Lot 3 Lab1 Lab2 Lab3 Lab4 Lab5 Lab6
Max Tol range 11 18 16 10 10 11
Obs range 6 16 2 5 7 6
Mean 91.50 70.25 79.50 92.00 93.75 92.00
One result is out of tolerance.

ISTA Method validation reports for 2019 Edition of ISTA Rules
OGM18-07 ISTA Method Validation Reports Page 10/164 Approved ECOM Decision 18025
Repeatability/Reproducibility
For each method, the following linear mixed model has been fitted:
( )ijk i j ijkijy b b e= + + + +µ α α
in which:
. ijky is the observed percent of normal seedlings in rep k of lot i and lab j.
. m is the intercept.
. iα is the fixed effect of lot i.
. jb is the random effect of lab j. jb ~ i.i.d. N 2(0, )Labσ .
. ( )ijbα is the random interaction effect between lot i and lab j.
( )ijbα ~ i.i.d. N 2(0, )Lot Lab×σ .
. ijke are the residuals. ijke ~ i.i.d. N 2(0, )σ .
Repeatability standard-deviation is then given by 2r ˆS = σ and reproducibility standard-
deviation by 2 2 2R Lab Lot Labˆ ˆ ˆS ×= + +σ σ σ .
The dispersion factor is calculated as2
(100 )r... ...
ˆmfp p
=−
σ where ...p is the overall average
percentage of normal seedlings and m is the number of seeds per rep (m = 100 in this study). If
rf > 1 one speaks of over dispersion because the data have larger variance than expected under the assumption of a binomial distribution.
Repeatability ( rS ) of the results (calculated with and without Lab 3):
With Lab 3:
TP 20 <=> 30 C
TP 20 C
TP 25 C
...p rS rf
...p rS rf
...p rS rf
85.44 3.01 0.85
85.65 3.64 1.04
84.42 3.89 1.07

ISTA Method validation reports for 2019 Edition of ISTA Rules
OGM18-07 ISTA Method Validation Reports Page 11/164 Approved ECOM Decision 18025
Without Lab 3:
TP 20 <=> 30 C
TP 20 C
TP 25 C
...p rS rf
...p rS rf
...p rS rf
90.55 3.09 1.06
86.3 3.78 1.1
87.58 4.02 1.22
Repeatability standard deviations are acceptable for the three methods (rf close to 1),
except for TP 25°C when the analysis is performed without Lab 3.
Reproducibility ( RS ) of the results (calculated with and without Lab 3):
TP 20 <=> 30 C - With Lab 3
TP 20 <=> 30 C - Without Lab 3
...p RS 2ˆLabσ 2ˆLot Lab×σ
...p RS 2ˆLabσ 2ˆLot Lab×σ
85.44 17.04 10.19 13.32
90.55 4.69 2.51 2.48
TP 20 C - With Lab 3
TP 20 C - Without Lab 3
...p RS 2ˆLabσ 2ˆLot Lab×σ
...p RS 2ˆLabσ 2ˆLot Lab×σ
85.65 8.1 6.63 2.91
86.3 8.75 7.22 3.19
TP 25 C - With Lab 3
TP 25 C - Without Lab 3
...p RS 2ˆLabσ 2ˆLot Lab×σ
...p RS 2ˆLabσ 2ˆLot Lab×σ
84.42 14.99 7.72 12.24
87.58 9.07 7.93 1.82
The inter-laboratory variability is small for TP 20 <=> 30° C and TP 25° C compared to TP 20, when Lab 3 is not taken into account in the analysis. When Lab 3 is considered in the calculation, the comparison gives the opposite results, but the differences are much larger. Conclusions Based on the thousand seed weight values a percentage purity test working sample weight of 0.2g was recommended for Table 2A to ensure 2 500 seeds are tested. The results of the germination study suggest that Lab 3 results are removed from the analysis, due to inter-laboratory variability ( 2ˆLabσ ) that results from its inclusion in the study.
Method 3 (TP 25 °C) did not provide an acceptable repeatability standard deviation. Method 2 (TP 20 °C) showed a large inter-laboratory variability compared to other methods. This is also understandable looking to the comments submitted my several participants: it is

ISTA Method validation reports for 2019 Edition of ISTA Rules
OGM18-07 ISTA Method Validation Reports Page 12/164 Approved ECOM Decision 18025
their opinion that seedling evaluation is more challenging when seeds are germinating at 20 °C. The recommendation from the ISTA Flower Seed Testing Committee is to include in the ISTA Rules the following germination method for Eustoma exaltatum:
TP; 20 <=> 30 °C (first count 4-7 days; final count: 21 days). Additional treatment: light recommended
Acknowledgments Thanks to Naktuinbouw (The Netherlands) for providing the seed samples used in the validation study. Thanks to the staff of the participating ISTA laboratories: Naktuinbouw (The Netherlands), Starke Ayres (South Africa), CREA-DC (Italy), Takii Europe (The Netherlands), Sakata Seeds (Japan), Vulcani Center (Israel). Thanks, in particular to the reference persons of those laboratories: Anton Grim, Frikkie Marais, Rita Zecchinelli, Wil Pieterse, Kumiko Jinno, Meriam Dekalo-Keren. Thanks to the technical reviewers Sylvie Ducournau and Alison Powell. Thanks to Nadine Ettel, TCOM coordinator at the ISTA Secretariat for her support. Special thanks to Jean-Louis Laffont and the ISTA Statistics Committee for the review of the testing plan and the statistical analysis. References ISTA Handbook on Seedling Evaluation, 3rd Edition, 2013. ISTA Method Validation for Seed Testing-V1.0 (https://www.seedtest.org/en/method-validation-programme-_content---1--1254.html) Standard Operating Procedure: Method validation -process administration (TCOM-SOP-05- Method validation -process V1.0 - https://www.seedtest.org/en/method-validation-programme-_content---1--1254.html)

ISTA Method validation reports for 2019 Edition of ISTA Rules
OGM18-07 ISTA Method Validation Reports Page 13/164 Approved ECOM Decision 18025
Validation study for Felicia heterophylla (Cass.) Grau to support Rules proposals B.1.2
Zecchinelli R.
CREA DC - Sede di Tavazzano – Via Emilia km 307 -26838 Tavazzano (LO) Italy ([email protected])
Abstract
The object of this validation study was to provide thousand seed weight data to support a %purity working sample weight proposal and introduce a seed germination test method for Felicia heterophylla (Cass.) Grau, a new species to be introduced into the ISTA Rules. Based on the thousand seed weight values a percentage purity test working sample weight of 5g was recommended for Table 2A to ensure 2 500 seeds are tested. Five ISTA laboratories from five different countries participated in the study using three seed lots and two test methods. The test methods were: Top of Paper (TP), at either 20, or 20<=>30°C with a first count at 4-7 days and final count at 21 days; with no additional treatments but with the recommendation to use light. The statistical analysis included all the germination results obtained by all the participants and showed the repeatability and reproducibility for the two methods. The germination method for Felicia heterophylla that gave the highest normal germination result and acceptable repeatability and reproducibility values and is therefore proposed to be included in the ISTA Rules as a new germination method in Chapter 5, Table 5A, part 3 is: TP; 20 °C; first count 7 days, final count 21 days, with the recommendation to use light.
Introduction
Felicia heterophylla is a species belonging to the family Asteraceae, native to South Africa. It is an annual plant, known with the common name “blue true daisy” because of the beautiful flowers that are entirely of an electric-blue colour. It grows fast to around 30 cm tall and it is ideal for sunny areas, used as an edging plant or pot plant. The introduction of this species in the ISTA Rules has been suggested by one ISTA member laboratory from South Africa. This species is commercialized in some areas of the word, such as Africa and Japan, and for this reason, ISTA methods are needed. A first validation study with the same object had been already organized in 2012 by the ISTA Flower Seed Testing Committee. At that time, five laboratories participated and four methods were included in the study (combination of TP – 20 °C and 20 <=> 30 °C, with and without additional treatments). The statistical review showed that none of the four methods fulfilled the repeatability and the reproducibility criteria. The best compromise was achieved by one method (TP 20 °C – 4-7-21 days - Additional treatment: NONE). However, some participants in the first study had reported the presence of fungi on TP. This may have been one of the reason for the failure of the 2012 study. For this new validation study, three new seed lots were used. Basing on the information provided by the proposing laboratory and on the experience of the first study, the ISTA Flower Seed Testing Committee approved the proposal of the test leader to focus on two testing methods, where the temperature regime represented the only difference between the two methods.

ISTA Method validation reports for 2019 Edition of ISTA Rules
OGM18-07 ISTA Method Validation Reports Page 14/164 Approved ECOM Decision 18025
1. TP; 20 <=>30°C (1st count 4-7 days; final count: 21 days). Additional treatment: light recommended
2. TP; 20°C (1st count 4-7 days; final count: 21 days). Additional treatment: light recommended
The validation study was performed through a multi-laboratory comparative test, which took place in 2016. Results of the laboratories are here reported anonymously.
Felicia heterophylla seeds Material and methods
Seed material Three samples of untreated seed of Felicia heterophylla were used in the study, two originated from South Africa, one from The Netherlands. The three samples were drawn from commercial lots intended for marketing. Participant laboratories Four ISTA accredited laboratories and one more ISTA laboratory having the accreditation process ongoing and being very experienced in seed testing for that species participated in the study: Starke Ayres (South Africa), CREA-DC (Italy), Geves-SNES (France), Naktuinbouw (The Nederlands), MGSZH (Hungary). The test was organized by Rita Zecchinelli (CREA-DC Laboratory – Tavazzano LO, Italy). Additional treatments No additional treatments were used, but the participants were asked to germinate the seed in the light. This suggestion came from one reviewer of the test plan. Germination method For each test and sample, 400 seeds were tested in replicates of 100 seeds. “Top of Paper” (TP) was used as substrate, two temperature regimes were investigated, constant temperature of 20 °C and alternating temperature of 20 °C (for 16 hours) and 30 °C (for 8 hours). Following the test plan, germination counts were made after 4 or 7 days (first count) and 21 days (final count). With only one exception (laboratory 5, method 1), the first count took always place after 7 days. Three laboratories performed the final count after 21 days, one laboratory anticipated it after 17 days, another one after 13 days. The participant laboratories confirmed that the substrate used in the experiments met the requirements prescribed by the ISTA Rules. Referring to the classification in the ISTA Handbook for Seedling Evaluation, the seedling type for Felicia heterophylla is type “E”, for dicotyledons, with epigeal germination, without epicotyl elongation (see Figure 1).

ISTA Method validation reports for 2019 Edition of ISTA Rules
OGM18-07 ISTA Method Validation Reports Page 15/164 Approved ECOM Decision 18025
Following the instructions received, the laboratories based their seedling evaluation on the seedling group A-2-1-1-1, which is used for species and genera of the Asteraceae family.
Figure 1. Seedling development in Felicia heterophylla (photo: Zita Ripka)
Results Thousand seed weight The thousand seed weights (TSW) for 29 Felicia heterophylla seed lots or sources ranged between 1.2739 and 1.7422g (Table 1), therefore the range for the weight of 2 500 seeds was 3.18 to 4.36g. A percentage purity test working sample weight of 5g was recommended to ensure 2 500 seeds are tested.

ISTA Method validation reports for 2019 Edition of ISTA Rules
OGM18-07 ISTA Method Validation Reports Page 16/164 Approved ECOM Decision 18025
Table 1: Thousand seed weights (TSW) for 29 seed lots or sources. Source Lot Year TSW (g) Lab 1 1 2012 1.58 Lab 1 2 2012 1.60 Lab 1 3 2012 1.45 Lab 2 1 2017 1.32 Lab 2 2 2017 1.41 Lab 2 3 2017 1.32 Lab 2 4 2017 1.40 Lab 2 5 2017 1.39 Lab 3 1 2017 1.58 Lab 3 2 2017 1.36 Lab 3 3 2017 1.54 Lab 3 4 2017 1.35 Lab 3 5 2017 1.64 Lab 3 6 2017 1.35 Lab 3 7 2017 1.27 Lab 3 8 2017 1.48 Lab 3 9 2017 1.51 Lab 3 10 2017 1.74 Lab 3 11 2017 1.50 Lab 3 12 2017 1.45 Lab 3 13 2017 1.46 Lab 3 14 2017 1.66 Lab 3 15 2017 1.61 Lab 3 16 2017 1.39 Lab 3 17 2017 1.43
Millenium Seed Bank database 1 2017 1.72
Millenium Seed Bank database 1 2017 1.74
http://www.seedaholic.com/felicia-heterophylla-the-blues.html average 2017 1.33
Germination The comparative test involved a total of six germination tests completed by each participant. The data received were checked for completeness and accuracy and then submitted for statistical analysis (see below). Data were checked confirming that the sum of the percentages was always equal to 100%; one result (method 1, lot 3, laboratory 5) was found out of tolerance (the laboratory repeated the test and the re-test gave again out of tolerance results). The participants also provided a description of the abnormal seedlings. The laboratories agreed that the most frequent abnormalities were the following: 00/09 (seedling decayed as a result of a primary infection); 11/03 (primary root retarded) 11/04 (primary root missing);

ISTA Method validation reports for 2019 Edition of ISTA Rules
OGM18-07 ISTA Method Validation Reports Page 17/164 Approved ECOM Decision 18025
31/05 (cotyledons >50% discoloured or necrotic). More rarely, other abnormalities were also reported: 00/01 (seedling deformed); 11/07 (primary root trapped in the seed coat); 11/08 (primary root showing negative geotropism); 21/01 (hypocotyl short and thick). In addition to the methods prescribed in the test plan, one participant laboratory also tested the samples with a KNO3 additional treatment (0.2% KNO3 solution added to the substrate at the beginning of the test), for breaking physiological dormancy whenever present. The only effect of the treatment was to move the first count from the 7th day to the 4th, but no promotion of germination was observed. Statistical analysis of the results Completeness and accuracy of the data were confirmed. Germination results by seed lots
For the three seed samples, Figure 2 presents the overall data of the percentage of normal seedlings obtained for all methods, by all laboratories. As shown by the median value in the side-by side boxplots, sample 1 gives 83% of normal seedlings, sample 2 gives 87% of normal seedlings and the sample 3 gives 86.5% of normal seedlings. The overall average percentage of normal seedlings is 82.3%, 85.1%, 84.8% respectively.
Germination results by laboratory The figure 3 shows the data of the percentage of normal seedlings for all samples and all methods, by each laboratory. The data show some variability between laboratories. However, this does not lead to the exclusion of any result for further analysis.
Figure 2. Percentage of normal seedlings for all methods and all laboratories, per sample.

ISTA Method validation reports for 2019 Edition of ISTA Rules
OGM18-07 ISTA Method Validation Reports Page 18/164 Approved ECOM Decision 18025
Germination results by method The Figure 4 shows the data of the percentage of normal seedlings for all samples and all laboratories, by each method. The same data - but separated also by sample - are presented in Figure 5.
As graphically shown by the median value in the side-by side boxplots, method 1 gives 82.5% of normal seedlings, method 2 gives 86.6% of normal seedlings. It is also evident the variation smaller for method 2 than for method 1 (smaller standard deviation).
Figure 3. Percentage of normal seedlings for all samples and all methods, per each laboratory.
Figure 4. Percentage of normal seedlings for all samples and all laboratories, per method.

ISTA Method validation reports for 2019 Edition of ISTA Rules
OGM18-07 ISTA Method Validation Reports Page 19/164 Approved ECOM Decision 18025
Germination results by laboratory The figure 6 shows the data grouped across methods. The variability between laboratories shown in figure 3 is confirmed. As said, this does not lead to the exclusion of any result for further analysis.
Figure 5. Percentage of normal seedlings for all laboratories, per method and sample
Figure 6. Percentage of normal seedlings for the two methods, per sample and laboratory

ISTA Method validation reports for 2019 Edition of ISTA Rules
OGM18-07 ISTA Method Validation Reports Page 20/164 Approved ECOM Decision 18025
Results of data checking Data checking has been performed according to ISTA rules by computing tolerances for germination test replicates. The results are shown in the tables below.
Method 1. TP 20 <=> 30 C Lot 1 Lab1 Lab2 Lab3 Lab4 Lab5
Max Tol range 16 15 17 16 14
Obs range 4 6 11 13 8
Mean 79.25 80.75 75.25 79.00 85.75
Lot 2 Lab1 Lab2 Lab3 Lab4 Lab5
Max Tol range 18 14 15 14 14
Obs range 9 4 9 7 13
Mean 70.50 86.50 81.00 85.25 84.00
Lot 3 Lab1 Lab2 Lab3 Lab4 Lab5
Max Tol range 18 14 15 11 13
Obs range 9 10 11 4 3
Mean 69.25 85.00 83.00 92.50 88.00
Method 2. TP 20 C
Lot 1 Lab1 Lab2 Lab3 Lab4 Lab5
Max Tol range 13 14 15 15 14
Obs range 3 9 7 6 5
Mean 86.75 84.50 82.75 83.00 86.00
Lot 2 Lab1 Lab2 Lab3 Lab4 Lab5
Max Tol range 11 12 12 13 14
Obs range 7 10 2 10 7
Mean 91.50 88.75 89.00 88.25 86.00
Lot 3 Lab1 Lab2 Lab3 Lab4 Lab5
Max Tol range 15 14 14 13 14
Obs range 4 6 13 11 15
Mean 83.25 86.25 86.00 88.50 86.00
One result is out of tolerance.

ISTA Method validation reports for 2019 Edition of ISTA Rules
OGM18-07 ISTA Method Validation Reports Page 21/164 Approved ECOM Decision 18025
Repeatability/Reproducibility
For each method, the following linear mixed model has been fitted:
( )ijk i j ijkijy b b e= + + + +µ α α
in which:
. ijky is the observed percent of normal seedlings in rep k of lot i and lab j.
. is the intercept.
. iα is the fixed effect of lot i.
. jb is the random effect of lab j. jb ~ i.i.d. N 2(0, )Labσ .
. ( )ijbα is the random interaction effect between lot i and lab j.
( )ijbα ~ i.i.d. N 2(0, )Lot Lab×σ .
. ijke are the residuals. ijke ~ i.i.d. N 2(0, )σ .
Repeatability standard-deviation is then given by 2r ˆS = σ and reproducibility standard-
deviation by 2 2 2R Lab Lot Labˆ ˆ ˆS ×= + +σ σ σ .
The dispersion factor is calculated as2
(100 )r... ...
ˆmfp p
=−
σ where ...p is the overall average
percentage of normal seedlings and m is the number of seeds per rep (m = 100 in this study). If
rf > 1 one speaks of over dispersion because the data have larger variance than expected under the assumption of a binomial distribution.
Repeatability ( rS ) of the results:
TP 20 <=> 30 C
TP 20 C

ISTA Method validation reports for 2019 Edition of ISTA Rules
OGM18-07 ISTA Method Validation Reports Page 22/164 Approved ECOM Decision 18025
...p rS rf
...p rS rf
81.67 3.98 1.03
86.43 3.77 1.10
Repeatability standard deviations are acceptable for the two methods (rf close to 1).
Reproducibility ( RS ) of the results:
TP 20 <=> 30 C
TP 20 C
...p RS 2ˆLabσ 2ˆLot Lab×σ
...p RS 2ˆLabσ 2ˆLot Lab×σ
81.67 7.49 4.70 4.26
86.43 3.77 0.00 0.00
The inter-lab variability is small for TP 20 C compared to TP 20 < = > 30 C.
Conclusions
Based on the thousand seed weight values a percentage purity test working sample weight of 5g was recommended for Table 2A to ensure 2 500 seeds are tested. TP 20° C has the lowest reproducibility standard-deviation and also the highest general mean, compared to TP 20 <=> 30° C. Therefore, the recommendation from the ISTA Flower Seed Testing Committee is to include in the ISTA Rules the following germination method for Felicia heterophylla:
TP; 20°C (first count 4-7 days; final count: 21 days). Additional treatment: light recommended
Acknowledgments Thanks to Starke Ayres (South Africa) and to Naktuinbouw (The Netherlands) for providing the seed samples used in the validation study. Thanks to the staff of the participating ISTA laboratories: Starke Ayres (South Africa), CREA-DC (Italy), Geves-SNES (France), Naktuinbouw (The Netherlands), MGSZH (Hungary).

ISTA Method validation reports for 2019 Edition of ISTA Rules
OGM18-07 ISTA Method Validation Reports Page 23/164 Approved ECOM Decision 18025
Thanks, in particular to the reference persons of those laboratories: Frikkie Marais, Rita Zecchinelli, Sylvie Ducournau, Anton Grim, Zita Ripka. Thanks to the technical reviewers Gillian McLaren and Lea Mazor. Thanks to Nadine Ettel, TCOM coordinator at the ISTA Secretariat for her support.
Thanks to Jean-Louis Laffont and the ISTA Statistics Committee for the review of the testing plan and the statistical analysis. References ISTA Handbook on Seedling Evaluation, 3rd Edition, 2013. ISTA Method Validation for Seed Testing-V1.0 (https://www.seedtest.org/en/method-validation-programme-_content---1--1254.html) Standard Operating Procedure: Method validation -process administration (TCOM-SOP-05- Method validation -process V1.0 - https://www.seedtest.org/en/method-validation-programme-_content---1--1254.html)

ISTA Method validation reports for 2019 Edition of ISTA Rules
OGM18-07 ISTA Method Validation Reports Page 24/164 Approved ECOM Decision 18025
Validation study to support the germination method for dormant seed lots of Raphanus sativus proposal C.5.1. Pernilla Andersson, Swedish Board of Agriculture, Seed Division, Box 83, SE-268 22 Svalöv, Sweden
Summary The study was conducted in order to evaluate the two ISTA germination methods 20 °C and 20<=>30 °C for Raphanus sativus in order to find out whether they both work well and should still be included in the ISTA Rules; or if one of them should be removed or not used in certain circumstances. Two laboratories analysed six seed lots using both temperature regimes and the substrates PP, TP and S; prechilling was used as pretreatment. Statistical analyses showed that 20 °C PP and 20 °C TP resulted in a significantly lower percentage of normal seedlings for two of the lots. These two lots contained dormant seeds and the conclusion is that constant temperature 20 °C using substrates PP and TP was not able to break dormancy leading to many fresh seeds and therefore a lower percentage of normal seeds. 20 °C on sand gave good results even with dormant seed lots. For non-dormant seed lots both temperature regimes worked well. It is therefore suggested to add the recommendation to the ISTA Rules to use 20<=>30 °C or sand for dormant seed lots.
Introduction For Raphanus sativus the ISTA Rules has two different temperatures: 20<=>30 and constant 20 °C and 3 different allowed substrates: BP, TP and S. BP can be replaced by PP. The recommendation for breaking dormancy is to use prechilling. The study was performed in order to examine whether or not both 20<=>30 and 20 °C should still be in the ISTA rules for germination of Raphanus sativus or if 20 °C should be removed or not used in certain cases. The reason to doubt the constant 20 °C temperature regime was the testing of four seed lots of Raphanus sativus, variety Lungo Bianco, at the seed testing station in Sweden using TP constant 20 °C. The germination of the lots were between 35 and 69%. The same lots using alternating 20<=>30°C resulted in germinations between 86 and 95%. Prechilling were used in both temperature regimes. These results were later verified when the seed testing station Agroscope Zurich in Switzerland retested the 4 samples and 1 reference sample using both 20 °C and 20<=>30°C on three different substrates, BP, TP and PP. The retest confirmed the poor result using 20 °C (all due to fresh seeds) over all substrates compared with TP. Prechilling for 3 days at 8-10 °C did not break dormancy. To complement these results the ISTA Germination Committee decided to perform this study using six different seed lots of Raphanus sativus. Christine Herzog from Agroscope Zurich in Switzerland and Pernilla Andersson from the official seed testing station in Sweden wrote the test plan and organized the study.

ISTA Method validation reports for 2019 Edition of ISTA Rules
OGM18-07 ISTA Method Validation Reports Page 25/164 Approved ECOM Decision 18025
Material and methods
Table 1: Seed material
Lot Latin name Common name Origin 1 Raphanus sativus var. niger Black radish New Zealand 2 Raphanus sativus var. niger Black radish New Zealand 3 Raphanus sativus var. sativus Radish France 4 Raphanus sativus var. sativus Radish France 5 Raphanus sativus var. oleiformis Oil seed radish Germany 6 Raphanus sativus var. oleiformis Oil seed radish Germany The intention was to include seed lots with as well as without dormancy and lots 1 and 2 were expected to contain seeds with some degree of dormancy.
Participant laboratories
The lots were analysed at two different laboratories, one in Sweden and the other in Switzerland. Both labs are ISTA accredited and familiar with testing Raphanus sativus.
Pretreatment
All lots were prechilled for 3 days at 8-10 °C.
Germination methods
For each test and sample, 400 seeds were analysed in replicates of 50 seeds. The substrates Top of paper (TP), Pleated paper (PP) and Sand (S) were used in both 20<=>30°C as well as constant temperature 20 °C.
Germination counts were made after 3 days prechilling and then 4, 7 and 10 days in 20 or 20<=>30°C.
The evaluation of the seedlings were made according to seedling type E and seedling group A-2-1-1-1 in ISTA handbook of seedling evaluation. In cases of 5% or more fresh seeds the seeds were evaluated as fresh or dead by using tetrazolium testing.
Statistical analyses
Statistical analyses was performed by Jean-Louis Laffont, head of the ISTA Statistics Committee, by using the new tool from the ISTA Statistics Committee ‘ISTAgermMV’. The figures with the boxplots (per lot, per method, per lab, and the full combination between these factors) as well as the data checking, repeatability/reproducibility and the mixed model analyses were generated from this statistical tool.
Results
Ungerminated seeds in the lots
Both lots 1 and 2 produced a lot of fresh seeds when the methods TP 20 °C and PP 20 °C were used. The other methods, 20 °C in sand as well as alternating temperature 20<=>30°C, regardless of substrate, produced no or very few fresh seeds. Lots 3-6 produced no or very few fresh seeds regardless of method (Table 2).

ISTA Method validation reports for 2019 Edition of ISTA Rules
OGM18-07 ISTA Method Validation Reports Page 26/164 Approved ECOM Decision 18025
Method Lot
TP 20 °C PP 20 °C S 20 °C TP 20<=>30°C PP 20<=>30°C S 20<=>30°C
1 34 24 1 4 1 0 2 40 34 1 7 1 0 3 0 1 0 0 1 0 4 0 0 0 0 0 0 5 0 0 0 0 1 0 6 0 1 0 0 0 0 Table 2. Percentage of fresh seeds in the lots depending on method (the percentage is the mean value between the two labs).
Table 3. Differences in the result of normal seedlings for the lots depending on method and laboratory.
Germination results by seed lot
Table 3 shows the lowest and highest result of normal seedlings for a lot among the results obtained from both laboratories and among all methods. Figure 1 presents the median values of the percentage of normal seedlings per lot, for both laboratories and all methods. From Table 3 and Figure 1 it is clear that there is a difference in normal seedlings depending on the method used, at least for lots 1 and 2.
Lot number Normal seedlings lowest result (method used in brackets)
Normal Seedlings Highest result (method used in brackets)
Variation between methods and laboratories
1 36 % (TP 20°C )
97 % (PP 20<=>30°C)
61%
2
43% (TP 20°C )
98% (PP 20<=>30°C)
55%
3
74% (S 20<=>30°C)
88% (TP 20°C )
14%
4
89% (PP 20°C, PP 20<=>30°, S 20°C)
96% PP 20<=>30°
7%
5
71% (TP 20°C)
93% (PP 20°C)
22%
6
83% (PP 20<=>30°)
92% (TP 20<=>30°, TP 20°C)
9%

ISTA Method validation reports for 2019 Edition of ISTA Rules
OGM18-07 ISTA Method Validation Reports Page 27/164 Approved ECOM Decision 18025
Figure 1. Percentage of normal seedlings per lot for all methods and both laboratories. Red dots = outliers.
Germination results by method
Figure 2 presents the median values of the percentages of normal seedlings per method, for all lots and both laboratories. PP 20°C gave 85% of normal seedlings, PP 20<=>30°C gave 92%, S 20°C gave 90%, S 20<=>30°C gave 90%, TP 20°C gave 86% and TP20<=>30°C gave 89% of normal seedlings. The variation in results are highest with the method TP 20°C followed by PP 20°C.
Figure 2. Median values of the percentages of normal seedlings per method for all lots and both laboratories. Red dots = outliers.

ISTA Method validation reports for 2019 Edition of ISTA Rules
OGM18-07 ISTA Method Validation Reports Page 28/164 Approved ECOM Decision 18025
Germination results by method x lot
Figure 3 shows the percentage of normal seedlings for both laboratories per lot and per method. The median value in the side by side boxplots shows that the germination method played a role for the germination result. For lot 1 and 2 the percentage of normal seedlings were lower when using TP 20°C or PP 20°C compared to when using other methods. The variation between replicates and laboratories were highest when using TP 20°C for lots 1 and 2 as well as for lot 5. For the other lots the method plays a less important role for the results obtained.
Figure 3. Percentage of normal seedlings for both laboratories per lot and per method. Red dots = outliers. Germination results by method and laboratory Figure 4 shows the variability per method and laboratory for all lots. For both laboratories, although more clear in laboratory 1, the variability in germination results was higher using TP 20°C as well as PP 20°C compared to the other methods.

ISTA Method validation reports for 2019 Edition of ISTA Rules
OGM18-07 ISTA Method Validation Reports Page 29/164 Approved ECOM Decision 18025
Figure 4. Percentage of normal seedlings for all samples per laboratory and per method. Red dots = outliers. Results of data checking Data checking has been performed according to ISTA Rules by computing tolerances for germination test replicates. Only one result was found out of tolerance:
Method Lot Lab Mean # Reps Range Tol Out of Tol
PP 20 C Lot 2 Lab 1 60 4 24 19 OUT
The result has been included in the statistical analysis.
Repeatability ( rS ) and Reproducibility ( RS )
Results are shown below, however, as the number of laboratories is only two it is difficult to assess the reproducibility ( RS ) Table 4.
Method ...p rS rf RS 2Labσ̂ 2
Lot Labσ̂ ×
PP 20 C 82 4.3 1.11 5.41 0 3.28
PP 20<=>30 C 91 2.64 0.92 3.79 0 2.72
S 20 C 89 2.23 0.70 4.26 0 3.63
S 20<=>30 C 89 2.62 0.82 3.56 0 2.40
TP 20 C 77 4.2 1.00 18.69 13.41 12.33
TP 20<=>30 C 88 2.59 0.80 5.28 0 4.61
Table 4: Repeatability and reproducibility:
...p is the overall average percentage of germinated seeds

ISTA Method validation reports for 2019 Edition of ISTA Rules
OGM18-07 ISTA Method Validation Reports Page 30/164 Approved ECOM Decision 18025
Sr: is the repeatability standard-deviation (inter-lab variation)
rf is an estimate of the dispersion parameter SR is the reproducibility standard-deviation (intra-lab variation)
A high value in the column 2Labσ̂ reflects low reproducibility due to big differences across
labs and a high value in the column 2Lot Labσ̂ × reflects low reproducibility due to differences in
the way labs are measuring lots. TP 20°C has a high value in both these columns. The reason for this is that for TP 20°C one of the labs got a more or less lower result for all lots while the labs got very similar results between each other using the other germination methods.
Discussion The study shows that, for Lots 1 and 2, two of the methods used, TP 20°C and PP 20°C, give significant lower percentage of normal seedlings compared to the other methods. They also have poor repeatability compared to the other methods and PP 20°C has poor reproducibility. However repeatability and reproducibility are affected as there are only two laboratories in the study. The reason for the low percentage of normal seedlings in lots 1 and 2 when using TP 20°C and PP 20°C is dormancy. Both lots 1 and 2 produced a lot of fresh seeds when these methods were used. The other methods, 20 °C in sand as well as alternating temperature 20<=>30°C, regardless of substrate, were able to break the dormancy in these lots and therefore gave a higher percentage of normal seedlings. For Lots 3-6, without dormancy, the difference in percentage of normal seedlings between methods was much less and for these lots all methods worked well. Prechilling was not able to break dormancy in this study. The prechilling was performed at 8-10 °C for 3 days. The effect of prechilling at a lower temperature (5-7 °C) or the effect of a longer prechilling period (7-14 days) was not evaluated in this study. The fresh seeds in the lots were evaluated by TZ and most of them were indeed fresh with the potential to germinate. Fresh seeds should be included in the germination percentage when reporting to a customer and if this is done one could argue that all methods work well. There is however a risk that the laboratory misjudges the fresh seeds as being dead and then reports a too low germination result to the customer.
Conclusion As both temperature regimes work well for non-dormant seed lots it is suggested to maintain both 20°C and 20<=>30°C in the ISTA Rules. However, as this study has shown that the 20 °C germination method for Raphanus sativus is not able to break dormancy as efficiently as the alternating temperature 20<=>30°C in TP and PP, and as sand gives better results when seeds are dormant whatever the temperature, it is proposed to add an additional recommendation for Raphanus sativus to Table 2A. The recommendation is to recommend 20<=>30°C or sand, when seeds are known to be or are expected to be dormant.
ISTA Method validation reports for 2019 Edition of ISTA Rules
OGM18-07 ISTA Method Validation Reports Page 31/164 Approved ECOM Decision 18025
Acknowledgements Thanks to DSV-Saaten, Clause Vegetable Seeds, Vilmorin and Agortus AB for providing the seed lots used in the study. Thanks to the staff of the participating laboratories: Agroscope Zurich in Switzerland (especially Christine Herzog and Annette Buettner) and the official seed testing laboratory in Sweden. Thanks to the technical reviewers Harry Nijenstein and Augusto Martinelli and to everyone else in the germination committee, especially Sylvie Ducornau, for help and guidance during the project. Thanks also to Jean-Louis Laffont, chair of the ISTA Statistical Committee, for running the statistical analyses.

ISTA Method validation reports for 2019 Edition of ISTA Rules
OGM18-07 ISTA Method Validation Reports Page 32/164 Approved ECOM Decision 18025
Validation study to support a modification to the evaluation criteria for normal seedlings of Spinacia oleracea Rules proposal C.5.3.
Daron L.
Enza Zaden R&D Station, 92 route de la Bourdaudiere, 49650 Allonnes, France ([email protected]) Abstract
This project started in 2013 and was motivated by the assumption that the lack of clear root criteria to assess spinach seedlings led to germination results with greater variability between laboratories. For a spinach seedling to be considered as normal, it must comply with the following ISTA definition: ‘primary root with limited damage (e.g. not affecting the conductive tissue) or slight growth retardation’. However, the maximum growth retardation tolerated was not clearly defined for Spinacia oleracea. This lack of clear definition caused the root length to be evaluated in different ways by laboratories. The objective of this validation study was to assess if introducing a root length criterion for spinach seedlings would decrease variation between laboratories. The new criterion is intended to be included into ‘Chapter 5: The germination test’, paragraph ‘5.2.7 Normal seedlings’ in the description of ‘5.2.7.2 Slight defects’. Six ISTA laboratories from six different countries participated in this study, plus the test organizer (not ISTA accredited). Samples from six seed lots were distributed to each one laboratory, together with the test plan. The following methods were included in the test plan, in accordance with the current ISTA rules:
1. VRT1: germination test used routinely by the participating ISTA lab (PP or BP, 10 or 15 °C, optional for breaking dormancy: prechill). No specific instructions were given regarding the main root length and laboratories were asked to use their routine protocol for normal seedling assessment.
2. VRT2: germination test used routinely by the participating ISTA lab (PP or BP, 10 or 15 °C, optional for breaking dormancy: prechill). Specific instructions were given regarding the main root length: to be considered as normal, the length of the primary root of the seedling had to be equal or greater than the half of the length of the hypocotyl (root:shoot ratio of 1:2 = 0.5).
The statistical analysis could be performed using all the results obtained by all the participants and showed the repeatability and reproducibility for the two methods. Based on the results of that analysis, the criterion proposed to be included in the ISTA Rules for Spinacia oleracea is: the length of the primary root has to be equal to or greater than the half of the length of the hypocotyl.
Introduction
The project about the evaluation of short roots in spinach was initiated in November 2011 with a meeting in The Netherlands between major seed companies. The discussion concerned an unexpected issue experienced with a seed lot of Enza Zaden produced in 2009, which showed a high percentage of seedlings with their root displaying a growth delay. ISTA germination tests done by the Naktuinbouw gave a Total Germination (TG – normal seedlings) superior to 85 % for this seed lot while field emergence experienced by Enza Zaden’s customers was only of 50 %. Consequently, it seemed that there were some discrepancies between ISTA criteria and practical criteria used by seed companies.

ISTA Method validation reports for 2019 Edition of ISTA Rules
OGM18-07 ISTA Method Validation Reports Page 33/164 Approved ECOM Decision 18025
However, the fact that root growth delay caused the low emergence in the field had not been proven to this point. The Naktuinbouw evaluated the germination methods used by nine seed companies which volunteered to participate, in order to identify the possible origin for germination results variability between laboratories (data not shown). The main conclusion was that one germination protocol and clear criteria for root length would help reducing the deviation in germination results between laboratories. Nevertheless, this conclusion was only based on the questionnaires sent to the participants and not on experimental results. A Nal-proficiency test of 4 lots of Spinach produced in 2012 was done in 2013, led by the Naktuinbouw. The outcome was that the differences in the test results were mainly caused by the percentage of abnormal seedlings. The differences were likely caused by the interpretation of the development in the root system. The conclusion was that to solve this evaluation problem, it would be advisable to give a clear description of the abnormalities of the root system e.g. root length. Consequently, Enza Zaden continued this study in 2014-2015 by organizing three ring tests between ten laboratories of nine seed companies and the Naktuinbouw. Three seed lots were used: lots 1 and 2 were provided by Enza Zaden and lot 3 by Pop Vriend. These lots were selected for their various percentages of seedlings with root growth delay. The three ring tests aimed at defining the cause of the variation between laboratories. The impact of the germination method and of the root length criterion on results variability was assessed successively. Further experiments were also done by Enza Zaden in 2015 and 2016:
- Impact of temperature and water quantity on germination rate and root growth on six lots (three new lots provided by Enza Zaden in addition to the three lots initially tested, lots 1, 2 and 3)
- Correlation between paper and soil germination results on the six lots selected for the ISTA validation study (the three initial lots and three new lots provided by Enza Zaden, Pop Vriend and Bayer for lots 4, 5 and 6 respectively)
- Correlation between root length and seedling development, assessed by seedlings fresh weight during a soil germination test under optimal conditions (lots 1 to 6)
- Impact of Thiram disinfection on the occurrence of root growth delay, on lots 1 to 6; PP15, 2 x 100 seeds, assessment 14 days after sowing
The results of the experiments listed here-above (not presented in this report) highlighted the importance of having a root criterion during spinach seedlings evaluation in laboratory germination tests. One of the main conclusions of these experiments was that for germination tests done in paper at 15 °C, the most accurate root:shoot ratio to consider was 0.5. Using a threshold of 1 led to an under-estimation of the number of normal seedlings during the paper germination test compared to the soil germination test. As well, it was shown that the superficial disinfection of seeds with Thiram did not lead to a significant difference of normal seedlings percentage, compared to non-disinfected seeds, and that the percentage of seedlings with a root growth delay was similar. This root:shoot threshold of 0.5 was then validated by the GERCOM members during the ISTA meeting in Tallinn in June 2016, to be used in the upcoming validation study. It was concluded from the ring tests results from non-ISTA accredited laboratories that using a uniform root criterion decreased the germination results variability between laboratories. These results are presented in this report. However, as no laboratory was ISTA accredited except for the Naktuinbouw, the ISTA Germination Committee (GERCOM) members required to repeat the study with ISTA accredited laboratories to confirm the conclusions, leading to the final Validation Study.

ISTA Method validation reports for 2019 Edition of ISTA Rules
OGM18-07 ISTA Method Validation Reports Page 34/164 Approved ECOM Decision 18025
Materials and Methods
Ring tests – not ISTA accredited labs
o Seed material Three samples of untreated seeds of Spinacia oleracea from three different varieties were used in the experiments, two originated from Enza Zaden and the last one from Pop Vriend (Table 1), so a possible variety effect was taken in consideration. The three samples were drawn from commercial lots intended for marketing. Table 1. Batches available for the Spinach Short Root Project ring tests in 2014 (organized by Enza Zaden) with their corresponding initial quality as assessed by the supplying companies; TG = Total Germination, SR = Short Root and NG = Not Germinated seed
Lot Seed size (mm) Supplier Production year TG (%)
SR (%)
Other abnormal seedlings (%)
NG (%)
1 2.75-3.50 Enza Zaden 2009 37 59 3 1 2 2.50-3.50 Enza Zaden 2013 59 13 18 10 3 2.75-3.50 Pop Vriend 2012 68 21 8 3
o Participant laboratories 1. BEJO ZADEN B.V. (Netherlands); Contact: Richard Hoogeboom, [email protected] 2. ENZA ZADEN (Netherlands); Contact: Lucile Daron, [email protected] 3. NAKTUINBOUW (Netherlands); Contact: Marcel Toonen, [email protected] 4. GERMAINS SEED TECHNOLOGY (Netherlands); Contact: Jurre Kleine
Schaars, [email protected] 5. INCOTEC (Netherlands); Contact: Petra Bakker, [email protected] 6. JENSEN SEEDS A/S (Denmark); Contact: Annitta Christensen, [email protected] 7. BAYER-NUNHEMS NL (Netherlands); Contact: Mieke Roost, [email protected] 8. BAYER-NUNHEMS USA (United States of America); Contact: Elizabeth
Bada, [email protected] 9. POP VRIEND (Netherlands); Contact: Sina Sietses, [email protected] 10. VIKIMA SEEDS A/S (Denmark); Contact: Brit Malec, [email protected]
All these laboratories had experience with spinach germination tests. The number given in this list does not correspond to the lab number in the results chapter, as results were to be reported anonymously. Table 2. List of companies participating in the 2014-2015 Spinach Short Root ring tests and their level of accreditation; NAL = Naktuinbouw Authorized Laboratories
Company ISTA rules in routine tests
ISTA accredited Remark
Bejo Zaden yes no NAL accredited Enza Zaden yes no NAL accredited Germains Seed Technology yes no NAL accredited Incotec yes no NAL accredited Jensen Seed A/S yes no Bayer (Nunhems) NL yes no NAL accredited Bayer (Nunhems) USA yes no NAL accredited Pop Vriend yes no Vikima Seed A/S yes no Naktuinbouw yes yes

ISTA Method validation reports for 2019 Edition of ISTA Rules
OGM18-07 ISTA Method Validation Reports Page 35/164 Approved ECOM Decision 18025
o Additional treatments No additional treatments were recommended and no laboratory used a pre-chilling treatment before the germination test. Three laboratories disinfected the seeds with Thiram before germinating them.
o Germination method The germination method recommended in the International Rules for seed testing (2014) is:
- Substrate: Top of Paper (TP) or Between Paper (BP) - Temperature (°C): 15 or 10 - First count: 7 days - Final count: 21 days - Recommendations for breaking dormancy: Pre-chill - Additional directions or advice: none
Table 3 presents the detailed protocol for all participating laboratories. The laboratories are not listed in the same order as in the previous paragraph, as results were to be reported anonymously. Table 3. Germination method details for the 10 laboratories participating in the 1st ring test (2014); PP = Pleated Paper
Laboratory Method Temperature (°C)
Water supply (mL)
Light regime (light/dark) (h)
Germination assessment (days after sowing)
Short root criterion (root:shoot threshold or root length)
Remark
A PP 15 30 0/24 6-8-12 0.5 No standard treatment
B PP 15 40 8/16 7-14 1 Thiram treated
C PP 15/20 35 8/16 14 1 cm No standard treatment
D PP 10 50 0/24 4-14 50% of average root length
Thiram treated
E PP 15 40 10/14 7-14-21 0.5 No standard treatment
F BP 15 12.9 8/16 7-10-14-21 0.5 Thiram treated
G BP 15 unknown 8/16 7-10-14-21 0.5 Thiram treated
H PP 10 25 16/8 7-21 1 Thiram treated
I PP 10 40 8/16 10-21 0.25 No standard treatment
J PP 15 40 12/12 7-10-14-21 0.5 No standard treatment
Hereafter are the instructions given for each ring test regarding germination method and root criterion, which are summarized in Table 4:
- Ring Test 1 (RT1): no instructions for either the germination method nor the root criterion
- Ring Test 2 (RT2): use of germination method PP or BP at 10 °C, two repetitions of 100 seeds, only assessment after 14 days, 12h light, no seed disinfection, no instruction for root criteria
- Ring Test 3 (RT3): same germination method as RT2 and use of threshold root:shoot >= 1 to consider a seedling as normal (considering that the hypocotyl and cotyledons development is otherwise normal)

ISTA Method validation reports for 2019 Edition of ISTA Rules
OGM18-07 ISTA Method Validation Reports Page 36/164 Approved ECOM Decision 18025
Table 4. Instructions given for the germination method and root criterion for the 1st, 2nd and 3rd ring tests (2014-2015)
Ring test no.
Germination method
Repetitions * no. seeds Disinfection Temperature
(°C) Water supply (mL)
Light regime (light/dark)
Germination assessment (days after sowing)
Root:shoot threshold
1 Variable 4 * Variable Variable Variable Variable Variable Variable Variable 2 PP 2*100 none 10 40 12h/12h 14 Variable 3 PP 2*100 none 10 40 12h/12h 14 1 Based on preliminary experiments (data not shown), we found that the best temperatures regarding the number of normal seedlings were 10 °C or 15 °C, but as the percentage of not germinated seeds (NG) was higher for 15 °C, we concluded that 10 °C was the optimal temperature. As well, the optimal water amount was identified to be 40 mL, as it led to the highest percentage of normal seedlings. In order to ease the seedlings assessment, we decided to have a 12h/12h light/dark regime, as the light coloured the hypocotyl in pink (Figure 1), which facilitated the distinction between hypocotyl and root and so, eased to assess the ratio between the two. As well, we decided to limit the germination period to 14 days, so that the seedlings would not be too big and would be easy to assess.
Figure 1. Comparison between seedlings germinated in the dark (left, two seedlings) and in the light (right, two seedlings) where the pink hypocotyl is visible, 21 days after sowing, Pleated Paper at 15 °C; source: Naktuinbouw, Antoon Grim
Preliminary experiments indicated that for the germination test at 10 °C (Pleated Paper at 10 °C = PP10), using a root:shoot ratio of 0.5 led to an over-estimation of the percentage of normal seedlings (data not shown), while the ratio of 1 gave more accurate results compared to results of normal seedlings at 15 °C in paper and in soil. However, for PP15, using the ratio of 1 led to an under-estimation of the percentage of normal seedlings. Consequently, we chose to use the root:shoot ratio threshold of 1 in our ring tests, as the germination method was set to be PP10. Validation study – ISTA accredited labs
o Seed material Six samples of untreated seeds of Spinacia oleracea were used in the study, three originated from Enza Zaden, two from Pop Vriend and one from Bayer (Table 5). The six samples were drawn from commercial lots intended for marketing. There were all from different varieties, so a possible variety effect was taken in consideration. As there were not enough seeds left from lot 2 to perform two repetitions of 100 seeds for two independent samples, only one sample of 200 seeds was sent to each laboratory for both VRT1 and VRT2.
Seedlings germinated in the dark
Seedlings germinated in the light
Pink coloration of the hypocotyl

ISTA Method validation reports for 2019 Edition of ISTA Rules
OGM18-07 ISTA Method Validation Reports Page 37/164 Approved ECOM Decision 18025
Table 5. Batches available for the Spinach validation study in 2016 (organized by Enza Zaden) with their corresponding initial quality as assessed by the supplying companies; TG = Total Germination, SR = Short Root and NG = Not Germinated seed
Lot Seed size (mm) Supplier Production year TG (%) SR (%) Other abnormal seedlings (%) NG (%)
1 2.75-3.50 Enza Zaden 2009 37 59 3 1
2 2.50-3.50 Enza Zaden 2013 59 13 18 10
3 2.75-3.50 Pop Vriend 2012 68 21 8 3
4 2.50-3.50 Enza Zaden 2012 80 7 6 7
5 2.60-3.50 Pop Vriend 2015 80 12 4 4
6 x Bayer 2015 88 7 0 5
o Participant laboratories
Six ISTA accredited laboratories which had experience with spinach germination tests participated, additionally to the test organizer (ENZA ZADEN, not ISTA accredited). The number given in this list does not correspond to the lab number in the results chapter, as results were to be reported anonymously. 1. GEVES (France); Contact: Sylvie Ducournau, [email protected] 2. LANDWIRTSCHAFTLICHES TECHNOLOGIE ZENTRUM AUGUSTENBERG - LTZ
(Germany); Contact: Andrea Jonitz, [email protected] 3. NAKTUINBOUW (Netherlands); Contact: Marcel Toonen, [email protected] 4. ARO VOLCANI CENTER (Israël); Contact: Miriam Dekalo
Keren; [email protected] 5. CREA (IT); Rita Zecchinelli, [email protected] 6. SGS BROOKINGS (USA); Sarah Dammen, [email protected] 7. ENZA ZADEN (Netherlands); Lucile Daron, [email protected]
o Additional treatments No additional treatments were recommended and only one laboratory used a pre-chilling treatment of 5 days at 5 °C (LTZ).
o Germination method
Table 6 summarizes the different parameters of the routine germination methods per laboratory, used during the first validation test. Table 6. Germination methods parameters for the six ISTA laboratories participating in the validation study (2016)
Laboratory Method Temperature (°C)
No. independent samples
Repetitions * no. seeds
Total no. seeds tested *
Water supply (mL)
Light regime (light/dark) (h)
First-Final germination assessment (days after sowing)
Root:shoot threshold
GEVES PP 15 2 2 * 100 400 32 8h/16h 7-21 1:2 LTZ PP 15 2 4 * 50 400 35 8h/16h 7-14 2:3 NAKTUINBOUW PP 15 2 2 * 100 400 40 12h/12h 7-21 1:2
ARO VOLCANI BP 15 2 4 * 50 400
Not exact amount: spraying several times during the test
0h/24h 7-21
No defined threshold: if no change in root length during test, seedling classified as abnormal
CREA BP 15 2 2 * 100 400 7 0h/24h 6-21 1:2
SGS BROOKINGS BP 15 2 2 * 100 400
Towels soaked and excess water removed
8h/16h 7-21 1
ENZA ZADEN PP 15 2 4 * 50 400 40 8h/16h 7-14 1

ISTA Method validation reports for 2019 Edition of ISTA Rules
OGM18-07 ISTA Method Validation Reports Page 38/164 Approved ECOM Decision 18025
*Except for Lot 2 for which only 200 seeds were tested per VRT The third ring test of the 2014-2015 experiments, with a defined root criterion, was done under fixed conditions. This did not reflect the diversity of germination methods that occur in practice, as listed in Tables 3 and 6. That is why during the validation study, it was decided to let the laboratories use their routine germination protocols, to be more representative of real practices. The aim was to evaluate if adding a root criterion under such a variety of conditions would indeed decrease results’ variability between laboratories. Hereafter are the instructions given for each validation ring test (VRT) regarding germination method and root criterion, which are summarized in Table 7:
- Validation Ring Test 1 (VRT1): no instructions for either germination method nor root criterion
- Validation Ring Test 2 (VRT2): no instructions for the germination method but use of root:shoot >= 0.5 to consider a seedling as normal (considering that the hypocotyl and cotyledons development is otherwise normal).
Table 7. Instructions given for the germination method and root criteria for the 1st and 2nd validation ring tests (2016)
Ring test no.
Germination method
Repetitions and no. of seeds
Pre- treatment
Germination temperature (°C)
Water supply (mL)
Light regime (light/dark)
Germination assessment (days after sowing)
Root:shoot threshold
1 Variable Variable Variable 15 Variable Variable Variable Variable 2 Variable Variable Variable 15 Variable Variable Variable 0.5 As mentioned in the introduction and in the previous chapter, we chose a root:shoot ratio of 0.5 for the VRTs (PP15) as using a ratio of 1 led to an under-estimation of the percentage of normal seedlings, when compared with germination tests done at 10 °C and in soil at 15°C. This decision was validated by the GERCOM members in 2016. Only normal seedlings were reported during the first counting assessment, while the number of seedlings with a short root was reported during the final assessment, as is done routinely by the laboratories. Statistical analysis
For all ring tests and validation ring tests, the data obtained was cleaned by removing the results from laboratories which did not respect the given instructions. This led to the exclusion of laboratories 2 and 8 for RT1, RT2 and RT3. Reporting the results is done anonymously in this report, as agreed upon with the seed companies. Ring tests RT1, RT2 and RT3 and Validation ring tests VRT1 and VRT2 The new tool from the ISTA Statistics Committee ‘ISTAgermMV’, designed for the analysis of the data from Method Validation studies, was used to produce the boxplots for VRT1 and VRT2 (analysis done by Jean-Louis Laffont, head of the ISTA Statistics Committee): per lot, per method, per lab, and the full combination between these factors. Data checking, repeatability/reproducibility and the mixed model analyses were also outputs of this statistical tool. In this report, only the most relevant charts were included, but the complete statistical reports (as communicated by M. Laffont) are made available to the ISTA committee if they were to be needed for re-evaluation or if additional information was necessary. As well, the raw data of all experiments is made available to ISTA if needed for follow-up or re-analysis.

ISTA Method validation reports for 2019 Edition of ISTA Rules
OGM18-07 ISTA Method Validation Reports Page 39/164 Approved ECOM Decision 18025
Results
Ring tests – not ISTA accredited labs
A wide range of phenotypes was encountered during the germination tests. Figures 2, 3 and 4 give some examples of what was considered as ‘short root’ seedlings and ‘other abnormal’ seedlings. The classification was uniform overall, as shown in the pictures. Due to a technical error, results of Lab 7 were saved for only one repetition of 100 seeds for RT1, instead of 4 repetitions of 100 seeds. These data were kept in the analysis and the statistical software adjusted accordingly to take this exception into account.
Figure 2. Examples of seedlings from lot 2, classified as ‘other abnormal’ (top of picture), ‘normal’ (middle of picture) and ‘short root’ (bottom of picture), 3rd ring test, 2015, Enza Zaden
Figure 3. Examples of seedlings from lot 2, classified as ‘short root’ (top of picture) and ‘other abnormal’ (bottom of picture), 3rd ring test, 2015, Incotec
‘Other abnormal’
Normal
‘Short root‘

ISTA Method validation reports for 2019 Edition of ISTA Rules
OGM18-07 ISTA Method Validation Reports Page 40/164 Approved ECOM Decision 18025
Figure 4. Examples of seedlings from lot 2, classified as ‘short root’ (left picture) and ‘other abnormal’ (right picture), 3rd ring test, 2015, Bayer
o Germination results by seed lot
Figure 5 presents the median values of the percentage of normal seedlings per lot, for all ring tests and all laboratories (excluding lab 2 and lab 8 as explained in the Material and Methods). Lot 1 gave 62.0 % of normal seedlings, lot 2 gave 72.7 % of normal seedlings and lot 3 gave 76.0 % of normal seedlings. The highest variability was found for lot 1, as shown in the side-by-side boxplots, while the variation for lots 2 and 3 was similar.
Figure 5. Percentage of normal seedlings per lot for all methods and all laboratories; into brackets = number of values
o Germination results by method
Figure 6 presents the median values of the percentages per method, for all lots and the eight laboratories. RT1 gave 81.0 % of normal seedlings, RT2 gave 78.0 % of normal seedlings and RT3 gave 60.0 % of normal seedlings. The drop in percentage of normal seedlings for RT3 can be explained by the fact that the root:shoot threshold was instructed to be 1, while for RT1 and RT2, 60 % of the laboratories were using a ratio equal to or less than 0.5 (Table 3; 5 labs using 0.5 and 1 lab using 0.25). Consequently, more seedlings were categorized as having a short root in RT3, leading to a higher percentage of abnormal seedlings.
‘Short root‘
‘Other abnormal’

ISTA Method validation reports for 2019 Edition of ISTA Rules
OGM18-07 ISTA Method Validation Reports Page 41/164 Approved ECOM Decision 18025
Figure 6. Percentage of normal seedlings per method for all lots and eight laboratories; red dots = outliers; into brackets = number of values
o Germination results by method x laboratory
As shown in Figure 7, there was a significant decrease of the percentage of normal seedlings for RT3, due to the change of root:shoot threshold from 0.5 to 1 for most laboratories, except those already using 1 as threshold for RT1 and RT2 (laboratories 7 and 10). The data shows certain variability between laboratories but it did not lead to the exclusion of any result for further analysis.
Figure 7. Percentage of normal seedlings for all samples per laboratory and per method; red dots = outliers; into brackets = number of values
o Germination results by laboratory x lot
Figure 8 shows the data grouped per lot and per laboratory. The variability between laboratories shown in Figure 7 is confirmed, for all lots. The least variation was found for lot 3 and the highest variation for lot 1, as expected. Indeed, it is known that batches with high quality have less variability than those with low quality, which is well illustrated here.

ISTA Method validation reports for 2019 Edition of ISTA Rules
OGM18-07 ISTA Method Validation Reports Page 42/164 Approved ECOM Decision 18025
Figure 8. Percentage of normal seedlings for all methods, per lot and per laboratory; red dots = outliers; into brackets = number of values
o Germination results by method x lot
Figure 9 shows the data of the percentage of normal seedlings for all laboratories per lot and per method. As graphically shown by the median value in the side-by-side boxplots, the variation was smaller for RT2 compared to RT1 for lots 2 and 3, illustrating that the diversity of germination methods also played a role in the results variability. The variation was also smaller for all lots for RT3 compared to RT1. The variation was smaller for RT3 compared to RT2 for lots 1 and 2, demonstrating that defining a clear root length criterion decreased the results variability between laboratories, for two of the three lots tested.
Figure 9. Percentage of normal seedlings per method and per lot; red dots = outliers; into brackets = number of values
o

ISTA Method validation reports for 2019 Edition of ISTA Rules
OGM18-07 ISTA Method Validation Reports Page 43/164 Approved ECOM Decision 18025
o Results of data checking
Data checking has been performed according to ISTA rules by computing tolerances for germination test replicates. Only one result was found out tolerance: Method Lot Lab Mean # Reps #
seeds/rep Range Tolerance Out of Tolerance
RT3 Lot1 Lab3 30 2 100 17 14 OUT
o Repeatability/Reproducibility
For each method, the following linear mixed model has been fitted: ( )ijk i j ijkij
y b b e= + + + +µ α α
ijky is the observed percent of normal seedlings in rep k of lot i and lab j µ is the intercept
iα is the fixed effect of lot i jb is the random effect of lab j; jb ~ i.i.d. N
2(0, )Labσ ( )ijbα is the random interaction effect between lot i and lab j ( )ijbα ~ i.i.d. N
2(0, )Lot Lab×σ ijke are the residuals; ijke ~ i.i.d. N
2(0, )σ
Repeatability standard-deviation is then given by 2
r ˆS = σ and reproducibility standard-
deviation by 2 2 2
R Lab Lot Labˆ ˆ ˆS ×= + +σ σ σ .
The dispersion factor is calculated as
2
(100 )r... ...
ˆmfp p
=−
σ
where ...p (100- ...p ) is the overall average percentage of normal seedlings and m is the number of seeds per rep (m = 100 in
this study). If rf > 1, one speaks of over dispersion because the data have a larger variance than expected under the assumption of a binomial distribution. Results (including ‘out of tolerance’ values):
Method ...p rS
rf RS
2Runσ̂
2Lot Runσ̂ ×
RT1 79 4.23 0.96 13.04 9.86 7.40
RT2 73 3.60 0.81 14.61 9.94 10.09
RT3 56 4.99 1.00 7.42 3.21 4.46
. ...p is the overall average percentage of germinated seeds
. Sr: is the repeatability standard-deviation (intra-lab)
. rf is an estimate of the dispersion parameter
. SR is the reproducibility standard-deviation (inter-lab) Though the repeatability standard-deviation and the dispersion factor increased for RT3, all three methods are valid regarding repeatability as the dispersion factor was close or equal to 1. We could observe a drastic decrease of the reproducibility standard-deviation from 14,61 for RT2 to 7,42 for RT3, meaning that the use of a fixed root criterion increased the uniformity of evaluation between laboratories.

ISTA Method validation reports for 2019 Edition of ISTA Rules
OGM18-07 ISTA Method Validation Reports Page 44/164 Approved ECOM Decision 18025
Conclusions Ring Tests 2014-2015
The ring tests have demonstrated that the germination results variation between laboratories was mainly caused by the diversity of root length criteria. Indeed, when fixing the germination method (RT2) the repeatability standard deviation and the dispersion factor decreased, meaning that the results were more uniform within each lab, though the reproducibility standard deviation slightly increased, meaning that the uniformity did not improve between labs. When comparing RT3 with RT2 (thus ignoring the impact of the factor ‘germination method’), the repeatability standard deviation and the dispersion factor increased, meaning that the addition of a root criterion for the assessment of spinach seedlings did not improve the uniformity within labs but the reproducibility standard-deviation decreased a lot, meaning that the evaluation was much more uniform between labs. This is illustrated by the side-by-side boxplots of Figure 10 (per lot and per method), where we can see that RT3 led to a much more uniform evaluation for two of the three lots tested (lots 1 and 2).
Figure 10. Percentage of normal seedlings per lot and per method; red dots = outliers; into brackets = number of values Validation study – ISTA accredited labs
Though Enza Zaden’s germination laboratory was not ISTA accredited, its results were included in the analysis as this laboratory has a lot of experience in spinach germination tests. Thus, including these results brings additional and relevant information to the study. Remark: The ‘out of tolerance’ results have been kept in the analysis so that repeatability and reproducibility estimates reflect the presence of these ‘out of tolerance’ results.
o Germination results by seed lot
Figure 11 presents the percentage of normal seedlings obtained for all methods, by all laboratories. As shown by the median value in the side-by-side boxplots, sample 1 gave 74.0 % of normal seedlings, sample 2 gave 83.5 %, sample 3 gave 80.0 %, sample 4 gave 85.5 %, sample 5 gave 83.5 % and sample 6 gave 89.4 %.

ISTA Method validation reports for 2019 Edition of ISTA Rules
OGM18-07 ISTA Method Validation Reports Page 45/164 Approved ECOM Decision 18025
Figure 11. Percentage of normal seedlings for all methods and all laboratories, per lot; red dots = outliers
o Germination results by method
Figure 12 shows the percentage of normal seedlings for all samples and all laboratories, per method. As graphically shown by the median value in the side-by-side boxplots, both VRT1 (red) and VRT2 (blue) gave 84.0 % of normal seedlings. Overall, the variation was smaller for VRT2, confirmed by the presence of several outliers for VRT1.
Figure 12. Percentage of normal seedlings for all samples and all laboratories, per method; red dots = outliers
o Germination results by method x laboratory
Figure 13 shows the percentage of normal seedlings for all samples per method and per laboratory. The data shows certain variability between laboratories. However, this did not lead to the exclusion of any result for further analysis. This indicates that other factors than the root length criterion in the germination protocols also created variation between laboratories, as could be suspected when looking at the diversity of methods listed in Table 6.

ISTA Method validation reports for 2019 Edition of ISTA Rules
OGM18-07 ISTA Method Validation Reports Page 46/164 Approved ECOM Decision 18025
Figure 13. Percentage of normal seedlings for all samples per laboratory and per method (VRT1 and VRT2); red dots = outliers
o Germination results by laboratory x lot
Figure 14 shows the data grouped per lot and per laboratory. The variability between laboratories shown in Figure 13 is confirmed, for all lots. The least variation was found for lot 6 and the highest variation for lot 1, as expected. Indeed, batches with high quality have less variability than those with low quality, which is well illustrated here. This did not lead to the exclusion of any result for further analysis.
Figure 14. Percentage of normal seedlings for both methods, per lot and laboratory; red dots = outliers
o Germination results by method x lot Figure 15 shows that the variation decreased for all lots between VRT1 and VRT2, though some outliers for lots 5 and 6 suggest that differences remained between laboratories for these lots.

ISTA Method validation reports for 2019 Edition of ISTA Rules
OGM18-07 ISTA Method Validation Reports Page 47/164 Approved ECOM Decision 18025
Figure 15. Percentage of normal seedlings per method and per lot; red dots = outliers
o Results of data checking Data checking has been performed according to ISTA rules by computing tolerances for germination test replicates. Four results were found out of tolerance:
Method Lot Lab Mean # Reps Range Tolerance Out of Tolerance
VRT1 Lot1 Lab6 90 4 13 12 OUT
VRT1 Lot3 Lab2 84 4 16 14 OUT
VRT2 Lot5 Lab2 93 4 12 10 OUT
VRT2 Lot6 Lab2 93 4 12 10 OUT
o Repeatability/Reproducibility
Results (including ‘out of tolerance’ values):
Method ...p rS
rf RS
2Runσ̂
2Lot Runσ̂ ×
VRT1 81 4.96 1.07 11.07 7.94 5.91
VRT2 82 4.74 1.04 8.37 5.14 4.61
. ...p is the overall average percentage of germinated seeds
. Sr: is the repeatability standard-deviation (intra-lab)
. rf is an estimate of the dispersion parameter
. SR is the reproducibility standard-deviation (inter-lab) The dispersion factor slightly decreased for VRT2 (fr = 1.04) compared to VRT1 (fr = 1.07) and both methods are valid regarding repeatability as the dispersion factor was close to 1. The repeatability improved for VRT2, as the repeatability standard-deviation decreased (Sr VRT1 = 4,96 vs Sr VRT2 = 4,74), as did the reproducibility, as shown by the reproducibility standard-deviation decrease between VRT 1 (SR = 11.07) and VRT2 (SR = 8.37). The statistical results regarding VRT1 and VRT2 obtained with the statistical tool ‘ISTAgermMV’ are presented in the following tables.

ISTA Method validation reports for 2019 Edition of ISTA Rules
OGM18-07 ISTA Method Validation Reports Page 48/164 Approved ECOM Decision 18025
Source of variation Sum Sq Mean Sq NumDF DenDF F.valu
e Pr(>F)
Method 2.70 2.70 1 6.05 0.11 0.75
Lot 753.59 150.72 5 30.96 6.41 0.00
Method:Lot 21.83 4.37 5 31.24 0.19 0.97
Method Lot Estimate Standard Error Lower CI Upper CI
VRT1 81.44 2.69 75.40 87.47
VRT2 82.33 2.69 76.29 88.36
Lot1 75.58 2.83 69.42 81.74
Lot2 80.55 2.89 74.32 86.78
Lot3 80.02 2.83 73.87 86.18
Lot4 84.10 2.83 77.94 90.25
Lot5 82.24 2.83 76.08 88.40
Lot6 88.80 2.83 82.64 94.96
VRT1 Lot1 75.14 3.33 68.22 82.06
VRT2 Lot1 76.02 3.33 69.09 82.94
VRT1 Lot2 79.33 3.43 72.25 86.40
VRT2 Lot2 81.77 3.43 74.69 88.84
VRT1 Lot3 79.51 3.33 72.58 86.43
VRT2 Lot3 80.54 3.33 73.62 87.47
VRT1 Lot4 84.43 3.33 77.50 91.35
VRT2 Lot4 83.77 3.33 76.84 90.69
VRT1 Lot5 81.38 3.33 74.45 88.30
VRT2 Lot5 83.11 3.33 76.18 90.03
VRT1 Lot6 88.84 3.33 81.92 95.76
VRT2 Lot6 88.76 3.33 81.84 95.68
Conclusions Validation Study
Overall, the additional root criterion did lead to a decrease of variation when considering the results of all lots and all labs for VRT2 compared to VRT1. When considering results per lot, there was a decrease of variation for all lots for VRT2 compared to VRT1, though a few outliers suggested that some differences remained for lot 5 and lot 6. This decrease of variation was reflected by the decrease of the repeatability standard-deviation and of the reproducibility standard-deviation. In conclusion, the addition of a root criterion (with root:shoot ratio = 0.5) for the assessment of spinach seedlings led to a more uniform evaluation between laboratories and within laboratories for all six lots tested.

ISTA Method validation reports for 2019 Edition of ISTA Rules
OGM18-07 ISTA Method Validation Reports Page 49/164 Approved ECOM Decision 18025
Discussion
We observed a clear decrease of variation per lot between RT2 and RT3 during the 2014-2015 ring tests, as for VRT1 and VRT2 in 2016. This proved that a root criterion can improve the uniformity of results between and within laboratories. However, the decrease of variation observed between RT1 and RT2 for lots 2 and 3 suggests that part of the variation observed was caused by the various germination conditions between laboratories. As explained before, the most accurate root:shoot ratio in relationship to the percentage of normal seedlings under optimal conditions was 1 for tests done at 10 °C and 0.5 for tests done at 15 °C. Hence, some variation will likely remain between laboratories even after the root criterion will be implemented (root:shoot ratio of 0.5), due to the diversity of germination conditions.
General Conclusion
Results from both the ring tests (not ISTA accredited laboratories) and the validation study (ISTA accredited laboratories) showed that using a root criterion for the assessment of Spinacia oleracea seedlings led to a more uniform evaluation between laboratories and within laboratories. Consequently, we recommend including the root:shoot ratio 1:2 = 0.5 in the ISTA rules in Chapter 5, under ‘5.2.7.Normal seedlings’, ‘5.2.7. 2. Slight defect’, as follows:
‘for Spinacia oleracea, the length of the primary root has to be equal to or greater than the half of the length of the hypocotyl’
Acknowledgments
Thanks to Enza Zaden, Pop Vriend and Bayer for providing the seed samples used in all the ring tests.
Thank you to the staff of all participating laboratories of seed companies and to the reference persons of each company: Richard Hogeboom from BEJO ZADEN B.V. (Netherlands), Antoon Grim and Marcel Toonen from NAKTUINBOUW (Netherlands), Jurre Kleine Schaars from GERMAINS SEED TECHNOLOGY (Netherlands), Petra Bakker from INCOTEC (Netherlands), Annitta Christensen from JENSEN SEEDS A/S (Denmark), Mieke Roost from BAYER NL (Netherlands), Elizabeth Bada from BAYER USA (United States of America), Sina Sietses from POP VRIEND (Netherlands) and Brit Malec from VIKIMA SEEDS A/S (Denmark).
Thanks to the staff of the participating ISTA laboratories: CREA (Italy), GEVES-SNES (France), NAKTUINBOUW (The Netherlands), ARO VOLCANI CENTER (Israel), LTZ (Germany) and SGS BROOKINGS (USA). Thanks in particular to the reference persons of those laboratories: Rita Zecchinelli, Sylvie Ducournau, Anton Grim/Marcel Toonen, Miriam Dekalo Keren, Andrea Jonitz and Sarah Dammen (respectively). Thank you to the Germination Committee members for their constructive input during our debates. The arguments which were raised helped to move this project forward. Thanks to Nadine Ettel, TCOM coordinator at the ISTA Secretariat and to Andreea Militaru, TCOM administrator for their support. Thanks to the technical reviewers Harry Nijenstein and Christine Herzog.

ISTA Method validation reports for 2019 Edition of ISTA Rules
OGM18-07 ISTA Method Validation Reports Page 50/164 Approved ECOM Decision 18025
Thanks to Jean-Louis Laffont and the ISTA Statistics Committee for running the statistical analyses and for M. Laffont’s reactivity, patience and expertise. A special thanks to Sylvie Ducournau for her patience, support and guidance during this project.
References
International Rules for Seed Testing, 2014, 272 pp. ISTA Method Validation for Seed Testing-V1.0 (https://www.seedtest.org/en/method-validation-programme-_content---1--1254.html)

ISTA Method validation reports for 2019 Edition of ISTA Rules
OGM18-07 ISTA Method Validation Reports Page 51/164 Approved ECOM Decision 18025
Validation study to use bio-PCR and seed extract PCR for pre-screening in the detection of Xanthomonas campestris pv. campestris and pv. raphani in Brassica seed; supporting the proposal C.7.1 to modify Seed Health Method 7-019a.
Maaike Bruinsma (Naktuinbouw)1; Thomas Baldwin (GEVES)2; Camille Ponzio (ISF)3. 1Naktuinbouw, PO Box 40, 2370 AA Roelofarendsveen, Netherlands.
E-mail: [email protected] 2GEVES-SNES, rue Georges Morel, BP 90024, 49071 Beaucouzé CEDEX, France
E-mail : [email protected] 3ISF, 7 chemin du Reposoir, 1260 Nyon, Switzerland E-mail: [email protected]
Abstract
The performance of two optional pre-screening methods - bio-PCR and seed extract PCR - in the detection of Xanthomonas campestris pv. campestris and pv. raphani (Xcc) in untreated cabbage (Brassica sp.) seeds was evaluated. As with dilution plating, bio-PCR and seed extract PCR showed a 100% sensitivity in the comparative test. Both bio-PCR and seed extract PCR show acceptable specificity and accuracy. Both methods show some possibility of false-positives, which is acceptable since these methods are suggested as a pre-screening method only. For positive samples both methods show high level accordance and concordance. Therefore, the results support the use of bio-PCR and seed extract PCR as pre-screening methods for ISTA 7-019a. It is therefore proposed to include both bio-PCR and seed extract PCR as pre-screening methods in ISTA 7-019a.
1. Introduction
Xanthomonas campestris pv. campestris (Xcc) (Pammel, 1895; Dowson, 1939) is a Gram-negative bacterium and is the causal agent of black rot in Brassica oleracea and other crucifers. The disease was first reported in the USA in the late 1880s. Since then, it has spread worldwide and is of high economic importance (CABI, 2014).
Xcc survives by overwintering in soil and seeds (Schaad, 1982; Schaad and White, 1974) and in cruciferous weeds near cabbage fields (Schaad and Dianese, 1981). Seeds are an important source of inoculum (Russel, 1898; Walker, 1952; Schultz and Gabrielson, 1986). Therefore, the use of pathogen-free seeds has been recommended for several decades (Williams, 1980; Schaad, 1988). The current reference method for the detection of Xcc on Brassica seeds is based on dilution plating (ISTA Rules 7-019a and b for untreated and treated seeds, respectively: Roberts and Koenraadt, 2014; Asma et al., 2014).
However, in classic dilution plating, a common problem is the growth of saprophytes. Excessive growth of saprophytes can hamper the recognition and isolation of Xcc colonies, even at high dilutions. Another disadvantage is the duration of the test to obtain the result.
ISTA Method validation reports for 2019 Edition of ISTA Rules
OGM18-07 ISTA Method Validation Reports Page 52/164 Approved ECOM Decision 18025
Therefore, several laboratories have developed molecular-based assays to detect Xcc, with the advantages of being sensitive, specific and faster. However, molecular methods do not give any information about viability of the pathogens not their pathogenicity (see ISF’s Viewpoint on Indirect Seed Health Tests, http://www.worldseed.org/wp-content/uploads/2015/10/Indirect_Seed_Health_Tests_2013.pdf). Therefore, molecular methods are used as a pre-screen followed by a bio-assay or grow-out.
The aim of the molecular-based method validation study was to measure the performance of two optional pre-screening methods - seed extract PCR and bio-PCR - in the detection of Xcc in untreated cabbage seeds. A PCR pre-screen must allow for the identification of true negative (healthy) seed lots and all putatively positive seed lots must be tested for confirmation of infection. Accordingly, if the pre-screen result is negative, the seed lots are considered to be healthy. If cabbage seed lots are found to be positive in the pre-screen, they are tested again using the reference method (dilution plating) as developed by Sato et al. (2015) (ISTA Rule 7-019a). A flow chart describing the sequence of methods and decisions in testing cabbage seed to detect the presence of Xcc is presented in Appendix 1.
Performance criteria were evaluated independently by Naktuinbouw and Vilmorin to compare seed extract PCR and bio-PCR, respectively, against the reference method. Validation data for seed extract PCR (analytical sensitivity & specificity, selectivity, repeatability, reproducibility and robustness) are covered in Chapter 2 while data for bio-PCR (analytical sensitivity, repeatability, and reproducibility) are the subject of Chapter 3. In Chapter 4 the results of the comparative test are presented. The comparative test was carried out to examine the two pre-screening methods in relation to the dilution-plating reference method (Sato et al. 2015, ISTA Rule 7-019a).
It is important to note that the work in Chapters 2, 3 and 4 were carried out in different laboratories and in different years. The validation studies on SE-PCR and bio-PCR were not done in the perspective of the comparative test, and thus there can be discrepancies between the methodologies presented within these studies and the method for which ISTA approval is sought via this report. The validation of the SE-PCR method was performed at Naktuinbouw as part of the EU-TESTA project (full title: TESTA- Seed Health: Development of Seed Treatment Methods, Evidence for Seed Transmission and Assessement of Seed Health) and the report was completed in 2015. The bio-PCR method was developed and internally validated at Vilmorin SA laboratories, in the period 2010-2011. The comparative test for ISTA was completed at a later date, with the test plan submitted and accepted mid-2015. The CT samples were sent to participants in February 2016. Addition of the validation data produced by Naktuinbouw and Vilmorin SA relevant to the CT was included to make the report more complete.
2. Validation of seed extract PCR by Naktuinbouw for detection of Xanthomonas campestris pv. campestris (Xcc) on untreated cabbage seeds (Brassica oleracea)
The method validated is a seed extract PCR based on two complementary Taqman assays, one specific for Xcc developed by Köhl et al. (2011) and the other detecting both Xcc and X.c. pv. raphani, X.c. pv. barbarae, X.c. pv. incanae and X.c. pv. aberrans, the causal agent of leaf spot disease of cruciferous and solanaceous hosts, as developed by Berg et al. (2006). Seed extract PCR detects pathogens directly in seed extract, without a culture step. Detection is in this case with real-time Taqman PCR. Because no culture step for bacteria is

ISTA Method validation reports for 2019 Edition of ISTA Rules
OGM18-07 ISTA Method Validation Reports Page 53/164 Approved ECOM Decision 18025
present in this method, it does not discriminate between viable and dead cells. The bacterium Acidovorax cattleyae (Acat) was used as an internal extraction control (IEC) in the seed extract PCR. The IEC was added as a spike to the seed wash prior further processing and was used to monitor the extraction of DNA and amplification in PCR. The protocol is described in the method proposal.
The following performance characteristics will be determined: analytical sensitivity, analytical specificity, selectivity, repeatability and reproducibility, trueness and robustness.
2.1. Analytical sensitivity
2.1.1. Introduction
Analystical sensitivity is defined as ‘The lowest value, in a laboratory sample, of the target pathogen or pest, which can still be determined with a certain degree of reliability’ (Anonymous, 2010).
Since the new assay should be as sensitive as dilution plating, testing by dilution plating is incorporated in this experiment. The requirements for this performance characteristic is the detection of at least the lowest concentration detected by dilution plating on the CS20ABN and mFS semi-selective media.
2.1.2. Materials and methods
2.1.2.1. Analytical sensitivity
The analytical sensitivity of the assay was determined by three dilution series, tested in triplicates. Negative seed extract (ZZB700) was spiked with Xcc (NBC278). The positive seed extracts were diluted with negative seed extract in ten-fold dilution series. The extracts were tested according to the protocol in the method proposal.
2.1.2.2. Calibration curve
In order to determine the number of cell per mL detected in the PCR reaction, a calibration curve was prepared. Cell cultures of Xcc (NBC278) were grown for 72 h in three separate tubes containing 4 mL of liquid medium (TSB). Each series of three 4 mLtubes was pooled in a 50 mL Greiner tube. The bacterial suspension was centrifuged at 3 000 × g for 10 min and resuspended with 10 mL of 0.05 M sPBS twice. Using a spectrophotometer the suspension was then adjusted to an OD620 of 1.0. DNA of three replicates of 500 µL of this bacterial suspension was isolated and purified using the DNeasy blood and tissue kit (Qiagen), according to the manufacturer’s recommendation for Gram positive bacteria. The amount of DNA was determined using a Nanodrop. Based on the yield obtained and the genome size of 5.1 Mb (Da Silva et al, 2002; Qian et al, 2005), the number of cells was calculated according using the following formula:

ISTA Method validation reports for 2019 Edition of ISTA Rules
OGM18-07 ISTA Method Validation Reports Page 54/164 Approved ECOM Decision 18025
number of copies = (amount * 6.022x10²³) / (length * 1x109 * 660) in units: number = (ng * number/mole) / (bp * ng/g * g/mole of bp) (Staroscik, 2015)
Using this DNA, three independent ten-fold dilution series were prepared in TE containing the Acat DNA with a Ct-value of approximately 27 (tested prior to use). Each dilution series was pooled to correct for dilution errors. A triplicate PCR reaction of the obtained dilution series was performed for each dilution. Based on the obtained Ct-values a calibration curve was prepared for both the FAM- and VIC-labeled probes. To determine the number of colony forming units (CFU)/mL, the dilution series (without Xcc or Acat) were also plated in duplicate onto GF, CS20ABN and mFS medium.
2.1.3. Results
To determine the analytical sensitivity, in total of nine replicates were tested per dilution. Nine seed extract subsamples Xcc was detected in dilutions up to 107 for both Xcc and Xcr (FAM) and Xcc (VIC), and subsequent dilutions were mostly negative (Table 1A and 1B). A curve was fitted to the results for both FAM and VIC (figure 1). This results in a detection limit of 46 cells/mL for FAM and 39 cells/mL for VIC at a 95% probability.
Using the DNA calibration curves, it was determined which Ct-value corresponds to these detection limits (figure 2). For FAM the calibration curve was calculated to be Ct = -1.423 ln(conc) + 43.815, therefore the Ct-value corresponding to 46 cells/mL is 38.4. For VIC the calibration curve was calculated to be Ct = -1.427 * ln(conc) + 44.046, therefore the Ct-value at 39 cells/mL is 38.6.
On semi-selective media, all six samples were detected in dilutions up to a theoretical concentration of 103 cells/mL (at least one of the media was detected as positive), subsequent dilutions were mostly negative (table 2). Therefore, the detection limit of dilution plating in seed extract was around 100 CFU/mL. For dilution plating on a non-selective medium, Xcc spiked in buffer could be detected up to dilutions of 108 on four out of six plates.

ISTA Method validation reports for 2019 Edition of ISTA Rules
OGM18-07 ISTA Method Validation Reports Page 55/164 Approved ECOM Decision 18025
Table 1A. Three dilution series of spiked Xcc in negative seed extract in triplicate for Xcc/Xcr (FAM). Ct-values per dilution (cells/mL).
Sample 1.03E+06 1.03E+05 1.03E+04 1.03E+03 103.00 10.30 1.03 0.10
1 A 20.22 23.27 26.75 29.89 34.04 34.43 35.04 >40
B 20.34 23.14 26.45 30.6 33.29 >40 36.04 >40
C 20.12 23.33 26.83 30.04 34.6 >40 >40 36.9
2 A 20.1 23.29 26.68 29.94 32.36 35.13 >40 >40
B 20.25 23.09 26.65 30.47 33.68 35.05 >40 >40
C 20.11 23.21 26.74 30.06 33.48 >40 >40 >40
3 A 20.19 23.41 26.64 29.85 34.06 35.1 >40 >40
B 20.26 23.04 26.75 31.01 33.86 34.63 >40 >40
C 20.11 23.29 26.72 30.13 33.3 >40 >40 >40
Positive reactions 9 9 9 9 9 5 2 1
Table 1B. Three dilution series of spiked Xcc in negative seed extract in triplicate for Xcc primerset ) labelled VIC). Ct-values per dilution (cells/mL).
Sample 1.03E+06 1.03E+05 1.03E+04 1.03E+03 103.00 10.30 1.03 0.10
1 A 20.88 23.93 27.23 30.33 34.37 >40 >40 >40
B 21.02 23.72 27.14 31.21 35.45 >40 >40 >40
C 20.65 24.1 27.54 30.97 35.06 >40 >40 >40
2 A 20.62 24.11 27.25 30.75 35.09 >40 >40 >40
B 21.1 23.59 27.16 31.34 33.29 >40 >40 >40
C 20.62 24.1 27.36 30.88 35.08 >40 >40 >40
3 A 20.81 24.32 27.26 30.66 33.78 35.59 >40 >40
B 21.11 23.61 27.29 31.32 35.45 35.17 >40 >40
C 20.58 24.21 27.39 30.97 34.41 >40 >40 >40
Positive reactions 9 9 9 9 9 2 0 0
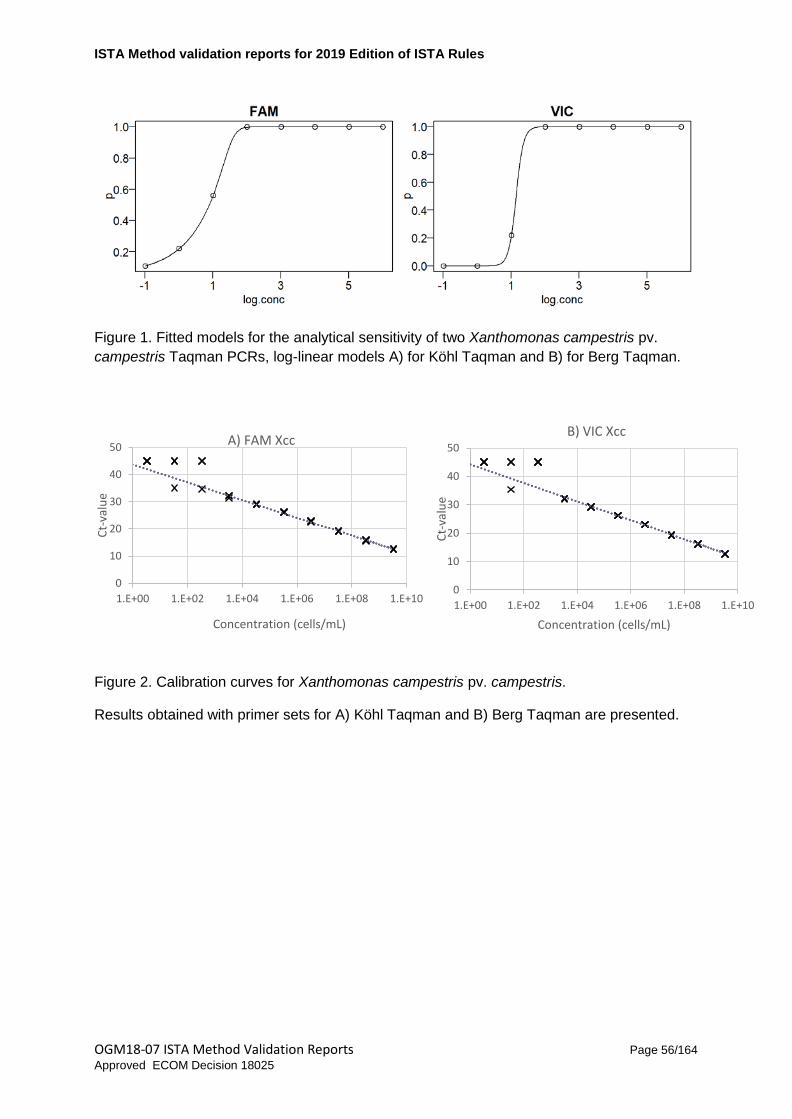
ISTA Method validation reports for 2019 Edition of ISTA Rules
OGM18-07 ISTA Method Validation Reports Page 56/164 Approved ECOM Decision 18025
0
10
20
30
40
50
1.E+00 1.E+02 1.E+04 1.E+06 1.E+08 1.E+10
Ct-v
alue
Concentration (cells/mL)
A) FAM Xcc
Figure 1. Fitted models for the analytical sensitivity of two Xanthomonas campestris pv. campestris Taqman PCRs, log-linear models A) for Köhl Taqman and B) for Berg Taqman.
Figure 2. Calibration curves for Xanthomonas campestris pv. campestris.
Results obtained with primer sets for A) Köhl Taqman and B) Berg Taqman are presented.
0
10
20
30
40
50
1.E+00 1.E+02 1.E+04 1.E+06 1.E+08 1.E+10
Ct-v
alue
Concentration (cells/mL)
B) VIC Xcc
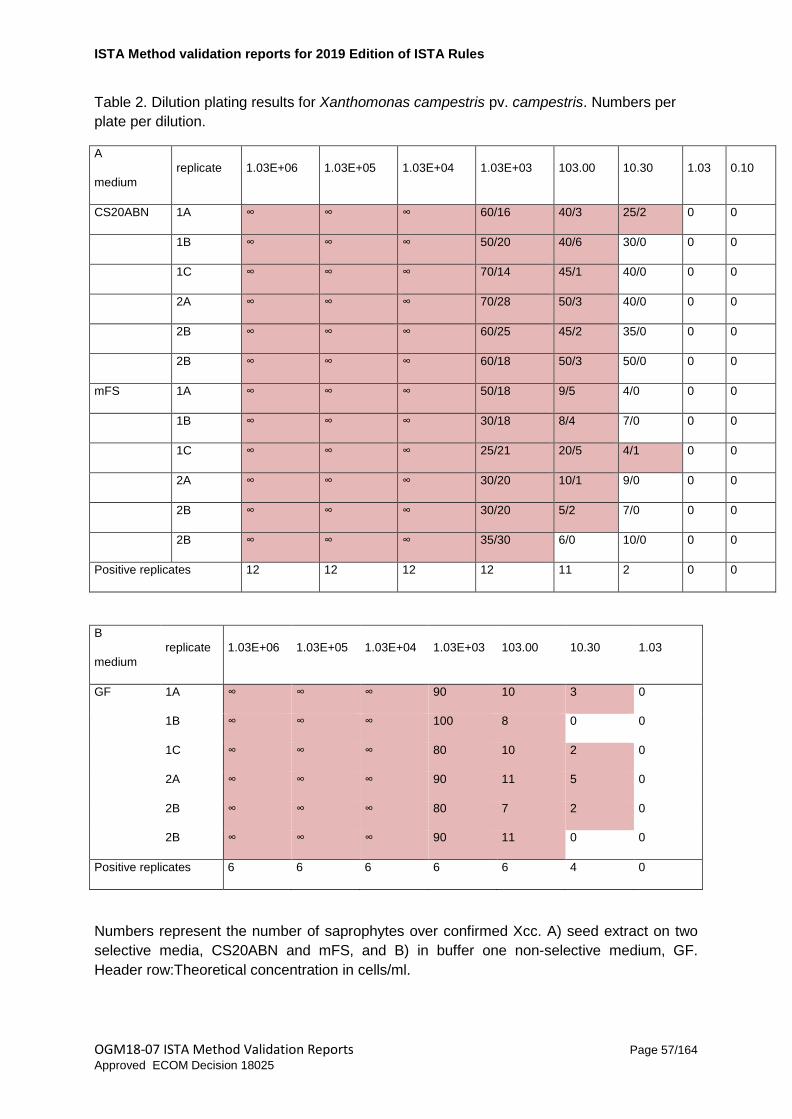
ISTA Method validation reports for 2019 Edition of ISTA Rules
OGM18-07 ISTA Method Validation Reports Page 57/164 Approved ECOM Decision 18025
Table 2. Dilution plating results for Xanthomonas campestris pv. campestris. Numbers per plate per dilution.
A
medium replicate 1.03E+06 1.03E+05 1.03E+04 1.03E+03 103.00 10.30 1.03 0.10
CS20ABN 1A ∞ ∞ ∞ 60/16 40/3 25/2 0 0
1B ∞ ∞ ∞ 50/20 40/6 30/0 0 0
1C ∞ ∞ ∞ 70/14 45/1 40/0 0 0
2A ∞ ∞ ∞ 70/28 50/3 40/0 0 0
2B ∞ ∞ ∞ 60/25 45/2 35/0 0 0
2B ∞ ∞ ∞ 60/18 50/3 50/0 0 0
mFS 1A ∞ ∞ ∞ 50/18 9/5 4/0 0 0
1B ∞ ∞ ∞ 30/18 8/4 7/0 0 0
1C ∞ ∞ ∞ 25/21 20/5 4/1 0 0
2A ∞ ∞ ∞ 30/20 10/1 9/0 0 0
2B ∞ ∞ ∞ 30/20 5/2 7/0 0 0
2B ∞ ∞ ∞ 35/30 6/0 10/0 0 0
Positive replicates 12 12 12 12 11 2 0 0
B
medium replicate 1.03E+06 1.03E+05 1.03E+04 1.03E+03 103.00 10.30 1.03
GF 1A ∞ ∞ ∞ 90 10 3 0
1B ∞ ∞ ∞ 100 8 0 0
1C ∞ ∞ ∞ 80 10 2 0
2A ∞ ∞ ∞ 90 11 5 0
2B ∞ ∞ ∞ 80 7 2 0
2B ∞ ∞ ∞ 90 11 0 0
Positive replicates 6 6 6 6 6 4 0
Numbers represent the number of saprophytes over confirmed Xcc. A) seed extract on two selective media, CS20ABN and mFS, and B) in buffer one non-selective medium, GF. Header row:Theoretical concentration in cells/ml.

ISTA Method validation reports for 2019 Edition of ISTA Rules
OGM18-07 ISTA Method Validation Reports Page 58/164 Approved ECOM Decision 18025
2.1.4. Discussion
The limit of detection at 95% probability was 46 cells/mL for the Köhl Taqman and 39 cells/mL for the Berg Taqman. These results reveal that the detection limits of both Taqman PCRs are slightly lower than the detection limit of the dilution plating method using CS20ABN and mFS, therefore the requirement for analytical sensitivity is obtained. This measurement is based on spiked samples with freshly prepared Xcc culture. In naturally contaminated samples, it is expected that samples with viable Xcc also carry some dead Xcc that will be detected by the PCR method, and that this will therefore increase the sensitivity of the PCR method.
2.2. Analytical specificity
2.2.1. Introduction
Analytical specificity represents ’The ability of a method to distinguish the target organism (pathogen) from other organisms, whether related or not, and the extent to which the analysis can distinguish (known) variants of the organism’ (Anonymous, 2010).
For this assay the requirement is that the two primer sets for Xcc together do not miss any isolates and few false-positives are acceptable. Therefore the diagnostic sensitivity - the probability of a positive test result given that the sample is positive - should reach 1. The diagnostic specificity- the probability of a negative test result given that the sample is not contaminated - for the two primer sets is required to be above 95%.
2.2.2. Materials and methods
A collection of 70 Xcc and look-alike Xcc isolates from Naktuinbouw, selected based on genetic and geographic variation and previously characterized by AFLP, were tested with the triplex Taqman PCR to determine the specificity of the primer sets (for sequences see Table 3). The DNA was isolated from an extract with approximately 106 cells/mL. In literature, the Köhl and Berg primer sets for Xcc and Xca have already been tested. Data are presented in Appendix 6.

ISTA Method validation reports for 2019 Edition of ISTA Rules
OGM18-07 ISTA Method Validation Reports Page 59/164 Approved ECOM Decision 18025
Table 3. Primer sets triplex Taqman PCR Xanthomonas campestris pv. campestris (Xcc), Xanthomonas campestris pv. raphani (Xcr) and Acidovorax cattleyae (Acat).
Primer name Target Developed by Sequence
XCC F Xcc Köhl et al, 2011 5’ CGG ATG CAG AGC GTC TTA CA 3’
XCC R 5’ GTG CAT AGG CCA CGA TGT TG 3’
XCC Pr 5’ FAM-CAA GCG ATG TAC TGC GGC CGT G-NFQ-MGB 3’
DLH153-F Xcc/Xcr Berg et al, 2006 5’ GTA ATT GAT ACC GCA CTG CAA 3’
DLH154-R 5’ CAC CGC TCC AGC CAT ATT 3’
P7 5’ VIC-ATG CCG GCG AGT TTC CAC G-BHQ1 3’
Acat – F Acat Naktuinbouw, 5’ TGTAGCGATCCTTCACAAG
Acat – R elongated primer set 5’ TGTCGATAGATGCTCACAAT
Acat – P 5’ Texas Red-CTT GCT CTG CTT CTC TAT CAC G-BHQ2 3’
Acat: Acidovorax cattleyae.
2.2.3. Results
Of the 70 isolates tested by AFLP, 15 isolates were out of the tree and 55 in the tree. Most isolates responded as expected with both Taqmans. However, seven isolates were positive for one or both Taqmans for isolates out of the tree and some were negative when they were in the tree. In these cases a pathogenicity assay was performed to confirm results obained. The results confirmed that all isolates positive with the Berg Taqman were indeed pathogenic Xcc or Xca. For the Köhl Taqman, if the Köhl Taqman but not the Berg Taqman was positive, the isolates were not pathogenic (see table 4and appendix 7).
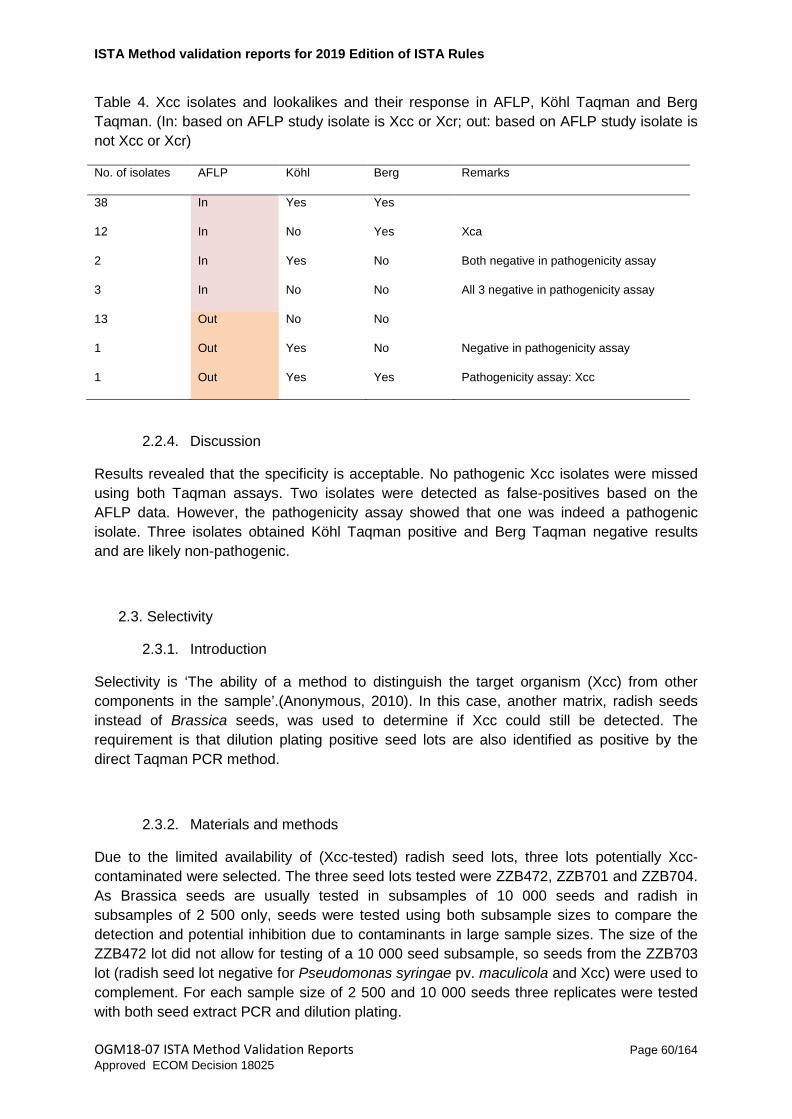
ISTA Method validation reports for 2019 Edition of ISTA Rules
OGM18-07 ISTA Method Validation Reports Page 60/164 Approved ECOM Decision 18025
Table 4. Xcc isolates and lookalikes and their response in AFLP, Köhl Taqman and Berg Taqman. (In: based on AFLP study isolate is Xcc or Xcr; out: based on AFLP study isolate is not Xcc or Xcr)
No. of isolates AFLP Köhl Berg Remarks
38
12
2
3
In
In
In
In
Yes
No
Yes
No
Yes
Yes
No
No
Xca
Both negative in pathogenicity assay
All 3 negative in pathogenicity assay
13
1
1
Out
Out
Out
No
Yes
Yes
No
No
Yes
Negative in pathogenicity assay
Pathogenicity assay: Xcc
2.2.4. Discussion
Results revealed that the specificity is acceptable. No pathogenic Xcc isolates were missed using both Taqman assays. Two isolates were detected as false-positives based on the AFLP data. However, the pathogenicity assay showed that one was indeed a pathogenic isolate. Three isolates obtained Köhl Taqman positive and Berg Taqman negative results and are likely non-pathogenic.
2.3. Selectivity
2.3.1. Introduction
Selectivity is ‘The ability of a method to distinguish the target organism (Xcc) from other components in the sample’.(Anonymous, 2010). In this case, another matrix, radish seeds instead of Brassica seeds, was used to determine if Xcc could still be detected. The requirement is that dilution plating positive seed lots are also identified as positive by the direct Taqman PCR method.
2.3.2. Materials and methods
Due to the limited availability of (Xcc-tested) radish seed lots, three lots potentially Xcc-contaminated were selected. The three seed lots tested were ZZB472, ZZB701 and ZZB704. As Brassica seeds are usually tested in subsamples of 10 000 seeds and radish in subsamples of 2 500 only, seeds were tested using both subsample sizes to compare the detection and potential inhibition due to contaminants in large sample sizes. The size of the ZZB472 lot did not allow for testing of a 10 000 seed subsample, so seeds from the ZZB703 lot (radish seed lot negative for Pseudomonas syringae pv. maculicola and Xcc) were used to complement. For each sample size of 2 500 and 10 000 seeds three replicates were tested with both seed extract PCR and dilution plating.

ISTA Method validation reports for 2019 Edition of ISTA Rules
OGM18-07 ISTA Method Validation Reports Page 61/164 Approved ECOM Decision 18025
2.3.3. Results
The results for 2 500 and 10 000 seeds were similar (table 5). For the seed lot ZZB701, the Ct value obtained in both sample sizes was around 22, and in dilution plating 6-60 suspect colonies were detected in the 100x dilution. Seed lots ZZB472 and ZZB704 were found to be negative in dilution plating, but had Ct-values between 30 and 35.
Table 5. Detection of Xanthomonas campestris pv. campestris on seeds of radish in subsamples of 2 500 or 10 000 seeds.
No. of seeds Seed lot Subsample Xcc
(FAM)
Xcc/Xcr
(VIC)
Acat
(Texas Red)
Dilution plating result
2500
ZZB 472
A 31.35 31.4 25.74 Neg
B 31.64 31.91 26.14 Neg
C 31.92 32.05 26.06 Neg
ZZB 701
A 22.23 22.63 25.78 Pos
B 22.68 23.21 25.79 Pos
C 22.99 23.29 25.98 Pos
ZZB 704
A 30.58 31.09 26.34 Neg
B 30.47 31.75 26.55 Neg
C 30.53 31.16 26.24 Neg
10000 ZZB 472 (1000) + ZZB 703 (9000)
A 35.12 34.17 26.16 Neg
B 35.79 33.05 26.41 Neg
C 33.35 34.17 26.34 Neg
ZZB 701
A 22.07 22.35 26.63 Pos
B 22.05 22.35 26.61 Pos
C 21.13 21.43 26.28 Pos
ZZB 704
A 30.49 30.55 27.04 Neg
B 30.33 30.53 26.67 Neg
C 30.06 30.27 26.25 Neg
ISTA Method validation reports for 2019 Edition of ISTA Rules
OGM18-07 ISTA Method Validation Reports Page 62/164 Approved ECOM Decision 18025
2.3.4. Discussion
Since no difference was observed in results for the two subsample sizes, it was decided to use subsamples of 2 500 seeds for radish and 10 000 seeds for Brassica. Unfortunately, only seed lot, ZZB701, was detected as infected using both dilution plating and seed extract PCR assays. For the other two seed lots, it was not possible to determine whether these are seed extract PCR false-positives (e.g. caused by dead cells) or dilution plating false-negatives. However, the three seed lots were detected as positive by seed extract PCR, showing that this method meets the requirements set for this performance criteria. It is recommend to first perform parallel testing to identify other positive seed lots, and thus determine with certainty that no positive seed lots will be missed with the new assay.
2.4. Repeatability and reproducibility
2.4.1. Introduction
Repeatability is ‘the degree of correspondence between the results of successive measurements of the same measurand performed under equal conditions’ (Anonymous, 2010). Reproducibility is ‘the degree of correspondence between the results of measurements of the same measurand performed under varying measurement conditions’ (Anonymous, 2010). The requirement for this characteristic was set at at least 95%.
2.4.2. Materials and methods
Three samples (A,B,C) were prepared as presented in Table 6 in order to obtain 16 replicates per sample. For repeatability, eight replicates were tested on one day by one operator at the Naktuinbouw R&D department. For reproducibility, eight replicates were tested over several days by different operators at the routine laboratory of Naktuinbouw.
Table 6. Sample composition for repeatability and reproducibility.
Sample A
Sample B
Sample C
Extract of 10 000 seeds ZZB473 diluted 1000x in negative seed extract of ZZB547
300 seeds ZZB695 + 9 700 seeds ZZB694
100 seeds ZZB689 + 9 900 seeds of negative seed lot ZZB700
2.4.3. Results
The three contaminated samples were tested with eight replicates each. All replicates gave the same qualitative test result. The quantitative variation between replicates was limited (Figure 3 and Appendix 8).

ISTA Method validation reports for 2019 Edition of ISTA Rules
OGM18-07 ISTA Method Validation Reports Page 63/164 Approved ECOM Decision 18025
0
5
10
15
20
25
30
35
40
45
A B C
Ct-v
alue
Sample
FAM VIC Texas Red
B
2.4.4. Discussion
Repeatability and reproducibility were good with small variation between replicates , even for the low-level infected sample (sample A).
Figure 3. A) Repeatability and B) reproducibility for three samples infected with Xanthomonas campestris pv. campestris (n=8). Average + standard deviation
2.5. Robustness
2.5.1. Introduction
Robustness represents ‘The degree of insensitivity of the results of a measurement to deviations in procedure, circumstances and nature of materials like these may occur in practice’ (Anonymous, 2010).
Due to the soaking time of this assay and the duration of several extraction steps, it is not possible to perform the whole assay in one day in a routine setting. Therefore, the effect of cooling or freezing the extract or pellet on several points in the protocol on the detection of Xcc was investigated. No significant deviation from treatment F (table 8) is allowed.
2.5.2. Materials and methods
Three samples were prepared that were subjected to six different treatments and tested in eightfold. The sample composition is described in table 7 and the six treatments in table 8.
A
0
5
10
15
20
25
30
35
40
45
A B C
Ct-v
alue
Sample FAM VIC Texas Red

ISTA Method validation reports for 2019 Edition of ISTA Rules
OGM18-07 ISTA Method Validation Reports Page 64/164 Approved ECOM Decision 18025
Table 7. Sample composition for robustness experiment.
Sample 1
Sample 2
Sample 3
10 000 seeds ZZB473
100 seeds ZZB689 + 9900 seeds of negative seed lot ZZB700
10 000 seeds ZZB700
Table 8. Treatments for robustness experiment.
A
B
C
D
E
F
Make seed wash extract and freeze1 after soaking
Make seed wash extract and cool2 after soaking
Concentrate bacteria and freeze pellet
Lysis and freeze
Isolate DNA and freeze eluate
Do not freeze or cool (complete protocol on one day)
1 freezing = -20°C, 2 cooling = 4°C
2.5.3. Results
No significant difference was observed between any of the treatments for both target primer sets (Figure 4 and Appendix 9).
2.5.4. Discussion
No significant effect of freezing or cooling steps was observed. Therefore, the protocol can be stopped and continued at a later time point without significantly affecting the results of the assay. The requirement for the robustness was met.
05
101520253035404550
1 2 3
Ct-v
alue
Sample
FAM Xcc
A
B
C
D
E
F 05
101520253035404550
1 2 3
Ct-v
alue
Sample
VIC Xcc/Xcr
A
B
C
D
E
F

ISTA Method validation reports for 2019 Edition of ISTA Rules
OGM18-07 ISTA Method Validation Reports Page 65/164 Approved ECOM Decision 18025
Figure 4. Average Ct-values (+ standard deviation) for three samples for six treatments (n=8). A) freeze after soaking B) cool after soaking, C) freeze pellet, D) freeze after lysis, E) freeze DNA, F) no freezing or cooling.
3. Validation of a bio-PCR method by Vilmorin SA for the detection of Xanthomonas campestris pv. campestris and Xanthomonas campestris pv. raphani on radish and cabbage seeds
3.1. Introduction
3.1.1. Scope of the test
A new method was developed as a pre-screen to the dilution plating method by using gel-based bio-PCR and by real-time SYBR-green based bio-PCR methods. This method was developed and internally validated in the Vilmorin laboratory (2010-2011). Bio-PCR consists of biological amplification followed by conventional gel-based (electrophoresis) PCR or real-time SYBR-green based PCR. Prior to the PCR step, bacterial cells are cultured on media, which increases method sensitivity and allows for earlier detection of target bacteria.
The same primers were retained for the gel based bio-PCR method, namely DLH120-125 primers. These primers were replaced by the DLH153-154 primers for the real-time bio-PCR method. These primers also target the hrpF gene, but amplify a smaller PCR product adapted for real-time PCR (Berg et al., 2006). The DLH153-154 primers have been tested on a range of Xcc and Xcr strains (see Appendix 6)
The performance characteristics that have been tested are: Analytical specificity, Repeatability and Reproducibility.
3.1.2. Validation material
Performance characteristic Validation material
Analytical sensitivity Spiked and blank laboratory samples
Repeatability/reproducibility Naturally infected seed samples
3.2. Analytical sensitivity
Seed extracts from three subsamples of 10 000 seeds were spiked with different dilutions of Xcc and Xcr control isolates. Each dilution was also plated on mFS media, which allowed for a visual quantification of the number of colony forming units (CFUs). The analytical sensitivity was identified with:

ISTA Method validation reports for 2019 Edition of ISTA Rules
OGM18-07 ISTA Method Validation Reports Page 66/164 Approved ECOM Decision 18025
• A sample of 30 000 seeds from an uninfected untreated radish seed lot (Tables 10 and 11).
• A sample of 30 000 seeds from an uninfected disinfected radish seed lot (Tables 12 and 13).
• A sample of 30 000 seeds from an uninfected untreated cabbage seed lot (Tables14 and 15).
• A sample of 30 000 seeds from an uninfected disinfected cabbage seed lot (Tables 16 and 17)
Seed wash from each subsample of each seed lot was artificially inoculated by mixing 4.5 mL seed wash with 0.5 mL bacterial dilutions serially diluted from d0 to d7. On each plate, 100 µL of the seed wash macerate was plated. Positive and negative controls were included and 100 µL of each bacterial dilution was plated on mFS for visual quantification of CFU numbers after 4 days incubation. For each test, the number of CFUs counted on each control plate was used to estimate the number of CFUs present in each artificially inoculated seed wash subsamples.
All subsamples were tested using the DLH120-125/Zup2309-2310 duplex PCR method. The extractions from the untreated radish seeds and the disinfected cabbage seeds were also tested using the qPCR method. The number of CFUs detected by PCR and real-time PCR were identical for the untreated radish seed extractions. Results showed that the real-time PCR method was more sensitive on one of the subsample from cabbage disinfected seeds (Table 31).
A total of 12 subsamples were inoculated with either Xcc or Xcr: The mean CFU mL concentrations detected were 37.8 and 34.8 for Xcc and Xcr, respectively (Table 23). By adding 3 standard deviations as proposed in the Dutch guideline for plant pathogens and pests version 2. The detection limits were estimated to be 201 and 197 CFU mL.

ISTA Method validation reports for 2019 Edition of ISTA Rules
OGM18-07 ISTA Method Validation Reports Page 67/164 Approved ECOM Decision 18025
Table 9. Gel-based PCR detection limits CFU/mL (mean+ 3 standard deviations) on radish and cabbage seeds
Subsample Detectable concentrations (CFU/mL)
Xcc Xcr
J46465.1 4.6 16
J46465.2 21 16
J46465.3 21 16
J73553.1 23 20
J73553.2 192 2
J73553.3 23 20
J63887.1 24 15
J63887.2 24 150
J63887.3 24 150
J73552.1 13 4
J73552.2 13 4
J73552.3 1.3 4
Mean 37.8 34.8
SD 54.3 54.2
Detection Limit 201 197
3.2.1. Radish untreated seed lots
Table 10. Number of CFUs observed on control plates 4 days after plating (CFU/100 µL)
Dilution Number of colonies observed
Xcc Xcr
D6 46 16
D6 (1:2 dilution) 21 6
D7 0 2

ISTA Method validation reports for 2019 Edition of ISTA Rules
OGM18-07 ISTA Method Validation Reports Page 68/164 Approved ECOM Decision 18025
Table 11. PCR detection limits CFU/mL (mean+ 3 standard deviations) on untreated radish seeds
Subsample Detectable concentrations (CFU/mL)
Xcc Xcr
J46465.1 4.6 16
J46465.2 21 16
J46465.3 21 16
Mean 15.5 16
Standard Deviation 9.5 0
Detection Limit 44 16
3.2.2. Radish disinfected seed lots
Table 12. Number of CFUs observed on control plates 4 days after plating (CFU/100 µL)
Dilution Number of colonies observed
Xcc Xcr
D5 192 148
D6 23 20
D7 7 2
Table 13. PCR detection limits CFU/mL (mean+ 3 standard deviations) on disinfected radish seeds
Subsample Detectable concentrations (CFU/mL)
Xcc Xcr
J73553.1 23 20
J73553.2 192 2
J73553.3 23 20
Mean 79.3 14
Standard Deviation 97.6 10.4
Detection Limit 372 45

ISTA Method validation reports for 2019 Edition of ISTA Rules
OGM18-07 ISTA Method Validation Reports Page 69/164 Approved ECOM Decision 18025
3.2.3. Cabbage untreated seed lots
Table 14. Number of CFUs observed on control plates 4 days after plating (CFU/100 µL)
Dilution Number of colonies observed
Xcc Xcr
D5 24 ND
D6 0 15
D7 0 0
Table 15. PCR detection limits CFU/mL (mean+ 3 standard deviations) on untreated cabbage seeds
Subsample Detectable concentrations (CFU/mL)
Xcc Xcr
J63887.1 24 15
J63887.2 24 150
J63887.3 24 150
Mean 24 105
Standard Deviation 0 78
Detection Limit 24 339
3.2.4. Cabbage disinfected seed lots
Table 16. Number of CFUs observed on control plates 4 days after plating (CFU/100 µL)
Dilution Number of colonies observed
Xcc Xcr
D5 ND 104
D6 13 4
D7 0 0

ISTA Method validation reports for 2019 Edition of ISTA Rules
OGM18-07 ISTA Method Validation Reports Page 70/164 Approved ECOM Decision 18025
Table 17. PCR detection limits CFU/mL (mean+ 3 standard deviations) on disinfected cabbage seeds
Subsample Detectable concentrations (CFU/mL)
Xcc Xcr
J73552.1 13 4
J73552.2 13 4
J73552.3 1.3 4 (0.4 qPCR)
Mean 9.1 4
Standard Deviation 6.8 0
Detection Limit 29 4
3.3. Repeatability and Reproducibility
Eight different untreated radish seed lots were selected for repeatability and reproducibility tests. A sample from each seed lot was divided into three sub-samples which were tested as independent samples using the Bio- PCR method. A test of repeatability was done by the same user testing the samples in duplicate. A second user tested the method at a different time point (Table 14).
Table 18. Overview of the validation process for Xanthomonas bio-PCR on untreated Radish seeds
Seedlot N° lot Dilution
Plating result Lecture
Test 1A
User 1
Test 1B
User 1
Test 2
User 2
PCR qPCR PCR qPCR PCR qPCR
1 J53215 Infected (3/3) D1 + + + + + +
2 J65365 Infected (2/3) D1 + + - - + +
3 J65367 Infected (2/3) D2 + + + + + +
4 J64993 Infected (1/3) D2 + + - - + +
5 J64990 Infected (1/3) D1 + + + + + +
6 J64958 Infected (1/3) D2 + + + + + +
7 J65346 Non-Infected D2 + + + + + +
8 J60522 Non-Infected D0 - - - - - -
Infected= (number of sub-samples positive/total sub-samples)

ISTA Method validation reports for 2019 Edition of ISTA Rules
OGM18-07 ISTA Method Validation Reports Page 71/164 Approved ECOM Decision 18025
For all tests for measuring repeatability and reproducibility, similar results were obtained from both the PCR and real-time PCR when used to test the same sub-samples. The consistency of the results obtained with the two methods, as well as the similar detection limits, allows the two amplification methods to be validated for use in this test. The repeatability between sub-samples is 14/16, thus reaching 87.5%. The reproducibility is 22/24, or 91.6%.
Two differences were observed in the repeatability tests: For both J65365 and J64993, only two of the three subsamples were detected as positive. This represents the medium to low contamination of these seed lots observed in the dilution-plating experiments. Using the dilution-plating method and due to the high saprophyte contamination, it was not possible to detect Xcc in the J65346 seed lot, however all three subsamples were detected as positive using the bio-PCR method.
3.4. Robustness
The real-time PCR method was used in routine testing on several seed lots in parallel with the dilution- plating method (appendix 10).
Table 19. Comparison between real-time bio-PCR and dilution plating
Number of seed lots Real-time bio-PCR positive Real-time bio-PCR negative
Dilution-plating positive 4 0
Dilution-plating negative 3 9
No false-negative results were observed with the bio-PCR method (Table 19). However three seed lots were detected as positive with the bio-PCR method, while they were negative with the dilution-plating method. This depicts an increased sensitivity in the bio-PCR method as compared to the dilution plating method.
During these robustness tests inhibition in certain positive control real-time PCR reactions was observed. The volume of extract (5 µL) in each reaction was found to cause inhibition of the amplification. Different volumes of extract were tested for presence/absence of inhibition of the reaction. No PCR inhibition was observed when using 1 µl or 2 µL (data not shown). The volume of 2µl was selected for the DNA extract volume, in addition the real-time PCR reactions were divided into two simplex reactions to simplify melt curve interpretation.
3.5. CONCLUSION
In conclusion, the real-time PCR reaction conditions below applied on bio-PCR extracts were selected for validation in the ISHI-Veg inter-laboratory comparative test. It was also decided to restrict the scope of real-time bio-PCR method to untreated seeds for ISHI-Veg method.

ISTA Method validation reports for 2019 Edition of ISTA Rules
OGM18-07 ISTA Method Validation Reports Page 72/164 Approved ECOM Decision 18025
4. Comparative test for pre-screening untreated cabbage seed by bio-PCR and seed-extract PCR
4.1. COMPARATIVE TEST ORGANIZATION
An interlaboratory comparative test for the detection of Xanthomonas campestris pv. campestris on Brassica seeds by dilution plating, bio-PCR and seed extract PCR was organized by Naktuinbouw.
4.1.1. Participants and protocol
Ten laboratories participated in this test and were randomly allocated to a number, so that the results remain anonymous. All ten performed the dilution plating according to ISTA rule 7-019a, six laboratories performed the bio-PCR and eight laboratories performed the seed extract PCR according to the PCR protocols as described in the new proposed version of ISTA rule 7-019a. Four laboratories performed both the bio-PCR and the seed extract PCR.
4.1.2. Seed samples
Each laboratory received 15 sub-samples of 10 000 untreated cabbage seeds each (see Table 20 and Appendix 2):
- three subsamples from a healthy lot.
- three of each of the three subsamples with a medium level of Xcc infection obtained by blending a healthy (ZZB-549) or slightly infected lot (ZZB-694) with a naturally Xcc infected lot (ZZB-695).
- three subsamples from a highly and naturally infected lot.
Based on the pre-tests, all healthy subsamples were expected to be negative, all positive samples to be positive with 103 – 106 CFU/mL for the medium and over 106 CFU/mL for the high infection level samples.
DNA of Xcc and Acidovorax cattleyae was sent to the laboratories as the Positive Amplification Control and the Positive Extraction Control, respectively, during the seed extract PCR method.

ISTA Method validation reports for 2019 Edition of ISTA Rules
OGM18-07 ISTA Method Validation Reports Page 73/164 Approved ECOM Decision 18025
Table 20. Composition of samples for ISTA CT Xcc 2016.
Infection level Category no. of sub-samples Composition of subsamples
Healthy 1 3 10 000 seeds ZZB-700
Medium 2.1 3 3 000 seeds ZZB-695 + 7 000 seeds ZZB-694
Medium 2.2 3 1 000 seeds ZZB-695 + 9 000 seeds ZZB-694
Medium 2.3 3 3 000 seeds ZZB-695 + 7 000 seeds ZZB-549
High level 3 3 10 000 seeds ZZB-689
4.1.3. Notation of results
Participants reported a qualitative (positive/negative) result for each subsample.
4.2. STATISTICAL ANALYSIS
4.2.1. Homogeneity test
The homogeneity test results were analysed using tools provided by ISTA: Seedcalc8 and probpossample-V1. These tools calculate the expected number of positive subsamples in the comparative test and stability test, respectively. Using the results of the homogeneity test, the infection rate in the sample was calculated for each non-homogenous sample. Using the infection rate and a probability of 5%, the expected number of positive subsamples was calculated.
4.2.2. Stability test
The number of positive subsamples per category were compared to the expected number of positive subsamples as calculated based on the homogeneity test.
4.2.3. Comparative test: Analysis of qualitative data
Samples with no expected variation in the qualitative test result (i.e. positive or negative) were analysed according to the Standard NF EN ISO 16140 (AFNOR, 2003). Sensitivity, specificity, accuracy and reproducibility were calculated using the following formulas:
Sensitivity = ΣPA / (ΣPA+ΣND) x 100
Specificity = ΣNA / (ΣNA+ΣPD) x 100
Accuracy = (ΣNA+ΣPA) / (ΣPA+ΣNA+ΣPD+ΣND) x 100

ISTA Method validation reports for 2019 Edition of ISTA Rules
OGM18-07 ISTA Method Validation Reports Page 74/164 Approved ECOM Decision 18025
Where:
PA = positive agreement
ND = negative deviation
NA = negative agreement
PD = positive deviation
Although there is no fixed rule, values over 80% for sensitivity, specificity and accuracy were deemed acceptable (ISTA, 2013). This minimum value is used here to determine whether a method is acceptable or not.
For the infection level categories where the expected outcome is variable and depends on the percentage of infection, results of the homogeneity test were used as a reference (ISTA, 2013). For each infection level category, accordance (repeatability of qualitative data) and concordance (reproducibility of qualitative data) were calculated using the method and tools developed by Langton et al. (2002).
4.3. ANALYSIS OF XCC CT: HOMOGENEITY AND STABILITY TESTS
4.3.1. Dilution plating
4.3.1.1. Homogeneity test
Three sets of 3 subsamples were tested per infection level before the comparative test and after packaging. This included nine healthy subsamples, 27 medium level infected subsamples (nine of each sub category 2.1, 2.2 and 2.3) and nine high infection level subsamples. The homogeneity test for dilution plating showed that all healthy subsamples were negative, 26 of medium infection level subsamples were positive and all high infection level subsamples were positive (see Table 21 and Appendix 3).
Table 21. Results of the homogeneity and stability test for dilution plating per infection level.
Infection level Homogeneity results Stability results
1 (healthy) 0/9 0/3
2.1 (medium) 9/9 3/3
2.2 (medium) 8/9 3/3
2.3 (medium) 9/9 3/3
3 (high) 9/9 3/3
Results present the number of positive subsamples over the total number of subsamples

ISTA Method validation reports for 2019 Edition of ISTA Rules
OGM18-07 ISTA Method Validation Reports Page 75/164 Approved ECOM Decision 18025
Using the results of the homogeneity test, the sample infection rate was calculated to be 0.02% for category 2.2. At a probability of 5%, the expected number of positive subsamples is thus two to three for category 2.2 (Table 22). In the other infected categories (2.1, 2.3 and 3), all subsamples are expected to be positive, and in the healthy category (1), none of the subsamples are expected to be positive.
Table 22. Probability of number of positive subsamples (k) out of total number of subsamples (n) in the stability and comparative test for category 2.2 calculated using Seedcalc8 and probpossample-V1.
k Rate of k positive out of n
0 0.25%
1 4.75%
2 30.35%
3 64.65%
4.3.1.2. Stability test
The aim of the stability test is to control the stability of the infection status of samples. The test was performed when all participating laboratories had started their tests. All healthy subsamples were negative (no false-positives) and all medium and high infection subsamples were positive (no false-negatives; Table 3 and Appendix 4). Therefore, it was concluded that the infection status of samples was stable.
4.3.2. Bio-PCR
4.3.2.1. Homogeneity test
The seed extracts of the subsamples that were prepared for dilution plating were also used for the homogeneity test of the bio-PCR. The homogeneity test revealed that all healthy subsamples were negative, 26 medium infection level subsamples were positive and all high infection level subsamples were positive (Table 4 and Appendix 3).
Based on these results the expected number of positive subsamples was calculated using Seedcalc8 and probpossample-V1 to be two to three positive subsamples for category 2.2 (Table 3). In the other infected categories (2.1, 2.3 and 3), all subsamples are expected to be positive, and in the healthy category (1), none of the subsamples are expected to be positive.
4.3.2.2. Stability test
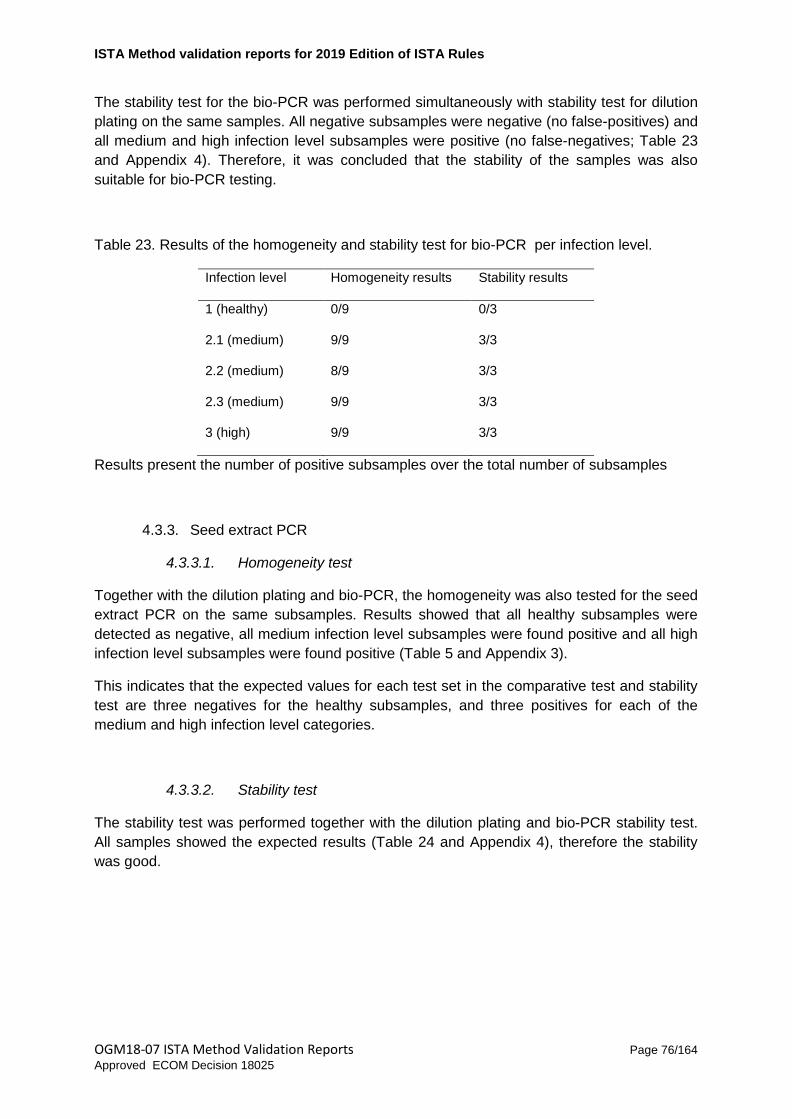
ISTA Method validation reports for 2019 Edition of ISTA Rules
OGM18-07 ISTA Method Validation Reports Page 76/164 Approved ECOM Decision 18025
The stability test for the bio-PCR was performed simultaneously with stability test for dilution plating on the same samples. All negative subsamples were negative (no false-positives) and all medium and high infection level subsamples were positive (no false-negatives; Table 23 and Appendix 4). Therefore, it was concluded that the stability of the samples was also suitable for bio-PCR testing.
Table 23. Results of the homogeneity and stability test for bio-PCR per infection level.
Infection level Homogeneity results Stability results
1 (healthy) 0/9 0/3
2.1 (medium) 9/9 3/3
2.2 (medium) 8/9 3/3
2.3 (medium) 9/9 3/3
3 (high) 9/9 3/3
Results present the number of positive subsamples over the total number of subsamples
4.3.3. Seed extract PCR
4.3.3.1. Homogeneity test
Together with the dilution plating and bio-PCR, the homogeneity was also tested for the seed extract PCR on the same subsamples. Results showed that all healthy subsamples were detected as negative, all medium infection level subsamples were found positive and all high infection level subsamples were found positive (Table 5 and Appendix 3).
This indicates that the expected values for each test set in the comparative test and stability test are three negatives for the healthy subsamples, and three positives for each of the medium and high infection level categories.
4.3.3.2. Stability test
The stability test was performed together with the dilution plating and bio-PCR stability test. All samples showed the expected results (Table 24 and Appendix 4), therefore the stability was good.

ISTA Method validation reports for 2019 Edition of ISTA Rules
OGM18-07 ISTA Method Validation Reports Page 77/164 Approved ECOM Decision 18025
Table 24. Results of the homogeneity and stability test for the seed extract PCR per contamination level.
Infection level Homogeneity results Stability results
1 (healthy) 0/9 0/3
2.1 (medium) 9/9 3/3
2.2 (medium) 9/9 3/3
2.3 (medium) 9/9 3/3
3 (high) 9/9 3/3
Results present the number of positive subsamples over the total number of subsamples
4.4. COMPARATIVE TEST RESULTS
The raw data generated by the ten laboratories is presented in Appendix 5A, 5B5B and 5C5C. Laboratory 9 retracted their results from this comparative test and are therefore not included in the analysis. Laboratory 3 obtained dilution plating results that were not in line with the expectations based on the homogeneity and stability test. Laboratory 3 detected one false-positive. This laboratory was experienced in dilution plating and their hypothesis is that cross-contamination or exchanges between samples occurred during the CT. Since the dilution plating method is validated and the results of bio-PCR and seed extract PCR were compared to this validated method, results of laboratories that did not correspond to expected values with dilution plating were excluded from the analysis. Thus, the results of laboratory 3 were excluded from both the bio-PCR and seed extract PCR analysis.
4.4.1. Dilution plating
Analysis of qualitative results for each laboratory for healthy and high infection level subsamples has been carried out according to the norm ISO 16140. Results are presented in Tables 25 and 26. All laboratories obtained 100% sensitivity indicating no false-negatives were detected. All laboratories also obtained 100% specificity and accuracy.
The sensitivity, specificity and accuracy for the dilution plating method for the healthy, medium 2.1 and medium 2.3 and high level lots were calculated according to the formulas described in ISO 16140 (Table 26). For category 2.2, some variation was expected based on the homogeneity test and therefore this category was analysed separately. The observed variation was within the allowed range (Table 27).

ISTA Method validation reports for 2019 Edition of ISTA Rules
OGM18-07 ISTA Method Validation Reports Page 78/164 Approved ECOM Decision 18025
Table 25. Results of dilution plating per laboratory. Number of positive subsamples in three subsamples per infection level category.
Lab code 1 (healthy) 2.1 (medium) 2.2 (medium) 2.3 (medium) 3 (high)
1 0 3 2 3 3
2 0 3 3 3 3
4 0 3 3 3 3
5 0 3 3 3 3
6 0 3 3 3 3
7 0 3 3 3 3
8 0 3 2 3 3
10 0 3 3 3 3
Table 26. Performance criteria dilution plating per category (N.A.: Not Applicable).
Infection level Sensitivity Specificity Accuracy Accordance Concordance
1 healthy N.A. 100% 100% 100% 100%
2.1 medium 100% N.A. 100% 100% 100%
2.2 medium As expected* N.A. As expected* N.A. N.A.
2.3 medium 100% N.A. 100% 100% 100%
3 high 100% N.A. 100% 100% 100%
Total 100% 100% 100%
* As expected: although not all subsamples were positive they all performed according to expectations based on the homogeneity test.

ISTA Method validation reports for 2019 Edition of ISTA Rules
OGM18-07 ISTA Method Validation Reports Page 79/164 Approved ECOM Decision 18025
Table 27. Expected and obtained results for the infection level category medium 2.2 subsamples with dilution plating.
Infection level 2.2 (medium)
Lab code Expected Obtained
1 2 - 3 2
2 2 - 3 3
4 2 - 3 3
5 2 - 3 3
6 2 - 3 3
7 2 - 3 3
8 2 - 3 2
10 2 - 3 3
Total 16 - 24 22
4.4.1.1. Conclusion
Eight laboratories obtained expected results for all healthy subsamples as well as for the three medium infection level categories and the high infection level subsamples. Therefore, it is concluded that the data from this sample set is suitable (homogenous and stable). All laboratories performed according to expectations.
4.4.2. Bio-PCR
After removal of laboratory 3 and 9, four laboratories remain for the analysis. Results are shown in Table 28. Sensitivity, specificity and accuracy for healthy, medium infection levels 2.1 and 2.3, and high infection level lots were calculated for bio-PCR according to ISO 16140 (Table 29). Results for medium 2.2 were expected to be variable based on the dilution plating homogeneity test and are therefore analysed separately (Table 30). All laboratories obtained expected results for medium 2.2 subsamples.
Table 28. Results for bio-PCR per laboratory.
Lab code 1 (healthy) 2.1 (medium) 2.2 (medium) 2.3 (medium) 3 (high)
4 0 3 3 3 3
6 0* 3 3 3 3
7 2 3 3 3 3
10 0 3 3 3 3

ISTA Method validation reports for 2019 Edition of ISTA Rules
OGM18-07 ISTA Method Validation Reports Page 80/164 Approved ECOM Decision 18025
Figures in each infection level categories represent the number of positive subsamples. The yellow highlightas results deviating from expected results based on dilution plating. The asterisk (*) shows inconclusive results that were reported for two samples and that were excluded from the analysis.
Table 29. Performance criteria bio-PCR per infection level category.
Infection level Sensitivity Specificity Accuracy Accordance Concordance
1 (healthy) N.A. 77.8% 77.8% 77.8% 55.6%
2.1 (medium) 100% N.A. 100% 100% 100%
2.2 (medium)* As expected N.A. As expected 100% 100%
2.3 (medium) 100% N.A. 100% 100% 100%
3 (high) 100% N.A. 100% 100% 100%
Total 100% 77.8% 94.5%
* As expected: although not all subsamples were positive they all performed according to expectations based on the homogeneity test.
Table 30. Expected and obtained bio-PCR results per laboratory for infection level category 2.2 medium samples. Number of positive subsamples per category.
Infection level 2.2 (medium)
Lab code Expected Obtained
4 2 - 3 3
6 2 - 3 3
7 2 - 3 3
10 2 - 3 3
Total 8 - 12 12
4.4.2.1. Conclusion
All performance criteria, namely sensitivity, specificity, accuracy, accordance and concordance, were acceptable for positive samples. For healthy samples, one laboratory obtained probable false-positives, although these results might also represent a low contamination level, which was not detected during pre-tests. It should however be noted that since the bio-PCR method is intented to be used as a pre-screening method only, false-positives are acceptable. The laboratory performances with bio-PCR was acceptable for its use as a pre-screening method.

ISTA Method validation reports for 2019 Edition of ISTA Rules
OGM18-07 ISTA Method Validation Reports Page 81/164 Approved ECOM Decision 18025
4.4.3. Seed extract PCR
Seven laboratories performed the seed extract PCR in this comparative test, and results are summarized in Table 31. Sensitivity, specificity and accuracy for the healthy, medium 2.1, medium 2.3 and high infection level lots were calculated for seed extract PCR according to ISO 16140 (Table 32). Results of infection level category medium 2.2 are expected to be variable based on the dilution plating homogeneity test and are therefore analysed separately (Table 33). All seven labs obtained expected results for positive subsamples. For healthy subsamples, three positive and three inconclusive results were obtained.
Table 31. Results for Seed extract PCR results per laboratory for healthy and high level samples.
Lab code 1 (healthy) 2.1 (medium) 2.2 (medium) 2.3 (medium) 3 (high)
1 0 3 3 3 3
2 inconclusive* 3 3 3 3
4 0 3 3 3 3
5 0 3 3 3 3
7 3 3 3 3 3
8 0 3 3 3 3
10 0 3 3 3 3
Total 3 24 24 24 24
Figures in each infection level categories represent the number of positive subsamples. The yellow highlight indicates results deviating from expected results based on dilution plating. The asterisk (*) shows inconclusive results that were reported for two samples and that were excluded from the analysis. In this case, the laboratory also analysed the subsamples in parallel with an in house method and found them to be negative.
Table 32. Performance criteria seed extract PCR per infection level category seed extract PCR.
Infection level Sensitivity Specificity Accuracy Accordance Concordance
1 (Healthy) N.A. 83.3% 83.3% 100% 66.7%
2.1 (Medium) 100% N.A. 100% 100% 100%
2.2 (Medium)* As expected N.A. As expected N.A. N.A.
2.3 (Medium) 100% N.A. 100% 100% 100%
3 (High) 100% N.A. 100% 100% 100%
Total 100% 83.3% 95.8%

ISTA Method validation reports for 2019 Edition of ISTA Rules
OGM18-07 ISTA Method Validation Reports Page 82/164 Approved ECOM Decision 18025
* As expected: although not all subsamples were positive they all performed according to expectations based on the homogeneity test.
Table 33. Expected and obtained results for each laboratory for the infection level category medium 2.2 samples with seed extract PCR.
Infection level 2.2 (medium)
Lab code Expected Obtained
1 2 - 3 3
2 2 - 3 3
4 2 - 3 3
5 2 - 3 3
7 2 - 3 3
8 2 - 3 3
10 2 - 3 3
Total 16 - 24 24
Figures depict the number of positive subsamples out of three subsamples.
4.4.3.1. Conclusion
Xcc was detected in all positive subsamples. Laboratory 2 obtained inconclusive results on negative subsamples due to inhibition of the internal control. The same extract was repeated with the in house method routinely used in this laboratory and these results, which were negative, were shared with the test organizer. Therefore, the seed extract PCR results for laboratory 2 were excluded from the analysis, since in practice these would be repeated or tested by dilution plating. Laboratory 7 obtained three false-positive results of which, two false-positive results obtained low Ct-values (24-27). These are likely false-positives, as they deviate from all other results in homogeneity, stability and CT results of other participants. However, since seed extract PCR is proposed as a pre-screening method, false-positives are deemed acceptable.
5. Discussion and general conclusions
As with dilution plating, bio-PCR and seed extract PCR showed a 100% sensitivity in the CT. Both bio-PCR and seed extract PCR show acceptable specificity and accuracy (Table 34). Both methods show some possibility of false-positives, which is acceptable since these methods are suggested as a pre-screening methods only. For positive samples both methods show high level accordance and concordance as shown in Table 34.

ISTA Method validation reports for 2019 Edition of ISTA Rules
OGM18-07 ISTA Method Validation Reports Page 83/164 Approved ECOM Decision 18025
Therefore, the results support the use of bio-PCR and seed extract PCR as pre-screening methods for ISTA 7-019a. It is therefore proposed to include both bio-PCR and seed extract PCR as pre-screening methods in ISTA 7-019a.
Table 34. Summary of performance criteria of three methods for Xcc detection, dilution plating, bio-PCR and seed extract PCR.
Method Sensitivity Specificity Accuracy Accordance Concordance
Dilution plating 100% 100% 100% 100% 100%
Bio-PCR 100% 77.8% 94.5% 100% 100%
Seed extract PCR 100% 83.3% 95.8% 100% 100%
Accordance and concordance are calculated for positive samples only.
6. Acknowledgements
The authors wish to thank all the colleagues in the laboratories of Naktuinbouw, Vilmorin and the other laboratories within the ISHI-Veg project involved in the developmental of the testing options.
7. References
AFNOR (2003) Standard NF EN ISO 16140 Microbiology of food and animal feeding stuffs - Protocol for the validation of alternative methods
Anonymous (2010) Dutch validation guideline for the validation of detection and identification methods for plant pathogens and pests. Dutch validation guidelines, Roelofarendsveen (NL).
Asma, M., Koenraadt, H.M.S. and Politikou, A. 2014. 017-019b: Detection of Xanthomonas campestris pv. campestris on Brassica spp. disinfested/disinfected seed with grinding. International Rules for Seed Testing Annexe to Chapter 7: Seed Health Testing Methods.
Berg, T., Tesoriero, L. and Hailstones, D.L. (2006). A multiplex real-time PCR assay for detection of Xanthomonas campestris from brassicas. Letters in Applied Microbiology 42: 624-630.
CABI, 2014. Xanthomonas campestris pv. campestris. In: Crop Protection Compendium. Wallingford, UK: CAB International. http://www.cabi.org/cpc.
Langton SD, Chevennement R, Nagelkerke N and Lombard B (2002) Analysing collaborative trials for qualitative microbiological methods: accordance and concordance. International Journal of Food Microbiology 79: 175-181.
ISTA (2013) ISTA TCOM-TG-02 Guidelines for organizing and analysing results of Proficiency tests (PT) and interlaboratory tests for validation of methods (CT). https://www.seedtest.org/en/documents-_content---1--1177.html [last accessed 15 July 2016]

ISTA Method validation reports for 2019 Edition of ISTA Rules
OGM18-07 ISTA Method Validation Reports Page 84/164 Approved ECOM Decision 18025
Köhl, J., Vlaswinkel, M., Groenenboom-de Haas, B.H., Kastelein, P., van Hoof, R.A., van der Wolf, J.M. and Krijger, M. (2011). Survival of pathogens of Brussels sprouts (Brassica oleracea Gemmifera Group) in crop residues. Plant Pathology 60: 661-670.
Qian, W., Jia, Y.-T., Ren, S.-X, He, Y.-Q., Feng, J.-X, Lu, L.-F., Sun, Q.-H., Ying, G., Tang, D.-J., Tang, H., Wu, W. et al. (2005). Comparative and functional genomic analyses of the pathogenicity of phytopathogen Xanthomonas campestris pv. campestris. Genome Research 15: 757–767.
Roberts, S. J. and Koenraadt, H. 2014. 7-019a: Detection of Xanthomonas campestris pv. campestris on Brassica spp. International Rules for Seed Testing Annexe to Chapter 7: Seed Health Testing Methods. http://archives.eppo.int/MEETINGS/2004_meetings/diag_posters/poster_deKoning2.pdf
Russel, H.L. 1898. A bacterial rot of cabbage and allied plants. Wisconsin Agricultural Station Bulletin, 65.
Sato M, Asma M, and Politikou L (2015) 7-019a: Detection of Xanthomonas campestris pv. campestris on Brassica spp. International rules for seed testing 2015. https://www.seedtest.org/upload/cms/user/2015-SH-7-019a.pdf [last accessed 18 August 2016]
Schaad, N.W. 1982. Detection of seedborne bacterial plant pathogens. Plant Disease, 66 (10):885-890.
Schaad, N.W. 1988. Inoculum thresholds of seedborne pathogens. Bacteria. Phytopathology, 78 (6):872-875.
Schaad, N.W. and Dianese, J.C. 1981. Cruciferous weeds as sources of inoculum of Xanthomonas campestris in black rot of crucifers. Phytopathology, 71 (11): 1215-1220.
Schaad, N.W. and White, W.C. 1974. Survival of Xanthomonas campestris in soil. Phytopathology, 64 (12): 1518-1520.
Schultz, T. and Gabrielson, R.L. 1986. Xanthomonas campestris pv. campestris in Western Washington crucifer seed fields: occurrence and survival. Phytopathology, 76 (12): 1306-1309
Da Silva, A.C.R., Ferro, J.A., Reinach, F.C., Farah, C.S., Furlan, L.R., Quaggio, R.B., Monteiro-Vitorello, C.B., Van Sluys, M.A., Almeida, N.F., Alves, L.M.C., et al. (2002). Comparison of the genomes of two Xanthomonas pathogens with differing host specificities. Nature 417: 459-463.
Staroscik (2015). Science primer. http://scienceprimer.com/copy-number-calculator-for-realtime-pcr last accessed 27 October 2015.
Walker, J.C. 1952. Diseases of Vegetable Crops. New York, USA: McGraw-Hill Book Company, Inc.
Williams, P.H. 1980. Black rot: a continuing threat to world crucifers. Plant Disease, 64 (8): 736-742

ISTA Method validation reports for 2019 Edition of ISTA Rules
OGM18-07 ISTA Method Validation Reports Page 85/164 Approved ECOM Decision 18025
8. Appendices
Appendix 1: Flow chart ISTA 7-019a: detection of Xanthomonas campestris pv. campestris on untreated Brassica spp. seeds.
*In case of inconclusive results for seed extract PCR or bio-PCR treat sample as suspect result.
Suspect result*

ISTA Method validation reports for 2019 Edition of ISTA Rules
OGM18-07 ISTA Method Validation Reports Page 86/164 Approved ECOM Decision 18025
Appendix 2: Composition of the samples
Infection level Category Sample number Composition
healthy 1 3 10 000 seeds ZZB-700
healthy 1 6
healthy 1 13
medium 2.1 4 3 000 seeds ZZB-695 + 7 000 seeds ZZB-694
medium 2.1 11
medium 2.1 14
medium 2.2 1 1 000 seeds ZZB-695 + 9 000 seeds ZZB-694
medium 2.2 8
medium 2.2 15
medium 2.3 5 3 000 seeds ZZB-695 + 7 000 seeds ZZB-549
medium 2.3 9
medium 2.3 12
high 3 2 10 000 seeds ZZB-689
high 3 7
high 3 10

ISTA Method validation reports for 2019 Edition of ISTA Rules
OGM18-07 ISTA Method Validation Reports Page 87/164 Approved ECOM Decision 18025
Appendix 3: Homogeneity test
Sample Set Infection level Seed wash PCR Bio-PCR Dilution plating
Xcc (Fam) Xc (Vic) IAC (TR) Zup DLH CS20ABN FS
3 A healthy neg neg OK neg neg neg neg
6 A healthy neg neg OK neg neg neg neg
13 A healthy neg neg OK neg neg neg neg
3 B healthy neg neg OK neg neg neg neg
6 B healthy neg neg OK neg neg neg neg
13 B healthy neg neg OK neg neg neg neg
3 C healthy neg neg OK neg neg neg neg
6 C healthy neg neg OK neg neg neg neg
13 C healthy neg neg OK neg neg neg neg
4 A medium 2.1 pos pos OK pos pos pos pos
11 A medium 2.1 pos pos OK pos pos pos pos
14 A medium 2.1 pos pos OK pos pos pos neg
4 B medium 2.1 pos pos OK pos pos pos pos
11 B medium 2.1 pos pos OK pos pos pos pos
14 B medium 2.1 pos pos OK pos pos pos pos
4 C medium 2.1 pos pos OK pos pos pos pos
11 C medium 2.1 pos pos OK pos pos pos pos
14 C medium 2.1 pos pos OK pos pos pos pos
1 A medium 2.2 pos pos OK pos pos pos pos
8 A medium 2.2 pos pos OK pos pos pos neg
15 A medium 2.2 pos pos OK pos pos pos pos
1 B medium 2.2 pos pos OK pos pos pos pos
8 B medium 2.2 pos pos OK pos pos pos pos
15 B medium 2.2 pos pos OK pos pos pos pos
1 C medium 2.2 pos pos OK pos pos pos pos
8 C medium 2.2 pos pos OK pos pos pos pos
15 C medium 2.2 pos pos OK neg neg neg neg
5 A medium 2.3 pos pos OK pos pos pos pos

ISTA Method validation reports for 2019 Edition of ISTA Rules
OGM18-07 ISTA Method Validation Reports Page 88/164 Approved ECOM Decision 18025
9 A medium 2.3 pos pos OK pos pos pos pos
12 A medium 2.3 pos pos OK pos pos pos pos
5 B medium 2.3 pos pos OK pos pos pos pos
9 B medium 2.3 pos pos OK pos pos pos pos
12 B medium 2.3 pos pos OK pos pos pos pos
5 C medium 2.3 pos pos OK pos pos pos pos
9 C medium 2.3 pos pos OK pos pos pos pos
12 C medium 2.3 pos pos OK pos pos pos pos
2 A high pos pos OK pos pos pos neg
7 A high pos pos OK pos pos pos pos
10 A high pos pos OK pos pos pos pos
2 B high pos pos OK pos pos pos pos
7 B high pos pos OK pos pos pos pos
10 B high pos pos OK pos pos pos pos
2 C high pos pos OK pos pos pos pos
7 C high pos pos OK pos pos pos pos
10 C high pos pos OK pos pos pos pos
NC Lysis
neg neg N/A neg neg
PC Xcc
pos pos 36,72
IAC
neg neg OK

ISTA Method validation reports for 2019 Edition of ISTA Rules
OGM18-07 ISTA Method Validation Reports Page 89/164 Approved ECOM Decision 18025
Appendix 4: Stability test
Sample Infection level Seed wash PCR Bio-PCR Dilution plating
Xcc (Fam) Xc (Vic) IAC (TR) Zup DLH CS20ABN FS
3 healthy neg neg OK neg neg neg neg
6 healthy neg neg OK neg neg neg neg
13 healthy neg neg OK neg neg neg neg
4 medium 2.1 pos pos OK pos pos pos pos
11 medium 2.1 pos pos OK pos pos pos pos
14 medium 2.1 pos pos OK pos pos pos pos
1 medium 2.2 pos pos OK neg pos neg pos
8 medium 2.2 pos pos OK pos pos pos pos
15 medium 2.2 pos pos OK pos pos pos pos
5 medium 2.3 pos pos OK pos pos pos pos
9 medium 2.3 pos pos OK pos pos pos pos
12 medium 2.3 pos pos OK pos pos pos pos
2 high pos pos OK pos pos pos pos
7 high pos pos OK pos pos pos pos
10 high pos pos OK pos pos pos pos

ISTA Method validation reports for 2019 Edition of ISTA Rules
OGM18-07 ISTA Method Validation Reports Page 90/164 Approved ECOM Decision 18025
Appendix 5A: CT results: Dilution plating
Sample Infection level Laboratory
1 2 3* 4 5 6 7 8 9* 10
3 healthy neg neg neg neg neg neg neg neg neg neg
6 healthy neg neg pos neg neg neg neg neg neg neg
13 healthy neg neg neg neg neg neg neg neg pos neg
4 medium 2.1 pos pos pos pos pos pos pos pos pos pos
11 medium 2.1 pos pos pos pos pos pos pos pos neg pos
14 medium 2.1 pos pos pos pos pos pos pos pos pos pos
1 medium 2.2 pos pos pos pos pos pos pos pos neg pos
8 medium 2.2 neg pos pos pos pos pos pos pos neg pos
15 medium 2.2 pos pos neg pos pos pos pos neg neg pos
5 medium 2.3 pos pos pos pos pos pos pos pos pos pos
9 medium 2.3 pos pos pos pos pos pos pos pos pos pos
12 medium 2.3 pos pos pos pos pos pos pos pos pos pos
2 high pos pos pos pos pos pos pos pos pos pos
7 high pos pos pos pos pos pos pos pos pos pos
10 high pos pos pos pos pos pos pos pos pos pos
* Laboratory 3 and 9 were excluded from the analysis

ISTA Method validation reports for 2019 Edition of ISTA Rules
OGM18-07 ISTA Method Validation Reports Page 91/164 Approved ECOM Decision 18025
Appendix 5B: CT results: Bio-PCR
Sample Infection level Replicate Laboratory
3* 4 6 7 9* 10
3 healthy A pos neg neg pos pos neg
B pos neg neg neg pos neg
spike
ok pos pos pos pos pos
6 healthy A neg neg inc neg pos neg
B neg neg inc neg pos neg
spike
ok pos
pos pos pos
13 healthy A neg neg inc pos pos neg
B neg neg inc neg pos neg
spike
not ok (1/10 ok) pos
pos pos pos
4 medium 2.1 A pos pos pos pos pos pos
B pos pos pos pos pos pos
spike
ok pos pos pos pos pos
11 medium 2.1 A pos pos pos pos pos pos
B pos pos pos pos pos pos
spike
not ok (1/10 ok) pos pos pos pos pos
14 medium 2.1 A neg pos pos pos pos pos
B neg pos pos pos pos pos
spike
ok pos pos pos pos pos
1 medium 2.2 A pos pos pos pos pos neg
B pos pos pos pos pos pos
spike
ok pos pos pos pos pos
8 medium 2.2 A pos pos pos pos pos pos
B pos pos pos pos pos pos
spike
ok pos pos pos pos pos
15 medium 2.2 A neg pos pos pos pos pos
B neg pos pos pos pos pos
spike
not ok (1/10 ok) pos pos pos pos pos
5 medium 2.3 A pos pos pos pos pos pos

ISTA Method validation reports for 2019 Edition of ISTA Rules
OGM18-07 ISTA Method Validation Reports Page 92/164 Approved ECOM Decision 18025
B pos pos pos pos pos pos
spike
ok pos pos pos pos pos
9 medium 2.3 A pos pos pos pos pos pos
B pos pos pos pos pos pos
spike
ok pos pos pos pos pos
12 medium 2.3 A pos pos pos pos pos pos
B pos pos pos pos pos pos
spike
ok pos pos pos pos pos
2 high A pos pos pos pos pos pos
B pos pos pos pos pos pos
spike
not ok (1/10 ok) pos pos pos pos pos
7 high A pos pos pos pos pos pos
B pos pos pos pos pos pos
spike
ok pos pos pos pos pos
10 high A pos pos pos pos pos pos
B pos pos pos pos pos pos
spike
not ok (1/10 ok) pos pos pos pos pos
PC
ok pos
pos
NC
ok neg
neg
NTC
ok neg
neg
* Laboratory 3 and 9 were excluded from the analysis

ISTA Method validation reports for 2019 Edition of ISTA Rules
OGM18-07 ISTA Method Validation Reports Page 93/164 Approved ECOM Decision 18025
5
Sample Category ReplicateConclusion
targetConclusion
spikeConclusion
targetConclusion
spikeConclusion
targetConclusion
spikeConclusion
targetConclusion
spikeConclusion
targetConclusion
targetConclusion
spikeConclusion
targetConclusion
spikeConclusion
targetConclusion
spike3 healthy A neg good inc inhibition neg good neg good neg pos good Neg good Neg good
B neg good inc inhibition neg good neg good neg pos good6 healthy A neg good inc inhibition neg good neg good neg pos good Neg good Neg good
B neg good inc inhibition neg good neg good neg pos good13 healthy A neg good inc inhibition neg good neg good neg pos good Neg good neg good
B neg good inc inhibition neg good neg good neg pos good4 medium 2.1 A pos good pos competition pos good pos good pos pos good Pos good Pos good
B pos good pos competition pos good pos good pos pos good11 medium 2.1 A pos good pos competition pos good pos good pos pos good Pos good Pos good
B pos good pos competition pos good pos good pos pos good14 medium 2.1 A pos good pos competition pos good pos good pos pos good Pos good Pos good
B pos good pos competition pos good pos good pos pos good1 medium 2.2 A pos good pos competition pos good pos good pos pos good Pos good Pos good
B pos good pos competition pos good pos good pos pos good8 medium 2.2 A pos good inc inhibition pos good pos good pos pos good Pos good Pos good
B pos good pos competition pos good pos good pos pos good15 medium 2.2 A pos good pos competition pos good pos good pos pos good Pos good Pos good
B pos good pos competition pos good pos good pos pos good5 medium 2.3 A pos good pos competition pos good pos good pos pos good Pos good Pos good
B pos good pos competition pos good pos good pos pos good9 medium 2.3 A pos good pos competition pos good pos good pos pos good Pos good Pos good
B pos good pos competition pos good pos good pos pos good12 medium 2.3 A pos good pos competition pos good pos good pos pos good Pos good Pos good
B pos good pos competition pos good pos good pos pos good2 high A pos good pos competition pos good pos good pos pos good Pos good Pos good
B pos good pos competition pos good pos good pos pos good7 high A pos good pos competition pos good pos good pos pos good Pos good Pos good
B pos good pos competition pos good pos good pos pos good10 high A pos good pos competition pos good pos good pos pos good Pos good Pos good
B pos good pos competition pos good pos good pos pos goodPC pos good pos competition pos pos NA pos pos good pos goodNC neg good neg inhibition neg neg NA pos neg good
NTC neg no target no spike neg neg NA neg neg
101 2* 3** 4 7 8
Appendix 5C: CT results: Seed extract PCR * inc: inconclusive ** Laboratory 3 was excluded from the analysis

ISTA Method validation reports for 2019 Edition of ISTA Rules
OGM18-07 ISTA Method Validation Reports Page 94/164 Approved ECOM Decision 18025
Appendix 6: Published data on analytical specificity of Köhl and Berg Taqmans.
Table I. Analytical specificity of Berg Taqman from literature
Species/strain Strain designation PCR Referencea
X. axonopodis pv. phaseoli X18–DAR 58726 - 1
X. campestris pv. aberrans X59–DAR 75944, ICMP 4805, LMG 9037, NCPPB 2986; race 5
+
1
X. campestris pv. armoraciae X60–DAR 75942, ICMP 7, LMG 535, NCPPB 347 + 1
X. campestris pv. barbarae X61–DAR 75945, ICMP 438, LMG 547, NCPPB 983 + 1
X. campestris pv. campestris X50–DAR 75950, ATCC 33913, NCPPB 528, LMG568, ICMP 13; race 3 + 1
X. campestris pv. campestris X110 PHDS 03/417 + 1
X. campestris pv. campestris X219 PHDS 04/107 + 1
X. campestris pv. campestris X227 3316-A + 1
X. campestris pv. incanae X62–DAR 75959, ICMP 574, LMG 7490, ATCC13462, NCPPB 937 + 1
X. campestris pv. raphani X63–DAR 75960, ICMP 1404, LMG 860, NCPPB 1946; race 5 + 1
X. campestris from noncrucifers X20 PHDS 02/564 - 1
Pseudomonas sp. DAR 26838 - 1
X. sesame pv. sesame X66 DAR 75547 - 1
X. c. pv. campestris CFBP 6865pt NCPPB 2986 + 2
X. c. pv. campestris CFBP 6863, NCPPB 875 + 2
X. campestris CFBP 5824, LMG 7383, NCPPB 1930 – 2
X. c. pv. campestris CFBP 3838pt , LMG 535, NCPPB 347 + 2
X. c. pv. raphani 756Cb – 2,3
X. campestris CFBP 5825pt , LMG 547, NCPPB 983 – 2
X. campestris CFBP 5826, LMG 7385 – 2
X. c. pv. campestris CFBP 1119 + 2
X. c. pv. campestris CFBP 1121 + 2
X. c. pv. campestris CFBP 1869 + 2
X. c. pv. campestris CFBP 4952 + 2
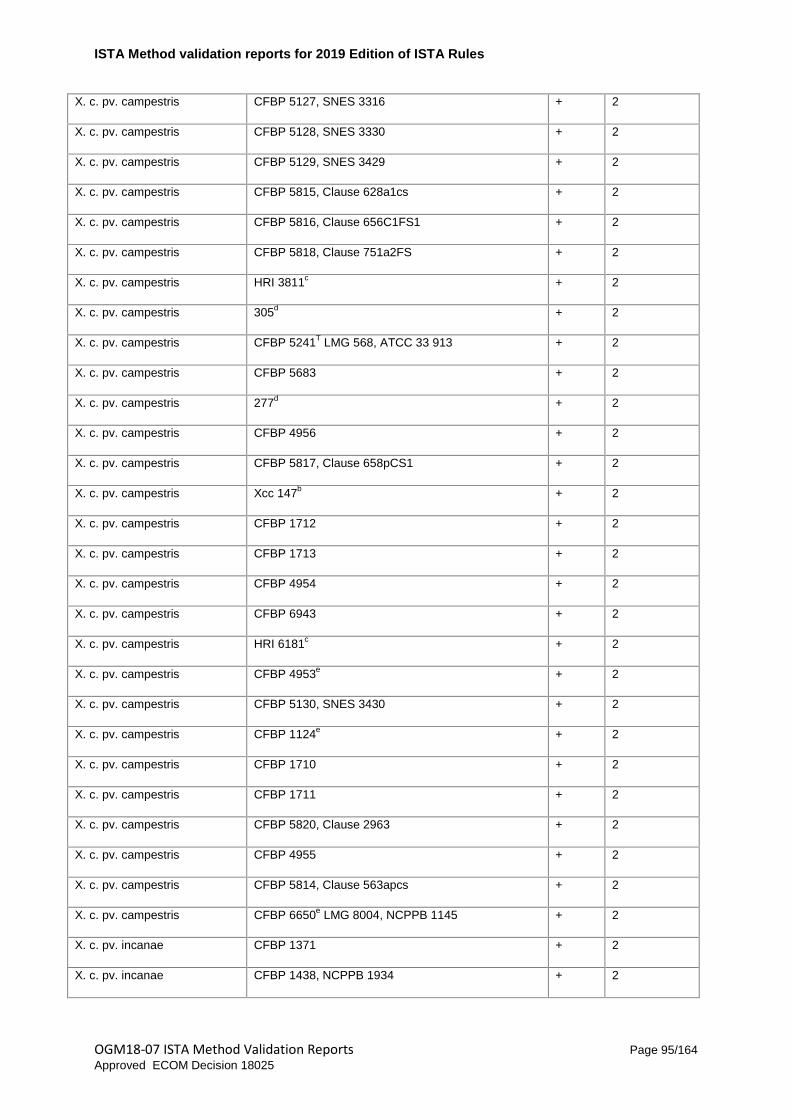
ISTA Method validation reports for 2019 Edition of ISTA Rules
OGM18-07 ISTA Method Validation Reports Page 95/164 Approved ECOM Decision 18025
X. c. pv. campestris CFBP 5127, SNES 3316 + 2
X. c. pv. campestris CFBP 5128, SNES 3330 + 2
X. c. pv. campestris CFBP 5129, SNES 3429 + 2
X. c. pv. campestris CFBP 5815, Clause 628a1cs + 2
X. c. pv. campestris CFBP 5816, Clause 656C1FS1 + 2
X. c. pv. campestris CFBP 5818, Clause 751a2FS + 2
X. c. pv. campestris HRI 3811c + 2
X. c. pv. campestris 305d + 2
X. c. pv. campestris CFBP 5241T LMG 568, ATCC 33 913 + 2
X. c. pv. campestris CFBP 5683 + 2
X. c. pv. campestris 277d + 2
X. c. pv. campestris CFBP 4956 + 2
X. c. pv. campestris CFBP 5817, Clause 658pCS1 + 2
X. c. pv. campestris Xcc 147b + 2
X. c. pv. campestris CFBP 1712 + 2
X. c. pv. campestris CFBP 1713 + 2
X. c. pv. campestris CFBP 4954 + 2
X. c. pv. campestris CFBP 6943 + 2
X. c. pv. campestris HRI 6181c + 2
X. c. pv. campestris CFBP 4953e + 2
X. c. pv. campestris CFBP 5130, SNES 3430 + 2
X. c. pv. campestris CFBP 1124e + 2
X. c. pv. campestris CFBP 1710 + 2
X. c. pv. campestris CFBP 1711 + 2
X. c. pv. campestris CFBP 5820, Clause 2963 + 2
X. c. pv. campestris CFBP 4955 + 2
X. c. pv. campestris CFBP 5814, Clause 563apcs + 2
X. c. pv. campestris CFBP 6650e LMG 8004, NCPPB 1145 + 2
X. c. pv. incanae CFBP 1371 + 2
X. c. pv. incanae CFBP 1438, NCPPB 1934 + 2

ISTA Method validation reports for 2019 Edition of ISTA Rules
OGM18-07 ISTA Method Validation Reports Page 96/164 Approved ECOM Decision 18025
X. c. pv. incanae CFBP 1606 – 2
X. c. pv. incanae LMG 7490, NCPPB 937 + 2
X. c. pv. incanae CFBP 5686, Shmit J. 10 903 + 2
X. c. pv. raphani CFBP 5827pt LMG 860, NCPPB 1946 – 2
X. c. pv. raphani CFBP 5828, LMG 7505 – 2
X. c. pv. raphani CFBP 5829, LMG 8134 – 2
a Reference 1: Berg et al. (2006), reference 2: Rijlaarsdam et al. (2004), reference 3: Kamdar et al. (1993)
b LIMP, Toulouse, France
c Vincente et al., (2001)
d Clause-Tezier Laboratory, Angers, France
e Additonal race type strains proposed for Xcc
Table II. Analytical specificity of the Taqman developed by Köhl et al (2011) from literature.
No. Type of strains PCR result
20 X. c. pv. campestris strains Positive
1 X. c. pv. armoraciae strain IPO373 Positive
18 Related, plant pathogenic Xanthomonas species Negative
19 Strains of plant pathogenic bacteria distantly related Negative
7 Unidentified saprophytic bacteria from cabbage Negative
References:
Berg, T., Tesoriero, L. and Hailstones, D.L. (2006). A multiplex real-time PCR assay for detection of Xanthomonas campestris from brassicas. Letters in Applied Microbiology 42: 624-630.
Kamdar, H.V., Kamoun, S., Kado, C.I. (1993) Restoration of pathogenicity of avirulent Xanthomonas oryzae pv. oryzae and X. campestris pathovars by reciprocal complementation with the hrpXo and hrpXc genes and identification of HrpX function by sequence analyses. Journal of Bacteriology 175: 2017-2025

ISTA Method validation reports for 2019 Edition of ISTA Rules
OGM18-07 ISTA Method Validation Reports Page 97/164 Approved ECOM Decision 18025
Rijlaarsdam, A., Woudt, B., Simons, G., Koenraadt, H.M.S., Oosterhof, J., Asma, M. Buddiger, P., Roorda, P. Grimault, V., De Koning, J. 2004. Development of specific primers for the molecular detection of Xanthomonas campestris pv. campestris.
Vicente JJG, Conway J, Roberts SJ, Taylor JD, 2001. Identification and origin of Xanthomonas campestris pv. campestris race and related pathovars. Phytopathology 91, 492–9.

ISTA Method validation reports for 2019 Edition of ISTA Rules
OGM18-07 ISTA Method Validation Reports Page 98/164 Approved ECOM Decision 18025
Appendix 7: Analytical specificity
Table III. Analytical specificity of Köhl and Berg Taqmans on Isolates from the Naktuinbouw collection.
Isolate no. Year Origin UPBac Kohl Berg Acat
AFLP tree
Pathogenicity assay
1 1987 Arizona 11.58 >40 >40 >40 Out
2 2010 Unknown 13.32 >40 >40 >40 Out
3 2006 Netherlands 12.04 35.27 34.63 >40 Out Negative
4 1987 Arizona 10.67 >40 >40 >40 Out
5 2006 Netherlands 10.23 44.1 >40 >40 Out
6 2006 Netherlands 13.00 >40 >40 >40 Out
7 2008 Unknown 10.80 24.32 >40 >40 Out Negative
8 2006 Netherlands 11.11 35.12 >40 >40 Out
9 2006 Netherlands 11.19 34.74 >40 >40 Out Negative
10 2006 Netherlands 10.14 36.74 >40 >40 Out
11 2010 France 13.18 >40 24.6 >40 In Xca
12 2010 Unknown 11.67 >40 23.5 >40 In
13 2010 France 12.23 >40 23.07 >40 In Xca
14 2006 Netherlands 10.70 >40 21.83 >40 In
15 2003 Unknown 11.73 >40 22.75 >40 In
16 2003 Unknown 12.81 35.56 24.66 >40 In
17 2010 Unknown 14.04 >40 26.12 >40 In
18 2003 Unknown 11.97 36.25 23.95 >40 In
19 2003 Unknown 12.02 >40 22.62 >40 In
20 2010 Portugal 12.04 24.03 23.8 >40 In
21 2003 Unknown 11.78 >40 23.82 >40 In
22 2008 Unknown 10.09 36.43 >40 >40 In Negative
23 2005 Unknown 11.01 23.08 >40 >40 In Negative
24 2008 Unknown 10.66 21.09 >40 >40 In Negative
25 2006 Unknown 11.93 >40 >40 >40 In Negative
26 2010 Germany 12.20 23.9 23.64 >40 In
27 1993 Unknown 10.11 22.31 22.04 >40 In

ISTA Method validation reports for 2019 Edition of ISTA Rules
OGM18-07 ISTA Method Validation Reports Page 99/164 Approved ECOM Decision 18025
28 2010 USA 13.13 >40 22.92 >40 In Xca
29 2003 Unknown 11.01 22.31 22.12 >40 In
30 2005 Unknown 11.88 23.92 23.61 >40 In
31 1987 Arizona 12.74 23.35 23.3 >40 In
32 2005 Netherlands 12.55 35.2 22.42 >40 In
33 2010 Unknown 13.24 >40 >40 >40 In Negative
34 2010 Russia 12.59 26.05 25.79 >40 In
35 2005 Netherlands 10.34 23.21 22.98 >40 In
36 2010 Netherlands 11.74 22 21.66 >40 In
37 2010 Spain 13.15 25.03 24.9 >40 In
38 2010 Italy 12.90 24.06 23.62 >40 In
39 2010 Unknown 12.15 24.82 24.57 >40 In
40 2010 Unknown 12.62 24.64 24.49 >40 In
41 2010 Unknown 13.13 24.46 24.47 >40 In
42 2004 Unknown 12.78 24.2 23.86 >40 In
43 2006 Unknown 13.71 23.4 23.13 >40 In
44 1992 California 11.69 22.89 22.59 >40 In
45 2010 New Zealand 11.99 27.28 27.16 >40 In
46 2011 Germany 11.14 21.56 21.59 >40 In
47 2010 France 13.70 25.65 25.56 >40 In
48 2009 Netherlands 9.86 23.83 23.64 >40 In
49 2010 Netherlands 11.55 23.38 23.43 >40 In
50 2010 Unknown 12.20 23.41 23.63 >40 In
51 2010 Netherlands 13.93 24.82 24.54 >40 In
52 2010 Netherlands 12.96 26.12 26.1 >40 In
53 2010 Netherlands 11.96 22.03 21.58 >40 In
54 2010 France 12.32 22.15 22.02 >40 In
55 2010 Netherlands 12.00 22.85 22.65 >40 In
56 2010 Germany 12.69 25.51 25.54 >40 In
57 2010 Indonesia 12.08 24.09 23.69 >40 In
58 2010 USA Florida 13.16 24.27 24.08 >40 In

ISTA Method validation reports for 2019 Edition of ISTA Rules
OGM18-07 ISTA Method Validation Reports Page 100/164 Approved ECOM Decision 18025
59 2010
13.04 23.04 22.89 >40 In
60 2006 Unknown 10.08 21.09 20.53 >40 In
61 2010 Australia 12.19 21.43 21.35 >40 In
62 2011 Germany 12.02 23.24 23.07 >40 In
63 2011 Germany 11.76 22.32 22.11 >40 In
64 2005 Unknown 10.57 21.2 20.88 >40 In
65 2007 Unknown 10.32 21.36 21.35 >40 In
66 2004 Unknown 9.85 >40 35.57 >40 Out Negative
67 2006 China 10.96 22.22 22.21 >40 Out Xcc
68 2010 Netherlands 13.90 >40 >40 >40 Out
69
12.56 35.63 36.41 >40 Out
70 11.53 >40 >40 >40 Out

ISTA Method validation reports for 2019 Edition of ISTA Rules
OGM18-07 ISTA Method Validation Reports Page 101/164 Approved ECOM Decision 18025
Appendix 8: Repeatability
Table IV. Repeatability of three seed lots for the detection of Xanthomonas campestris pv. campestris (Xcc) on Brassica seeds (n = 8).
Fam Xcc Vic Xc Texas red Acat
Seed lot Replicate A B A B A B
1 1 30.52 30.46 31.24 30.99 29.22 29.00
1 2 30.80 30.72 31.00 30.65 29.10 28.81
1 3 30.24 30.26 30.78 30.74 29.06 28.92
1 4 30.18 30.57 30.59 30.68 28.80 28.62
1 5 30.12 30.25 30.79 30.79 29.09 29.10
1 6 30.45 30.78 31.15 31.46 28.90 28.93
1 7 29.80 30.26 30.41 31.23 28.78 29.01
1 8 30.86 31.35 31.33 31.82 29.94 29.67
2 1 20.88 21.00 21.42 21.15 26.51 26.64
2 2 20.29 20.89 21.02 21.36 26.08 26.51
2 3 20.37 20.44 20.94 20.90 26.31 26.23
2 4 20.09 20.56 20.85 20.99 26.05 26.09
2 5 20.97 20.82 21.39 21.21 26.46 26.45
2 6 20.65 20.54 21.06 21.02 26.38 26.03
2 7 21.05 20.82 21.52 21.22 27.04 26.61
2 8 20.97 21.09 21.47 21.54 26.96 26.85
3 1 22.56 22.54 23.06 22.95 27.97 28.20
3 2 22.62 22.35 23.15 22.96 28.52 28.51
3 3 22.09 22.20 22.64 22.61 27.10 27.52
3 4 21.97 22.22 22.63 22.67 27.69 27.76
3 5 22.94 23.01 23.48 23.30 28.47 28.22
3 6 21.76 22.14 22.42 22.66 27.62 27.70
3 7 22.73 22.81 23.11 23.25 28.28 28.26
3 8 23.02 22.70 23.51 23.13 28.34 28.14
Controls Spike >45 >45 >45 >45 29.10 29.59
PC DNA 18.06 18.01 18.37 18.40 >45 >45

ISTA Method validation reports for 2019 Edition of ISTA Rules
OGM18-07 ISTA Method Validation Reports Page 102/164 Approved ECOM Decision 18025
NTC >45 36.56 >45 >45 >45 >45
Table IV. Reproducibility of three seed lots for the detection of Xanthomonas campestris pv. campestris (Xcc) on Brassica seeds (n = 8).
FAM Xcc VIC Xc Texas Red Acat
Seed lot Replicate A B A B A B
A 1 31.26 31.21 30.97 31.30 29.51 29.36
A 2 30.80 31.03 30.77 31.35 29.25 29.46
A 3 31.31 31.15 31.27 31.40 29.10 28.74
A 4 31.40 31.37 32.09 31.52 29.95 30.00
A 5 31.01 30.86 31.22 31.29 29.29 29.16
A 6 31.47 32.40 31.57 31.62 29.97 29.94
A 7 30.84 31.48 31.49 31.58 29.01 28.93
A 8 31.26 31.09 32.57 31.28 29.34 28.73
B 1 21.40 21.42 22.02 22.00 26.67 26.61
B 2 21.87 21.62 22.13 22.14 27.07 26.99
B 3 21.80 21.90 22.04 22.17 27.17 27.11
B 4 21.90 21.81 22.15 22.19 27.05 27.02
B 5 21.22 21.60 21.76 22.10 26.53 27.05
B 6 21.23 21.16 21.38 21.76 26.39 26.24
B 7 21.14 21.41 21.68 22.00 26.02 26.30
B 8 21.37 21.34 21.97 21.94 26.55 26.46
C 1 23.37 23.94 24.04 24.05 28.32 28.46
C 2 23.28 23.76 23.89 24.01 28.67 28.56
C 3 23.23 23.33 23.75 23.74 27.38 27.38
C 4 23.05 23.08 23.22 23.22 28.49 28.56
C 5 22.98 23.01 23.21 23.18 27.23 27.32
C 6 23.07 23.06 23.69 23.58 29.20 28.71
C 7 23.24 23.16 23.74 23.75 28.97 28.55
C 8 22.91 22.90 23.11 23.12 27.91 28.07
Controls NTC >45
>45
>45

ISTA Method validation reports for 2019 Edition of ISTA Rules
OGM18-07 ISTA Method Validation Reports Page 103/164 Approved ECOM Decision 18025
NTC >45
>45
>45
PC DNA 15.94
16.39
>45
PC DNA 16.01
16.46
>45

ISTA Method validation reports for 2019 Edition of ISTA Rules
OGM18-07 ISTA Method Validation Reports Page 104/164 Approved ECOM Decision 18025
Appendix 9: Robustness
Table VI. Ct-values for three samples (n=8) for six treatments. A) freeze after soaking B) cool after soaking, C) freeze pellet, D) freeze after lysis, E) freeze DNA, F) no freezing or cooling.
Monster Herhaling Fam Xcc Vic Xc TR Acat Fam Xcc Vic Xc TR Acat Fam Xcc Vic Xc TR Acat Fam Xcc Vic Xc TR Acat Fam Xcc Vic Xc TR Acat Fam Xcc Vic Xc TR Acat1 22.07 22.48 29.65 21.36 21.86 27.45 21.19 21.73 27.27 21.09 21.47 29.89 20.88 21.37 28.86 21.27 21.73 28.232 19.23 19.86 28.21 19.03 19.65 27.45 18.96 19.5 27.06 19.52 19.93 29.7 18.78 19.23 27.46 19.22 19.73 27.183 17.34 18.09 28.96 17.23 17.52 27.24 17.13 17.62 26.97 17.45 17.83 30.2 16.67 17.03 26.65 16.75 17.39 27.024 17.96 18.25 29.36 17.71 18.11 27.52 18.16 18.45 26.72 17.66 18.11 29.51 19.15 19.86 29.17 19.45 19.96 28.65 19.16 19.94 28.29 19.35 19.81 27.59 19.32 19.9 27.08 19.43 20.05 29.68 17.78 18.14 28.66 17.64 18.36 28.56 18.73 19.16 29.05 18.48 18.91 28.13 18.69 19.08 26.37 18.84 19.18 29.03 18.22 18.97 28.89 18.5 18.88 28.367 19.05 19.4 29.04 18.58 19.02 27.21 18.72 19.13 27.19 18.62 19.08 28.66 18.69 19.1 28.75 18.51 19.18 28.158 22.7 23.08 29.31 21.94 22.39 27.44 21.83 22.1 27.06 22.28 22.73 29.29 22.46 23.18 29.94 22.12 22.66 28.721 18.34 19.07 28.79 18.1 18.53 28.21 17.9 18.35 27.44 17.81 18.38 29.19 17.46 18.2 27.36 18.45 19.17 27.32 21.08 21.44 29.15 20.63 21.04 28.38 20.43 21.05 28.1 21.04 21.32 29.94 20.95 21.35 29 21.37 21.92 28.913 23.02 23.35 29.48 22.54 23.12 29 23.01 23.63 28.44 22.56 23.18 29.41 21.82 22.28 28.5 22.69 23.25 29.074 28.85 29.41 30.76 28.18 28.97 27.01 28.5 28.96 28.76 28.43 28.86 30.59 27.72 28.2 29.36 28.4 29.18 29.45 24.12 24.85 30.02 24.12 24.46 29.6 23.81 24.26 29.13 24.02 24.36 30.16 24.06 24.88 29.58 24.4 24.87 29.236 22.6 22.93 29.21 21.83 22.22 28.34 21.91 22.35 27.83 22.02 22.27 29.3 22.65 23.1 29.36 22.26 22.64 28.647 22.75 23.16 30.05 22.43 22.82 29.11 22.42 22.88 28.2 22.07 22.64 29.86 22.93 23.35 29.83 22.46 23.02 28.588 20.13 20.82 29.73 19.49 20.01 28.23 19.06 19.81 27.4 19.4 19.75 29.76 20.22 21 29.51 20.11 20.45 28.131 45 45 30.39 41.05 35.5 28.58 35.2 45 29.27 34.12 36.7 29.79 45 45 29.86 41.45 36.89 29.522 45 45 30.63 45 45 28.14 45 45 29.18 45 45 30.15 45 45 30.19 42.85 35.36 30.133 45 45 30.79 35.45 36.84 28.89 45 45 29.03 35.28 45 29.68 35.78 45 30.27 36.29 45 30.534 45 45 30.52 45 45 28.78 45 45 28.87 45 45 30.7 42.8 37.84 29.72 42.57 37.8 29.555 45 45 30.3 34.78 45 29.67 45 45 29.19 35.37 45 30.85 33.86 34.34 28.56 41.56 37.06 29.046 45 45 31.43 42.81 35.43 29.26 45 45 28.76 45 45 30.11 36.02 45 30.53 36.39 45 30.357 45 45 30.46 36.17 45 30.02 45 45 29.2 34.92 45 29.25 35.13 45 29.6 34.84 45 29.388 45 45 31.09 45 45 29.55 45 45 29.11 35.04 45 29.5 35.91 45 29.9 35.11 45 29.17
Acat spike 45 45 29.88 45 45 29.73 45 45 28.03 45 45 29.1 45 45 30.14 45 45 29.02PC Xcc 16.44 17.24 45 16.59 17.1 45 16.08 16.49 45 16.51 16.87 45 15.09 15.47 45 16.59 17.34 45
E F
1
2
3
A B C D

ISTA Method validation reports for 2019 Edition of ISTA Rules
OGM18-07 ISTA Method Validation Reports Page 105/164 Approved ECOM Decision 18025
Appendix 10: Raw data results from the repeatability/reproducibility tests
User 1 (Repeatability tests 1A and 1B)
Real-time PCR Melt Report
Temp. Threshold 79°c
Threshold dF/dT 0.1
Melt data for Melt A.Green
No Sample Genotype Peak 1 Peak 2
1 J65365-2 Xcc 89.0 (ZUP)
2 J65365-2 Xcc 89.0 (ZUP)
3 J65365-2-xcc Xcc 82.2 (DLH) 89.0 (ZUP)
4 J65365-2-xcr Xcr 82.5 (DLH)
5 J65367-2 Xcc 81.8 (DLH) 88.7 (ZUP)
6 J65367-2 Xcc 82.0 (DLH) 88.8 (ZUP)
7 J65367-2-xcc Xcc 82.0 (DLH) 89.0 (ZUP)
8 J65367-2-xcr Xcc 82.3 (DLH) 88.5 (ZUP)
9 J64958-2 Xcc 82.3 (DLH) 89.5 (ZUP)
10 J64958-2 Xcc 82.0 (DLH) 89.5 (ZUP)
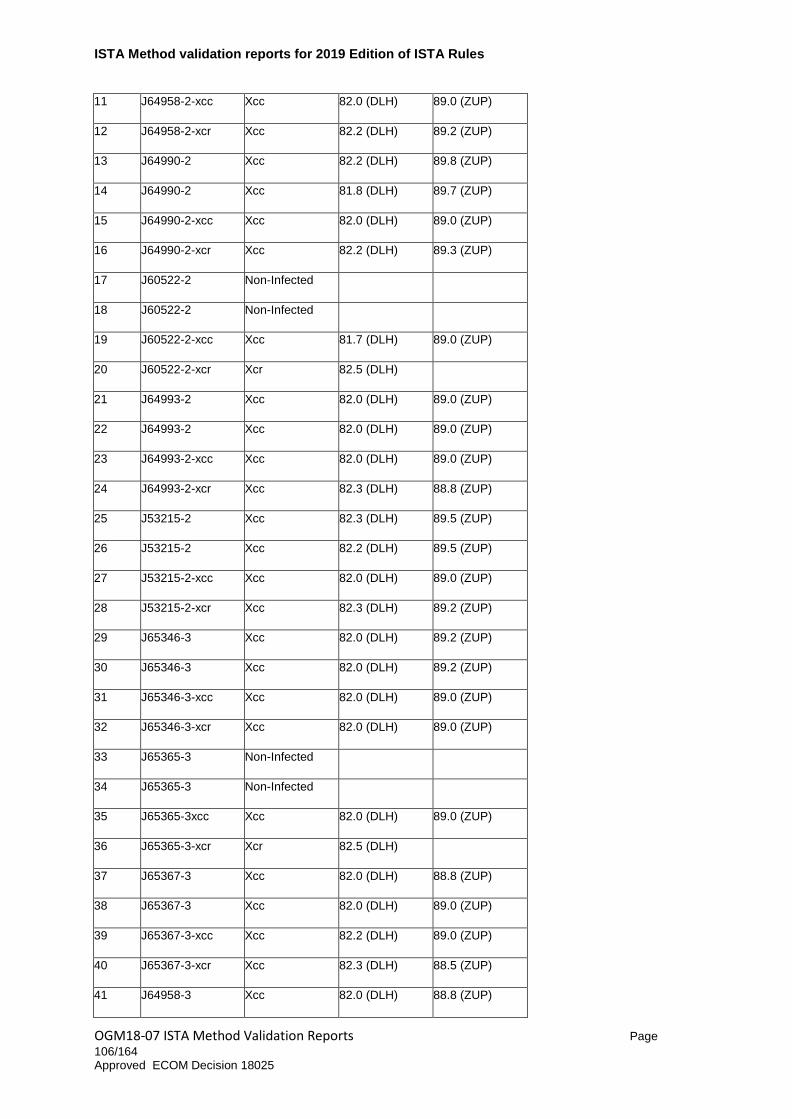
ISTA Method validation reports for 2019 Edition of ISTA Rules
OGM18-07 ISTA Method Validation Reports Page 106/164 Approved ECOM Decision 18025
11 J64958-2-xcc Xcc 82.0 (DLH) 89.0 (ZUP)
12 J64958-2-xcr Xcc 82.2 (DLH) 89.2 (ZUP)
13 J64990-2 Xcc 82.2 (DLH) 89.8 (ZUP)
14 J64990-2 Xcc 81.8 (DLH) 89.7 (ZUP)
15 J64990-2-xcc Xcc 82.0 (DLH) 89.0 (ZUP)
16 J64990-2-xcr Xcc 82.2 (DLH) 89.3 (ZUP)
17 J60522-2 Non-Infected
18 J60522-2 Non-Infected
19 J60522-2-xcc Xcc 81.7 (DLH) 89.0 (ZUP)
20 J60522-2-xcr Xcr 82.5 (DLH)
21 J64993-2 Xcc 82.0 (DLH) 89.0 (ZUP)
22 J64993-2 Xcc 82.0 (DLH) 89.0 (ZUP)
23 J64993-2-xcc Xcc 82.0 (DLH) 89.0 (ZUP)
24 J64993-2-xcr Xcc 82.3 (DLH) 88.8 (ZUP)
25 J53215-2 Xcc 82.3 (DLH) 89.5 (ZUP)
26 J53215-2 Xcc 82.2 (DLH) 89.5 (ZUP)
27 J53215-2-xcc Xcc 82.0 (DLH) 89.0 (ZUP)
28 J53215-2-xcr Xcc 82.3 (DLH) 89.2 (ZUP)
29 J65346-3 Xcc 82.0 (DLH) 89.2 (ZUP)
30 J65346-3 Xcc 82.0 (DLH) 89.2 (ZUP)
31 J65346-3-xcc Xcc 82.0 (DLH) 89.0 (ZUP)
32 J65346-3-xcr Xcc 82.0 (DLH) 89.0 (ZUP)
33 J65365-3 Non-Infected
34 J65365-3 Non-Infected
35 J65365-3xcc Xcc 82.0 (DLH) 89.0 (ZUP)
36 J65365-3-xcr Xcr 82.5 (DLH)
37 J65367-3 Xcc 82.0 (DLH) 88.8 (ZUP)
38 J65367-3 Xcc 82.0 (DLH) 89.0 (ZUP)
39 J65367-3-xcc Xcc 82.2 (DLH) 89.0 (ZUP)
40 J65367-3-xcr Xcc 82.3 (DLH) 88.5 (ZUP)
41 J64958-3 Xcc 82.0 (DLH) 88.8 (ZUP)
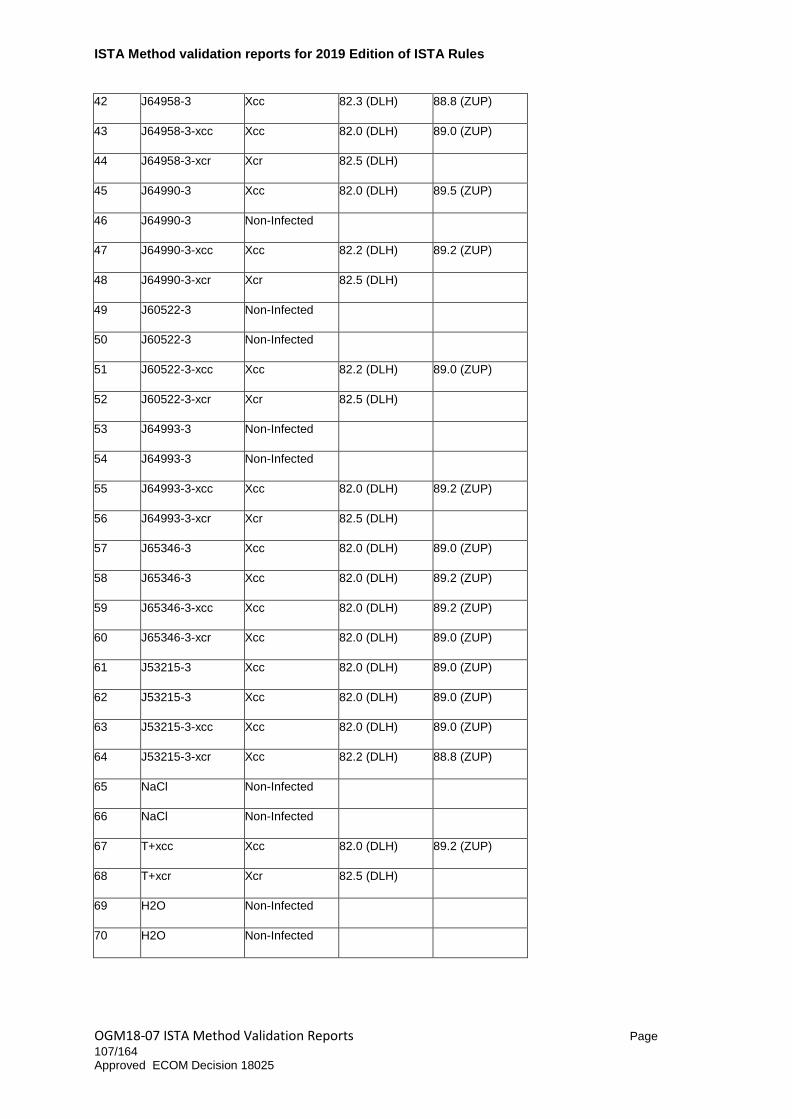
ISTA Method validation reports for 2019 Edition of ISTA Rules
OGM18-07 ISTA Method Validation Reports Page 107/164 Approved ECOM Decision 18025
42 J64958-3 Xcc 82.3 (DLH) 88.8 (ZUP)
43 J64958-3-xcc Xcc 82.0 (DLH) 89.0 (ZUP)
44 J64958-3-xcr Xcr 82.5 (DLH)
45 J64990-3 Xcc 82.0 (DLH) 89.5 (ZUP)
46 J64990-3 Non-Infected
47 J64990-3-xcc Xcc 82.2 (DLH) 89.2 (ZUP)
48 J64990-3-xcr Xcr 82.5 (DLH)
49 J60522-3 Non-Infected
50 J60522-3 Non-Infected
51 J60522-3-xcc Xcc 82.2 (DLH) 89.0 (ZUP)
52 J60522-3-xcr Xcr 82.5 (DLH)
53 J64993-3 Non-Infected
54 J64993-3 Non-Infected
55 J64993-3-xcc Xcc 82.0 (DLH) 89.2 (ZUP)
56 J64993-3-xcr Xcr 82.5 (DLH)
57 J65346-3 Xcc 82.0 (DLH) 89.0 (ZUP)
58 J65346-3 Xcc 82.0 (DLH) 89.2 (ZUP)
59 J65346-3-xcc Xcc 82.0 (DLH) 89.2 (ZUP)
60 J65346-3-xcr Xcc 82.0 (DLH) 89.0 (ZUP)
61 J53215-3 Xcc 82.0 (DLH) 89.0 (ZUP)
62 J53215-3 Xcc 82.0 (DLH) 89.0 (ZUP)
63 J53215-3-xcc Xcc 82.0 (DLH) 89.0 (ZUP)
64 J53215-3-xcr Xcc 82.2 (DLH) 88.8 (ZUP)
65 NaCl Non-Infected
66 NaCl Non-Infected
67 T+xcc Xcc 82.0 (DLH) 89.2 (ZUP)
68 T+xcr Xcr 82.5 (DLH)
69 H2O Non-Infected
70 H2O Non-Infected
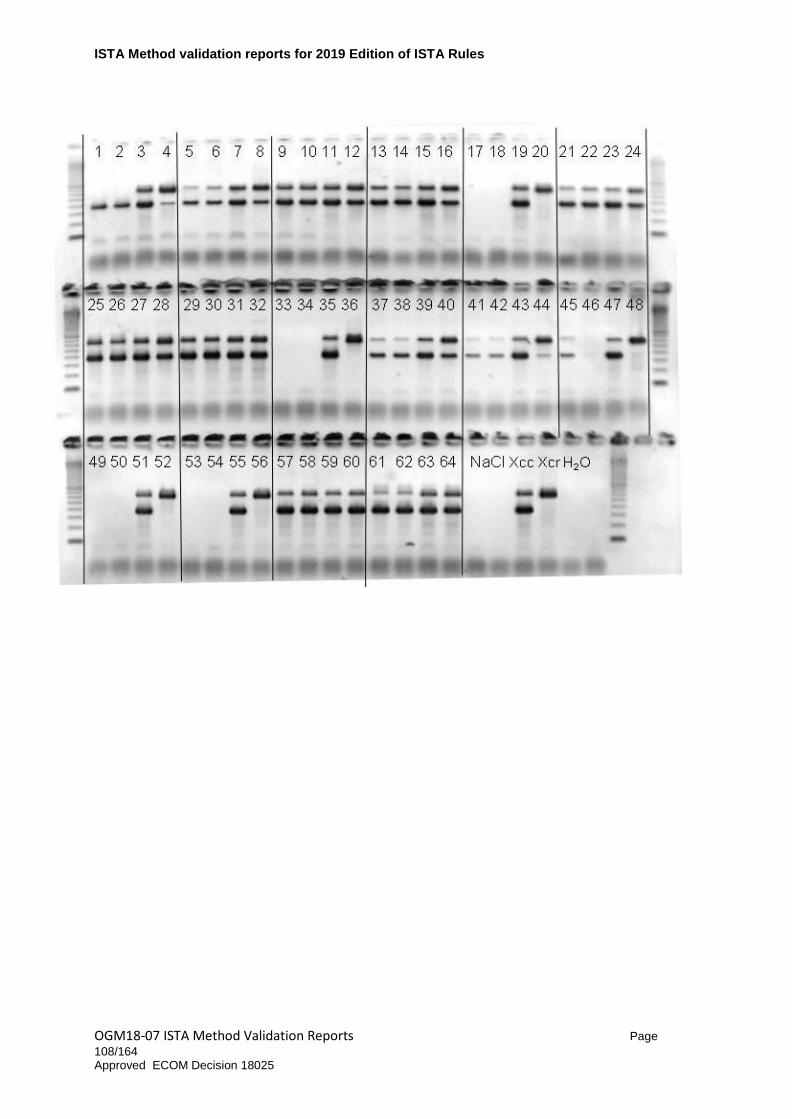
ISTA Method validation reports for 2019 Edition of ISTA Rules
OGM18-07 ISTA Method Validation Reports Page 108/164 Approved ECOM Decision 18025

OGM18-07 ISTA Method Validation Reports Page 109/164 Approved ECOM Decision 18025
User 2 (Reproducibility test 2)
Real-time PCR Melt Report
Temp. Threshold 79°c
Threshold 0.1
Melt data for Melt A.Green
No Sample Genotype Peak 1 Peak 2
1 53215 Xcc 81.5 (DLH) 88.8 (ZUP)
2 53215 Xcc 81.7 (DLH) 89.0 (ZUP)
3 53215+xcc Xcc 81.5 (DLH) 89.0 (ZUP)
4 53215+xcr Xcc 82.3 (DLH) 88.3 (ZUP)
5 60522 Non-Infected
6 60522 Non-Infected
7 60522+xcc Xcc 81.8 (DLH) 89.0 (ZUP)
8 60522+xcr Xcr 82.5 (DLH)
9 64958 Xcc 81.5 (DLH) 89.0 (ZUP)
10 64958 Xcc 81.5 (DLH) 89.0 (ZUP)
11 64958+xcc Xcc 81.5 (DLH) 89.0 (ZUP)
12 64958+xcr Xcc 82.0 (DLH) 88.8 (ZUP)

OGM18-07 ISTA Method Validation Reports Page 110/164 Approved ECOM Decision 18025
13 64990 Xcc 81.8 (DLH) 89.2 (ZUP)
14 64990 Xcc 81.7 (DLH) 89.3 (ZUP)
15 64990+xcc Xcc 81.2 (DLH) 89.0 (ZUP)
16 64990+xcr Xcr 82.3 (DLH)
17 64993 Xcc 81.7 (DLH) 88.7 (ZUP)
18 64993 Xcc 81.8 (DLH) 88.8 (ZUP)
19 64993+xcc Xcc 80.5 89.0 (ZUP)
20 64993+xcr Xcr 82.3 (DLH)
21 65346 Xcc 81.8 (DLH) 89.0 (ZUP)
22 65346 Xcc 81.7 (DLH) 89.0 (ZUP)
23 65346+xcc Xcc 81.8 (DLH) 89.0 (ZUP)
24 65346+xcr Xcc 81.8 (DLH) 89.0 (ZUP)
25 65365 Xcc 89.0 (ZUP)
26 65365 Xcc 89.0 (ZUP)
27 65365+xcc Xcc 89.0 (ZUP)
28 65365+xcr Xcc 82.0 (DLH) 88.7 (ZUP)
29 65367 Xcc 82.0 (DLH) 89.0 (ZUP)
30 65367 Xcc 82.0 (DLH) 89.2 (ZUP)
31 65367+xcc Xcc 82.0 (DLH) 89.0 (ZUP)
32 65367+xcr Xcc 82.3 (DLH) 88.3 (ZUP)
33 nacl Non-Infected
34 nacl Non-Infected
35 xcc Xcc 81.8 (DLH) 89.0 (ZUP)
36 xcr Xcr 82.3 (DLH)
37 H2O Non-Infected
38 H2O Non-Infected

OGM18-07 ISTA Method Validation Reports Page 111/164 Approved ECOM Decision 18025

OGM18-07 ISTA Method Validation Reports Page 112/164 Approved ECOM Decision 18025
Validation study to add TaqMan PCR as an option to the conventional PCR test for the identification of Xanthomonas campestris pv. campestris and pv. raphani in Brassica seed supporting the proposal C.7.1 to modify Seed Health Method 7-019a. R. Barnhoorn (Monsanto Holland B.V.) Monsanto Holland B.V., Leeuwenhoekweg 52, 2661 CZ Bergschenhoek, The Netherlands E-mail: [email protected]
Abstract Xanthomonas campestris pv. campestris (Xcc) and pv. raphani (Xcr) are gram-negative, seed-borne bacteria that cause disease (Xcc - black rot, and Xcr - leaf spot disease) on Brassica crops. An Xcc/Xcr outbreak in commercial farming may have significant environmental, economic, and legal repercussions for the parties involved.
The seed industry developed, validated and proposed a method to be adopted as an ISTA Rule. The ISTA Rule 7-019a is a bacterial plating-based method for detection of Xcc/Xcr on untreated Brassica seed and includes confirmation of suspect isolates by medium-specific morphological evaluation, PCR assays, or host-pathogenicity testing.
It employs DHL/Zup conventional PCR assays (Rijlaarsdam et al., 2004, Berg et al., 2005) to confirm the identity of suspect isolates. The method also offers two additional options - the Berg and Köhl TaqMan PCR assays - for PCR confirmation. The universal domain-Bacteria Wu TaqMan PCR assay, (Wu et al., 2008) functions as an internal process control (IPC) for the Berg (Berg et al., 2006) and Köhl (Köhl et al., 2011) TaqMan PCR assays.
1. INTRODUCTION Xanthomonas campestris pv. campestris (Xcc) and pv. raphani (Xcr) are gram-negative, seed-borne bacteria that cause disease (Xcc - black rot, and Xcr - leaf spot disease) on Brassica crops. An Xcc/Xcr outbreak in commercial farming may have significant environmental, economic, and legal repercussions for the parties involved.
The seed industry developed, validated and proposed a method to be adopted as an ISTA Rule. The ISTA Rule 7-019a is a bacterial plating-based method for detection of Xcc/Xcr on untreated Brassica seed and includes confirmation of suspect isolates by medium-specific morphological evaluation, PCR assays, or host-pathogenicity testing.
It employs DHL/Zup conventional PCR assays (Rijlaarsdam et al., 2004, Berg et al., 2005) to confirm the identity of suspect isolates. The method also offers two additional options - the Berg and Köhl TaqMan PCR assays - for PCR confirmation. The universal domain-Bacteria Wu TaqMan PCR assay, (Wu et al., 2008) functions as an internal process control (IPC) for the Berg (Berg et al., 2006) and Köhl (Köhl et al., 2011) TaqMan PCR assays. 2. PROTOCOL VALIDATION This report assesses the elements critical to the development, validation, and routine implementation of Berg-Wu and Köhl-Wu duplex TaqMan PCR assays for confirmation of suspect Xcc/Xcr isolates. Performance parameters were evaluated independently for the

OGM18-07 ISTA Method Validation Reports Page 113/164 Approved ECOM Decision 18025
TaqMan PCR and included analytical sensitivity and specificity, selectivity, accuracy, repeatability, reproducibility and robustness. This was followed by a comparative test (CT) where the performance criteria accuracy, repeatability, and reproducibility were evaluated. To finalize the validation, the CT examined the TaqMan based PCR method in relation to the conventional PCR reference methods (ISTA Rule 7-019a). 3. ASSAY VALIDATION- PERFORMANCE CRITERIA
Assay validation was performed in two sequential parts. First, all performance parameters of the TaqMan PCR assay were validated. All performance parameters of the total assay (bacterial DNA preparation and TaqMan PCR) were validated thereafter. The presentation of findings in this section is organized by performance parameter, and does not represent the validation process flow. All validation experiments were conducted in accordance to the assay protocol unless stated otherwise.
3.1. Sensitivity
Sensitivity of an assay is determined by two parameters, the limit of detection and limit of quantification of that assay.
Requirement Show that both selective assays are always able to identify the suspect ( Xcc or Xcr) by being far more sensitive than the practice sample load in routine testing.
In a TaqMan PCR assay, the limit of detection (LOD) is the lowest concentration, or concentration range, at which the analyte, a target DNA sequence, can be detected in 95% of replicates tested. The limit of quantification (LOQ) is the lowest concentration, or concentration range, at which the analyte, a target DNA sequence, can be detected within limits of replicate variation and amplification efficiency determined adequate by the project owner.
Requirement
The new assay should be as sensitive as dilution plating. Dilution plating is not in this test but refers to data presented in the validation report for SE-PCR as a pre-screen for detecting Xcc in Brassica seed where plating LOD/LOQ is around the 100 CFU/ml on semi-selective media.
3.1.1. TaqMan PCR Assay Sensitivity Evaluate the LOD and LOQ of the TaqMan PCR component of the assay with respect to purified Xcc and/or Xcr DNA.
Experimental Method Ninety replicates of the positive amplification controls (PAC=10 pg) by both TaqMan PCR Berg-Wu and Köhl-Wu duplex TaqMan PCR assays were assayed. A ten-fold dilution serie of purified genomic Xcc DNA ranging from 10 ng to 10 fg were tested by PCR in triplicate per dilution with the both Berg-Wu and Köhl-Wu duplex TaqMan PCR assays. After 10 days, the experiment was repeated using different TaqMan PCR reagents, DNA templates, TaqMan PCR thermocyclers, micropipettes, and labware. At this time 12 replicates of each dilution were tested. All data from each experiment is combined to generate TaqMan PCR assay sensitivity data.

OGM18-07 ISTA Method Validation Reports Page 114/164 Approved ECOM Decision 18025
Results1
Table 1 - TaqMan PCR Assay sensitivity data to determine the LOD of the assay (100% detection)
Xcc DNA Berg/Wu Duplex Köhl/Wu Duplex
Berg Wu Köhl Wu 10 ng 15 of 15 15 of 15 15 of 15 15 of 15 1 ng 15 of 15 15 of 15 15 of 15 15 of 15 100 pg 15 of 15 15 of 15 15 of 15 15 of 15 10 pg 15 of 15 15 of 15 15 of 15 15 of 15 1 pg 15 of 15 15 of 15 15 of 15 15 of 15 100 fg 15 of 15 15 of 15 15 of 15 15 of 15 10 fg 15 of 15 15of 15 3 of 15 10 of 15 LOD 10 fg 10 fg 100 fg 100 fg The Berg component of the Berg-Wu assay shows 100% Xcc DNA detection at 10 fg; the limit of detection exists at 10 fg. The Köhl component of the Köhl-Wu detects all replicates of Xcc DNA at 100 fg, so the limit of detection exists at 100 fg or less.
Table 2 - TaqMan PCR Assay sensitivity data to determine LOQ of the assay. (Reliability of 100% of the replicates within a standard deviation of 0.67 Ct (Applied Biosystems standard))
Berg/Wu Duplex Köhl/Wu Duplex Xcc DNA Berg Wu Köhl Wu
10 ng Ct Mean 12.37 12.40 13.58 14.04 Ct ơ 0.459 0.461 0.212 0.266
1 ng Ct Mean 16.03 16.05 16.85 17.15 Ct ơ 0.228 0.241 0.194 0.269
100 pg Ct Mean 19.64 19.70 20.37 20.66 Ct ơ 0.224 0.218 0.229 0.168
10 pg Ct Mean 23.22 23.07 23.90 23.88 Ct ơ 0.210 0.215 0.283 0.259
1 pg Ct Mean 26.76 26.63 27.38 27.51 Ct ơ 0.302 0.383 0.327 0.254
100 fg Ct Mean 29.83 29.78 30.83 31.00 Ct ơ 0.256 0.256 0.411 0.388
10 fg Ct Mean 30.62 30.55 34.67 34.82 Ct ơ 0.316 0.319 1.073 1.170
LOQ 100 fg 100 fg 100 fg 100 fg
Reliable quantification for the TaqMan PCR component of an assay is determined by ΔCT, a measure of amplification efficiency between two DNA concentrations (an international recommendation, see Bustin et al. (2009), is 90% efficiency, an Applied Biosystems standard corresponds to 3.0-3.67 Ct between ten-fold dilutions of cells and Ct standard deviation - internal recommendation is 0.67 Ct or less) at each given concentration in the test range.
For both duplex TaqMan PCR assays, these recommendations are observed through 100 fg of Xcc DNA. If only Ct values were used, the LOQ level determination 10 fg would be considered as the LOQ. However, due to the standard deviation values of the Köhl-Wu
1 Reference Appendix 1.v-genomic DNA standard curve data (p.26), Appendix 1.i.-TaqMan PCR
optimization data (p.21), Appendix 1.iii-Positive amplification control range data (p.25)

OGM18-07 ISTA Method Validation Reports Page 115/164 Approved ECOM Decision 18025
Duplex and the deviation of the Ct values between 100 fg and 10 fg with the Berg-Wu duplex, the limit of quantification for the TaqMan PCR assay was determined to be approximately 100 fg.
3.1.2. Total Assay Sensitivity
Evaluate the LOD and LOQ of the total assay with respect to Xcc/Xcr cell suspensions.
Experimental Method
A positive process control (PPC) suspension (OD600=0.1*10-2) was prepared, boiled and assayed in 40 replicates by both Berg-Wu and Köhl-Wu duplex TaqMan PCR assays. In addition to the 40 replicates, six ten-fold serial dilutions on each suspension from OD600=0.100 - 0.100×10⁻⁶ were prepared, boiled and tested in triplicate per dilution by both Berg-Wu and Köhl-Wu duplex TaqMan PCR assays. As with the experiment described in 3.1.1 the test was repeated with 12 replicates after 10 days using different TaqMan PCR reagents, DNA templates, TaqMan PCR thermocyclers, micropipettes, and labware. All data from from both experiments were combined to generate total assay sensitivity data.
Results2
Table 3 - TaqMan PCR Assay sensitivity data to determine the LOD of the assay (100% detection)
Dilution Berg/Wu Duplex Köhl/Wu Duplex Berg Wu Köhl Wu
OD600=0.100 15 of 15 15 of 15 15 of 15 15 of 15 10-1 15 of 15 15 of 15 15 of 15 15 of 15 10-2 15 of 15 15 of 15 15 of 15 15 of 15 10-3 15 of 15 15 of 15 15 of 15 15 of 15 10-4 15 of 15 15 of 15 15 of 15 15 of 15 10-5 15 of 15 15 of 15 15 of 15 15 of 15 10-6 13 of 15 13 of 15 1 of 15 4 of 15 LOD 10-5 10-5 10-5 10-5
The Berg component of the Berg-Wu assay falls below 95% Xcc/Xcr detection at OD600= 0.100×10⁻⁶; therefore, its limit of detection is approximated to be OD600= 0.100×10⁻⁵. Like for the Berg component the Köhl component of the Köhl-Wu assay falls below 95% Xcc/Xcr detection at OD600= 0.100×10⁻⁶; therefore, its limit of detection as well exists at OD600= 0.100×10⁻⁵.
The limit of detection can be approximated to be 10 CFU/ml for the Berg-Wu assay, and 100 CFU/ml for the Köhl-Wu assay using a Ct threshold of <32 for both the Berg and Köhl components. Table 4 - TaqMan PCR Assay sensitivity data to determine the LOQ of the assay. Reliability of 100% of the replicates within a standardeviation of 0.67 Ct (Applied Biosystems standard)) Berg/Wu Duplex Köhl /Wu Duplex Dilution Berg Wu Köhl Wu
OD600=0.100 Ct Mean 14.23 13.81 15.94 16.55 Ct ơ 0.127 0.213 0.320 0.336
10-1 Ct Mean 17.85 17.37 19.33 20.19 Ct ơ 0.137 0.344 0.278 0.299
10-2 Ct Mean 21.38 21.09 22.96 23.87
2 Reference Appendix 1.ii-Total assay optimization data (p.24), Appendix 1. iv.-Positive process
control range data (p.25)
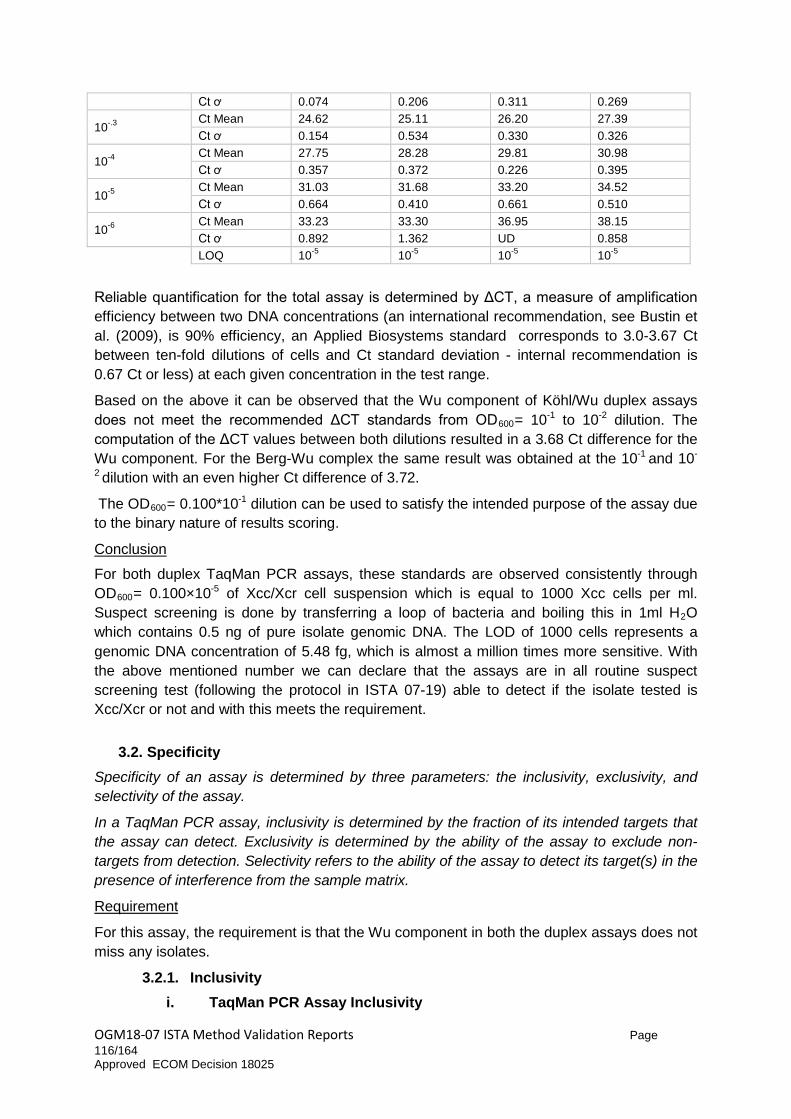
OGM18-07 ISTA Method Validation Reports Page 116/164 Approved ECOM Decision 18025
Ct ơ 0.074 0.206 0.311 0.269
10-.3 Ct Mean 24.62 25.11 26.20 27.39 Ct ơ 0.154 0.534 0.330 0.326
10-4 Ct Mean 27.75 28.28 29.81 30.98 Ct ơ 0.357 0.372 0.226 0.395
10-5 Ct Mean 31.03 31.68 33.20 34.52 Ct ơ 0.664 0.410 0.661 0.510
10-6 Ct Mean 33.23 33.30 36.95 38.15 Ct ơ 0.892 1.362 UD 0.858
LOQ 10-5 10-5 10-5 10-5
Reliable quantification for the total assay is determined by ΔCT, a measure of amplification efficiency between two DNA concentrations (an international recommendation, see Bustin et al. (2009), is 90% efficiency, an Applied Biosystems standard corresponds to 3.0-3.67 Ct between ten-fold dilutions of cells and Ct standard deviation - internal recommendation is 0.67 Ct or less) at each given concentration in the test range.
Based on the above it can be observed that the Wu component of Köhl/Wu duplex assays does not meet the recommended ΔCT standards from OD600= 10-1 to 10-2 dilution. The computation of the ΔCT values between both dilutions resulted in a 3.68 Ct difference for the Wu component. For the Berg-Wu complex the same result was obtained at the 10-1 and 10-
2 dilution with an even higher Ct difference of 3.72.
The OD600= 0.100*10-1 dilution can be used to satisfy the intended purpose of the assay due to the binary nature of results scoring.
Conclusion For both duplex TaqMan PCR assays, these standards are observed consistently through OD600= 0.100×10⁻⁵ of Xcc/Xcr cell suspension which is equal to 1000 Xcc cells per ml. Suspect screening is done by transferring a loop of bacteria and boiling this in 1ml H2O which contains 0.5 ng of pure isolate genomic DNA. The LOD of 1000 cells represents a genomic DNA concentration of 5.48 fg, which is almost a million times more sensitive. With the above mentioned number we can declare that the assays are in all routine suspect screening test (following the protocol in ISTA 07-19) able to detect if the isolate tested is Xcc/Xcr or not and with this meets the requirement.
3.2. Specificity
Specificity of an assay is determined by three parameters: the inclusivity, exclusivity, and selectivity of the assay.
In a TaqMan PCR assay, inclusivity is determined by the fraction of its intended targets that the assay can detect. Exclusivity is determined by the ability of the assay to exclude non-targets from detection. Selectivity refers to the ability of the assay to detect its target(s) in the presence of interference from the sample matrix.
Requirement
For this assay, the requirement is that the Wu component in both the duplex assays does not miss any isolates.
3.2.1. Inclusivity i. TaqMan PCR Assay Inclusivity

OGM18-07 ISTA Method Validation Reports Page 117/164 Approved ECOM Decision 18025
Evaluate the inclusivity of the Wu component of the TaqMan PCR duplex assays (Berg-Wu/ Köhl-Wu) with respect to bacterial DNA from Brassica bacterial isolates. Note: Inclusivity of the Berg and Köhl assay already proven in validation report supporting version 6.
Experimental Method
Genomic DNA from a variety of bacterial organisms isolated from Brassica seeds were tested with both Berg-Wu and Köhl-Wu duplex TaqMan PCR assays. A total of 148 DNA samples from Brassica saprophytes and Xcc/Xcr look-alike strains were screened with both duplex Taqman PCR assays. The used DNA samples were pre-existing, and not normalized prior to use.
Results3
Of 148 genomic DNA isolates tested, 148 were detected by the Wu component of both Berg-Wu and Köhl-Wu assays. The purpose of these results is to validate the inclusivity of Wu primers against bacteria that may be present on Brassica seed. This data set supplements the validation of total assay inclusivity, which is more representative of Wu performance as an internal process control.
ii. Total Assay Inclusivity Evaluate the inclusivity of the Wu component of the total assay with respect to bacterial DNA from Brassica bacterial strains.
Experimental Method
Thirty bacterial strains recovered from routine application of the Xcc/Xcr ISTA 7-19a protocol were tested for inclusivity with the use of both Taqman duplex assays.
Results4
Of 30 Xcc/Xcr suspects assayed, 30 were detected by the Wu component of both Berg-Wu and Köhl-Wu duplex TaqMan PCR assays. Berg and Köhl did not detect any of the isolates tested. These results correlated 100% to the pathogenicity assay, confirming none of the suspects were Xcc/Xcr. All controls performed within their designated ranges. Due to the low frequency of Xcc/Xcr suspects in the bacterial plating assay, Wu assay inclusivity should be monitored closely after implementation. Accumulation of supporting data is recommended.
3.2.2. Exclusivity Exclusivity of the Wu assay was not examined, as the assay targets all bacteria, and test samples used in this assay will all be bacterial cultures.
Conclusion
100% detection of the bacterial isolates with the WU assay in both duplexes was accomplished for Xcc/Xcr isolates as well as for non-Xcc/Xcr isolates. Therefore, the requirement for Specificity is met.
3.2.3. Selectivity
3 Reference Appendix 1.vi-TaqMan PCR inclusivity data (p.27) 4 Reference Appendix 1.vii-Total assay inclusivity data (p.28)

OGM18-07 ISTA Method Validation Reports Page 118/164 Approved ECOM Decision 18025
The ability of a method to distinguish the target organism (Xcc/Xcr) from other components in the sample.
Requirement: The requirement for the selectivity criteria for the Wu-assay was determined by ΔCt a measure of 90% amplification efficiency.
i. TaqMan PCR Assay Selectivity The TaqMan PCR assay component cannot be evaluated alone due to the absence of sample matrix. Selectivity was only evaluated with respect to the total assay.
ii. Total Assay Selectivity Evaluate the effect of the TaqMan PCR efficiency and precision.
Experimental Method
A bacteria growth solution containing OD600= 2.00 of Xcc-BHK92 (prepared at a separate time than other dilutions tested) was prepared and boiled for 10 minutes in ddH2O. All boiled-extracts (n=20 replicates) were tested by both Berg-Wu and Köhl-Wu duplex TaqMan PCR assays. To determine total assay precision, assay reproducibility data was compared (reference section 3.4.2. p.12).
Results5 Table 5 - Total Assay Selectivity Berg/Wu Duplex Köhl /Wu Duplex Dilution Berg Wu Berg Wu
OD600=0.100 Ct Mean 14.24 14.38 14.77 14.92 Ct ơ 0.17 0.20 0.11 0.55
10-1 Ct Mean 18.14 18.20 18.23 18.30 Ct ơ 0.01 0.04 0.32 0.50
10-2 Ct Mean 21.82 21.90 21.85 21.96 Ct ơ 0.22 0.16 0.31 0.21
10-.3 Ct Mean 25.26 25.06 25.58 25.64 Ct ơ 0.12 0.06 0.20 0.27
10-4 Ct Mean 28.80 28.80 28.06 28.08 Ct ơ 0.19 0.14 0.21 0.28
10-5 Ct Mean 33.17 33.05 33.55 33.54 Ct ơ 0.50 0.49 0.07 0.11
10-6 Ct Mean 38.09 38.92 37.33 38.30 Ct ơ 1.45 1.52 1.49 1.55
Selectivity for the total assay was determined by ΔCt a measure of amplification efficiency (internal recommendation is 90% efficiency, an Applied Biosystems standard corresponds to 3.0-3.67 Ct between ten-fold dilutions of cells, 3.9-4.77 Ct between twenty-fold dilutions and Ct standard deviation - internal recommendation is 0.67 CT or less) at each given concentration in the test range.
When a 20x stock of positive process control is tested, the Berg component of the Berg-Wu duplex exhibits a ΔCT around 4.2, and a Ct standard deviation of 1.20. The Wu component of the Berg-Wu duplex exhibits a ΔCT around 4.2, and a Ct standard deviation of 1.21. Although guidelines of ΔCTs are met, the standard deviation detected for the Berg-Wu duplex is the cause that the Berg-Wu duplex is not recommended for use at a concentration of 20 × positive process control.
5 Reference Appendix 1. ii-Total assay optimization data (p.24), Appendix 1.iv-Positive process
control range data (p.25), Appendix 1.ix-Total assay robustness data (p.30)

OGM18-07 ISTA Method Validation Reports Page 119/164 Approved ECOM Decision 18025
The Köhl component of the Köhl -Wu assay exhibits a ΔCt around 4.2 and a Ct standard deviation of 1.35. The Wu component of the Köhl -Wu assay exhibits a ΔCt around 3.5 and a CT standard deviation of 0.33. The Köhl -Wu duplex is also not recommended for use at a concentration of 20 × positive process control. Conclusion
The Wu component of both duplex assays does not meet the recommended ΔCT standards from OD600= 0.100 to 10-1 dilution but it detects the OD600= 0.100 concentration precisely, indicating that internal process controls will produce valid results when bacterial suspensions are used at this concentration. The OD600= 0.100 dilution can be used to satisfy the intended purpose of the assay due to the binary nature of results scoring. It would also be acceptable to use a 10-1 dilution of the suspension for routine purposes and therefore meets the set requirement.
3.3. Accuracy
Accuracy of an assay consists of the trueness (or bias) and precision of that assay
3.3.1. Trueness (Bias) i. TaqMan PCR Assay Bias
Bias were is evaluated on a total assay level rather than for the TaqMan PCR assay alone. Bias are is determined by comparing test samples to a reference sample, which would yield minimal bias at this level of the test because the TaqMan PCR assay was validated using the reference sample (Xcc/Xcr-GRS1 purified genomic DNA) in the absence of matrix.
ii. Total Assay Bias Due to a lack of CT data normalization methods, test samples could not be compared to a purified genomic DNA reference. Instead, a less resolving survey of bias was performed, which compared CT means from test strains to a reference strain (Xcc/Xcr-GRS1).
Requirement
The representation of total assay bias to demonstrate that various strains of Xcc/Xcr at the standard concentration (OD600=0 .100) will consistently be detected by the proposed assay and produce a positive result. Experimental Method
Bacteria cell suspensions containing OD600=0 .100 of Xcc 355, Xcc 466, and Xcc 474 in sterile, nuclease-free water were prepared to demonstrate bias. All four different were boiled and tested (n=16 per suspension) by both Berg-Wu and Köhl-Wu duplex TaqMan PCR assays. Results were compared to the Ct values found for the positive process control (section 3.4.2. p.12).

OGM18-07 ISTA Method Validation Reports Page 120/164 Approved ECOM Decision 18025
Results6 Table 6A - Total Assay Bias, Berg-Wu
Xcc Isolate# MVS252 MVS253 MVS254 BX-92 Berg Wu Berg Wu Berg Wu Berg Wu
Ct Mean 14.66 14.54 14.85 14.74 14.44 14.36 14.56 14.43 Ct ơ 0.196 0.152 0.156 0.185 0.238 0.230 0.78 0.52 Table 6B - Total Assay Bias, Köhl -Wu
Xcc Isolate# MVS252 MVS253 MVS254 BX-92 Köhl Wu Köhl Wu Köhl Wu Köhl Wu
Ct Mean 16.37 16.36 16.41 16.40 16.16 16.14 16.05 16.38 Ct ơ 0.167 0.155 0.152 0.121 0.138 0.127 0.10 0.06 Xcc/Xcr MVS 252, 253 and 254 yielded CT means and standard deviations consistent with those of the reference strain, but do not necessarily fall within the positive process control ranges determined under reproducibility conditions. A tolerable range for Xcc/Xcr strains other than the positive process control is not required to satisfy the intended purpose of the assay, as it reports TaqMan PCR results in a binary fashion.
Strain bias are a limited assessment of assay bias. Other components of assay bias were not assessed due to the lack of reference methods for comparison against the proposed assay.
Conclusion
The representation of total assay bias given here demonstrates that various strains of Xcc/Xcr at the standard concentration (OD600=0 .100) were consistently detected by the proposed assay and produce a positive result for the different seed lods tested and therefore the results are in line with the set requirement.
3.3.2. Precision
Precision of an assay must be assessed under both repeatability and reproducibility conditions to assess different ranges of variables.
Repeatability conditions represent the most fundamental level of short-term inherent variability of a process. Under repeatability conditions, a single technician at a single location is processing replicates of a sample, using the same reagents and equipment, over a short duration of time.
Reproducibility conditions represent the long-term inherent variability of a process. Under reproducibility conditions, multiple technicians at multiple locations may process different samples, using different reagents and equipment, over separate intervals of time. Reproducibility data is produced by calculating the mean and standard deviation of collective data between all repeatability experiments.
Requirement
Demonstrate adequate precision, σ < 0.67 Ct under repeatability conditions and σ < 1.00 Ct
under reproducibility conditions (applied biosystems) throughout the operational range of the assay (10 ng to 100 fg of Xcc DNA).
6 Reference Appendix 1.viii- Total assay bias data (p.29)

OGM18-07 ISTA Method Validation Reports Page 121/164 Approved ECOM Decision 18025
i. TaqMan PCR Assay Precision Evaluate the precision of the Berg-Wu and Köhl-Wu duplex TaqMan PCR assays against Xcc/Xcr DNA under repeatability and reproducibility conditions.
Experimental Method
90 replicates of the positive amplification control were assayed by both TaqMan PCR Berg-Wu and Köhl-Wu duplex TaqMan PCR assays. This is TaqMan PCR assay repeatability experiment 1. In addition to this, seven ten-fold dilutions of Xcc purified genomic DNA ranging from 10 ng to 10 fg were prepared and tested in triplicate by both Berg-Wu and Köhl-Wu duplex TaqMan PCR assays. This is TaqMan PCR assay repeatability experiment 2. After 10 days experiment 2 was repeated using different TaqMan PCR reagents, DNA templates, TaqMan PCR thermocyclers, micropipettes, and labware by 12 replicates of each dilution (rather than triplicates). This is TaqMan PCR assay repeatability experiment 3. All data from each of the three experiments were combined to evaluate TaqMan PCR assay reproducibility.
Results 7
Table 7 - TaqMan PCR Assay Precision TaqMan PCR Assay Repeatability Experiment 1 (t0) TaqMan PCR Assay Repeatability Experiment 2 (t1) Berg/Wu Duplex Köhl /Wu Duplex Berg/Wu Duplex Köhl /Wu
Duplex Dilution Berg Wu Köhl Wu Dilution Berg Wu Köhl Wu
10 pg Ct Mean 23.23 22.87 23.89 23.78
10 ng Ct Mean 12.67 12.83 13.60 13.88
Ct ơ 0.371 0.309 0.151 0.125 Ct ơ 0.156 0.081 0.236 0.165
1 ng Ct Mean 16.31 16.39 17.09 17.32
Ct ơ 0.232 0.093 0.176 0.129 100
pg
Ct Mean 19.75 19.93 20.55 20.77
Ct ơ 0.194 0.115 0.176 0.08
10 pg Ct Mean 23.31 23.47 24.15 24.20
Ct ơ 0.293 0.095 0.057 0.047
1 pg Ct Mean 26.94 27.07 27.81 27.84
Ct ơ 0.264 0.363 0.252 0.253
100 fg Ct Mean 30.06 29.56 30.94 31.07
Ct ơ 0.336 0.362 0.144 0.284
10 fg Ct Mean 30.80 30.62 32.98 32.90
Ct ơ 0.451 0.427 0.804 0.813 TaqMan PCR Assay Repeatability Experiment 3 (t2) TaqMan PCR Assay Reproducibility (xbar, [t0, t1, t2]) Dilution Berg Wu Köhl Wu Dilution Berg Wu Köhl Wu
10 ng Ct Mean 12.30 12.30 13.60 13.88
10 ng Ct Mean 12.37 12.40 13.58 14.04
Ct ơ 0.483 0.457 0.236 0.165 Ct ơ 0.459 0.461 0.212 0.266
1 ng Ct Mean 15.96 15.96 17.09 17.32
1 ng Ct Mean 16.03 16.05 16.85 17.15
Ct ơ 0.170 0.183 0.176 0.129 Ct ơ 0.228 0.241 0.194 0.269 7 Reference Appendix 1.iii-Positive amplification control range data (p.25), Appendix 1.i-TaqMan PCR
optimization data (p.21), Appendix 1.v- Genomic DNA standard curve data (p.26)
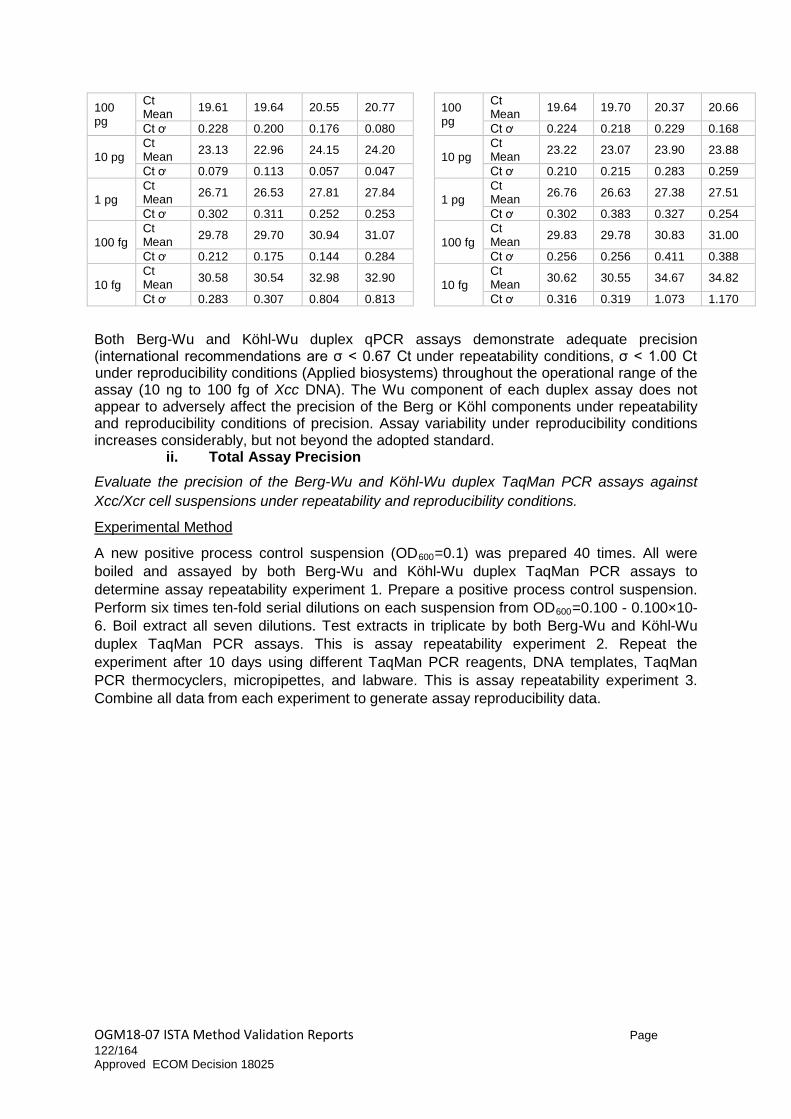
OGM18-07 ISTA Method Validation Reports Page 122/164 Approved ECOM Decision 18025
100 pg
Ct Mean 19.61 19.64 20.55 20.77 100
pg
Ct Mean 19.64 19.70 20.37 20.66
Ct ơ 0.228 0.200 0.176 0.080 Ct ơ 0.224 0.218 0.229 0.168
10 pg Ct Mean 23.13 22.96 24.15 24.20
10 pg Ct Mean 23.22 23.07 23.90 23.88
Ct ơ 0.079 0.113 0.057 0.047 Ct ơ 0.210 0.215 0.283 0.259
1 pg Ct Mean 26.71 26.53 27.81 27.84
1 pg Ct Mean 26.76 26.63 27.38 27.51
Ct ơ 0.302 0.311 0.252 0.253 Ct ơ 0.302 0.383 0.327 0.254
100 fg Ct Mean 29.78 29.70 30.94 31.07
100 fg Ct Mean 29.83 29.78 30.83 31.00
Ct ơ 0.212 0.175 0.144 0.284 Ct ơ 0.256 0.256 0.411 0.388
10 fg Ct Mean 30.58 30.54 32.98 32.90
10 fg Ct Mean 30.62 30.55 34.67 34.82
Ct ơ 0.283 0.307 0.804 0.813 Ct ơ 0.316 0.319 1.073 1.170
Both Berg-Wu and Köhl-Wu duplex qPCR assays demonstrate adequate precision (international recommendations are σ < 0.67 Ct under repeatability conditions, σ < 1.00 Ct under reproducibility conditions (Applied biosystems) throughout the operational range of the assay (10 ng to 100 fg of Xcc DNA). The Wu component of each duplex assay does not appear to adversely affect the precision of the Berg or Köhl components under repeatability and reproducibility conditions of precision. Assay variability under reproducibility conditions increases considerably, but not beyond the adopted standard.
ii. Total Assay Precision Evaluate the precision of the Berg-Wu and Köhl-Wu duplex TaqMan PCR assays against Xcc/Xcr cell suspensions under repeatability and reproducibility conditions.
Experimental Method
A new positive process control suspension (OD600=0.1) was prepared 40 times. All were boiled and assayed by both Berg-Wu and Köhl-Wu duplex TaqMan PCR assays to determine assay repeatability experiment 1. Prepare a positive process control suspension. Perform six times ten-fold serial dilutions on each suspension from OD600=0.100 - 0.100×10⁻⁶. Boil extract all seven dilutions. Test extracts in triplicate by both Berg-Wu and Köhl-Wu duplex TaqMan PCR assays. This is assay repeatability experiment 2. Repeat the experiment after 10 days using different TaqMan PCR reagents, DNA templates, TaqMan PCR thermocyclers, micropipettes, and labware. This is assay repeatability experiment 3. Combine all data from each experiment to generate assay reproducibility data.

OGM18-07 ISTA Method Validation Reports Page 123/164 Approved ECOM Decision 18025
Results 8
Table 8 - Total Assay Precision qPCR Assay Repeatability Experiment 1 (t0) qPCR Assay Repeatability Experiment 2 (t1)
Berg/Wu Duplex Köhl /Wu Duplex Berg/Wu
Duplex Köhl /Wu Duplex
Dilution Berg Wu Köhl Wu Dilution Berg Wu Köhl Wu
OD600=0.100
Ct Mean 13.67 13.87 16.47 16.89 OD600=
0.100
Ct Mean 14.21 13.99 16.05 16.38
Ct ơ 0.365 0.403 0.254 0.158 Ct ơ 0.140 0.107 0.104 0.055
10-1 Ct Mean 17.82 17.65 19.60 19.40
Ct ơ 0.083 0.036 0.078 0.062
10-2 Ct Mean 21.41 21.08 23.18 22.89
Ct ơ 0.085 0.053 0.070 0.095
10-.3 Ct Mean 24.51 24.23 26.44 26.33
Ct ơ 0.085 0.149 0.125 0.131
10-4 Ct Mean 28.16 27.65 29.90 29.74
Ct ơ 0.061 0.089 0.165 0.090
10-5 Ct Mean 31.61 31.29 32.98 33.10
Ct ơ 0.276 0.171 0.825 0.813
10-6 Ct Mean 33.82 33.35 36.95 37.06
Ct ơ 0.368 0.375 - - qPCR Assay Repeatability Experiment 3 (t2) qPCR Assay Reproducibility (xbar,[t0,t1,t2]) Dilution Berg Wu Köhl Wu Dilution Berg Wu Köhl Wu
OD600=0. 0100
Ct Mean 14.24 13.76 15.91 16.60 OD600=
0.100
Ct Mean 14.23 13.81 15.94 16.55
Ct ơ 0.130 0.210 0.352 0.364 Ct ơ 0.127 0.213 0.320 0.336
10-1 Ct Mean 17.85 17.30 19.26 20.13 10-1
Ct Mean 17.85 17.37 19.33 20.19
Ct ơ 0.150 0.351 0.267 0.313 Ct ơ 0.137 0.344 0.278 0.299
10-2 Ct Mean 21.37 21.10 22.91 23.86 10-2
Ct Mean 21.38 21.09 22.96 23.87
Ct ơ 0.073 0.232 0.325 0.301 Ct ơ 0.074 0.206 0.311 0.269
10-.3 Ct Mean 24.65 25.32 26.30 27.27 10-.3
Ct Mean 24.62 25.11 26.20 27.39
Ct ơ 0.157 0.313 0.288 0.123 Ct ơ 0.154 0.534 0.330 0.326
10-4 Ct Mean 27.65 28.43 29.78 30.90 10-4
Ct Mean 27.75 28.28 29.81 30.98
Ct ơ 0.323 0.201 0.239 0.407 Ct ơ 0.357 0.372 0.226 0.395
10-5 Ct Mean 30.86 31.78 32.63 34.38 10-5
Ct Mean 31.03 31.68 33.20 34.52
Ct ơ 0.652 0.394 0.636 0.308 Ct ơ 0.664 0.410 0.661 0.510
10-6 Ct Mean 33.13 33.29 UD* 38.52 10-6
Ct Mean 33.23 33.30 36.95 38.15
Ct ơ 0.924 1.476 UD 0.556 Ct ơ 0.892 1.362 UD 0.858
Both Berg-Wu and Köhl-Wu duplex TaqMan PCR assays demonstrate adequate precision international recommendations are σ < 0.67 Ct under repeatability conditions, σ < 1.00 Ct under reproducibility conditions (applied biosystems) throughout the operational range of the assay (OD600=0.100- 0.100×10⁻⁵ for Xcc cell suspensions). The Wu component of each duplex assay does not appear to adversely affect the precision of the Berg or Köhl
8 Reference Appendix 1. iv-Positive process control data (p.25), Appendix 1.ii-Total assay optimization
data (p.24)

OGM18-07 ISTA Method Validation Reports Page 124/164 Approved ECOM Decision 18025
components under repeatability and reproducibility conditions of precision. Assay variability under reproducibility conditions increases considerably, but not beyond the adopted standard. All CT values from the repeatability experiments fall within the positive process control ranges (reference section 3.4.2. p.12). Reproducibility should be evaluated over a broader range of time, technicians, instruments, and laboratories. A more accurate measure of reproducibility will be assessed using data generated from routine assay. Periodic evaluation of reproducibility is critical to monitoring of the assay. Conclusion The requirement set for both Taqman PCR duplex assays is met over a multitude of different experiments performed to demonstrate assay repeatability and reproducibility.
3.4. Control Range Determination: Determine quantitative ranges for positive amplification and process controls. Negative amplification and process controls are included in all the experiments performed within the scope of this project, but are evaluated on a binary scale rather than a continuous range. Negative controls must not produce CT data. Requirement
TaqMan PCR positive control results within three standard deviations above or below mean CT values for the assays.
3.4.1. Positive amplification control Experimental Method TaqMan PCR assay precision - TaqMan PCR assay reproducibility data was referenced to determine the positive process control range (reference section 3.3.2.i. p.9).
Results9 Table 9 - Positive Amplification Control Range Berg/Wu duplex Köhl /Wu duplex Berg Wu Köhl Wu Ct mean 24.07 23.73 Ct mean 26.55 26.49 Ct ơ 0.48 0.39 Ct ơ 0.85 0.73 Range min 23.01 22.78 Range min 24.10 24.16 Range max 24.96 24.43 Range max 27.51 27.30 Average CT values and standard deviations for both assays were calculated. Positive amplification control results are considered acceptable within three standard deviations above or below the mean CT values. Under the experimental conditions occurring during this study, 99.7% of replicates are expected to yield results within the acceptable range. The control limits determined above are provisional, and result from limited process variability. Following implementation, control limits must be continuously re-assessed for new ranges to be set under conditions representative of routine processing.
9 Reference Appendix 1.v-Genomic DNA standard curve data (p.26), Appendix 1.i-TaqMan PCR assay
optimization data (p.21), Appendix 1.iii-Positive amplification control data (p.25)

OGM18-07 ISTA Method Validation Reports Page 125/164 Approved ECOM Decision 18025
3.4.2. Positive process control Experimental Method
To determine total assay precision, the assay reproducibility data was refferenced for the range of the positive process control (section 3.3.2.ii p.10). Results10
Table 10 - Positive Process Control Range Berg/Wu duplex Köhl /Wu duplex Berg Wu Köhl Wu Ct mean 13.82 13.86 Ct mean 16.32 16.80 Ct ơ 0.405 0.361 Ct ơ 0.360 0.266 Range max 14.35 14.78 Range max 16.90 17.19 Range min 12.85 13.05 Range min 15.36 16.04 Average CT values and standard deviations for both assays were calculated.
Conclusion
TaqMan PCR positive control results are considered acceptable within three standard deviations above or below mean CT values.
3.5. Robustness
Evaluate the effects of systematic (introduced) process variability on assay performance. Robustness was evaluated with respect to the total assay, but not the TaqMan PCR component of the assay, as systematic error is much more likely to occur during culture preparation and processing that during TaqMan PCR setup.
3.5.1. Total Assay Robustness Evaluate the effects of un-boiled and over-concentrated positive process control suspensions, and positive process control suspensions prepared from overgrown culture, on the performance of the assay.
Requirement The effect of boiling or direct use of the extract in the protocol on the detection of Xcc was investigated as well as concentration differences and the difference of growth time of the isolates prior to testing. Experimental Method
Twenty-four positive process control suspensions (OD600=0.1) were prepared and directly tested with both Berg-Wu and Köhl-Wu duplex TaqMan PCR assays. Another 20 × stock solution of Xcc-BHK92 [OD600= 2.00] was prepared, boiled and tested (n=24 replicates) by both Berg-Wu and Köhl-Wu duplex TaqMan PCR assays. And as third discrimination a stock solution positive of a process control culture which was grown for 96 h on YDC agar was prepared, boiled and tested (n=24 replicates) by both Berg-Wu and Köhl-Wu duplex TaqMan PCR assays. All data from the three different preperations were compared to positive process control data (section 3.4.2, p.12) to determine if the assays deliver robust results.
10 Reference Appendix 1. ii-Total assay optimization (p.24), Appendix 1.iv for and positive process
control data (p.25)

OGM18-07 ISTA Method Validation Reports Page 126/164 Approved ECOM Decision 18025
Results11
Table 11A - Total Assay Robustness: Berg-Wu Duplex 96 h isolate Unboiled (OD=0.100) Overloaded
(OD=2.00) PPC
Berg Wu Berg Wu Berg Wu Berg Wu Ct mean 16.05 16.06 13.71 13.71 8.01 8.15 13.67 13.87 Ct ơ 0.29 0.30 0.16 0.17 1.20 1.21 0.36 0.40 Table 11B - Total Assay Robustness: Köhl-Wu Duplex 96 h isolate Unboiled (OD=0.100) Overloaded
(OD=2.00) PPC
Köhl Wu Köhl Wu Köhl Wu Köhl Wu Ct mean 16.89 17.07 14.19 14.42 8.57 9.46 14.47 14.89 Ct ơ 0.37 0.31 0.28 0.11 1.35 0.33 0.25 0.16
The 96 h positive process control is detected approximately two cycles later than the standard control used for this assay. This is likely due to excessive growth and metabolic waste on the agar from which bacterial culture is retrieved, as well as a lower DNA concentration to sample matrix ratio in the cell suspension prepared. Although precision does not appear to be significantly affected by the older culture, the shift in trueness makes this control variant unsuitable for use in routine assay.
The un-boiled positive process control demonstrates equivalence of both trueness and precision to the standard control. Note that TaqMan PCR cycling parameters used include a 10 min, 95°C interval to heat-activate polymerase enzymes in the TaqMan PCR mastermix.
The over-concentrated positive process control performs appropriately with respect to the Berg component of the assay, but the ΔCT (standard-overloaded) shows a significant reduction of reaction efficiency with respect to the Wu component of the assay.
Conclusion These robustness experiments confirm the importance of assay standardization. Operators must ensure that samples are processed with close attention to time and extent of culture growth, as well as optical density of the cell suspension prior to boiling. These factors aside, the assay demonstrates considerable tolerance to an inefficacious boiling process.
11 Reference Appendix 1.ix-Total assay robustness data (p.30)

OGM18-07 ISTA Method Validation Reports Page 127/164 Approved ECOM Decision 18025
4. COMPARATIVE TEST 4.1. Organization
An interlaboratory comparative test was organized by Monsanto Holland B.V. for confirmation by Taqman PCR and conventional PCR of Xanthomonas campestris pv. campestris (Xcc) and raphani (Xcr) on suspect colonies found in dilution plating of Brassica seeds.
4.1.1. Aim The aim of this comparative test was to validate the use of a quantitative PCR method for the confirmation of Xcc/ Xcr suspect colonies found in dilution plating in comparison to the conventional PCR option currently described in ISTA Rule 7-019a. The Taqman PCR and conventional PCR were compared to each other. The objective is that the Taqman PCR should perform at least as well as the conventional PCR before it can be added as an additional PCR option.
4.1.2. Participants Seven laboratories participated in this test and were randomly allocated to a number, so that the results remain anonymous. All seven laboratories performed the TaqMan PCR according to the protocol shared in the CT test plan. The conventional PCR was performed according to ISTA rule 7-019a by one laboratory only.
4.1.3. DNA samples All laboratories received one set of samples in May 2017. Each set consisted of 60 genomic DNA samples (10 pg generated via a Qiagen DNeasy Genomic DNA isolation and concentration measurement on a Nanodrop) of different bacterial isolates (Appendix 2) and were divided among the following four categories:
- 20 Xanthomonas campestris pv. campestris - 10 Xanthomonas campestris pv. raphani - 18 Xanthomonas look-alike bacterial isolates - 12 Xanthomonads species commonly found on various vegetable crops
In addition to the samples, a positive Xcc control (1 ng, PPC1), positive Xcr control (1 ng, PPC2), a negative process control (NPC= 1 ng Acidovorax cattleyae) and a non-template control (NTC= ddH2O) were included in the package. Each participating lab was also asked to include at least one Xcc positive boiled bacterial extract (PPC3) from their own collection to demonstrate the effectiveness of the Taqman-PCR assay on bacterial isolates extracted as described in ISTA methods 7-019a and 7-019b. The boiled samples were prepared by transferring a small quantity of Xcc bacteria, grown for 2-4 days on YDC-media, using a tooth pick to a tube containing 1ml dH2O and vortexing to obtain a homogenised suspension, which was boiled for 5 min at 100oC.
4.1.4. Notation of results The participants reported quantitative (Ct-Values) as well as qualitative (positive/negative) results for each subsample. Statistical analysis was performed only on the qualitative data since Ct-values are difficult to compare due a multitude of deviants such as equipment, chemicals used, thresholds, primer probe supplier, etc.
4.2. Statistical analysis 4.2.1. Homogeneity test

OGM18-07 ISTA Method Validation Reports Page 128/164 Approved ECOM Decision 18025
Since genomic DNA was used in this comparative test no homogeneity test was performed. 4.2.2. Stability test
To determine stability of the samples over time and during transport an extra set of samples was shipped intercontinentally to a participant and immediately returned to the test organiser for testing. Stability was determined by performing Taqman PCR only.
4.2.3. Analysis CT: Statistical analysis for qualitative methods Samples with no expected variation in the qualitative test result were analysed according to the Standard NF EN ISO 16140 (AFNOR, 2003). Calculation of sensitivity, specificity, accuracy and reproducibility was performed according to the following mathematical formulas: Sensitivity = ΣPA/(ΣPA+ΣND) x 100 Specificity = ΣNA/(ΣNA+ΣPD) x 100 Accuracy = (ΣNA+ΣPA)/(ΣPA+ΣNA+ΣPD+ΣND) x 100 Where PA = positive agreement, ND = negative deviation, NA = negative agreement and PD = positive deviation Although no fixed rule is determined, as guidance, it is mentioned that values >80% are acceptable (ISTA, 2013). This number is used here to determine whether a method is acceptable or not. For each of the four categories of DNA samples, accordance (repeatability of qualitative data) and concordance (reproducibility of qualitative data) were evaluated using the method and tool developed by Langton et al. (2002). Accordance was evaluated only on stability data. Accordance is expressed as the probability that two sample give the same result, then the probability is averaged over all laboratories. Accordance = number accords/number of possible accords in one laboratory. Concordance is number of accords / number of possible accords between laboratories (see ISTA, 2013).
4.3. Analysis of XCC CT: Stability tests The stability test was performed once all participating laboratories had started their tests (June 2017). The Internal control (IC) assay Wu were not always in accordance with the scoring acceptance criteria described in the test plan: “To determine if a sample is properly prepared the Ct-value of the Wu in Xcc/Xcr negative samples should be at least 3.3 Ct’s lower than the NTC. In other words, the sample needs to contain 10 × more microbial DNA than present in the NTC”. However, aside from the IC data, neither the sample set stored on site nor the transcontinentally shipped sample set yielded any false positive or false negative results, in all four sample categories (Appendix 3).
4.4. Analysis of Xcc CT: Comparative test results for reproducibility Raw data of all seven laboratories are given in a separate file, and the summary of results is presented in Appendix 4. Laboratories did set their own thresholds internally.
4.4.1. Taqman PCR Analysis of qualitative results from Taqman PCR for each laboratory for all four sub categories was carried out according to the ISO 16140 standard. The results are presented in Tables 12 and 13. All laboratories together obtained 98.94% for sensitivity, meaning no false-negatives were obtained. All laboratories combined also obtained 99.61% for specificity and 99.27% on accuracy.

OGM18-07 ISTA Method Validation Reports Page 129/164 Approved ECOM Decision 18025
Table 12 - Results of TaqMan PCR per (total amount of preselection isolates tested/positive reaction in accordance to preselection). *Missing value.
Lab code Xcc isolates Xcr isolates Look-alike isolates Other xanthomonads
1 20/19 10/11 18/17* 12/12 2 20/20 10/9 18/19 12/12 3 20/20 10/10 18/18 12/12 4 20/20 10/10 18/18 12/12 5 20/20 10/10 18/18 12/12 6 20/20 10/11 18/17 12/12 7 20/20 10/10 18/18 12/12 The sensitivity, specificity and accuracy of the Taqman assay for the Xcc, Xcr, look-alike and other Xanthomonad bacteria isolates were calculated according to the formulas described in ISO 16140. The observed variation was within the allowed range (Table 13). Table 13 - Performance criteria Taqman PCR per category (N.A.: Not Applicable). Category sensitivity specificity accuracy Xcc isolates 99.29% N.A. 99.29% Xcr isolates 98.59% N.A. 98.59% Look-alike isolates N.A. 99.21% 99.21% Other xanthomonads N.A. 100.00% 100.00% Total 98.94% 99.61% 99.27% Accordance and concordance was calculated by target and non-target separately and combined. The result was above 98% for both accordance and concordance which means repeatability and reproducibility were much higher than the 95%.
Figure 1a- Target calculation existing of Xanthomonas campestris campestris and raphani isolates

OGM18-07 ISTA Method Validation Reports Page 130/164 Approved ECOM Decision 18025
Figure 1b - Non target calculation for look a likes and Xanthomonas isolates
Figure 1c - Accordance and concordance calculation of all target and non-target isolates tested in the CT combined. Discussion and Conclusion Five out of the seven labs obtained results for the Internal control (IC) assay Wu that were not in accordance with the scoring acceptance criteria described in the test plan . To determine if a sample is properly prepared the Ct-value of the Wu in Xcc/Xcr negative samples should be at least 3.3 Ct values lower than the NTC. In other words, the sample needs to contain 10 × more microbial DNA than present in the NTC. However, aside from the IC data, all seven labs performed according to expectations. Lab 1 had three deviants, and lab 2 and 5 showed to have one deviation from the original shared samples. An explanation as to the discrepancy in the obtained IC results regarding the described rule can be proposed. All genomic DNA samples shared with the participants were of a concentration of 10 pg/µl, which is a concentration nearly equal to the concentration of residual eukaryotic DNA (originating from the Taq polymerase) present in some PCR master mixes. The Wu assay reacts to all 16S DNA present (independently of its origin), thus to ensure representative results, a 10 × concentration difference to the NTC rule was included in the test plan. Under standard laboratory conditions, suspect bacterial colonies found with dilution plating are boiled directly prior to performing the suspect DNA identification PCR. Boiled colonies

OGM18-07 ISTA Method Validation Reports Page 131/164 Approved ECOM Decision 18025
give an estimated concentration of 0.5 ng/µL of DNA. Due to import restrictions on live bacteria in some countries, it was decided to use genomic DNA for this comparative test. Although the results for the IC in this test on the genomic samples are not as expected, there is no doubt in the success of the IC-assay as laboratories the labs showed when they performed the Taqman PCR assays on participants in house boiled Xcc/Xcr colony material and all showed to be able to detect Xcc and Xcr properly (Appendix 4).
4.4.2. Taqman-PCR vs Conventional PCR A pre-trial for this comparative test was organized in February 2017 to demonstrate that each participating laboratory could perform the protocols included in the test plan. Difficulties were experienced in running one of the conventional (gel-based) protocols as described in ISTA method 7-019a. After evaluation of the results, it was decided that the only the test organizers would perform the conventional PCR in addition to the Taqman PCR, in order to compare results of both tests. PCR option 1 from ISTA method 7-019a was used on the same sample set used for the Taqman PCR of the test organizer. The results for the Taqman PCR and the conventional PCR are shown in Table 14 (data in Appendix 5). Table 14 - Qualitative results Taqman and conventional PCR per category (N.A.: Not Applicable) (total amount of preselection isolates tested/positive reaction in accordance to preselection). Sensitivity Specificity Accuracy
Category Taqman PCR
Conventional PCR
TaqMan
Conv. PCR
TaqMan
Conv. PCR
TaqMan
Conv. PCR
Xcc isolates 20/20 20/20 100% 100% N.A. N.A. 100% 100% Xcr isolates 10/10 9/10 100% 91% N.A. N.A. 100% 91% Look-alike isolates 18/18 17/18 N.A. N.A. 100% 91% 100% 91%
Other Xanthomonads 12/12 12/12 N.A. N.A. 100% 100% 100% 100%
Inconclusive 0 2 Total 100% 95.5% 100% 95.5% 100% 95.5%
Conclusion Comparison of the results from the Taqman PCR and the conventional PCR showed that the Taqman PCR gave the expected results, whereas the conventional PCR had one sample that scored as a false negative. This sample should have been retested with conventional PCR as no bands were observed on the gel. 5. CONCLUSIONS The TaqMan PCR assay for confirmation of suspect Xcc/Xcr colonies demonstrated the necessary sensitivity, specificity, accuracy, and robustness to satisfy its intended purpose. When evaluating the sensitivity, specificity and accuracy of the TaqMan PCR for the 60 samples tested in this comparative test, all criteria scored well above the general acceptance rule of >80% (Grimault et al., 2012).
With the explanation of the concentration difference used for this comparative test compared to the practice of using boiled suspect bacteria DNA as input for the PCR instead of genomic DNA, there is no doubt that the internal (amplification) control will function as expected. This was proven by the results of all laboratories showing expected results for Xcc/ Xcr (PPCs) when testing a boiled bacterial isolate from participants in-house collection directly picked from a semi-selective media plate.

OGM18-07 ISTA Method Validation Reports Page 132/164 Approved ECOM Decision 18025
Comparison of the results of conventional PCR option 1 (ISTA method 7-019a) with Taqman PCR on the same sample set showed that the Taqman PCR has comparable performance to the conventional PCR option (ISTA method 7-019a V5.0). Results of the CT assessment indicate that the Taqman PCR method can be included as a third PCR option next to the other two conventional PCR options already present in the ISTA protocol 7-019a. The proposed assay is suitable for implementation under the provisions of monitoring during routine use and accumulation of supporting validation data.
Acknowledgements The author wishes to thank all the colleagues in the laboratories of Monsanto Holland B.V. and the other laboratories within the ISHI-Veg project involved in the developmental of the testing options. In particular the author wishes to thank Camille Ponzio (ISF). 6. REFERENCES AFNOR 2003. Standard NF EN ISO 16140 Microbiology of food and animal feeding stuffs -
Protocol for the validation of alternative methods. https://www.iso.org/obp/ui/#iso:std:iso:16140:ed-1:v1:en.
Bustin SA, Benes V, Garson JA, Hellemans J, Huggett J, Kubista M, Mueller R, Nolan T, Pfaffl MW, Shipley GL, Vandesompele J, Wittwer CT. 2009. The MIQE guidelines: minimum information for publication of quantitative real-time PCR experiments. Clinical Chemistry 55(4):611-22. https://www.ncbi.nlm.nih.gov/pubmed/19246619.
Langton SD, Chevennement R, Nagelkerke N and Lombard B 2002. Analysing collaborative trials for qualitative microbiological methods: accordance and concordance. International Journal of Food Microbiology 79: 175-181.
ISTA 2013. ISTA TCOM-TG-02 Guidelines for organizing and analysing results of Proficiency tests (PT) and interlaboratory tests for validation of methods (CT). ISTA website: https://www.seedtest.org/en/documents-_content---1--1177.html [last accessed 15 July 2016]
Köhl J, Vlaswinkel M, Groenenboom-de Haas BH, Kastelein P, van Hoof RA, van der Wolf J M and Krijger M. 2011. Survival of pathogens of Brussels sprouts (Brassica oleracea Gemmifera Group) in crop residues. Plant Pathol., 60, 661–670.
Berg T, Tesoriero L, and Hailstones D L. 2005. PCR-based detection of Xanthomonas campestris pathovars in Brassica seed. Plant Pathol., 54, 416–427.
Berg T, Tesoriero L, and Hailstones DL. 2006. A multiplex real-time PCR assay for detection of Xanthomonas campestris from brassicas. Letters Appl. Microbiol., 42, 624–630.
Grimault V, Andro C, and Politikou A. 2012. PCR as a new identification method of Xanthomonas campestris pv. campestris on Brassica spp. seed. In: Method Validation Reports on Rules Proposals for the International Rules for Seed Testing 2013 Edition, International Seed Testing Association. Bassersdorf, Switzerland, 2–11.
Rijlaarsdam, A., Woudt, B., Simons, G., Koenraadt, H., Oosterhof, J., Asma, M., Buddiger, P., Roorda, P., Grimault, V. and de Koning, J. 2004. Development of specific primer for the molecular detection of Xanthomonas campestris pv. campestris. EPPO Conference on Quality of Diagnosis and New Diagnostic Methods for Plant Pests. Noordwijkerhout, NL, 04-09, 22.

OGM18-07 ISTA Method Validation Reports Page 133/164 Approved ECOM Decision 18025
Wu, Y.D., Chen, L.H., Wu, X.J., Shang, S.H., Lou, J.T., Du, L.Z. and Zheng, Y.Z. 2008. Gram-strain specific-based real-time PCR for diagnosis of bacterial neonatal sepsis. Journal of Clinical Microbiology 46(8), 2316-2319.

OGM18-07 ISTA Method Validation Reports Page 134/164 Approved ECOM Decision 18025
Appendix 1
Raw Data
i. TaqMan PCR Optimization Data
Berg-Wu Duplex (Xcc)
Berg 500mM/ WU 100mM Berg 500mM/ WU 200mM Berg 500mM/ WU 500mM [DNA] Berg WU Berg WU Berg WU 10 ng 12.52 12.84 17.17 14.89 UD 16.7 10 ng 12.65 12.74 16.93 14.77 UD 16.75 10 ng 12.83 12.90 17.21 14.88 UD 16.76
Mean Ct 12.67 12.83 17.10 14.85 UD 16.74 Ct ơ 0.156 0.081 0.151 0.067 UD 0.032 1 ng 16.25 16.36 21.01 18.41 UD 20.01 1 ng 16.57 16.49 20.83 18.39 UD 20.1 1 ng 16.12 16.31 20.77 18.32 UD 20.17
Mean Ct 16.31 16.39 20.87 18.373 UD 20.093 Ct ơ 0.232 0.093 0.125 0.047 UD 0.08
100 pg 19.80 19.80 24.64 21.96 UD 23.48 100 pg 19.92 19.97 24.36 21.69 UD 23.86 100 pg 19.54 20.02 24.75 21.79 UD 23.63
Mean Ct 19.75 19.93 24.583 21.813 UD 23.657 Ct ơ 0.194 0.115 0.201 0.137 UD 0.191 10 pg 23.04 23.40 28.23 25.17 UD 26.76 10 pg 23.26 23.44 UD 25.27 UD 27.09 10 pg 23.62 23.58 UD 25.12 UD 26.8
Mean Ct 23.31 23.47 28.23 25.187 UD 26.883 Ct ơ 0.293 0.095 UD 0.076 UD 0.18 1 pg 26.71 26.90 31.62 28.64 UD 30.17 1 pg 26.89 26.83 UD 28.49 UD 30.27 1 pg 27.23 27.49 UD 28.3 UD 30.19
Mean Ct 26.94 27.07 31.62 28.477 UD 30.21 Ct ơ 0.264 0.363 UD 0.17 UD 0.053
100 fg 29.71 29.93 UD 30.99 UD 32.77 100 fg 30.09 29.90 UD 31.02 UD 33.2 100 fg 30.38 30.47 UD 31.07 UD 33.03
Mean Ct 30.06 29.56 UD 31.027 UD 33 Ct ơ 0.336 0.362 UD 0.04 UD 0.217 10 fg 30.91 30.74 UD 32.55 UD 33.96 10 fg 31.18 30.98 UD 32.35 UD 33.99 10 fg 30.30 30.15 UD 31.82 UD 34.04
Mean Ct 30.80 30.62 UD 32.24 UD 33.997 Ct ơ 0.451 0.427 UD 0.377 UD 0.04

OGM18-07 ISTA Method Validation Reports Page 135/164 Approved ECOM Decision 18025
Köhl-Wu Duplex (Xcc)
Köhl 500mM/ WU 100mM Köhl 500mM/ WU 200mM Köhl 500mM/ WU 500mM [DNA] Köhl WU Köhl WU Köhl WU 10 ng 13.86 14.06 16.23 15.55 UD 16.55 10 ng 13.54 13.83 16.22 15.45 UD 16.57 10 ng 13.4 13.74 16.33 15.49 UD 16.64
Mean Ct 13.60 13.88 16.26 15.50 UD 16.59 Ct ơ 0.236 0.165 0.061 0.05 UD 0.047 1 ng 17.11 17.36 19.88 18.99 UD 19.96 1 ng 16.9 17.18 19.9 18.98 UD 19.99 1 ng 17.25 17.43 19.88 18.85 UD 20.03
Mean Ct 17.09 17.32 19.89 18.94 UD 19.99 Ct ơ 0.176 0.129 0.012 0.078 UD 0.035
100 pg 20.38 20.69 23.52 22.34 UD 23.19 100 pg 20.53 20.76 23.36 22.15 UD 23.35 100 pg 20.73 20.85 23.47 22.37 UD 23.29
Mean Ct 20.55 20.77 23.45 22.29 UD 23.28 Ct ơ 0.176 0.08 0.082 0.119 UD 0.081 10 pg 24.1 24.16 26.99 25.54 UD 26.52 10 pg 24.21 24.25 27 25.69 UD 26.86 10 pg 24.13 24.18 27.13 25.65 UD 26.54
Mean Ct 24.15 24.20 27.04 25.63 UD 26.64 Ct ơ 0.057 0.047 0.078 0.078 UD 0.191 1 pg 27.53 27.57 30.29 29.45 UD 30.15 1 pg 27.88 27.89 30.2 29.23 UD 29.97 1 pg 28.02 28.07 30.43 29.24 UD 30.21
Mean Ct 27.81 27.84 30.31 29.31 UD 30.11 Ct ơ 0.252 0.253 0.116 0.124 UD 0.125
100 fg 30.98 30.84 32.97 32.76 UD 33.01 100 fg 30.78 31.39 33.74 32.29 UD 33.92 100 fg 31.06 30.99 33.36 32.46 UD 33.12
Mean Ct 30.94 31.07 33.36 32.50 UD 33.35 Ct ơ 0.144 0.284 0.385 0.238 UD 0.497 10 fg 32.89 32.68 36.21 35.9 UD 38.22 10 fg 33.22 33.22 35.08 35.41 UD 35.71 10 fg 33.82 33.8 36.7 35.49 UD 35.7
Mean Ct 32.98 32.90 36.00 35.60 UD 36.54 Ct ơ 0.804 0.813 0.831 0.263 UD 1.452

OGM18-07 ISTA Method Validation Reports Page 136/164 Approved ECOM Decision 18025
Berg-Wu Duplex (Xcr)
Berg 500mM/ WU 100mM [DNA] Berg WU 10 ng 12.900 12.870 10 ng 12.370 12.190 10 ng 12.570 12.480 Mean Ct 12.613 12.513 Ct ơ 0.268 0.341 1 ng 16.120 15.670 1 ng 16.570 16.250 1 ng 16.380 16.200 Mean Ct 16.357 16.040 Ct ơ 0.226 0.321 100 pg 20.260 20.100 100 pg 20.320 19.990 100 pg 19.960 19.620 Mean Ct 20.180 19.903 Ct ơ 0.193 0.251 10 pg 23.950 23.360 10 pg 23.780 23.420 10 pg 23.840 23.530 Mean Ct 23.857 23.437 Ct ơ 0.086 0.086 1 pg 27.420 27.010 1 pg 27.490 27.180 1 pg 27.280 26.820 Mean Ct 27.397 27.003 Ct ơ 0.107 0.180 100 fg 29.880 29.520 100 fg 30.310 29.840 100 fg 29.980 29.470 Mean Ct 30.057 29.610 Ct ơ 0.225 0.201 10 fg 30.260 29.920 10 fg 30.980 30.690 10 fg 31.000 30.580 Mean Ct 30.747 30.397 Ct ơ 0.422 0.416

OGM18-07 ISTA Method Validation Reports Page 137/164 Approved ECOM Decision 18025
ii. Total Assay Optimization Data
Berg/WU Duplex (Xcc) Köhl/WU Duplex(Xcc) Berg/WU Duplex (Xcr) Run 1 Run 2 Run 1 Run 2 Run 1 Run 2
Dilution Berg WU Berg WU Köhl WU Köhl WU Berg WU Berg WU
OD600=0.100 14.05 13.9 13.98 13.5 16.11 16.43 16.24 15.89 14.49 14.52 15.04 14.86 14.25 13.97 14.18 13.83 15.93 16.32 16.15 15.91 13.81 13.88 14.75 14.4 14.32 14.11 14.41 14.1 16.11 16.38 16.04 15.79 14.37 14.9 14.93 14.68
Mean Ct 14.21 13.99 14.19 13.81 16.05 16.38 16.14 15.86 14.557 14.433 14.907 14.647 Ct ơ 0.14 0.107 0.215 0.3 0.104 0.055 0.100 0.064 0.782 0.515 0.146 0.232
10-1 17.89 17.62 17.46 17.42 19.69 19.35 19.35 19.54 17.83 18.63 18.16 17.78 17.85 17.69 17.64 17.44 19.54 19.47 19.14 19.44 17.84 17.72 18.37 18.11 17.73 17.64 17.81 17.24 19.58 19.38 19.89 19.31 18.47 18.75 18.5 18.09
Mean Ct 17.82 17.65 17.64 17.37 19.60 19.40 19.46 19.43 18.05 18.37 18.34 17.99 Ct ơ 0.083 0.036 0.175 0.110 0.078 0.062 0.387 0.115 0.367 0.563 0.172 0.185
10-2 21.33 21.04 21.24 20.84 23.11 22.82 23.01 23.06 22.91 21.98 22.32 22 21.5 21.14 21.28 21.14 23.19 22.86 22.92 22.94 22.04 21.76 22.16 21.87 21.41 21.06 21.12 20.96 23.25 23 22.74 22.91 23.41 22.54 21.99 21.61
Mean Ct 21.41 21.08 21.21 20.98 23.18 22.89 22.89 22.97 22.79 22.09 22.16 21.83 Ct ơ 0.085 0.053 0.083 0.151 0.070 0.095 0.137 0.079 0.693 0.402 0.165 0.199
10-3 24.43 24.12 24.21 24.22 26.54 26.47 26.41 26.45 26.12 24.81 25.55 25.08 24.51 24.4 24.52 23.85 26.48 26.32 26.64 26.23 25.5 25.16 25.62 25.21 24.6 24.17 23.96 24.35 26.3 26.21 26.32 26.05 26.76 25.83 26.1 25.65
Mean Ct 24.51 24.23 24.23 24.14 26.44 26.33 26.46 26.24 26.13 25.27 25.76 25.31 Ct ơ 0.085 0.149 0.281 0.259 0.125 0.131 0.165 0.200 0.630 0.518 0.299 0.299
10-4 28.12 27.62 27.51 27.61 30.07 29.83 29.42 30 29.93 28.37 28.7 28.29 28.13 27.58 28.07 27.01 29.89 29.75 29.51 29.19 29.8 29.21 28.92 28.46 28.23 27.75 27.61 26.84 29.74 29.65 29.53 28.99 29.83 29.2 29.3 28.91
Mean Ct 28.16 27.65 27.73 27.15 29.90 29.74 29.49 29.39 29.85 28.93 28.97 28.55 Ct ơ 0.061 0.089 0.299 0.405 0.165 0.090 0.059 0.535 0.068 0.482 0.304 0.320
10-5 31.37 31.13 30.64 31.14 33.65 33.75 33.01 32.99 31.96 30.73 30.84 30.34 31.54 31.27 32.05 30.5 32.06 32.19 33.36 32.75 31.68 31.05 31.55 30.97 31.91 31.47 31.36 29.85 33.24 33.37 32.71 32.2 32.41 31.38 31.39 30.82
Mean Ct 31.61 31.29 31.35 30.50 32.98 33.10 33.03 32.65 32.02 31.05 31.26 30.71 Ct ơ 0.276 0.171 0.705 0.645 0.825 0.813 0.325 0.405 0.368 0.325 0.372 0.329
10-6 UD UD 32.56 32 36.95 37.06 34.43 34.05 32.1 31.91 29.48 29.14
33.56 33.08 32.58 32.04 UD UD 35.96 35.62 33.5 32.63 31.35 30.93 34.08 33.61 31.82 31.24 UD UD 36.99 36.69 33.47 32.37 31.47 30.99
Mean Ct 33.82 33.345 32.32 31.76 36.95 37.06 35.793 35.453 33.023 32.303 30.767 30.353 Ct ơ 0.368 0.375 0.433 0.451 - - 1.288 1.328 0.8 0.365 1.116 1.051

OGM18-07 ISTA Method Validation Reports Page 138/164 Approved ECOM Decision 18025
iii. A. Positive Amplification Control Range, OD600=0.100 Berg positive process control Köhl positive process control
Berg CT Wu CT Köhl CT Wu CT 14.03 13.23 14.43 13.87 16.19 16.14 16.83 16.85 13.84 13.51 14.07 13.05 16.21 16.44 16.77 17.08 13.28 13.95 13.68 13.14 16.15 16.64 16.70 16.76 12.85 14.32 13.36 13.49 16.49 16.83 16.87 16.94 13.70 13.34 13.88 13.92 16.07 16.20 16.62 16.68 14.20 13.81 14.24 14.56 16.81 16.57 16.72 17.11 13.44 14.22 13.76 13.24 16.03 16.49 16.94 17.15 13.82 13.39 13.83 14.48 16.40 16.71 16.88 16.71 13.14 13.42 13.38 14.11 16.47 16.90 17.02 16.95 13.47 13.45 13.64 13.47 16.71 16.20 17.16 17.05 13.73 13.53 13.98 13.48 16.68 16.64 17.03 16.98 13.59 13.86 14.14 14.12 16.18 16.75 16.61 16.80 13.68 13.84 14.78 13.63 16.73 16.45 16.95 16.91 13.31 13.68 13.91 14.09 15.99 16.40 16.82 17.04 13.95 13.51 13.63 14.07 16.43 16.64 17.08 16.88 12.91 14.14 13.94 14.05 16.49 16.58 16.96 16.61 13.30 14.14 13.53 13.97 16.89 16.44 16.98 16.64 13.75 14.00 13.46 14.29 16.56 16.21 17.09 16.67 13.46 14.35 13.56 14.41 16.58 16.19 16.92 16.99 13.85 13.9 13.95 14.32 16.81 16.33 17.02 16.91
iv. Positive Process Control Range Berg positive process control Köhl positive process control
Berg CT Wu CT Köhl CT Wu CT 24.68 24.30 25.45 25.26 26.03 26.14 27.17 28.06 24.26 24.24 25.16 25.16 25.99 26.02 27.09 27.18 24.30 24.34 25.37 25.40 25.81 26.19 27.84 27.27 24.26 24.04 25.20 25.08 25.85 26.06 26.97 27.20 24.44 24.15 25.30 25.20 26.46 25.94 27.38 27.12 24.15 24.39 25.07 25.36 26.79 25.82 27.52 27.69 24.37 24.28 25.21 25.25 26.70 26.70 27.58 27.37 24.43 24.37 25.45 25.30 25.87 25.70 27.73 27.58 24.37 24.23 25.31 25.25 26.05 25.86 27.41 27.26 24.01 24.22 25.03 25.20 25.94 26.17 27.66 27.30 23.82 24.43 24.86 25.33 26.34 25.82 27.02 27.55 24.32 24.26 25.27 25.27 26.01 25.44 27.05 27.39 24.54 24.45 25.41 25.35 25.96 25.94 27.22 27.34 24.19 24.15 25.15 25.15 26.07 26.52 27.96 27.41 24.16 24.32 25.14 25.21 26.65 26.57 27.01 27.58 24.31 24.28 25.32 25.44 26.72 25.84 26.87 26.86 24.30 24.56 25.20 25.51 26.02 25.98 27.27 28.07 24.26 24.43 25.32 25.47 26.03 26.75 28.06 28.09 24.12 24.24 25.16 25.22 26.05 26.74 27.63 26.86 23.78 24.12 24.87 25.18 26.43 26.05 26.83 27.71

OGM18-07 ISTA Method Validation Reports Page 139/164 Approved ECOM Decision 18025
v. Genomic DNA Standard Curve Berg-Wu DUPLEX Köhl -Wu DUPLEX
Berg CT WU CT Berg CT WU CT Köhl CT
WU CT Köhl CT
WU CT
10 ng 12.39 12.34 1 pg 26.55 26.35 10 ng 13.73 14.55 1 pg 26.93 27.12 12.75 12.8 26.32 26.12 13.69 14.22 27.09 27.34 12.32 12.58 26.74 26.68 13.66 14.04 27.25 27.44 12.37 12.39 27.49 27.34 13.4 14.13 27.47 27.51 12.52 12.34 26.95 26.74 13.61 14.07 27.52 27.57 12.23 12.26 26.51 26.39 13.74 14.12 27.67 27.78 12.62 12.5 26.62 26.41 13.61 14.11 27.35 27.43 10.96 11.05 26.53 26.34 13.81 14.33 27.46 27.57 11.82 11.85 26.62 26.43 13.85 14.27 27.34 27.37 12.45 12.4 26.54 26.3 13.22 13.78 27.17 27.54 12.46 12.42 26.91 26.62 13.2 13.47 27.29 27.35 12.65 12.65 26.74 26.58 13.45 13.92 26.8 27.16
Ct Mean 12.30 12.30
Ct Mean 26.71 26.53
Ct Mean 13.58 14.08
Ct Mean 27.28 27.43
Ct ơ 0.483 0.457 Ct ơ 0.302 0.311 Ct ơ 0.217 0.275 Ct ơ 0.250 0.183 1 ng 16.03 16.06 100fg 29.81 29.93 1 ng 16.75 16.89 100 fg 30.68 30.94
15.89 15.8 29.77 29.59 16.66 17.28 30.78 31.03 16 16.09 29.82 29.78 16.78 16.98 31 31.22
16.09 16.06 29.51 29.53 16.83 17.38 30.6 30.69 16.1 16.03 29.86 29.74 17 17.42 30.88 30.99 15.99 15.79 29.75 29.85 16.73 17.32 31.91 31.96 15.91 15.82 29.99 29.72 16.95 16.93 30.6 30.83 16.1 16.13 29.82 29.75 16.89 16.92 30.25 30.41 15.48 15.57 29.63 29.28 16.57 16.82 30.66 30.96 15.9 15.92 29.93 29.8 16.58 16.58 30.33 30.5 15.94 16.13 30.1 29.84 16.72 17.26 31.36 31.46 16.08 16.16 29.31 29.64 17.02 17.43 30.58 30.85
Ct Mean 15.96 15.96
Ct Mean 29.78 29.70
Ct Mean 16.79 17.10
Ct Mean 30.80 30.99
Ct ơ 0.170 0.183 Ct ơ 0.212 0.175 Ct ơ 0.152 0.280 Ct ơ 0.455 0.419 100 pg 19.93 19.95 10 fg 30.96 30.88 100 pg 20.03 20.55 10 fg 34.92 35.26
19.36 19.3 30.25 30.07 20.2 20.62 34.34 34.64 19.57 19.6 30.39 30.24 20.44 20.6 34.53 34.75 19.68 19.61 30.63 30.32 20.4 20.62 34.16 34.18 19.38 19.5 30.66 30.41 20.49 20.79 34.32 34.54 20.09 20.02 30.23 30.99 20.38 20.62 36.75 36.98 19.36 19.6 30.15 30.94 20.63 20.81 35.45 35.79 19.54 19.6 30.77 30.48 20.65 21.05 36.3 36.42 19.77 19.82 30.43 30.22 20.07 20.59 34.36 34.52 19.56 19.49 30.9 30.69 20.28 20.54 34.53 34.62 19.47 19.57 30.72 30.43 20.38 20.46 36.02 36.21 19.56 19.65 30.89 30.75 19.96 20.38 34.48 34.65
Ct Mean 19.61 19.64
Ct Mean 30.58 30.54
Ct Mean 20.33 20.64
Ct Mean 35.01 35.21
Ct ơ 0.228 0.200 Ct ơ 0.283 0.307 Ct ơ 0.224 0.177 Ct ơ 0.891 0.911 10 pg 23.01 22.83 10 pg 23.68 24
23.03 22.78 23.79 24.1 23.05 22.91 23.96 24.22 23.28 23.16 23.77 24.03 23.14 22.94 23.83 24.22 23.11 22.93 24.17 24.26 23.2 22.97 23.87 24.07 23.18 23.14 24.2 24.51 23.17 22.99 23.84 24.06 23.18 22.97 23.71 24.13 23.07 22.89 24 24.26 23.14 23.05 23.51 23.88
Ct Mean 23.13 22.96
Ct Mean 23.86 24.15
Ct ơ 0.079 0.113 Ct ơ 0.198 0.163

OGM18-07 ISTA Method Validation Reports Page 140/164 Approved ECOM Decision 18025
vi. qPCR Inclusivity
Wu Coverage of Bacterial DNA isolates other than Xcc/Xcr (n=85)
Berg Köhl Berg Köhl Berg Köhl
Sample Name Wu Ct Wu Ct Sample Name Wu Ct Wu Ct Sample Name Wu Ct Wu Ct
BX02 16.26 17.34 BX37 15.82 16.48 BX76 17.55 18.67
BX03 12.89 14.02 BX38 18.47 18.55 BX77 29.34 31.71
BX04 23.56 25.09 BX39 13.70 14.82 BX78 32.72 34.08
BX05 21.22 22.31 BX40 12.48 13.85 BX79 26.63 27.50
BX06 29.49 30.57 BX41 17.89 18.26 BX80 25.37 25.29
BX07 23.59 25.01 BX42 19.54 21.28 BX81 34.11 34.59
BX08 21.62 21.99 BX43 17.56 18.71 BX82 17.61 18.52
BX09 19.81 20.73 BX44 11.49 12.36 BX83 11.18 12.09
BX13 14.66 15.97 BX46 17.71 17.63 BX86 15.67 17.22
BX14 16.21 17.35 BX47 21.49 22.57 BX87 24.32 25.97
BX17 23.89 25.24 BX48 22.23 23.47 BX88 22.07 23.68
BX18 20.35 21.75 BX49 19.87 21.06 BX89 16.49 16.66
BX19 32.90 34.72 BX50 14.58 15.39 BX90 18.08 17.52
BX20 29.18 30.85 BX51 17.45 18.66 Sap1 27.98 30.14
BX21 27.31 28.94 BX52 20.45 20.67 Sap2 23.17 26.01
BX22 26.72 27.64 BX53 21.33 21.46 Sap3 21.79 21.79
BX23 25.11 27.03 BX54 32.68 34.01 Sap4 23.88 25.41
BX24 18.11 20.10 BX58 27.37 28.60 Sap5 32.80 33.97
BX25 15.67 16.81 BX59 18.32 18.99 Sap6 30.74 29.97
BX26 12.48 13.67 BX64 14.52 15.64 Sap7 18.89 19.71
BX27 31.58 32.97 BX65 13.27 12.58 Sap8 17.43 17.96
BX28 22.34 24.05 BX66 20.05 21.16 Sap9 20.17 21.05
BX29 26.71 26.44 BX67 22.44 22.57 Sap10 29.08 31.13
BX30 29.08 31.07 BX68 18.93 20.22 Sap11 24.22 25.61
BX31 22.47 24.16 BX69 19.54 19.80 Sap12 23.52 23.98
BX32 20.11 22.19 BX70 28.17 29.39 BX33 17.79 18.63 BX71 25.71 26.37 BX34 16.79 18.12 BX72 19.77 21.82 BX35 14.79 15.60 BX73 12.71 13.86 BX36 10.80 13.71 BX74 19.87 18.11

OGM18-07 ISTA Method Validation Reports Page 141/164 Approved ECOM Decision 18025
vii. Total Assay Inclusivity The results below represent pathogenicity verified non-Xcc/Xcr isolates. The total assay inclusivity experiments were performed before assay optimization, as a critical component of the feasibility study. Due to this context, bacterial cultures assayed were not standardized to a specific optical density; therefore, the CT values below represent the inclusivity of the assay only, but not the accuracy of the assay. Furthermore, Xcc/Xcr suspects rarely arise in routine testing. The isolates below comprise the complete collection of Xcc/Xcr suspects available for inclusivity testing.
Berg-Wu Köhl-Wu Pathogenicity +/- Isolate# Berg Ct Wu Ct Köhl Ct Wu Ct
1 UD 21.44 UD 20.36 - 2 UD 20.82 UD 19.83 - 3 UD 18.62 UD 17.69 - 4 UD 19.77 UD 18.84 - 5 UD 21.13 UD 20.15 - 6 UD 20.52 UD 19.40 - 7 UD 21.20 UD 20.11 - 8 UD 20.63 UD 19.52 - 9 UD 21.06 UD 20.00 -
10 UD 21.16 UD 20.15 - 11 UD 20.36 UD 19.25 - 12 UD 19.92 UD 18.73 - 13 UD 17.58 UD 16.73 - 14 UD 19.94 UD 18.79 - 15 UD 33.95 UD 35.42 - 16 UD 33.13 UD 34.39 - 17 UD 31.74 UD 31.59 - 18 UD 19.94 UD 18.79 - 19 UD 33.95 UD 35.42 - 20 UD 33.13 UD 34.39 - 21 UD 31.74 UD 31.59 - 22 UD 15.05 UD 13.96 - 23 UD 21.35 UD 19.99 - 24 UD 20.44 UD 19.25 - 25 UD 21.30 UD 20.98 - 26 UD 21.76 UD 21.44 - 27 UD 21.83 UD 21.64 - 28 UD 22.78 UD 22.40 - 29 UD 19.28 UD 20.37 - 30 UD 22.88 UD 23.19 -

OGM18-07 ISTA Method Validation Reports Page 142/164 Approved ECOM Decision 18025
viii. Total Assay Bias Berg-WU Various Xcc Isolate Evaluation Xcc Isolate# MVS252 MVS253 MVS254 Berg WU Berg Wu Berg Wu 14.27 14.33 14.55 14.52 14.18 14.17 14.49 14.41 15.03 14.92 14.60 14.55 14.58 14.41 14.95 14.89 14.77 14.76 14.72 14.50 15.00 14.88 14.81 14.63 14.80 14.63 14.82 14.67 14.35 14.23 14.71 14.60 14.71 14.52 14.11 14.01 14.89 14.82 14.63 14.59 14.29 14.24 14.37 14.38 15.01 14.93 14.31 14.24 14.84 14.68 14.98 14.89 14.70 14.57 14.67 14.43 14.87 14.89 14.23 14.15 14.86 14.70 14.84 14.77 14.57 14.46 14.66 14.59 14.83 14.43 14.41 14.25 CT mean 14.66 14.54 14.85 14.74 14.44 14.36 CTơ 0.20 0.15 0.16 0.19 0.24 0.23 Köhl -WU Various Xcc Isolate Evaluation Xcc Isolate# MVS252 MVS253 MVS254 Berg WU Berg Wu Berg Wu 16.18 16.17 16.26 16.26 16.16 16.12 16.41 16.35 16.40 16.43 16.31 16.30 16.03 16.06 16.44 16.40 16.29 16.26 16.49 16.49 16.36 16.33 16.15 16.12 16.36 16.33 16.41 16.36 16.01 15.97 16.38 16.35 16.21 16.27 15.83 15.86 16.33 16.28 16.51 16.49 16.07 16.05 16.38 16.45 16.73 16.64 16.31 16.24 16.35 16.30 16.54 16.50 16.18 16.20 16.52 16.51 16.26 16.36 16.13 16.15 16.70 16.64 16.51 16.54 16.23 16.14 16.29 16.35 16.25 16.26 16.21 16.22 CT mean 16.37 16.36 16.41 16.40 16.16 16.14 CTơ 0.17 0.15 0.15 0.12 0.14 0.13

OGM18-07 ISTA Method Validation Reports Page 143/164 Approved ECOM Decision 18025
ix. Assay Robustness Assay Robustness Berg-Wu Duplex 96 h Isolate Unboiled (OD=0.100) Overloaded (OD=2.0) Berg Ct Wu Ct Berg Ct Wu Ct Berg Ct Wu Ct 16.18 16.17 16.27 16.36 8.87 8.98 16.41 16.35 15.80 15.75 4.57 5.04 16.03 16.06 15.83 16.08 8.07 8.30 16.49 16.49 15.61 15.86 8.09 8.42 16.36 16.33 16.38 16.29 8.28 8.56 16.38 16.35 16.33 16.38 8.34 8.59 16.33 16.28 16.18 16.17 7.96 8.40 16.38 16.45 16.41 16.35 8.02 8.28 16.35 16.30 16.03 16.06 8.54 8.92 16.52 16.51 16.49 16.49 7.41 7.74 16.70 16.64 16.36 16.33 8.84 9.01 16.29 16.35 16.38 16.35 8.97 9.00 16.26 16.26 16.33 16.28 7.67 4.67 16.40 16.43 16.38 16.45 4.25 8.15 16.44 16.40 16.35 16.30 8.43 8.91 16.36 16.33 16.52 16.51 8.03 8.35 16.41 16.36 16.70 16.64 7.85 7.95 16.21 16.27 16.29 16.35 8.97 9.03 16.51 16.49 15.86 16.36 8.27 8.54 16.73 16.64 16.05 15.97 7.79 8.25 16.54 16.50 15.77 16.02 8.78 5.87 16.26 16.36 15.94 16.17 8.46 8.80 16.51 16.54 15.31 15.50 8.79 8.90 16.25 16.26 15.67 15.86 8.99 9.00 Ct Mean 16.39 16.38 16.14 16.20 8.01 8.15 Ct ơ 0.157 0.138 0.343 0.270 1.196 1.211

OGM18-07 ISTA Method Validation Reports Page 144/164 Approved ECOM Decision 18025
Assay Robustness Köhl -Wu Duplex 96 hour Isolate Unboiled (OD=0.100) Overloaded (OD=2.0) Köhl Ct Wu Ct Köhl Ct Wu Ct Köhl Ct Wu Ct 18.39 18.68 18.05 18.43 9.50 9.73 18.06 18.27 18.01 18.38 8.95 9.52 18.26 18.56 18.26 18.69 8.91 9.27 18.36 18.58 18.25 18.52 9.45 9.78 18.28 18.48 18.40 18.74 8.68 9.19 18.27 18.59 18.86 19.25 9.24 9.73 18.11 18.32 17.86 17.76 8.54 9.24 18.38 18.51 18.03 17.91 9.70 9.90 17.89 18.18 18.00 17.89 4.91 8.94 18.18 18.45 17.93 17.75 9.24 9.58 18.50 18.66 17.96 17.61 8.05 8.77 18.33 18.65 17.87 17.43 8.43 9.36 17.87 17.96 18.09 17.67 8.67 9.32 18.40 18.35 18.24 17.91 8.17 8.81 18.43 18.68 18.1 17.78 9.53 9.85 17.21 18.46 17.96 17.73 9.62 9.85 18.98 17.89 18.14 17.83 9.51 9.69 17.93 17.98 17.86 17.81 9.33 9.59 18.35 18.72 18.00 17.76 9.30 9.64 17.99 18.48 18.01 17.74 8.93 9.41 18.60 18.91 18.31 18.75 5.58 9.65 18.58 18.84 17.93 18.14 8.81 9.38 17.87 18.14 18.47 19.24 9.30 9.73 18.19 18.48 17.39 18.14 5.34 9.14 Ct Mean 18.23 18.45 18.08 18.12 8.57 9.46 Ct ơ 0.341 0.271 0.274 0.512 1.352 0.326

OGM18-07 ISTA Method Validation Reports Page 145/164 Approved ECOM Decision 18025
Appendix 2 Composition of the sample set used in CT
Sample nr
Isolate nr
Bacteria species Isolate category
Berg Köhl Wu Gel Pathogenicity*
1 MVS384 - lal+ - - + - 2 MVS381 Xcr + - + + + 3 MVS268 - lal - - + - 4 MVS283 - lal - - + - 5 MVS240 Xcc + + + + + 6 MVS50 X. melonis neg - - + - 7 wk44-1 Xcc + + + + + 8 MVS343 Xcr + - + + + 9 MVS220 Xcr + - + + +
10 MVS335 - lal - - + - 11 MVS264 Xcc + + + + + 12 MVS352 Xcc + + + + + 13 MVS199 X. fuscans neg - - + - 14 MVS338 Xcc + + + + + 15 MVS248 Xcc + + + + + 16 MVS255 Xcc + + + + + 17 MVS82 X. perforans neg - - + - 18 MVS382 Xcr + - + + + 19 MVS363 Xcr + - + + + 20 MVS278 Xcc + + + + + 21 MVS344 Xcc + + + + + 22 MVS49 X. cucurbitae neg - - + - 23 MVS262 Xcc + + + + + 24 MVS362 Xcr + - + + + 25 MVS334 Xcc + + + + + 26 MVS33 Xcr + + + + 27 MVS415 - lal - - + - 28 MVS270 Xcc + + + + + 29 MVS361 Xcr + - + + + 30 MVS333 - lal - - + - 31 MVS258 Xcr + - + + + 32 MVS52 X. vesicatoria neg - - + - 33 MVS189 X. pelargonii neg - - + - 34 MVS391 - lal - - + - 35 MVS56 X. euvesicatoria neg - - + - 36 MVS274 Xcc + + + + + 37 MVS260 Xcc + + + + + 38 MVS272 Xcc + + + + + 39 MVS252 Xcc + + + + + 40 MVS386 - lal - - + - 41 wk41-2 - lal - - + - 42 MVS387 - lal - - + - 43 MVS385 - lal - - + -
Sample nr
Isolate nr
Bacteria species Isolate category
Berg Köhl Wu Gel Pathogenicity*
44 MVS51 X. cucurbitae neg - - + - 45 MVS169 X. gardneri neg - - + -

OGM18-07 ISTA Method Validation Reports Page 146/164 Approved ECOM Decision 18025
46 wk12 lal - - + - 47 MVS198 X. phaseoli neg - - + - 48 MVS247 Xcc + + + + + 49 MVS394 - lal - - + - 50 MVS390 - lal - - + - 51 MVS350 X. vitians neg - - + - 52 MVS282 - lal - - + - 53 MVS392 - lal - - + - 54 MVS250 Xcc + + + + + 55 MVS383 - lal - - + - 56 MVS364 Xcr + - + - 57 wk2-1 - lal - - + - 58 MVS266 Xcc + + + + + 59 MVS245 Xcc + + + + + 60 MVS223 X. hortorum neg - - + -
*Pathogenicity performed in multiple runs to construct organizers inhouse isolate database, not repeated within this test. PCR negative were not tested by a pathogenicity assay.
+ The LAL (Look A Like) resembles the target organism on the basis of morphology on (semi-selective) growth media and genetic features. An example of a LAL is the use of a different subspecies or pathovar of the target organism.

OGM18-07 ISTA Method Validation Reports Page 147/164 Approved ECOM Decision 18025
Appendix 3 Stability test
Sample nr.
Expected results
9/5/2017 (date prior to shipment) 16/6/2017 (date equal to participant perfroming the CT) TaqMan PCR TaqMan PCR
Berg Köhl Wu results Berg Köhl Wu results 1 neg ND 36.36 31.22 neg 36.23 35.33 29.19 neg 2 Xcr pos 26.91 ND 29.59 Xcr pos 28.67 35.44 29.13 Xcr pos 3 neg ND ND 33.41 neg 35.83 35.55 34.12 neg 4 Xcc pos 27.60 26,75 31.71 Xcc pos 29.73 29.71 32.46 Xcc pos 5 Xcr pos 28.11 37,23 28.92 Xcr pos 29.80 32.80 28.88 Xcr pos 6 Xcr pos 26.80 ND 28.72 Xcr pos 27.89 34.76 28.88 Xcr pos 7 Xcr pos 23.29 36.60 28.53 Xcr pos 28.03 35.34 28.72 Xcr pos 8 neg ND 36.32 30.23 neg 34.79 35.52 30.59 neg 9 Xcc pos 27.00 25.89 27.84 Xcc pos 27.07 27.09 28.49 Xcc pos 10 Xcc pos 28.12 27.15 29.97 Xcc pos 28.96 28.83 29.87 Xcc pos 11 neg ND ND 27.06 neg 36.00 36.66 26.86 neg 12 Xcc pos 27.51 26.36 29.03 Xcc pos 28.92 28.89 29.16 Xcc pos 13 Xcc pos 27.50 26.90 28.54 Xcc pos 28.48 28.42 29.01 Xcc pos 14 Xcc pos 28.09 27.27 30.20 Xcc pos 29.49 29.45 29.97 Xcc pos 15 neg ND 35.25 28.68 neg 35.57 36.23 27.99 neg 16 Xcr pos 27.33 33.76 28.15 Xcr pos 27.97 33.19 29.10 Xcr pos 17 Xcr pos 26.80 ND 28.77 Xcr pos 27.83 35.38 29.33 Xcr pos 18 Xcc pos 27.45 26.43 32.39 Xcc pos 31.41 30.98 31.34 Xcc pos 19 Xcc pos 28.21 27.13 29.28 Xcc pos 28.91 28.87 29.59 Xcc pos 20 neg ND ND 28.99 neg 35.95 35.77 28.98 neg 21 Xcc pos 26.26 25.45 28.88 Xcc pos 28.58 28.50 28.63 Xcc pos 22 Xcc pos 28.23 27.29 28.64 Xcc pos 28.18 28.06 28.38 Xcc pos 23 Xcr pos 26.76 35.89 30.21 Xcr pos 29.62 35.35 31.52 Xcr pos 24 neg ND 36.76 30.11 neg 35.29 35.17 31.49 neg 25 Xcr pos 28.96 ND 28.89 Xcr pos 28.16 34.30 29.11 Xcr pos 26 neg ND ND 32.85 neg 35.04 34.62 32.75 neg 27 Xcr pos 27.62 37.51 28.59 Xcr pos 27.82 34.65 29.53 Xcr pos 28 neg ND 37.49 27.91 neg 34.17 34.11 28.96 neg 29 neg ND 36.49 29.57 neg 36.19 35.38 29.84 neg 30 neg ND 35.97 28.37 neg 34.86 35.32 29.12 neg 31 neg ND 36.18 30.17 neg 36.36 35.55 30.69 neg 32 Xcc pos 28.81 27.64 28.94 Xcc pos 28.76 28.58 29.08 Xcc pos 33 Xcc pos 28.48 27.45 28.55 Xcc pos 27.85 27.66 28.46 Xcc pos 34 neg ND ND 29.71 neg 35.22 34.22 29.12 neg 35 neg ND 35.66 29.20 neg 35.59 34.96 29.59 neg 36 neg ND 37.95 25.25 neg 35.63 34.40 25.47 neg 37 neg ND 36.36 28.66 neg 36.12 34.33 28.46 neg 38 Xcc pos 28.52 27.61 28.73 Xcc pos 28.56 28.73 29.89 Xcc pos 39 Xcr pos 28.28 36.52 30.46 Xcr pos 30.67 33.58 31.13 Xcr pos 40 neg ND 37.80 29.89 neg 35.98 35.03 31.41 neg 41 neg 39.06 36.18 27.06 neg 35.61 33.62 27.60 neg 42 Xcc pos 29.16 28.17 28.48 Xcc pos 28.38 28.40 29.08 Xcc pos 43 neg ND 36.68 30.43 neg 35.45 30.60 30.56 neg 44 Xcc pos 26.91 25.79 26.90 Xcc pos 26.93 26.74 26.62 Xcc pos 45 Xcc pos 27.66 29.15 31.59 Xcc pos 30.13 31.62 31.34 Xcc pos 46 Xcc pos 29.16 28.29 28.78 Xcc pos 28.54 28.28 29.07 Xcc pos 47 Xcc pos 27.18 26.14 32.95 Xcc pos 35.00 33.00 33.59 Xcc pos 48 neg ND 38.12 29.03 neg 36.39 29.96 28.69 neg 49 neg 39.23 38.64 32.22 neg 35.39 30.26 30.56 neg 50 neg ND 36.70 28.82 neg 32.02 28.92 27.68 neg 51 Xcc pos 28.41 27.94 27.88 Xcc pos 27.45 27.03 27.45 Xcc pos 52 neg ND ND 22.02 neg 34.93 30.94 27.12 neg 53 Xcc pos 27.94 27.02 27.92 Xcc pos 27.86 27.53 27,68 Xcc pos 54 Xcc pos 28.52 27.33 28.18 Xcc pos 27.96 27.51 27.85 Xcc pos 55 neg ND 35.39 28.32 neg 35.57 30.36 29.00 neg 56 neg 38.30 33.61 30.66 neg 35.35 32.53 30.98 neg 57 neg ND 35.37 30.70 neg 36.78 30.16 30.63 neg 58 Xcc pos ND 38.41 28.16 Xcc pos + + + Xcc pos 59 Xcc pos ND ND 28.61 Xcc pos + + + Xcc pos 60 neg 36.03 34.95 29.34 Neg - - + neg

OGM18-07 ISTA Method Validation Reports Page 148/164 Approved ECOM Decision 18025
Appendix 4 CT results: Taqman PCR
Summary Lab1 Lab2 Lab3 Lab4 Lab5 Lab6 Lab7 Conclusion Conclusion Conclusion Conclusion Conclusion Conclusion Conclusion 1 Neg neg neg neg neg neg neg 2 Xcr xcr xcr xcr xcr xcr xcr 3 Neg neg neg neg neg neg neg 4 Neg neg neg neg neg neg neg 5 Xcc xcc xcc xcc xcc xcc xcc 6 neg neg neg neg neg neg neg 7 Xcc xcc xcc xcc xcc xcc xcc 8 Xcr neg xcr xcr xcr xcr xcr 9 Xcr xcr xcr xcr xcr xcr xcr 10 Neg neg neg neg neg neg neg 11 Xcc xcc xcc xcc xcc xcc xcc 12 Xcc xcc xcc xcc xcc xcc xcc 13 Neg neg neg neg neg neg neg 14 Xcc xcc xcc xcc xcc xcc xcc 15 Xcc xcc xcc xcc xcc xcc xcc 16 Xcc xcc xcc xcc xcc xcc xcc 17 Neg neg neg neg neg neg neg 18 Xcr xcr xcr xcr xcr xcr xcr 19 Xcr xcr xcr xcr xcr xcr xcr 20 Xcc xcc xcc xcc xcc xcc xcc 21 Xcc xcc xcc xcc xcc xcc xcc 22 Neg neg neg neg neg neg neg 23 Xcc xcc xcc xcc xcc xcc xcc 24 Xcr xcr xcr xcr xcr xcr xcr 25 Xcc xcc xcc xcc xcc xcc xcc 26 Xcr xcr xcr xcr xcr xcr xcr 27 Neg neg neg neg neg neg neg 28 Xcc xcc xcc xcc xcc xcc xcc 29 Xcr xcr xcr xcr xcr xcr xcr 30 Neg neg neg neg neg neg neg 31 Xcr xcr xcr xcr xcr xcr xcr 32 Xcr neg neg neg neg neg neg 33 Neg neg neg neg neg neg neg 34 neg neg neg neg neg neg neg 35 Neg neg neg neg neg neg neg 36 Xcc xcc xcc xcc xcc xcc xcc 37 neg xcc xcc xcc xcc xcc xcc 38 Xcc xcc xcc xcc xcc xcc xcc 39 Xcc xcc xcc xcc xcc xcc xcc 40 Neg neg neg neg neg neg neg 41 Neg neg neg neg xcr neg neg 42 Neg neg neg neg neg neg neg 43 Neg neg neg neg neg neg neg 44 Neg neg neg neg neg neg neg 45 Neg neg neg neg neg neg neg 46 Neg neg neg neg neg neg neg 47 Neg neg neg neg neg neg neg 48 Xcc xcc xcc xcc xcc xcc xcc 49 neg neg neg neg neg neg neg 50 missing value neg neg neg neg neg neg 51 Neg neg neg neg neg neg neg 52 Neg neg neg neg neg neg neg 53 Neg neg neg neg neg neg neg 54 Xcc xcc xcc xcc xcc xcc xcc

OGM18-07 ISTA Method Validation Reports Page 149/164 Approved ECOM Decision 18025
55 Neg neg neg neg neg neg neg
Lab1 Lab2 Lab3 Lab4 Lab5 Lab6 Lab7
Conclusion Conclusion Conclusion Conclusion Conclusion Conclusion Conclusion 56 Xcr xcr xcr xcr xcr xcr xcr 57 Neg neg neg neg neg neg neg 58 Xcc xcc xcc xcc xcc xcc xcc 59 Xcc xcc xcc xcc xcc xcc xcc 60 Neg neg neg neg neg neg neg

OGM18-07 ISTA Method Validation Reports Page 150/164 Approved ECOM Decision 18025
Appendix 5 CT results: Taqman vs Conventional PCR
sample
Conv. PCR
Taqman PCR
sample Conv. PCR
Taqman PCR
sample Conv. PCR
Taqman PCR
row 1
1 neg neg
row 2
17 neg neg
row 3
33 neg neg
ro
2 xcr xcr
18 xcr xcr
34 neg neg
3 neg neg
19 neg xcr
35 neg neg
4 neg neg
20 xcc xcc
36 xcc xcc
5 xcc xcc
21 xcc xcc
37 xcc xcc
6 neg neg
22 neg neg
38 xcc xcc
7 xcc xcc
23 xcc xcc
39 xcc xcc
8 xcr xcr
24 xcr xcr
40 neg neg
x x x
100bp ladder 100bp ladder 100bp ladder
x x x
9 xcr xcr
25 xcc xcc
41 neg neg
10 no band neg
26 xcr xcr
42 neg neg
11 xcc xcc
27 neg neg
43 neg neg
12 xcc xcc
28 xcc xcc
44 neg neg
13 neg neg
29 xcr xcr
45 neg neg
14
xcc xcc 30
neg neg 46
neg neg
15
xcc xcc 31
xcr xcr 47
neg neg
16
xcc xcc 32
neg neg 48
xcc xcc
Conventional PCR gel pictures representing the results found in the table of appendix 5 above.
1 2 3 4 5 6 7 8 9 10 11 12 13 14 15 16
17 18 19 20 21 22 23 24 25 26 27 28 29 30 31 32
33 34 35 36 37 38 39 40 41
49 50 51 52 53 54 55 56 57

OGM18-07 ISTA Method Validation Reports Page 151/164 Approved ECOM Decision 18025
Gel 1: from left to right row 1 (1 to 8, 100bp ladder, 9 to 16) and 2 (17 to 32) Gel 2: from left to right row 3 (33 to 48) and 4 (49 to 60)

OGM18-07 ISTA Method Validation Reports Page 152/164 Approved ECOM Decision 18025
Validation study for the addition of Cicer arietinum (Desi type) as a species to which the conductivity test for seed vigour can be applied to support Rules proposal C.15.1
Mohammad Khajeh-Hosseini1, Carina Gallo2, Marie-Helene Wagner3 and Hulya Ilbi4 1 Department of Crop Science, Faculty of Agriculture, Ferdowsi University of Mashhad, Mashhad, Iran. [email protected] or [email protected] 2 National Institute of Agricultural Research, Oliveros Experimental Station, Oliveros, Argentina 3 Station Nationale d’Essais de Semences (SNES), GEVES, Angers, France 4 Ege University, Faculty of Agriculture, Department of Horticulture, Bornova-Izmir, Turkey
Abstract
The conductivity test identified differences in field emergence of 11 seed lots of the Desi type of chickpea (Cicer arietinum). Six of these seed lots, all having a laboratory germination of more than 85%, were tested by four laboratories using the electrical conductivity test, as described in the ISTA Rules (ISTA 2015). All laboratories consistently identified the same significant differences in the seed lot conductivity and the results were repeatable within laboratories and reproducible between laboratories. This provides evidence in support of the addition of Cicer arietinum (Desi type), to the ISTA Rules as a species for which the conductivity test can be applied.
Introduction
The conductivity test is validated in the ISTA Rules as a test that can be applied to species of Pisum sativum, Phaseolus vulgaris, Glycine max, Cicer arietinum (Kabuli type) and Raphanus sativus (ISTA, 2018). This test is based on the leakage of solutes that occurs from all seeds that are soaked in water. These solutes include sugars, amino acids and most importantly for the test, electrolytes. Thus the incidence of leakage can be detected by measurement of the electrical conductivity (EC) of the seed soak-water. The test was developed following the observation of the correlation between solute leakage and field emergence in wrinkled-seeded vining peas (Pisum sativum). Low leakage and therefore low conductivity was associated with seeds that emerged well, that is seeds with high vigour; whereas low vigour seeds with poor emergence had high levels of leakage and conductivity (Matthews and Whitbread, 1968). The conductivity test has also been used as an indicator of field emergence in field beans (Vicia faba, Hegarty, 1977), Phaseolus beans (Powell et al., 1986), soybean (Oliveria et al., 1984; Yaklich et al., 1984) and long bean (Vigna sesquipedalis; Abdullah et al., 1991). Leakage has also been related to emergence in the light-coloured, larger seeded Kabuli type chickpea (Cicer arietinum) (Khajeh-Hosseini et al., 2007; Khajeh-Hosseini and Rezazadeh, 2011) leading to the validated method and inclusion of the Kabuli type chickpea as a species to which the EC test can be applied (ISTA,2014). There is however another, distinctly different and well recognised type of chickpea, the Desi type which has smaller, coloured seeds (Smartt and Simmonds,

OGM18-07 ISTA Method Validation Reports Page 153/164 Approved ECOM Decision 18025
1995). The objective of this study was to demonstrate that the conductivity test can also predict the field emergence of the smaller-seeded coloured Desi type chickpea (Cicer arietinum) and that the test is both repeatable within laboratories and reproducible between laboratories.
Materials and Methods
Field emergence: Samples of eleven seed lots of the Desi type of chickpea (Cicer arietinum) were obtained from Plant Research Institute, Ferdowsi University of Mashhad. Nine seed lots originated from Iran, the other two lots from Ethiopia and Tanzania. All lots had standard germinations above 89%. Field emergence was carried out in a completely randomized block design with four replications of 25 seeds from each seed lot in a clay loam soil where seeds were sown by hand at a depth of 4 cm. The average air and soil temperatures at sowing depth during the experiment were 15 and 13.5oC respectively. Emergence was counted daily for 35 days until no further increase was observed.
Comparative test: Six of the seed lots used for field emergence were used in the comparative test, five from Iran and one (lot C) from Ethiopia. The lots were selected from the original 11 so that they included two high, two medium and two low vigour lots. All lots had standard germinations above 89%. Coded samples of the seed lots were sent from Mashhad, Iran to the participating laboratories, namely Department of Crop Science, Ferdowsi University of Mashhad, Mashhad, Iran; Department of Horticulture, Ege, University, Izmir, Turkey; National Institute of Agricultural Research, Oliveros Experimental Station, Oliveros, Argentina; GEVES, Station Nationale d’Essais de Semences (SNES), Angers, France. Each laboratory completed the conductivity test using the same method as that described for chickpea (Kabuli type) in the ISTA Rules (ISTA, 2015) i.e. four weighed replicates of 50 seeds, each soaked in 250 ml deionised/ distilled water for 24 hours at 20oC. The conductivity was measured after 24 hours on the same sample. The conductivity was expressed as µS cm-1 g-1 of seed.
The data from conductivity was analysed using (a) two-way Analysis of Variance, (b) calculation of z-scores and (c) the statistical tool developed by S. Grégoire according to ISO 5725-2 to calculate h-values and k-values. The statistical tool is available for download at the ISTA website:
http://www.seedtest.org/upload/cms/user/ISO572511.zip
Results
Establishment of a relationship between field emergence and conductivity readings
There was a significant negative correlation (r = -0.791**) between conductivity and the field emergence of the eleven seed lots (figure 1; Appendix 2); standard germination was not correlated with emergence (r = 0.326; P <0.328). When only the six seed lots used for the comparative test were considered there was also a significant negative correlation (r = -0.908*) between conductivity and field emergence. Again, standard germination was not correlated with emergence (r = 0.557; P < 0.250)
Comparative test
Box plot analysis revealed differences between the average EC readings for the six seed lots (figure 2A) with few outside values. There were small differences in the average values obtained by the four laboratories (figure 2B). No seed lot x lab interaction was exhibited in the side-by-side box plots (figure 2C).

OGM18-07 ISTA Method Validation Reports Page 154/164 Approved ECOM Decision 18025
The means for the seed lots following the conductivity test showed clear and significant differences in seed leachate conductivity and hence vigour (table 1). Overall seed lots of E and F had the highest conductivity of measurements, i.e. lowest vigour, followed by lots C and A, while lots B and D had the lowest conductivity indicating the highest vigour.
Application of the tolerances for conductivity from Chapter 15B of the ISTA Rules (ISTA, 2017) showed that, the replicate data (Appendix 1) for each lot in each laboratory were in tolerance with one another. There were small, but significant, differences in the overall means from the four laboratories (table 1). However, the lot means from individual labs were in tolerance.
The Coefficient of Variation (CV) for the comparative test was 7.3% a value comparable with that reported (5.9%) for the method validation of conductivity for Cicer arietinum (Kabuli type) (Khajeh-Hosseini et al., 2014) although the value was higher. The CV was calculated by dividing the standard deviation by the overall mean conductivity of the four labs (table 1) multiplied by 100.
Calculation of the z-scores (table 2) revealed that all data fell within the values that are acceptable within ISTA proficiency tests i.e. +2.00 to -2.00.
Repeatability and reproducibility were analysed with the statistical tool developed by S. Grégoire, based on ISO 5725-2; this allows the calculation of h- and k-values. The h-values show the tendency for a laboratory to give over-estimations or under-estimations compared to the mean of all the results available whereas the k-values give a measure of the variability of the repeats. Higher values indicate greater under- or over-estimations (h-values) or greater variability between replicates (k-values).
No significant h-values were found (figure 3), indicating that the measurements were not over or underestimated. There were only one significant k-value, namely for lot A in lab 3 (figure 4) indicating that there was greater variability between replicates.
Repeatability and reproducibility values are affected by the examined species and the seed quality of the lots tested, with low vigour seeds often having higher values. It is therefore not possible to compare directly the data from comparative tests using different seed lots. However, the values obtained for repeatability and reproducibility (table 3) were lower than those obtained previously for Cicer arietinum (Kabuli type) (Khajeh-Hosseini et al., 2014).
Discussion Field emergence trials clearly established that the conductivity test identifies differences in vigour of Desi type chickpea. Differences in conductivity of six seed lots were consistently identified in each of four laboratories. The test was both repeatable within laboratories and reproducible in different laboratories. In addition, the replicates within the laboratories and the mean values obtained for each lot in different laboratories all fell within tolerance, using the tolerance tables in the ISTA Rules (ISTA, 2015). This provides evidence in support of the addition of Cicer arietinum (Desi type), to the ISTA Rules as a species for which the conductivity test can be applied. The conductivity test therefore applies to both the Desi and Kabuli type chickpea which are distinct types of the cultivated Cicer arietinum. The two types have been produced as a result of dispersal of chickpea from its centre of origin in south-east Turkey, exposure of the crop to different ecological conditions during evolution and subsequent selection by man (Smartt and Simmonds, 1995). The white seeded Kabuli type give a higher range of conductivity values (Khajeh-Hosseini et al., 2014) than the range seen here for the coloured Desi type. Similar
OGM18-07 ISTA Method Validation Reports Page 155/164 Approved ECOM Decision 18025
contrasts in conductivity readings have been seen between cultivars of other grain legumes having coloured and white seed coats (Powell et al., 1986; Abdullah et al., 1991). Comparisons of the conductivity values obtained from different seed lots of chickpea are therefore recommended only within one type of chickpea and not between lots of one type with those of the other type.
Acknowledgements We would like to thank Maliheh Akbarpour PhD student at Department of Crop Science, Faculty of Agriculture, Ferdowsi University of Mashhad for initial experiments on the seed lots, distributing seeds to the participating labs and contributing to data analysis.
References Abdullah, W. D., Powell, A. A. and Matthews, S. 1991. Association of differences in seed vigour
in long bean (Vigna sesquipedalis L.) with testa colour and imbibition damage. Journal of Agricultural Science, Cambridge, 116, 259-264.
Hegarty, T. W. 1977. Seed vigour in field beans (vicia faba L.) and its influence on plant stand. Journal of Agricultural Science, Cambridge, 88, 169-173.
ISTA 2014. ISTA Rules 2014. International Seed Testing Association, Bassersdorf, Switzerland
ISTA 2015. ISTA Rules 2015. International Seed Testing Association, Bassersdorf, Switzerland.
ISTA 2018. ISTA Rules 2018. International Seed Testing Association, Bassersdorf, Switzerland.
Khajeh-Hosseini, M., Rostami, M., Tatari, M., Asadi, G. and Abbasi-Alikamar, R. 2007. The electrical conductivity in chickpea seeds. Proceedings of 28th International Seed Testing Association Congress. Iguassu Falls, Brazil.
Khajeh-Hosseini, M. and Rezazadeh, M. 2011. The electrical conductivity of soak-water of chickpea seeds provides a quick test indicative of field emergence. Seed Science and Technology, 39, 692-696.
Khajeh-Hosseini, M., Gallo, C. and Ilbi, H. 2014. Proposal for the addition of Cicer arietinum (Kabuli type) as a species to which the conductivity test for seed vigour can be applied. Method Validation reports 2014. International Seed Testing Association.
Matthews, S. and Bradnock, W. T. 1968. The detection of seed samples of wrinkled-seeded peas (Pisum sativum L.) of potentially low planting value. Proceedings of the International Seed Testing Association, 32, 553-563.
Matthews, S. and Whitbread, R. 1968. An association between seed exudates and the incidence of pre-emergence mortality in wrinkle-seeded peas. Plant Pathology, 17, 11-17.
Oliveira, M. de A., Matthews, S. and Powell, A.A. 1984. The role of split seed coats in determining seed vigour in commercial seed lots of soyabean, as measured by the electrical conductivity test. Seed Science and Technology, 12, 659-668.
Powell, A. A., Oliveria, M. de A. and Matthews, S. 1986. Seed vigour in cultivars of dwarf French bean (Phaseolus vulgaris) in relation to the colour of the testa. Journal of Agricultural Science, Cambridge, 106, 419-425.
Smartt, J. and Simmonds, N.W. (1995). Evolution of Crop Plants. Longman Group UK

OGM18-07 ISTA Method Validation Reports Page 156/164 Approved ECOM Decision 18025
Yaklich, R.W., Kulik, M.M. and Anderson, J.D. 1984. Evaluation of vigour tests in soybean seeds: relationship of ATP, conductivity, and radioactive tracer multiple criteria laboratory tests to field performance. Crop Science, 19, 806-810.
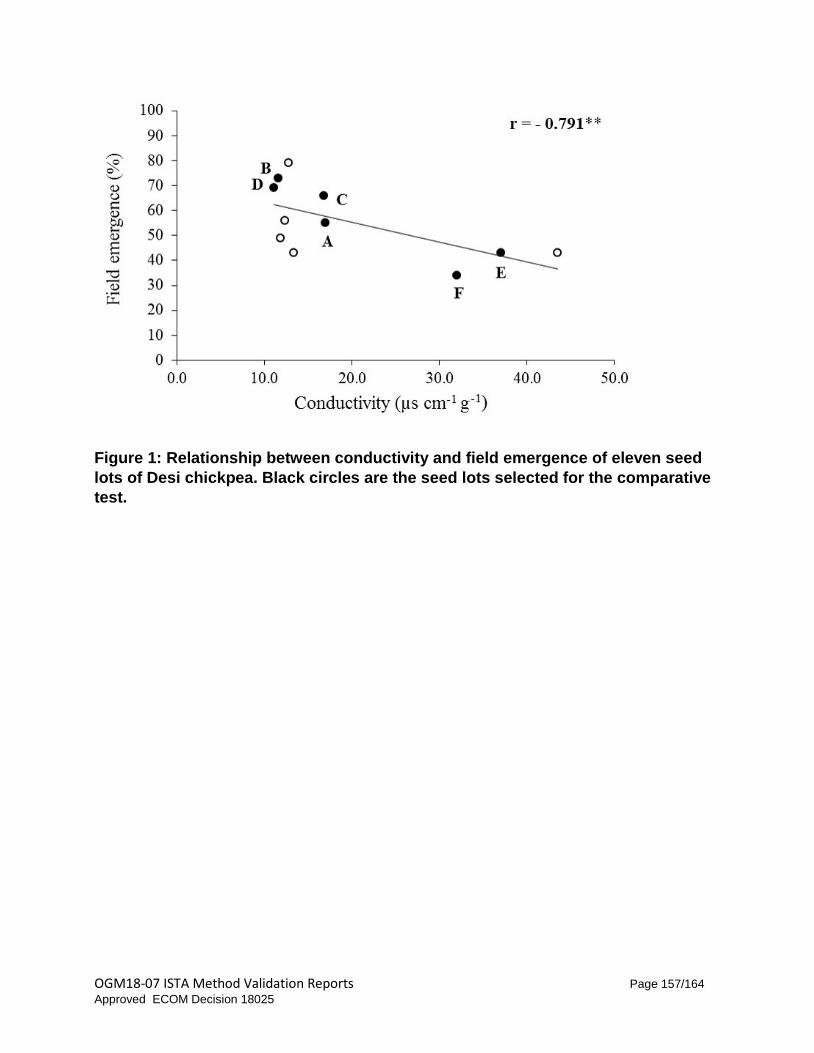
OGM18-07 ISTA Method Validation Reports Page 157/164 Approved ECOM Decision 18025
Figure 1: Relationship between conductivity and field emergence of eleven seed lots of Desi chickpea. Black circles are the seed lots selected for the comparative test.

OGM18-07 ISTA Method Validation Reports Page 158/164 Approved ECOM Decision 18025
Figure 2: Box plot comparisons of the EC data from six seed lots of chickpea (Cicer arietinum), Desi type: (A) seed lots, (B) laboratories and (C) seed lot x laboratory

OGM18-07 ISTA Method Validation Reports Page 159/164 Approved ECOM Decision 18025
Table 1: Comparison of laboratory and seed lot means of six lots of chickpea (Desi type) tested by four laboratories using the conductivity test for 24 hours
Lab Lot Lab means A B C D E F
Lab 1 16.83IK 13.48MN 16.21JL 12.80N 43.40B 33.31E 22.67 b Lab 2 16.70IK 14.21LN 18.15HJ 13.48MN 41.64BC 30.74F 22.49 b
Lab 3 18.86GI 16.47JL 20.50G 15.15KM 45.79A 40.03CD 26.13 a Lab 4 17.11IK 15.04KN 20.00GH 14.82KN 37.89D 32.56EF 22.90 b
Lot means 17.38 d 14.80 e 18.72 c 14.06 e 42.18 a 34.16 b
For lot and lab means, different lower case letters indicate that values are significantly different using LSD at the 5% level. Within a row (laboratory), different upper case letters indicate that values (lots) are significantly different using LSD at the 5% level. Table 2: Means, standard deviations (SD) and z-scores for six seed lots of chickpea (Desi type) tested by four laboratories using the conductivity test for 24 hours
Lot
Lab A B C D E F
a) means Lab 1 16.83 13.48 16.21 12.8 43.4 33.31 Lab 2 16.7 14.21 18.15 13.48 41.64 30.74 Lab 3 18.86 16.47 20.5 15.15 45.79 40.03 Lab 4 17.11 15.04 20 14.82 37.89 32.56 Mean 17.38 14.80 18.72 14.06 42.18 34.16
SD = S 𝒙𝒙� 1.0047 1.2828 1.9521 1.1090 3.3275 4.0594 b) Z-scores
Lab 1 -0.542 -1.029 -1.283 -1.138 0.367 -0.209 Lab 2 -0.672 -0.460 -0.289 -0.525 -0.162 -0.842 Lab 3 1.478 1.302 0.914 0.981 1.085 1.446 Lab 4 -0.264 0.187 0.658 0.683 -1.289 -0.394

OGM18-07 ISTA Method Validation Reports Page 160/164 Approved ECOM Decision 18025
Table 3: Values for repeatability and reproducibility of results from the conductivity test on Cicer arietinum (Desi type) Lot Repeatability (Sr) Reproducibility (SR) A 1.0124 1.3334 B 0.5786 1.3772 C 1.7208 2.4559 D 0.6627 1.2487 E 2.6864 4.0601 F 2.1987 4.4838

OGM18-07 ISTA Method Validation Reports Page 161/164 Approved ECOM Decision 18025
Table 4: Mean Conductivity and tolerance ranges (4 replicates x 50 seeds) for six lots of chickpea (Cicer arietinum), Desi type,
Lot Lab 1 Lab 2 Lab 3 Lab 4
A Maximum tolerance range 4.6 4.6 5.1 4.8
Observed range 0.9 2.0 4.2 0.6 Mean 16.8 16.7 18.9 17.1
B Maximum tolerance range 3.8 4.1 4.6 4.3
Observed range 0.4 1.0 1.7 1.7 Mean 13.5 14.2 16.5 15.0
C Maximum tolerance range 4.8 5.1 5.5 5.5
Observed range 4.1 3 2.6 5.5 Mean 16.2 18.2 20.5 20.0
D Maximum tolerance range 3.6 3.8 4.3 4.1
Observed range 0.9 1 1.5 2.1 Mean 12.8 13.5 15.2 14.8
E Maximum tolerance range 11.3 10.8 11.8 9.8
Observed range 6.9 6.8 5.6 3.4 Mean 43.4 41.6 45.8 37.9
F Maximum tolerance range 8.8 8 10.5 8.5
Observed range 4.3 4.6 6.5 5.3 Mean 33.3 30.7 40.0 32.5

OGM18-07 ISTA Method Validation Reports Page 162/164 Approved ECOM Decision 18025
Figure 3: h-values for six seed lots of Cicer arietinum (Desi type) tested using the conductivity test for 24 hours in four laboratories.
Figure 4: k-values for six seed lots of Cicer arietinum (Desi type) tested using the conductivity test for 24 hours in four laboratories.
-1.5
-1.0
-0.5
0.0
0.5
1.0
1.5
Lab 1 Lab 2 Lab 3 Lab 4
h values Lot ALot BLot CLot DLot ELot F
0.00.20.40.60.81.01.21.41.61.8
Lab 1 Lab 2 Lab 3 Lab 4
K values Lot A
Lot B
Lot C
Lot D
Lot E
Lot F
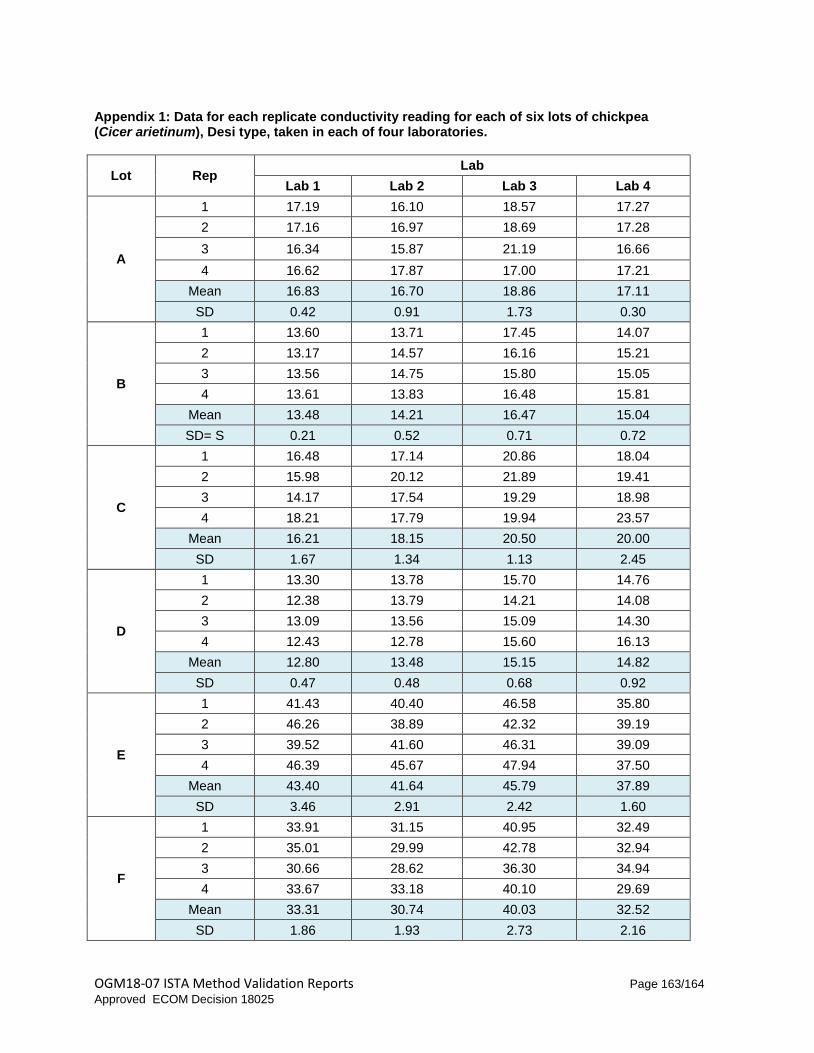
OGM18-07 ISTA Method Validation Reports Page 163/164 Approved ECOM Decision 18025
Appendix 1: Data for each replicate conductivity reading for each of six lots of chickpea (Cicer arietinum), Desi type, taken in each of four laboratories.
Lot Rep Lab
Lab 1 Lab 2 Lab 3 Lab 4
A
1 17.19 16.10 18.57 17.27 2 17.16 16.97 18.69 17.28 3 16.34 15.87 21.19 16.66 4 16.62 17.87 17.00 17.21
Mean 16.83 16.70 18.86 17.11 SD 0.42 0.91 1.73 0.30
B
1 13.60 13.71 17.45 14.07 2 13.17 14.57 16.16 15.21 3 13.56 14.75 15.80 15.05 4 13.61 13.83 16.48 15.81
Mean 13.48 14.21 16.47 15.04 SD= S 0.21 0.52 0.71 0.72
C
1 16.48 17.14 20.86 18.04 2 15.98 20.12 21.89 19.41 3 14.17 17.54 19.29 18.98 4 18.21 17.79 19.94 23.57
Mean 16.21 18.15 20.50 20.00 SD 1.67 1.34 1.13 2.45
D
1 13.30 13.78 15.70 14.76 2 12.38 13.79 14.21 14.08 3 13.09 13.56 15.09 14.30 4 12.43 12.78 15.60 16.13
Mean 12.80 13.48 15.15 14.82 SD 0.47 0.48 0.68 0.92
E
1 41.43 40.40 46.58 35.80 2 46.26 38.89 42.32 39.19 3 39.52 41.60 46.31 39.09 4 46.39 45.67 47.94 37.50
Mean 43.40 41.64 45.79 37.89 SD 3.46 2.91 2.42 1.60
F
1 33.91 31.15 40.95 32.49 2 35.01 29.99 42.78 32.94 3 30.66 28.62 36.30 34.94 4 33.67 33.18 40.10 29.69
Mean 33.31 30.74 40.03 32.52 SD 1.86 1.93 2.73 2.16

OGM18-07 ISTA Method Validation Reports Page 164/164 Approved ECOM Decision 18025
Appendix 2: ANOVA table of field emergence. Source of variation d.f Sum of Squares Mean Square F-value P-value
Replicate 3 9.3409091 3.1136364 1.29 0.2958 Seed lot 10 476.6818182 47.6681818 19.75 <.0001
Error 30 72.4090909 2.4136364
Total 43 558.4318182