Embed Size (px)
Citation preview

Rev. Sci. Instrum. 91, 033705 (2020); https://doi.org/10.1063/1.5124496 91, 033705
© 2020 Author(s).
Method for conducting in situ high-temperature digital image correlation withsimultaneous synchrotron measurementsunder thermomechanical conditionsCite as: Rev. Sci. Instrum. 91, 033705 (2020); https://doi.org/10.1063/1.5124496Submitted: 14 August 2019 . Accepted: 15 February 2020 . Published Online: 05 March 2020
Lin Rossmann , Brooke Sarley, Johnathan Hernandez, Peter Kenesei, Alain Köster, Janine Wischek,
Jonathan Almer, Vincent Maurel, Marion Bartsch, and Seetha Raghavan

Review ofScientific Instruments ARTICLE scitation.org/journal/rsi
Method for conducting in situ high-temperaturedigital image correlation with simultaneoussynchrotron measurements underthermomechanical conditions
Cite as: Rev. Sci. Instrum. 91, 033705 (2020); doi: 10.1063/1.5124496Submitted: 14 August 2019 • Accepted: 15 February 2020 •Published Online: 5 March 2020
Lin Rossmann,1 Brooke Sarley,2 Johnathan Hernandez,2 Peter Kenesei,3 Alain Köster,4 Janine Wischek,5
Jonathan Almer,3 Vincent Maurel,4 Marion Bartsch,5 and Seetha Raghavan2,a)
AFFILIATIONS1Department of Materials Science and Engineering, University of Central Florida, Orlando, Florida 32816, USA2Department of Mechanical and Aerospace Engineering, University of Central Florida, Orlando, Florida 32816, USA3X-Ray Science Division, Advanced Photon Source, Argonne National Laboratory, Argonne, Illinois 60439, USA4MINES ParisTech, PSL Research University, MAT - Centre des Matériaux, 91000 Évry, France5German Aerospace Center, Institute of Materials Research, Linder Höhe, Köln 51147, Germany
a)Author to whom correspondence should be addressed: [email protected]
ABSTRACTThis work presents a novel method of obtaining in situ strain measurements at high temperature by simultaneous digital image correla-tion (DIC), which provides the total strain on the specimen surface, and synchrotron x-ray diffraction (XRD), which provides lattice strainsof crystalline materials. DIC at high temperature requires specialized techniques to overcome the effects of increased blackbody radiationthat would otherwise overexpose the images. The technique presented herein is unique in that it can be used with a sample enclosed inan infrared heater, remotely and simultaneously with synchrotron XRD measurements. The heater included a window for camera access,and the light of the heater lamps is used as illumination. High-temperature paint is used to apply a random speckle pattern to the sam-ple to allow the tracking of displacements and the calculation of the DIC strains. An inexpensive blue theatrical gel filter is used to blockinterfering visible and infrared light at high temperatures. This technique successfully produces properly exposed images at 870 ○C andis expected to perform similarly at higher temperatures. The average strains measured by DIC were validated by an analytical calculationof the theoretical strain. Simultaneous DIC and XRD strain measurements of Inconel 718 (IN718) tensile test specimens were performedunder thermal and mechanical loads and evaluated. This approach uses the fact that with DIC, the total strain is measured, including plas-tic strain, while with XRD, only elastic strain is captured. The observed differences were discussed with respect to the effective deformationmechanisms.Published under license by AIP Publishing. https://doi.org/10.1063/1.5124496., s
I. INTRODUCTION
In situ experimentation is a highly effective approach to inves-tigate material behavior under extreme conditions. However, bynature of the method, the opportunity to make meaningful obser-vations is fleeting and should be maximized. The instrumentationpresented in this work combines two in situ observation meth-ods, applied simultaneously, to observe the deformation of the
material under thermomechanical load on themicro- to nano-scales.The applied techniques were synchrotron x-ray diffraction (XRD),which captures the changes in lattice parameters of crystalline mate-rials due to thermal expansion and elastic deformation, and digi-tal image correlation (DIC), which provides the total strain on aspecimen surface. Comparing strain results from both methods is aunique approach to investigate acting deformation mechanisms andanisotropic behavior.
Rev. Sci. Instrum. 91, 033705 (2020); doi: 10.1063/1.5124496 91, 033705-1
Published under license by AIP Publishing

Review ofScientific Instruments ARTICLE scitation.org/journal/rsi
A. Observing strains with both DIC and x raysThis work presents a method for simultaneously measuring
a material’s lattice strain and total strain under thermomechanicalconditions. Observing dual strains has a wide range of applica-tions, including ceramics and composites; in this work, the instru-mentation is demonstrated with a study of an additively manu-factured superalloy. Inconel 718 is a nickel-based superalloy usedin high-temperature aerospace applications, and additive manufac-turing (AM) provides new opportunities such as more complexgeometries and fewer welds and fasteners. However, the effect of theAM process on the material’s microstructure and resultant mechan-ical properties must be understood before widespread adoption.The thermal gradient during the process creates preferred orien-tation in the material’s crystal structure, resulting in anisotropicproperties and behavior, in some cases metastable phases beingformed. Simultaneously observing total strain and strains in thedifferent planes of the crystal lattice offers new insight into theseeffects.
Total strain is captured by digital image correlation (DIC), inwhich a speckle pattern applied to the sample is photographed dur-ing load, and software tracks the movements of the speckles withrespect to a reference image to compute the strain field. This strain,therefore, includes any plastic strain as well as elastic strain. Latticestrains are captured using high-energy x-ray diffraction (XRD) at theAdvanced Photon Source (APS) 1-ID beamline at Argonne NationalLaboratory. Synchrotron XRD is a powerful method that enables
fast measurements of a transmission diffraction pattern on a detec-tor. With a 2D image of the transmitted scattered x rays, the atomicstructure including lattice strains can be observed in more than onedirection, helpful for studying anisotropy. The high-speed capabilityof the APS enables in situ observation of microstructural behaviorunder any condition that can be applied at the beamline. In thiswork, XRD and DIC were conducted, while the sample was mechan-ically and thermally loaded by mounting the sample in a load framecoupled with an infrared heater. A schematic of the simultaneousacquisition of DIC and XRD strain is shown in Fig. 1.
B. Current methods of high-temperature DICDIC at room temperature is well established1,2 and com-
monly performed,3 but at high temperatures, it presents addi-tional challenges. At high temperatures, increased black body radi-ation causes the image to become overexposed, despite fast shutterspeed, small aperture, and low brightness level setting. This over-exposure obscures the applied speckle pattern, making displace-ment and strain calculations much less accurate and sometimesimpossible.2
Other researchers have used various methods to obtain DICimages at high temperatures.4–14 One method is to illuminate thesample with laser light, which has a sufficient power density tooutweigh the thermal radiation; DIC images at 1200 ○C have beenobtained this way.5 A commonly used technique is to illuminate the
FIG. 1. Simultaneous acquisition of lat-tice strains via synchrotron XRD andtotal strain via DIC enables them tobe directly compared, providing insightinto the lattice orientation dependency ofmechanical properties. These measure-ments have been done in situ with aninfrared heater and a load frame. The fig-ure displays a cutaway view of the heaterwith the specimen in the focus line of fourconcentrating elliptical mirrors.
Rev. Sci. Instrum. 91, 033705 (2020); doi: 10.1063/1.5124496 91, 033705-2
Published under license by AIP Publishing

Review ofScientific Instruments ARTICLE scitation.org/journal/rsi
FIG. 2. Steel rod heated to 870 ○C, photographed without a filter (left) and with a filter (center), with grayscale histograms of the sample (right). The histograms were madefrom the photos cropped to only the area of the sample. The x-axis values are grayscale values from 0 (black) to 255 (white), but the x-axis is shown from 175 to 275 forgreater visibility and legibility, especially regarding the saturation spike at 255.
sample with monochromatic light in the blue or UV wavelengthrange and use a corresponding bandpass filter on the lens.9,15–22Blue lighting with a matching bandpass filter was used to pho-tograph woven Si/SiC composites at 1550 ○C in a custom quartzlamp heating device,20 and ultraviolet lighting and filters were usedto acquire images of thermal barrier coatings in an optical micro-scope heating stage at 1200 ○C.10 Carbon fibers in an inductionheater were imaged at 2600 ○C using a bandpass filter, neutral den-sity filters, and polarizing filters.18 These approaches, while effec-tive, cannot be used when the sample is enclosed in an infraredheater.
C. Use of heater lamps with blue filterThe method presented in this work does not require additional
lighting and can be used with samples enclosed in an infrared heater,overcoming a limitation of methods described previously. The sam-ple is illuminated by the lamps of the infrared heater, rather thanexternal lighting equipment. To eliminate excess thermal radiation,a blue theatrical gel filter is placed on the camera lens; this filteris inexpensive and can be easily cut to fit a lens filter adapter. Thechosen filter is one of a large catalog of theatrical gels and was cho-sen to best suit the particular heater; transmission percentage perwavelength data are available to aid selection. No bandpass, neutraldensity, or polarizing filters are required, reducing the complexityof the experimental setup. The effect of the filter is shown in Fig. 2.The filter blocks orange, red, and infrared light, producing a prop-erly exposed image. Without the filter and using a similar exposuretime (1/80 s without filter and 1/50 s with filter), the image is over-exposed (has white regions with no visual detail). The accompany-ing histograms show the grayscale distribution of the two images,cropped to the sample region used for DIC. The image without thefilter is almost completely saturated, indicating pure white with nocontrast or image detail. It is possible that a properly exposed imagecould have been achieved without the filter using a sufficiently fastshutter speed, but the filter makes proper exposure much easier toachieve.
II. EXPERIMENTAL METHODS
A. Sample manufacturing and preparationExperiments were performed using cylindrical dogbone ten-
sile specimens. Three rods of IN718 were manufactured via selec-tive laser melting. They were then machined to a gage diameter of5 mm and a measurement length of 10 mm. Paint, applied usingan air gun or a spray can, is one of the most common methods ofcreating unique local patterns for DIC software to track.23 High-temperature paint was applied to a region of the surface of eachsample as follows. Masking tape was applied to each sample toexpose only a rectangular regionmeasuring 3mm × 19mm. Becausethe high-temperature paint contains ceramic particles, the paintedregion must be kept out of the path of the synchrotron beam lest itcreates additional diffraction patterns; this restriction prevents theDIC and XRD measurements from having the same view of thesample. Multiple light coats of flat white VHT FlameproofTM high-temperature spray paint were applied to the samples and allowedto fully dry, creating a uniform white region. The white back-ground provides improved contrast and eliminates glare. One coatof black VHT Flameproof spray paint was applied to the sampleswith the spray can held farther away, resulting in a fine mist-likespeckle pattern. After the paint was fully dry, the masking tapewas removed. Figure 3 shows the resulting pattern applied to asample.
FIG. 3. Dogbone tensile specimen of SLM IN718 with speckle pattern for DIC. Thewhite paint increases contrast and eliminates glare, and the black paint providesthe speckles for tracking displacement.
Rev. Sci. Instrum. 91, 033705 (2020); doi: 10.1063/1.5124496 91, 033705-3
Published under license by AIP Publishing
Review ofScientific Instruments ARTICLE scitation.org/journal/rsi
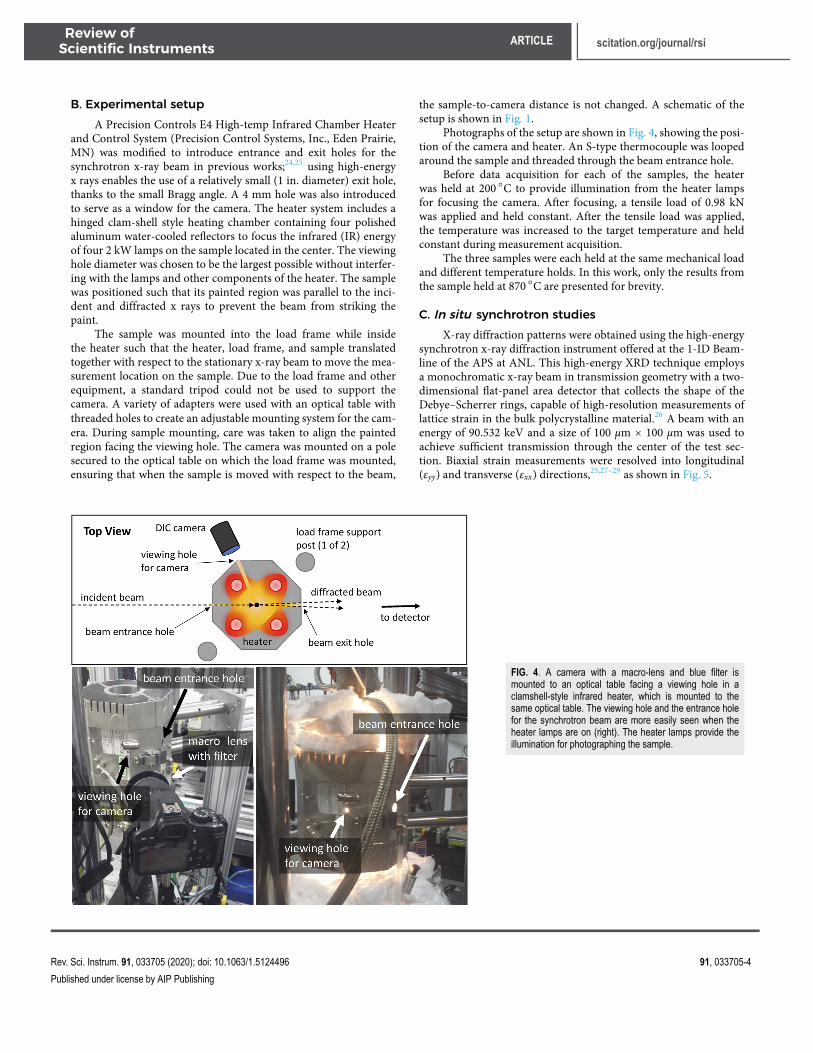
B. Experimental setupA Precision Controls E4 High-temp Infrared Chamber Heater
and Control System (Precision Control Systems, Inc., Eden Prairie,MN) was modified to introduce entrance and exit holes for thesynchrotron x-ray beam in previous works;24,25 using high-energyx rays enables the use of a relatively small (1 in. diameter) exit hole,thanks to the small Bragg angle. A 4 mm hole was also introducedto serve as a window for the camera. The heater system includes ahinged clam-shell style heating chamber containing four polishedaluminum water-cooled reflectors to focus the infrared (IR) energyof four 2 kW lamps on the sample located in the center. The viewinghole diameter was chosen to be the largest possible without interfer-ing with the lamps and other components of the heater. The samplewas positioned such that its painted region was parallel to the inci-dent and diffracted x rays to prevent the beam from striking thepaint.
The sample was mounted into the load frame while insidethe heater such that the heater, load frame, and sample translatedtogether with respect to the stationary x-ray beam to move the mea-surement location on the sample. Due to the load frame and otherequipment, a standard tripod could not be used to support thecamera. A variety of adapters were used with an optical table withthreaded holes to create an adjustable mounting system for the cam-era. During sample mounting, care was taken to align the paintedregion facing the viewing hole. The camera was mounted on a polesecured to the optical table on which the load frame was mounted,ensuring that when the sample is moved with respect to the beam,
the sample-to-camera distance is not changed. A schematic of thesetup is shown in Fig. 1.
Photographs of the setup are shown in Fig. 4, showing the posi-tion of the camera and heater. An S-type thermocouple was loopedaround the sample and threaded through the beam entrance hole.
Before data acquisition for each of the samples, the heaterwas held at 200 ○C to provide illumination from the heater lampsfor focusing the camera. After focusing, a tensile load of 0.98 kNwas applied and held constant. After the tensile load was applied,the temperature was increased to the target temperature and heldconstant during measurement acquisition.
The three samples were each held at the same mechanical loadand different temperature holds. In this work, only the results fromthe sample held at 870 ○C are presented for brevity.
C. In situ synchrotron studiesX-ray diffraction patterns were obtained using the high-energy
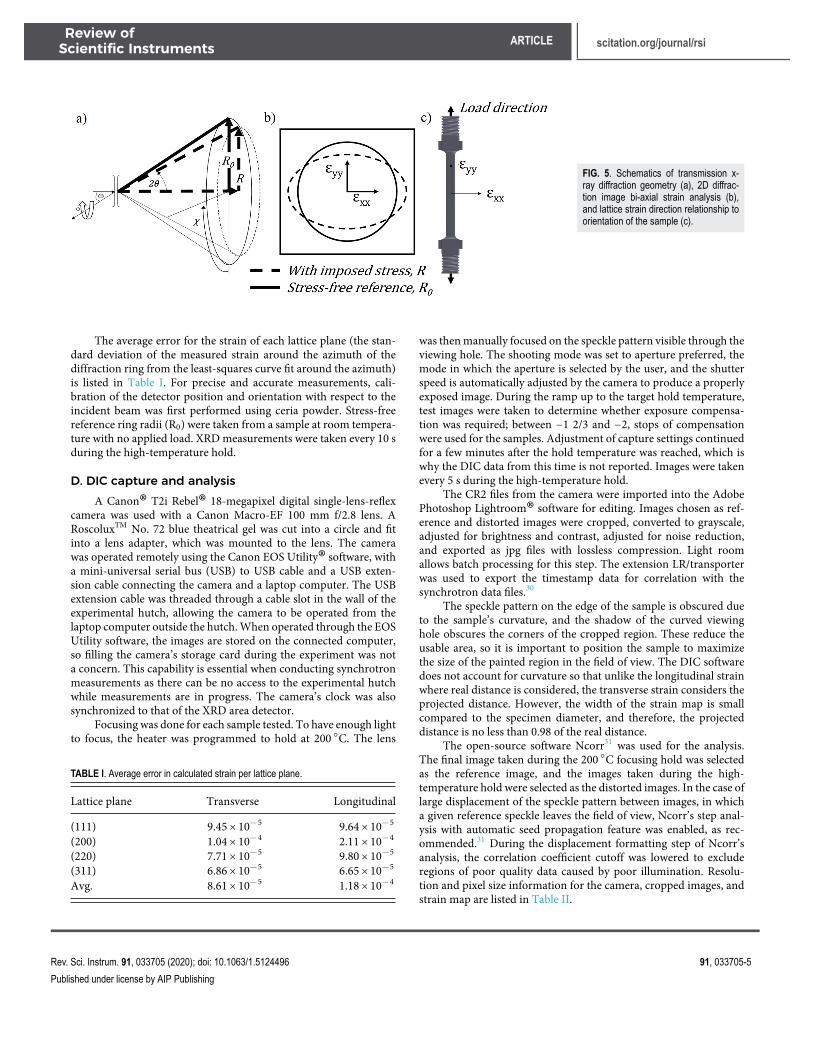
synchrotron x-ray diffraction instrument offered at the 1-ID Beam-line of the APS at ANL. This high-energy XRD technique employsa monochromatic x-ray beam in transmission geometry with a two-dimensional flat-panel area detector that collects the shape of theDebye–Scherrer rings, capable of high-resolution measurements oflattice strain in the bulk polycrystalline material.26 A beam with anenergy of 90.532 keV and a size of 100 �m × 100 �m was used toachieve sufficient transmission through the center of the test sec-tion. Biaxial strain measurements were resolved into longitudinal(εyy) and transverse (εxx) directions,25,27–29 as shown in Fig. 5.
FIG. 4. A camera with a macro-lens and blue filter ismounted to an optical table facing a viewing hole in aclamshell-style infrared heater, which is mounted to thesame optical table. The viewing hole and the entrance holefor the synchrotron beam are more easily seen when theheater lamps are on (right). The heater lamps provide theillumination for photographing the sample.
Rev. Sci. Instrum. 91, 033705 (2020); doi: 10.1063/1.5124496 91, 033705-4
Published under license by AIP Publishing
Review ofScientific Instruments ARTICLE scitation.org/journal/rsi
FIG. 5. Schematics of transmission x-ray diffraction geometry (a), 2D diffrac-tion image bi-axial strain analysis (b),and lattice strain direction relationship toorientation of the sample (c).
The average error for the strain of each lattice plane (the stan-dard deviation of the measured strain around the azimuth of thediffraction ring from the least-squares curve fit around the azimuth)is listed in Table I. For precise and accurate measurements, cali-bration of the detector position and orientation with respect to theincident beam was first performed using ceria powder. Stress-freereference ring radii (R0) were taken from a sample at room tempera-ture with no applied load. XRDmeasurements were taken every 10 sduring the high-temperature hold.
D. DIC capture and analysisA Canon® T2i Rebel® 18-megapixel digital single-lens-reflex
camera was used with a Canon Macro-EF 100 mm f/2.8 lens. ARoscoluxTM No. 72 blue theatrical gel was cut into a circle and fitinto a lens adapter, which was mounted to the lens. The camerawas operated remotely using the Canon EOS Utility® software, witha mini-universal serial bus (USB) to USB cable and a USB exten-sion cable connecting the camera and a laptop computer. The USBextension cable was threaded through a cable slot in the wall of theexperimental hutch, allowing the camera to be operated from thelaptop computer outside the hutch.When operated through the EOSUtility software, the images are stored on the connected computer,so filling the camera’s storage card during the experiment was nota concern. This capability is essential when conducting synchrotronmeasurements as there can be no access to the experimental hutchwhile measurements are in progress. The camera’s clock was alsosynchronized to that of the XRD area detector.
Focusing was done for each sample tested. To have enough lightto focus, the heater was programmed to hold at 200 ○C. The lens
TABLE I. Average error in calculated strain per lattice plane.
Lattice plane Transverse Longitudinal
(111) 9.45× 10⁻⁵ 9.64× 10⁻⁵
(200) 1.04× 10⁻⁴ 2.11× 10⁻⁴
(220) 7.71× 10⁻⁵ 9.80× 10⁻⁵
(311) 6.86× 10⁻⁵ 6.65× 10⁻⁵
Avg. 8.61× 10⁻⁵ 1.18× 10⁻⁴
was thenmanually focused on the speckle pattern visible through theviewing hole. The shooting mode was set to aperture preferred, themode in which the aperture is selected by the user, and the shutterspeed is automatically adjusted by the camera to produce a properlyexposed image. During the ramp up to the target hold temperature,test images were taken to determine whether exposure compensa-tion was required; between −1 2/3 and −2, stops of compensationwere used for the samples. Adjustment of capture settings continuedfor a few minutes after the hold temperature was reached, which iswhy the DIC data from this time is not reported. Images were takenevery 5 s during the high-temperature hold.
The CR2 files from the camera were imported into the AdobePhotoshop Lightroom® software for editing. Images chosen as ref-erence and distorted images were cropped, converted to grayscale,adjusted for brightness and contrast, adjusted for noise reduction,and exported as jpg files with lossless compression. Light roomallows batch processing for this step. The extension LR/transporterwas used to export the timestamp data for correlation with thesynchrotron data files.30
The speckle pattern on the edge of the sample is obscured dueto the sample’s curvature, and the shadow of the curved viewinghole obscures the corners of the cropped region. These reduce theusable area, so it is important to position the sample to maximizethe size of the painted region in the field of view. The DIC softwaredoes not account for curvature so that unlike the longitudinal strainwhere real distance is considered, the transverse strain considers theprojected distance. However, the width of the strain map is smallcompared to the specimen diameter, and therefore, the projecteddistance is no less than 0.98 of the real distance.
The open-source software Ncorr31 was used for the analysis.The final image taken during the 200 ○C focusing hold was selectedas the reference image, and the images taken during the high-temperature hold were selected as the distorted images. In the case oflarge displacement of the speckle pattern between images, in whicha given reference speckle leaves the field of view, Ncorr’s step anal-ysis with automatic seed propagation feature was enabled, as rec-ommended.31 During the displacement formatting step of Ncorr’sanalysis, the correlation coefficient cutoff was lowered to excluderegions of poor quality data caused by poor illumination. Resolu-tion and pixel size information for the camera, cropped images, andstrain map are listed in Table II.
Rev. Sci. Instrum. 91, 033705 (2020); doi: 10.1063/1.5124496 91, 033705-5
Published under license by AIP Publishing

Review ofScientific Instruments ARTICLE scitation.org/journal/rsi
TABLE II. Resolution, pixel size, and related information.
Camera
Pixel size (sensor) 4.29 �mSensor size 22.3 mm2 × 14.9 mm2
Sensor resolution 5196 pixels2 × 3464 pixels2Cropped image
Pixel size (object) 12 �mImage size 3.7 mm2 × 8.8 mm2
Image resolution 306 pixels2 × 730 pixels2Speckle size 10–30 pixels
Displacement and strain
Subset radius 48 pixels (576 �m)Subset spacing 12 pixels (144 �m)Strain window radius 2 pixels (24 �m)
The subset radius refers to the radius in pixels of each “uniquelocal pattern,” called a subset, identified by the software as they aredistorted in subsequent images. The subset spacing refers to thecenter-to-center distance between each subset; the subset spacingshould be one-fourth the radius.23 Strain is calculated using a least-squares plane fit to a group of points in the displacement field calledthe strain window. The strain window radius acts as a smoothingparameter; the smallest strain radius that does not result in noisydata should be used.31
E. Secondary validation experimentThe material properties of SLM IN718 are not thoroughly
known, so a test was carried out on a material with well-establishedproperties to validate the accuracy of the computed DIC strains. 304stainless steel was chosen for its high coefficient of linear thermalexpansion (CTE or α) and relatively high melting point. A flat barof dimensions 12 in. × 1.5 in. × 0.125 in. was painted with high-temperature paint, as described earlier, and was secured vertically in
the center of the heater. Its lower end was lightly clamped in place,with the upper end free to move. Two K-type thermocouples weresecured to the sample, above and below the field of view. To obtainthe largest field of view, the camera was positioned to acquire imagesthrough the beam entrance hole (0.75 in. diameter) rather than the4-mm diameter viewing window that is used when collecting XRDdata. The blue gel filter and macro-lens were used as described ear-lier. Three sets of DIC images were acquired, each under differentheating conditions. The first was a ramp from 50 ○C to 300 ○C over6 min or approximately 40 ○C/min. The second was a 4-min holdat 300 ○C; the measured strain should be zero during this hold. Thethird was a ramp from 570 ○C to 870 ○C over 3min or approximately100 ○C/min. Reported temperature values are the average of the tem-peratures reported by the two thermocouples. For each condition,DIC images were acquired every 10 s.
III. RESULTS AND DISCUSSION
A. Validation experiment resultsThe results of the validation test were compared to theoretical
strain based on the known CTE values of 304 stainless steel.32 Thethermal strain, εthermal, was calculated from the CTE, here referred toas α, using the following equation:
εthermal = α(Tfinal − Tinitial). (1)
The average temperature value reported by the two thermocou-ples was used as the temperature for calculations. CTE data for 304stainless steel were extrapolated from manufacturer data32 using alinear fit with an R2 value of 0.966.
The strains calculated by DIC and the theoretical strains for thethird set of validation data are plotted in Fig. 6; only one set of datais presented for brevity. The DIC strains agree very well with thetheoretical strains, indicating that the image quality is sufficient forDIC analysis. Scatter bars are the standard deviation of strain mea-surements of all pixels in a given strain map; the large scatter barsare in part indicative of variation in the strain field. Variation in thestrain field may be indicative of inhomogeneous heating or texture.The error also increases with temperature as the lighting conditionsbecome more difficult.
FIG. 6. Schematic of the camera posi-tion for the validation experiment on aflat bar of 304 stainless steel (a), sam-ple strain fields at different elapsed timevalues during high-temperature ramp (b),and longitudinal and transverse DICstrains compared to theoretical strainbased on CTE (c). The DIC strainsare in good agreement with theoreticalresults, despite the difficulties of highhigh-temperature image capture with anenclosing heater. Statistical scatter barsrepresent standard deviation of mea-sured strain values within a strain field asrepresented by pixel colors in Fig. 6(b).
Rev. Sci. Instrum. 91, 033705 (2020); doi: 10.1063/1.5124496 91, 033705-6
Published under license by AIP Publishing
Review ofScientific Instruments ARTICLE scitation.org/journal/rsi
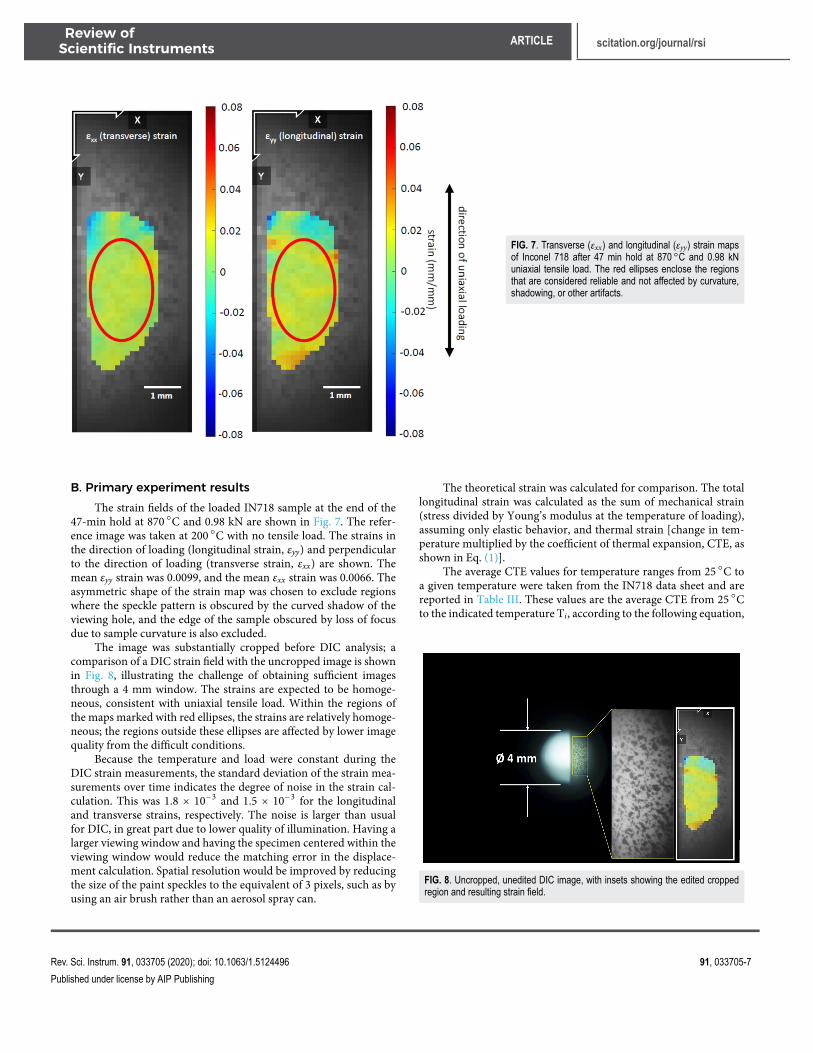
FIG. 7. Transverse (εxx) and longitudinal (εyy) strain mapsof Inconel 718 after 47 min hold at 870 ○C and 0.98 kNuniaxial tensile load. The red ellipses enclose the regionsthat are considered reliable and not affected by curvature,shadowing, or other artifacts.
B. Primary experiment resultsThe strain fields of the loaded IN718 sample at the end of the
47-min hold at 870 ○C and 0.98 kN are shown in Fig. 7. The refer-ence image was taken at 200 ○C with no tensile load. The strains inthe direction of loading (longitudinal strain, εyy) and perpendicularto the direction of loading (transverse strain, εxx) are shown. Themean εyy strain was 0.0099, and the mean εxx strain was 0.0066. Theasymmetric shape of the strain map was chosen to exclude regionswhere the speckle pattern is obscured by the curved shadow of theviewing hole, and the edge of the sample obscured by loss of focusdue to sample curvature is also excluded.
The image was substantially cropped before DIC analysis; acomparison of a DIC strain field with the uncropped image is shownin Fig. 8, illustrating the challenge of obtaining sufficient imagesthrough a 4 mm window. The strains are expected to be homoge-neous, consistent with uniaxial tensile load. Within the regions ofthe maps marked with red ellipses, the strains are relatively homoge-neous; the regions outside these ellipses are affected by lower imagequality from the difficult conditions.
Because the temperature and load were constant during theDIC strain measurements, the standard deviation of the strain mea-surements over time indicates the degree of noise in the strain cal-culation. This was 1.8 × 10⁻³ and 1.5 × 10⁻³ for the longitudinaland transverse strains, respectively. The noise is larger than usualfor DIC, in great part due to lower quality of illumination. Having alarger viewing window and having the specimen centered within theviewing window would reduce the matching error in the displace-ment calculation. Spatial resolution would be improved by reducingthe size of the paint speckles to the equivalent of 3 pixels, such as byusing an air brush rather than an aerosol spray can.
The theoretical strain was calculated for comparison. The totallongitudinal strain was calculated as the sum of mechanical strain(stress divided by Young’s modulus at the temperature of loading),assuming only elastic behavior, and thermal strain [change in tem-perature multiplied by the coefficient of thermal expansion, CTE, asshown in Eq. (1)].
The average CTE values for temperature ranges from 25 ○C toa given temperature were taken from the IN718 data sheet and arereported in Table III. These values are the average CTE from 25 ○Cto the indicated temperature Ti, according to the following equation,
FIG. 8. Uncropped, unedited DIC image, with insets showing the edited croppedregion and resulting strain field.
Rev. Sci. Instrum. 91, 033705 (2020); doi: 10.1063/1.5124496 91, 033705-7
Published under license by AIP Publishing

Review ofScientific Instruments ARTICLE scitation.org/journal/rsi
TABLE III. CTE values for IN718, from 25 ○C to a given temperature.33
Temperature (○C) CTE, 10−6/○C93 12.8204 13.5316 13.9427 14.2538 14.4649 15.1760 16.0
where temperature is in Celsius:
αi = εiTi − 25 . (2)
The CTE at 870 ○C was estimated to be 16.189 × 10⁻⁶/○C froma linear extrapolation of the CTE data, with an R2 value of 0.958. Thethermal strain was calculated using Eq. (1), where α = 16.189 × 10⁻⁶,Tfinal = 870 ○C, and Tinitial = 200 ○C.
Unlike conventionally cast material, SLM IN718 is anisotropicand is susceptible to higher porosity caused by local voids duringdeposition, contamination of the initial powder, and non-optimizedprocess parameters.35 Young’s modulus parallel to the build direc-tion at room temperature is approximately 140 GPa,36 and the tem-perature dependence of Young’s modulus is assumed to be the sameas for conventional IN718. Young’s moduli of conventional IN718,shown in Table IV, were fit with a linear equation with an R2 valueof 0.9988. The slope of this equation was used with the data point ofE = 140 GPa at 25 ○C to generate a linear equation for the temper-ature dependence of Young’s modulus for SLM IN718. Using thisequation, Young’s modulus at 870 ○Cwas estimated to be 91.24 GPa.The mechanical strain was calculated according to the followingequation, where E = 91.24 GPa:
εmechanical = σE . (3)
The theoretical mechanical strain was calculated from this ide-alized isotropic model to be 5.487 × 10⁻⁴ and the thermal strainto be 1.078 × 10⁻², for a total theoretical strain of 0.0113 inthe direction of loading. This is 14% greater than the meanεyy strain of 0.0099 from the DIC analysis, a good agreementconsidering the challenging conditions and the simplified modelassumptions.
While the focus of this work is the DIC technique, a compari-son between lattice and DIC strain data (shown in Fig. 9) is briefly
TABLE IV. Young’s modulus values per temperature for conventional IN718.34
Temperature (○C) E (GPa)
25 200200 191400 179600 167
FIG. 9. While the DIC strain remains constant during the thermomechanical hold,the longitudinal lattice strains show decreasing strain in the beginning of the hold,most dramatically in the (111) plane and least dramatically in the (311) and (200)planes. The DIC strain includes total strain, while the XRD strain only includeselastic strain.
discussed to provide an example of behavior that can be observedby combining DIC with simultaneous synchrotron measurements.There is a small difference in the strain-free reference used for thetwo techniques. The reference for the lattice strains was a sample atroom temperature with no mechanical load. In contrast, the strainsfound using DIC use the position of surface speckles at 200 ○C andno mechanical load as the zero-strain reference positions. Addition-ally, the XRD measures only elastic strain, while the DIC measuresboth elastic and plastic strain. The inclusion of plastic strain in theDIC measurements implies that the measured DIC strain shouldbe larger than or at least as large as the measured lattice strain.This is not the case for the strain data presented, which is largelydue to using a higher temperature for the DIC zero-strain refer-ence. Furthermore, in this experiment, the nominal stress remainedbelow the yield stress, so no plastic strain occurred. Additionally, thesample’s crystallographic texture caused uncertainty in determin-ing the lattice strain. The texture resulted in spotty XRD diffractionrings, requiring interpolation to determine the strain-free referenceradius. The sample’s texture was confirmed by preparation of met-allographic sections along the build direction and perpendicular toit, displaying columnar grains along the build direction. The longi-tudinal direction strains of four lattice planes are shown, each with aslightly different strain magnitude and behavior; these highlight theanisotropy in this material. For lattice strain measurements of FCCcrystals in Ni-based alloys such as γ, it is recommended to comparethe strain behavior of planes (111) and (311) to total strain behav-ior because they are weakly affected by intergranular strains.37 The(311) plane slowly relaxes in strain in the first 15 min of the holdby a small amount and then remains constant, while the (111) planehas a much more noticeable decrease in strain in the first 5 min ofthe hold, has smaller increase and decrease in strain up to 20 mininto the hold, and then stabilizes. The (200) and (220) planes alsoexhibit fluctuations in strain in the first 5 min of the hold. As an
Rev. Sci. Instrum. 91, 033705 (2020); doi: 10.1063/1.5124496 91, 033705-8
Published under license by AIP Publishing

Review ofScientific Instruments ARTICLE scitation.org/journal/rsi
additively manufactured material, the grain shape is expected tobe similar to directionally solidified materials such that columnargrains are formed in the [001] direction. Coupled with results fromDIC measurements, it is clear that changes in the microstructureoccur and introduce variations in strain that are not observable onthe macroscopic scale.
IV. CONCLUSIONSA method for using DIC to measure total strain with simul-
taneous XRD measurements at high temperature has been pre-sented. This capability enables a real-time comparison betweentotal strain and lattice strain under thermo-mechanical loading.These results demonstrate that this approach has the capability tonon-destructively characterize the mechanical behavior of materialsunder extreme environments.
A preliminary experiment was conducted to validate themethod. Measurements of the thermal strain in stainless steel 304showed high accuracy for bi-axial strain information at high tem-perature. The method was applied to an XRD experiment to con-trast lattice strains with the total strains. DIC results show the totalstrain state to be tensile and constant. Four lattice planes of theγ matrix of the nickel alloy exhibited transient strain behavior inthe beginning of the high-temperature hold, despite no observablechange in the total strain, and these lattice planes had different strainmagnitudes and behavior, highlighting the anisotropy of the strainresponse. As illustrated in Fig. 9, this method can be used to asso-ciate macroscopic and lattice behavior in real time. The methodcan also reveal inhomogeneous strain fields, if any, that may resultfrom non-uniform temperature fields due to convection or samplemisalignment.
The method presented is efficient and economical and canbe applied to a variety of experimental conditions. The capabil-ity of performing DIC with an enclosing infrared heater expandsopportunities for in situ data collection, and the fact that exter-nal lighting is not needed reduces the cost and complexity ofthe experimental setup. Collecting DIC images simultaneouslywith synchrotron x-ray diffraction is a powerful tool to relatetotal and lattice strain in situ. DIC measurements can be com-bined with a variety of other non-destructive techniques,38 andthis high-temperature application of DIC can be applied tomany of them because it is low cost, portable, and simple toimplement.
ACKNOWLEDGMENTSThis material is based on the work supported by the National
Science Foundation (Grant Nos. DMR 1337758 and OISE 1460045)and by the German Science Foundation (DFG) (Grant No. SFB-TRR 103, project A3). Use of the Advanced Photon Source, anOffice of Science User Facility operated for the U.S. Departmentof Energy (DOE) Office of Science by Argonne National Lab-oratory, was supported by the U.S. DOE under Contract No.DE-AC02-06CH11357.
REFERENCES1M. Sutton, W. Wolters, W. Peters, W. Ranson, and S. McNeill, Image VisionComput. 1, 133 (1983).2J. S. Lyons, J. Liu, and M. A. Sutton, Exp. Mech. 36, 64 (1996).3B. Pan, K. Qian, H. Xie, and A. Asundi, Meas. Sci. Technol. 20, 062001 (2009).4B. Pan, T. Jiang, and D. Wu, Rev. Sci. Instrum. 85, 115102 (2014).5M. Anwander, B. G. Zagar, B. Weiss, and H. Weiss, Exp. Mech. 40, 98 (2000).6V. Maurel, A. Köster, L. Rémy, M. Rambaudon, D. Missoum-Benziane,V. Fontanet, F. Salgado-Goncalves, A. Heudt, H. Wang, and M. Trabelsi, Int. J.Fatigue 102, 184 (2017).7J. Blaber, B. S. Adair, and A. Antoniou, Rev. Sci. Instrum. 86, 035111 (2015).8A. Chrysochoos, V. Huon, F. Jourdan, J.-M. Muracciole, R. Peyroux, and B.Wat-trisse, Strain 46, 117 (2010).9M. D. Novak and F. W. Zok, Rev. Sci. Instrum. 82, 115101 (2011).10C. Bumgardner, B. Croom, and X. Li, Acta Mater. 128, 54 (2017).11Y. Dong, H. Kakisawa, and Y. Kagawa, Opt. Lasers Eng. 68, 7 (2015).12M.D. Strycker, L. Schueremans,W. V. Paepegem, and D. Debruyne, Opt. LasersEng. 48, 978 (2010).13B. Pan, D. Wu, and Y. Xia, Opt. Lasers Eng. 48, 841 (2010).14M. Harvey, C. Courcier, V. Maurel, and L. Rémy, in Proceedings of the 35thInternational Conference on Metallurgical Coatings and Thin Films [Surf. Coat.Technol. 203, 432 (2008)].15B. Grant, H. Stone, P. Withers, and M. Preuss, J. Strain Anal. Eng. Des. 44, 263(2009).16B. Pan, D. Wu, Z. Wang, and Y. Xia, Meas. Sci. Technol. 22, 015701 (2010).17X. Chen, N. Xu, L. Yang, and D. Xiang, Meas. Sci. Technol. 23, 125603 (2012).18X. Guo, J. Liang, Z. Tang, B. Cao, and M. Yu, Opt. Eng. 53, 063101 (2014).19R. B. Berke and J. Lambros, Rev. Sci. Instrum. 85, 045121 (2014).20B. Pan, D. Wu, and J. Gao, J. Strain Anal. Eng. Des. 49, 224 (2014).21P. Meyer and A. Waas, Exp. Mech. 55, 795 (2015).22W.Wang, C. Xu, H. Jin, S. Meng, Y. Zhang, andW. Xie, Meas. Sci. Technol. 28,035007 (2017).23G. Lionello and L. Cristofolini, Meas. Sci. Technol. 25, 107001 (2014).24S. F. Siddiqui, K. Knipe, A. Manero, C. Meid, J. Wischek, J. Okasinski, J. Almer,A. M. Karlsson, M. Bartsch, and S. Raghavan, Rev. Sci. Instrum. 84, 083904(2013).25K. Knipe, A. C. Manero, S. Sofronsky, J. Okasinski, J. Almer, J. Wischek,C. Meid, A. Karlsson, M. Bartsch, and S. Raghavan, J. Eng. Gas Turbines Power137, 082506 (2015).26D. Haeffner, J. Almer, and U. Lienert, Mater. Sci. Eng.: A 399, 120 (2005).27B. B. He, U. Preckwinkel, and K. L. Smith, Adv. X-ray Anal. 42, 429 (2000).28K. Knipe, A. Manero II, S. F. Siddiqui, C. Meid, J. Wischek, J. Okasinski,J. Almer, A. M. Karlsson, M. Bartsch, and S. Raghavan, Nat. Commun. 5, 4559(2014).29A. Manero, K. Knipe, J. Wischek, C. Meid, J. Okasinski, J. Almer, A. Karlsson,M. Bartsch, and S. Raghavan, Coatings 8, 320 (2018).30T. Armes, Lr/transporter, 2015.31J. Blaber, B. Adair, and A. Antoniou, Exp. Mech. 55, 1105 (2015).32304/304l stainless steel data sheet, AK Steel, 2007.33High Temp Metals, Inconel 718 technical data, 2015.34Alloy 718, Lamineries Matthey SA data sheet, 2013.35E. Chlebus, K. Gruber, B. Kunicka, J. Kurzac, and T. Kurzynowski, Mater. Sci.Eng.: A 639, 647 (2015).36M. Bartsch, Institute ofMaterials Research (GermanAerospace Center, Cologne,2017).37M. T. Hutchings, P. J. Withers, T. M. Holden, and T. Lorentzen, Introduction tothe Characterization of Residual Stress by Neutron Diffraction (CRC Press, 2005).38G. Freihofer, A. Schülzgen, and S. Raghavan, NDT&E Int. 75, 65 (2015).
Rev. Sci. Instrum. 91, 033705 (2020); doi: 10.1063/1.5124496 91, 033705-9
Published under license by AIP Publishing