Embed Size (px)
Citation preview

Method for Approximating Colloid Osmotic Pressure inLong-Term Hemodialysis Patients
Susumu Ookawara,1 Hiroya Sato,2 Hisatoshi Takeda,2 and Kaoru Tabei3
1Department of Internal Medicine, Nishikawa Town Hospital, 2Dialysis Center, Yamagata Prefectural CentralHospital, Yamagata, and 3Division of Nephrology, Department of Internal Medicine, Saitama Medical Center,
Jichi Medical School, Saitama, Japan
Abstract: Colloid osmotic pressure (COP) is important incalculating vascular permeability during hemodialysis(HD).However, few reports have directly measured COP inHD patients. Therefore, the currently published formulasmay not be clinically optimal for predicting COP for HDpatients. Here, the study aims were (i) to directly measureCOP in HD patients and compare the measured and pre-dicted COP values using four previously reported formulas,and (ii) to develop a formula for approximating COPusing clinical parameters. We obtained 212 measured COPvalues using an osmometer; the average value was22.0 � 0.2 mm Hg. The predicted COP based on the fourdifferent formulas was positively correlated with the mea-sured COP (0.87 < r < 0.89), but was significantly over-estimated compared to it (P < 0.001). We also performed astepwise analysis using serum albumin and non-albumin
protein concentrations and obtained the following simpleformula for COP approximation: COP (mm Hg) = -7.91 +5.64 ¥ albumin (g/dL) + 3.00 ¥ non-albumin proteins (g/dL).A positive linear correlation was observed between themeasured COP and approximated COP using this formula(r = 0.90, P < 0.001). We calculated the mean Kr (plasma-refilling coefficient) as a marker for determining dry weightin HD patients using the measured COP and approximatedCOP. No differences were observed between the meanKr derived from the measured and approximated COP.We report here significant differences between measuredand predicted COP values, and have devised a simpleformula for COP approximation in HD patients. KeyWords: Approximated formula, Colloid osmotic pressure,Hemodialysis, Plasma-refilling coefficient.
Colloid osmotic pressure (COP) is important in theregulation of fluid exchange across microvascularwalls. In particular, by influencing vascular perme-ability, COP and hydrostatic pressure are thought todirectly influence fluid movement from the intersti-tial space into vessels at small systemic blood vessels(1). Recently, the plasma-refilling coefficient (Kr) hasbeen proposed as a method for evaluating vascularpermeability during hemodialysis (HD) (2,3), and themean Kr during HD has been also proposed as amarker for the determination of dry weight, whichis the body weight after HD (4). Plasma COP valuesare essential for calculating markers of vascularpermeability, such as Kr values. However, only a few
studies have reported on the direct measurementof COP in HD patients (5,6), and the relationshipbetween measured and predicted COP using previ-ously published formulas remains unclear (7–10). Ofimportance, these previously reported formulas forCOP prediction are not based on HD patients andtherefore may not be suitable for these patients(7–10).
The aims of this study were (i) to comparemeasured and predicted COP values in HD patientsusing these previously published formulas and (ii)to develop a formula for COP approximation usingclinical parameters.
PATIENTS AND METHODS
This study was performed on 106 anuric HDpatients (68 men and 38 women). The mean age andHD duration were 63.4 � 4.6 years and 8.7 � 3.8years, respectively.The causes of chronic renal failure
Received February 2013; revised April 2013.Address correspondence and reprint requests to Dr Susumu
Ookawara,Associate Professor, Department of Internal Medicine,Nishikawa Town Hospital, 581 Nishikawa-machi, Nishimurayama-gun,Yamagata-ken 990-0702, Japan.Tel: +81 237 74 2211 (ext. 130),Fax: +81 237 74 2213. Email: [email protected]
bs_bs_banner
Therapeutic Apheresis and Dialysis 2014; 18(2):202–207doi: 10.1111/1744-9987.12070© 2013 The AuthorsTherapeutic Apheresis and Dialysis © 2013 International Society for Apheresis
202

were chronic glomerulonephritis (52 patients), non-insulin-dependent diabetes mellitus (39 patients) andother (15 patients). Each patient received HD two orthree times a week and the duration of the HD sessionwas 4 h.The patients’ general characteristics are sum-marized in Table 1. Informed consent was obtainedfrom each patient. This study was approved by theInstitutional Review Board of Nishikawa Town Hos-pital, Japan, and conforms to the provisions of theDeclaration of Helsinki (as revised in Tokyo 2004).
Method of COP measurementBlood samples were obtained from each patient
before and after HD so that a total of 212 bloodsamples were acquired for the study. The concentra-tions of total protein and plasma albumin were mea-sured by the biuret method and the bromocresolpurple method, respectively, using an automated ana-lyzer (Beckman Coulter AU400, Brea, CA, USA).
Plasma COP was measured directly using a 4420Wescor osmometer (Logan, UT, USA). This instru-ment has a sample chamber and a saline-filledreference chamber, separated by a semi-permeablemembrane with a molecular mass cut-off at 30 kDa;the instrument is calibrated using filtered COPcalibration solutions of human albumin (11). Calibra-tions were performed according to the manufactur-er’s guidelines. Hence, the increase in hydrostaticpressure was measured at equilibrium by a trans-ducer in the sample chamber.
Prediction of COPFour different previously reported formulas were
used in this study to predict COP:Formula 1 (Landis–Pappenheimer: L-P) (7)
COP mm Hg TP TP TP( ) . . .= × + × + ×2 1 0 16 0 0092 3
Formula 2 (Brenner: Br) (8)
COP mm Hg TP TP( ) . .= × + ×1 645 0 29 2
Formula 3 (Navar and Navar: N-N) (9)
COP mm HgTP TP TP
( ). . .= × + × + ×2 265 0 008 0 0262 3
Formula 4 (Nitta) (10)
COP mm HgAlb TP TP TP 12 TP
TP Alb Alb
( )( . . . )
( ) (= × × + × + ×
+ − ×2 8 0 18 0 02 3
00 9 0 120 004
2. .. )
× + ×+ ×
TP TPTP3
TP is the total protein concentration (g/dL), and Albis the serum albumin concentration (g/dL).
Calculation of plasma-refilling coefficient (meanKr) as a marker of vascular permeability
The calculation of the mean Kr has been describedin detail previously (2–4). In this study, the meanKr was used as a marker of vascular permeability inHD patients, and was calculated with the followingformula:
mean Kr mL min mm HgBW Ht TP TP
HDpre post
( ). ( ) ( )= × × − × −0 077 100 100 1
session min COP COPpost pre( ) ( ).−
BW is the body weight before HD (kg); Ht is hemat-ocrit before HD (%); and TPpre, TPpost COPpre, andCOPpost are the total protein concentration and colloidosmotic pressure before and after HD, respectively.Amean Kr value ranging from 1.0 to 4.0 mL/min per mmHg was considered adequate for the determination ofdry weight in HD patients (4).
StatisticsData are expressed as the mean � standard error
(SE). The student’s t-test for paired values was usedfor the comparisons of the results. Correlationsbetween the two were evaluated by Pearson’s corre-lation coefficient and linear regression analysis,as well as the relationship between measured andapproximated COP values. Agreement betweenmeasured COP and approximated COP was assessedusing the Bland–Altman method. A difference with aP-value of <0.05 was considered significant.
RESULTS
Total protein, albumin, and measured COP areshown inTable 2.The measured COP before and afterHD was 20.0 � 0.2 mm Hg and 24.0 � 0.3 mm Hg,respectively. The average of the 212 measured COP
TABLE 1. General characteristics of hemodialysispatients in this study
Number of patients 106Female/Male 38/68Age (years) 63.4 � 4.6Cause of chronic renal failure
Chronic glomerulonephritis 52Non-insulin dependent diabetes mellitus 39Other 15
HD duration (years) 8.7 � 3.8Ultrafiltration during HD (L) 2.5 � 0.1Kt/V 1.4 � 0.1
Colloid Osmotic Pressure in HD Patients 203
© 2013 The AuthorsTherapeutic Apheresis and Dialysis © 2013 International Society for Apheresis Ther Apher Dial, Vol. 18, No. 2, 2014

values was 22.0 � 0.2 mm Hg. The comparisonbetween the measured COP and the predicted COPbased on the four previously reported formulas isshown in Table 3. A positive correlation was foundbetween the measured COP and the predicted COP asderived from the four different formulas (overallCOP: 0.87 < r < 0.89, COP before HD: 0.79 < r < 0.84,after HD: 0.80 < r < 0.84); however, the predictedCOP derived from the formulas significantly differedfrom the measured COP (P < 0.001).The mean differ-ence (measured COP—predicted COP) in the overallCOP was -1.45 � 0.12 (L-P), -1.50 � 0.12 (Br),-0.88 � 0.13 (N-N), and -0.54 � 0.10 (Nitta). Hence,the overall COP was overestimated by each of the fourformulas rather than direct measurements, and theseoverestimations by the predicted formulas were alsoshown in COP values before and after HD.
To develop an approximation formula basedon measured COP values, we performed a stepwiseanalysis using serum albumin and non-albumin pro-teins (calculated by the difference between the totalprotein concentration and the serum albumin con-centration). Afterwards, we obtained the followingsimple formula for COP approximation:
Formula COP mm Hgalbumin g dL
non-albu
57 91 5 64 3 00
( ). . ( ) .= − + × +
× mmin proteins g dL( ) (5)
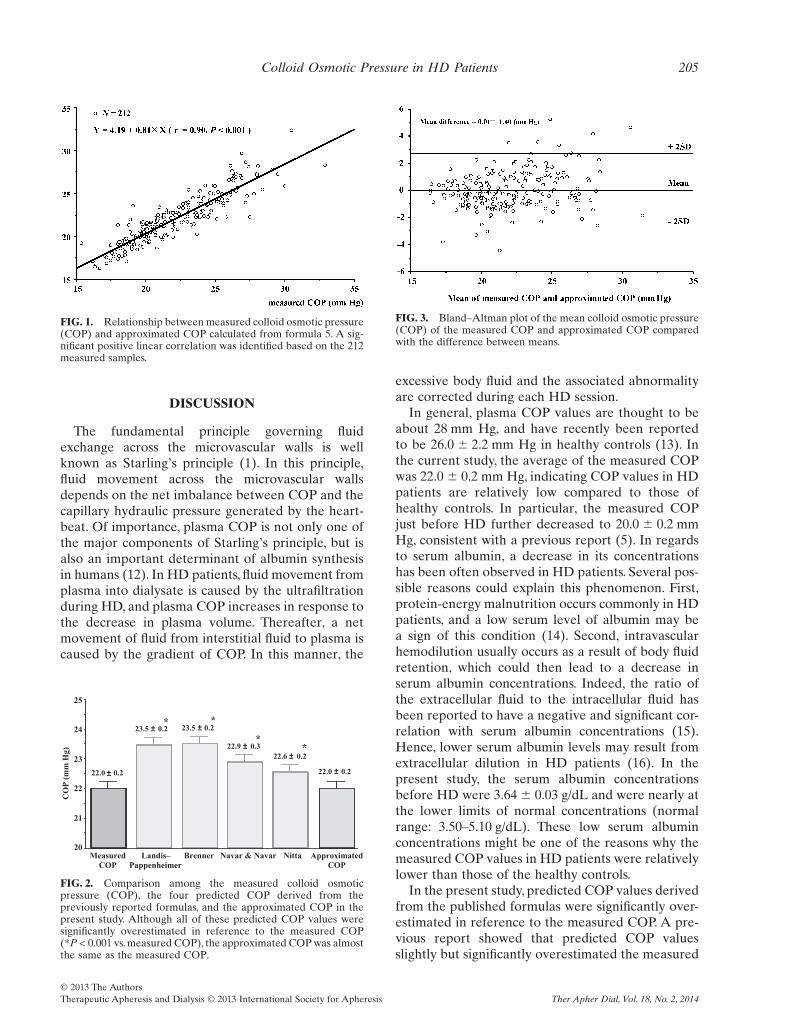
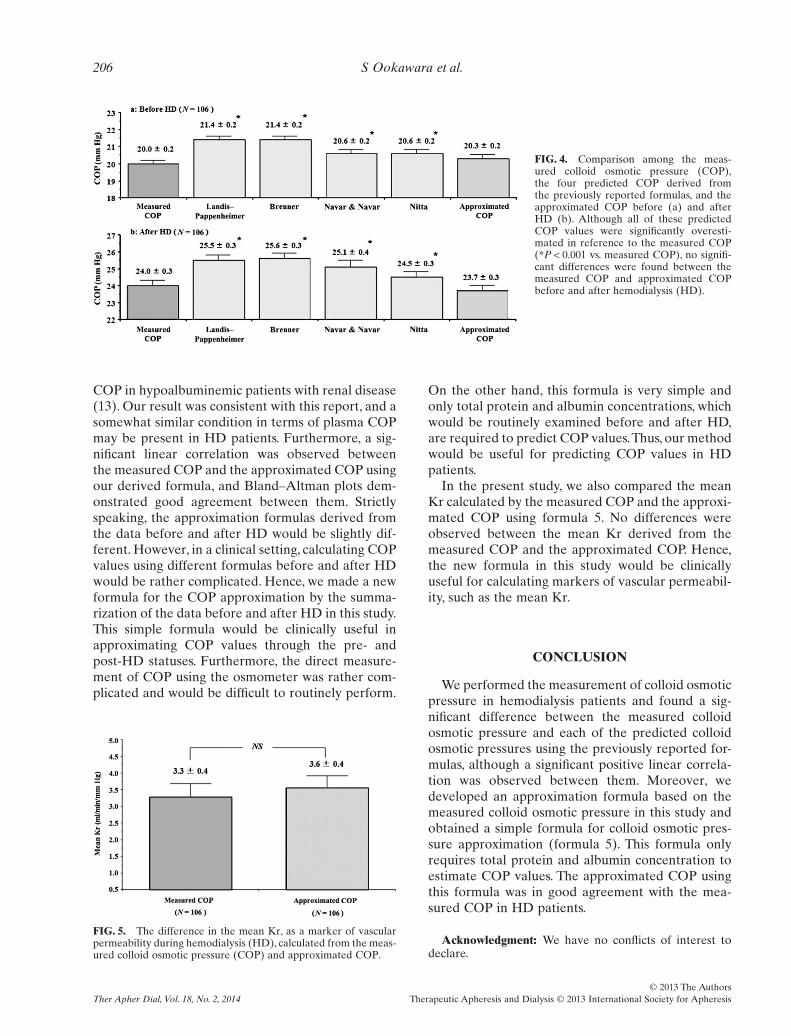
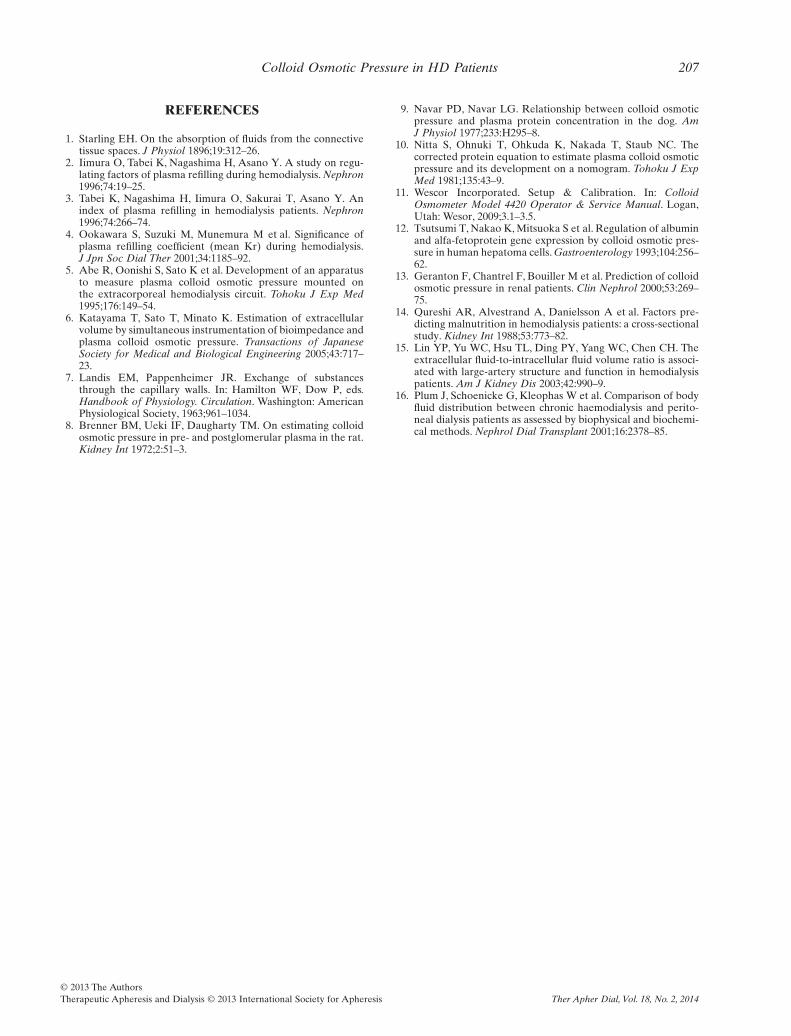
As shown in Figure 1, a positive linear correla-tion was observed between the measured COPand approximated COP using formula 5 (r =0.90, P < 0.001). The approximated COP was22.0 � 0.2 mm Hg, which was nearly the same valueas the measured COP (Fig. 2). The mean differencebetween the measured COP and approximated COPwas only 0.01 � 1.40. More than 95% of the approxi-mated values were included within the mean ofthe (measured COP—approximated COP) � 1.96SD(Fig. 3), indicating the two methods can be used inter-changeably. Furthermore, we compared the mea-sured COP to the predicted COP as derived fromthe four previously reported formulas, and to theapproximated COP before and after HD (Fig. 4).The approximated COP before and after HD were20.3 � 0.2 and 23.7 � 0.3 mm Hg, and were notsignificantly different from the measured COP,respectively.
We also calculated the mean Kr as a marker ofvascular permeability during HD using the measuredCOP and approximated COP. As shown in Figure 5,no differences were observed between the meanKr derived from the measured COP and the approx-imated COP (P = 0.37). Based on this result, itshould be possible to use approximated COP valuesobtained by formula 5 to calculate the mean Kr inHD patients.
TABLE 2. Results of total protein, albumin, non-albumin protein andmeasured colloid osmotic pressure (COP)
Before HD(n = 106)
After HD(n = 106)
Total(n = 212)
Total protein (g/dL) 6.23 � 0.04 6.94 � 0.06 6.58 � 0.04Albumin (g/dL) 3.64 � 0.03 4.05 � 0.04 3.84 � 0.03Non-albumin protein (g/dL) 2.59 � 0.03 2.89 � 0.04 2.74 � 0.03Measured COP (mm Hg) 20.0 � 0.2 24.0 � 0.3 22.0 � 0.2
TABLE 3. Comparison between measured colloid osmotic pressure (COP) and the four predicted COP derived from thepreviously reported formulas. All of the predicted COP values were significantly overestimated in reference to the measured
COP (*P < 0.001 vs. measured COP)
Measured COP Landis–Pappenheimer Brenner Navar & Navar Nitta
Mean � SEOverall (N = 212) 22.0 � 0.2 23.5 � 0.2* 23.5 � 0.2* 22.9 � 0.3* 22.6 � 0.2*Before HD (n = 106) 20.0 � 0.2 21.4 � 0.2* 21.4 � 0.2* 20.6 � 0.2* 20.6 � 0.2*After HD (n = 106) 24.0 � 0.3 25.5 � 0.3* 25.6 � 0.3* 25.1 � 0.4* 24.5 � 0.3*
Linear correlation (r value)Overall (N = 212) 0.87 0.87 0.87 0.89Before HD (n = 106) 0.79 0.79 0.79 0.84After HD (n = 106) 0.80 0.80 0.80 0.84
Mean differenceOverall (N = 212) -1.45 -1.50 -0.89 -0.54Before HD (n = 106) -1.36 -1.39 -0.62 -0.53After HD (n = 106) -1.54 -1.62 -1.13 -0.54
HD, hemodialysis; SE, standard error.
S Ookawara et al.204
© 2013 The AuthorsTherapeutic Apheresis and Dialysis © 2013 International Society for ApheresisTher Apher Dial, Vol. 18, No. 2, 2014
DISCUSSION
The fundamental principle governing fluidexchange across the microvascular walls is wellknown as Starling’s principle (1). In this principle,fluid movement across the microvascular wallsdepends on the net imbalance between COP and thecapillary hydraulic pressure generated by the heart-beat. Of importance, plasma COP is not only one ofthe major components of Starling’s principle, but isalso an important determinant of albumin synthesisin humans (12). In HD patients, fluid movement fromplasma into dialysate is caused by the ultrafiltrationduring HD, and plasma COP increases in response tothe decrease in plasma volume. Thereafter, a netmovement of fluid from interstitial fluid to plasma iscaused by the gradient of COP. In this manner, the
excessive body fluid and the associated abnormalityare corrected during each HD session.
In general, plasma COP values are thought to beabout 28 mm Hg, and have recently been reportedto be 26.0 � 2.2 mm Hg in healthy controls (13). Inthe current study, the average of the measured COPwas 22.0 � 0.2 mm Hg, indicating COP values in HDpatients are relatively low compared to those ofhealthy controls. In particular, the measured COPjust before HD further decreased to 20.0 � 0.2 mmHg, consistent with a previous report (5). In regardsto serum albumin, a decrease in its concentrationshas been often observed in HD patients. Several pos-sible reasons could explain this phenomenon. First,protein-energy malnutrition occurs commonly in HDpatients, and a low serum level of albumin may bea sign of this condition (14). Second, intravascularhemodilution usually occurs as a result of body fluidretention, which could then lead to a decrease inserum albumin concentrations. Indeed, the ratio ofthe extracellular fluid to the intracellular fluid hasbeen reported to have a negative and significant cor-relation with serum albumin concentrations (15).Hence, lower serum albumin levels may result fromextracellular dilution in HD patients (16). In thepresent study, the serum albumin concentrationsbefore HD were 3.64 � 0.03 g/dL and were nearly atthe lower limits of normal concentrations (normalrange: 3.50–5.10 g/dL). These low serum albuminconcentrations might be one of the reasons why themeasured COP values in HD patients were relativelylower than those of the healthy controls.
In the present study, predicted COP values derivedfrom the published formulas were significantly over-estimated in reference to the measured COP. A pre-vious report showed that predicted COP valuesslightly but significantly overestimated the measured
FIG. 1. Relationship between measured colloid osmotic pressure(COP) and approximated COP calculated from formula 5. A sig-nificant positive linear correlation was identified based on the 212measured samples.
MeasuredCOP
Landis–Pappenheimer
Brenner Navar & Navar Nitta20
21
22
23
24
25
22.0 0.2
23.5 ±
±
0.2 23.5 ± 0.2
22.9 ± 0.322.6 ± 0.2
* *
**
22.0 ± 0.2
ApproximatedCOP
CO
P (
mm
Hg)
FIG. 2. Comparison among the measured colloid osmoticpressure (COP), the four predicted COP derived from thepreviously reported formulas, and the approximated COP in thepresent study. Although all of these predicted COP values weresignificantly overestimated in reference to the measured COP(*P < 0.001 vs. measured COP), the approximated COP was almostthe same as the measured COP.
FIG. 3. Bland–Altman plot of the mean colloid osmotic pressure(COP) of the measured COP and approximated COP comparedwith the difference between means.
Colloid Osmotic Pressure in HD Patients 205
© 2013 The AuthorsTherapeutic Apheresis and Dialysis © 2013 International Society for Apheresis Ther Apher Dial, Vol. 18, No. 2, 2014
COP in hypoalbuminemic patients with renal disease(13). Our result was consistent with this report, and asomewhat similar condition in terms of plasma COPmay be present in HD patients. Furthermore, a sig-nificant linear correlation was observed betweenthe measured COP and the approximated COP usingour derived formula, and Bland–Altman plots dem-onstrated good agreement between them. Strictlyspeaking, the approximation formulas derived fromthe data before and after HD would be slightly dif-ferent. However, in a clinical setting, calculating COPvalues using different formulas before and after HDwould be rather complicated. Hence, we made a newformula for the COP approximation by the summa-rization of the data before and after HD in this study.This simple formula would be clinically useful inapproximating COP values through the pre- andpost-HD statuses. Furthermore, the direct measure-ment of COP using the osmometer was rather com-plicated and would be difficult to routinely perform.
On the other hand, this formula is very simple andonly total protein and albumin concentrations, whichwould be routinely examined before and after HD,are required to predict COP values.Thus, our methodwould be useful for predicting COP values in HDpatients.
In the present study, we also compared the meanKr calculated by the measured COP and the approxi-mated COP using formula 5. No differences wereobserved between the mean Kr derived from themeasured COP and the approximated COP. Hence,the new formula in this study would be clinicallyuseful for calculating markers of vascular permeabil-ity, such as the mean Kr.
CONCLUSION
We performed the measurement of colloid osmoticpressure in hemodialysis patients and found a sig-nificant difference between the measured colloidosmotic pressure and each of the predicted colloidosmotic pressures using the previously reported for-mulas, although a significant positive linear correla-tion was observed between them. Moreover, wedeveloped an approximation formula based on themeasured colloid osmotic pressure in this study andobtained a simple formula for colloid osmotic pres-sure approximation (formula 5). This formula onlyrequires total protein and albumin concentration toestimate COP values. The approximated COP usingthis formula was in good agreement with the mea-sured COP in HD patients.
Acknowledgment: We have no conflicts of interest todeclare.
FIG. 4. Comparison among the meas-ured colloid osmotic pressure (COP),the four predicted COP derived fromthe previously reported formulas, and theapproximated COP before (a) and afterHD (b). Although all of these predictedCOP values were significantly overesti-mated in reference to the measured COP(*P < 0.001 vs. measured COP), no signifi-cant differences were found between themeasured COP and approximated COPbefore and after hemodialysis (HD).
FIG. 5. The difference in the mean Kr, as a marker of vascularpermeability during hemodialysis (HD), calculated from the meas-ured colloid osmotic pressure (COP) and approximated COP.
S Ookawara et al.206
© 2013 The AuthorsTherapeutic Apheresis and Dialysis © 2013 International Society for ApheresisTher Apher Dial, Vol. 18, No. 2, 2014
REFERENCES
1. Starling EH. On the absorption of fluids from the connectivetissue spaces. J Physiol 1896;19:312–26.
2. Iimura O, Tabei K, Nagashima H, Asano Y. A study on regu-lating factors of plasma refilling during hemodialysis. Nephron1996;74:19–25.
3. Tabei K, Nagashima H, Iimura O, Sakurai T, Asano Y. Anindex of plasma refilling in hemodialysis patients. Nephron1996;74:266–74.
4. Ookawara S, Suzuki M, Munemura M et al. Significance ofplasma refilling coefficient (mean Kr) during hemodialysis.J Jpn Soc Dial Ther 2001;34:1185–92.
5. Abe R, Oonishi S, Sato K et al. Development of an apparatusto measure plasma colloid osmotic pressure mounted onthe extracorporeal hemodialysis circuit. Tohoku J Exp Med1995;176:149–54.
6. Katayama T, Sato T, Minato K. Estimation of extracellularvolume by simultaneous instrumentation of bioimpedance andplasma colloid osmotic pressure. Transactions of JapaneseSociety for Medical and Biological Engineering 2005;43:717–23.
7. Landis EM, Pappenheimer JR. Exchange of substancesthrough the capillary walls. In: Hamilton WF, Dow P, eds.Handbook of Physiology. Circulation. Washington: AmericanPhysiological Society, 1963;961–1034.
8. Brenner BM, Ueki IF, Daugharty TM. On estimating colloidosmotic pressure in pre- and postglomerular plasma in the rat.Kidney Int 1972;2:51–3.
9. Navar PD, Navar LG. Relationship between colloid osmoticpressure and plasma protein concentration in the dog. AmJ Physiol 1977;233:H295–8.
10. Nitta S, Ohnuki T, Ohkuda K, Nakada T, Staub NC. Thecorrected protein equation to estimate plasma colloid osmoticpressure and its development on a nomogram. Tohoku J ExpMed 1981;135:43–9.
11. Wescor Incorporated. Setup & Calibration. In: ColloidOsmometer Model 4420 Operator & Service Manual. Logan,Utah: Wesor, 2009;3.1–3.5.
12. Tsutsumi T, Nakao K, Mitsuoka S et al. Regulation of albuminand alfa-fetoprotein gene expression by colloid osmotic pres-sure in human hepatoma cells. Gastroenterology 1993;104:256–62.
13. Geranton F, Chantrel F, Bouiller M et al. Prediction of colloidosmotic pressure in renal patients. Clin Nephrol 2000;53:269–75.
14. Qureshi AR, Alvestrand A, Danielsson A et al. Factors pre-dicting malnutrition in hemodialysis patients: a cross-sectionalstudy. Kidney Int 1988;53:773–82.
15. Lin YP, Yu WC, Hsu TL, Ding PY, Yang WC, Chen CH. Theextracellular fluid-to-intracellular fluid volume ratio is associ-ated with large-artery structure and function in hemodialysispatients. Am J Kidney Dis 2003;42:990–9.
16. Plum J, Schoenicke G, Kleophas W et al. Comparison of bodyfluid distribution between chronic haemodialysis and perito-neal dialysis patients as assessed by biophysical and biochemi-cal methods. Nephrol Dial Transplant 2001;16:2378–85.
Colloid Osmotic Pressure in HD Patients 207
© 2013 The AuthorsTherapeutic Apheresis and Dialysis © 2013 International Society for Apheresis Ther Apher Dial, Vol. 18, No. 2, 2014