Embed Size (px)
Citation preview

RESEARCH ARTICLE Open Access
Methane and carbon at equilibrium in source rocksFrank D Mango
Abstract
Methane in source rocks may not exist exclusively as free gas It could exist in equilibrium with carbon and higherhydrocarbons CH4 + C lt = gt Hydrocarbon Three lines of evidence support this possibility 1) Shales ingest gas inamounts and selectivities consistent with gas-carbon equilibrium There is a 50 increase in solid hydrocarbon masswhen Fayetteville Shale is exposed to methane (450 psi) under moderate conditions (100degC) Rock-Eval S2 (mg g-1)85 = gt 125 All light hydrocarbons are ingested but with high selectivity consistent with competitive addition toreceptor sites in a growing polymer Mowry Shale ingests butane vigorously from argon for example but not frommethane under the same conditions 2) Production data for a well producing from Fayetteville Shale declines alongthe theoretical curve for withdrawing gas from higher hydrocarbons in equilibrium with carbon 3) A new generalgas-solid equilibrium model accounts for natural gas at thermodynamic equilibrium and C6-C7 hydrocarbonsconstrained to invariant compositions The results make a strong case for methane in equilibrium with carbonand higher hydrocarbons If correct the higher hydrocarbons in source rocks are gas reservoirs raising thepossibility of substantially more gas in shales than analytically apparent and far more gas in shale deposits thancurrently recognized
IntroductionFew questions in geoscience are as interesting and contro-versial as the origin of methane in natural gas And fewergo as far back in time Evans proposed thermal cracking in1971 to explain oil trending to methane with depth in aCanadian basin [1] It was assumed that hydrocarbonscracked more or less randomly to smaller hydrocarbonand ultimately to methane This premise had broad ap-peal but no empirical or theoretical foundation McNabhad attempted to replicate methane generation from oilcracking in long-term cracking experiments in 1952but failed [2] Thermal cracking theory was neverthelesselevated to text-book status [34] but it was never to gainthe empirical support McNab sought and its predictivepowers today are limited It cannot for example explainthe properties of natural gas the thermal stability of itslight hydrocarbons [5] their compositions in gas deposits[6] or their constraints to thermodynamic equilibrium [7]Catalysis by transition metals explains these properties
[5-7] and there is considerable experimental evidencesupporting it Source rocks release gas catalytically inlaboratory experiments at ambient temperatures [8-10]and molecular probe experiments confirm natural catalytic
activity as the source of gas in these experiments [11]However there is also experimental evidence againsttransition metal catalysis in natural gas generation [12]Catalysis accounts for the composition of natural gas but
other questions remain troubling Shales ingest and expelgas in the laboratory in ways contradicting classical physicsNon-classical behavior is apparent in chaotic generationcurves [8] and in the generation of hydrocarbons inreverse-mass order [9] It is also apparent in the molecularprobe experiments [11] Methane ingestion in Fayettevilleand Mowry Shales reported here is another outstandingexampleThe premise that methane should be independent of
the solid hydrocarbons generating it could be flawed Ifgeneration is catalytic and reversible methane and itssource would be more like carbon dioxide and calciteat equilibrium Carbon dioxide is never independent ofcalcite Ingested and expelled reversibly from CaCO3CaOits pressure increases and falls with temperature as athermodynamic function of the equilibrium constant Me-thane could similarly exist in two states gaseous methaneand solid-state methane at equilibrium It accounts forthe results presented here and the non-classical behaviorin earlier experimentsAn equilibrium hypothesis is presented in three parts
The general concept is laid out first (Theory) The secondCorrespondence dinacatmangogmailcomPetroleum Habitats 806 Soboda Houston TX 77079 USA
copy 2013 Mango licensee BioMed Central Ltd This is an open access article distributed under the terms of the CreativeCommons Attribution License (httpcreativecommonsorglicensesby20) which permits unrestricted use distribution andreproduction in any medium provided the original work is properly cited
Mango Geochemical Transactions 2013 145httpwwwgeochemicaltransactionscomcontent1415
part is the supporting experimental evidence (Ingestion)and the third contains a kinetic model of the theoreticalequilibrium (Gas-Solid Equilibrium Kinetic Simulations)A new general equilibrium model for light hydrocarbongeneration summarizes the results
Results and discussionTheory - Solid hydrocarbons storing and generating gasis hypothetical It considers two very different reservoirsof gas in shales The first is open porosity storing andexpelling gas as a passive container in accordance withclassical theory The second does not It is comprised ofsolids like pyrobitumens and similar high-molecularweight hydrocarbons found in organic-rich shales It isnot a passive container storing hydrocarbons in solutionhowever Methane could only have a very limited solubilityin solid hydrocarbons perhaps no more than a few percentby my estimates In the current hypothesis solid hydro-carbon reservoirs are co-polymers of methane and carbonat equilibrium The equilibrium in reaction (1) illustratesthe concept in its simplest form
nCH4 thorn n minusCminuseth THORN ltfrac14gt ndashCH2minuseth THORN2n eth1THORN
The equilibrium hypothesis and supporting evidence arediscussed below Here we consider the origin of solidhydrocarbons also referred to as lsquocarbon poolsrsquo lsquoMethanersquois used throughout to illustrate relationships for simplicityAll references to lsquomethanersquo or lsquoCH4rsquo should apply to thehigher light hydrocarbons as well although methane is theprimary focus hereThe existence of solid hydrocarbons in source rocks
is not new They have been recognized by organic geo-chemists for decades Generating gas from higher hy-drocarbons necessarily generates a carbon deposit tobalance hydrogen It is the text-book explanation for theorigin of pyrobitumen for example a ubiquitous organicmineral in sources rocks with HC ratios ranging fromabout 5 to 16 [4] Pyrobitumens are typically rich intransition metals [1314] and have recently been citedfor catalytic activity in methane generation [15] Solidhydrocarbons have been proposed as catalysts resemblingactivated carbon in the decomposition of higher hydrocar-bons to gas [16] Solid hydrocarbon pools in this modelcan be pyrobitumen or any other organic solid containinga catalyst that generate gas They are both catalysts forgenerating methane and reservoirs for storing itSolid hydrocarbons are not uncommon in transition
metal catalysis The hydrogenation of carbon monoxideto methane over nickel lsquomethanationrsquo is an outstandingexample [17] The intermediates to methane are distributedin pools of solid hydrocarbons associated with nickel Thenature of the carbon polymer in methanation is unclearexcept that it is a co-catalyst it is unsaturated in hydrogen
and it is not graphite It is like the carbon pool proposedhere some carbon polymer between saturate hydrocarbonCH2 and graphite CH0 The activated carbon suggested byAlexander et al [16] in the catalytic generation of naturalgas is another relevant exampleHow the proposed equilibrium reaction might proceed
mechanistically is discussed in Gas-Solid EquilibriumKinetic Simulations below We are only concerned herewith overall conversion Methane generation feeds carboninto a pool of hydrogen-unsaturated carbon into pyrobitu-men for exampleSince source rocks possess natural catalytic activity and
generate catalytic gas in the laboratory [11] we shallassume that natural methane is catalytically generated andthat the catalyst resides in pools of solid hydrocarbonsBecause most catalytic reactions are reversible and ap-proach equilibrium over time we also assume that methanegeneration is reversible and should bring methane and solidhydrocarbons into equilibrium over timeReaction (2) illustrates a general equilibrium between
methane and solid hydrocarbons
xCH4 thorn CHy ltfrac14gt Cxthorn1Hythorn4x eth2THORN
There is a 46 mass difference in methane equivalentsbetween a solid hydrocarbons with compositions CH05
and CH16 for example a typical range for pyrobitumens[4] Thus CH05 can consume 46 of its mass in methanegenerating CH16 if methane exists in equilibrium with solidhydrocarbonHowever there is nothing to suggest that methane
actually reacts with solid hydrocarbons generating newcompounds It is not enough that methane merely dissolvesin CHy In that case x in reaction (2) would be insignificantand the equilibrium in (2) meaninglessThe proposed equilibrium is purely hypothetical but
testable Do solid hydrocarbons in source rocks consumeextraordinary amounts of light hydrocarbons in ways dis-tinguishable from simple adsorption and solutionLight Hydrocarbon Ingestion- The experimental challenge
is to distinguish gas addition to the solid hydrocarbons insource rocks from classical gas addition to ordinarysolid hydrocarbons There are several classical ways lighthydrocarbons can add to heterogeneous materials likesource rocks They can be adsorbed on surfaces go intoliquid solutions or into polymer solutions for exampleThere is no chemical change in adsorption and solutionhowever They are first-order reactions in which rates ofaddition are proportional to concentrations Rate = k(X)where (X) is the concentration of free hydrocarbon X andk is the first-order rate constant Because hydrocarbonsdo not compete for surface sites or positions in solutiontransfer rates and solubilities are typically independent of
Mango Geochemical Transactions 2013 145 Page 2 of 9httpwwwgeochemicaltransactionscomcontent1415
other hydrocarbons Butane has about the same watersolubility in helium as it has in methane for example [18]Assume that hydrocarbons add to the solid hydrocarbons
in source rocks differently Hydrocarbon X adds to somereceptor [] generating the adduct [X] a process referredto here as lsquoingestionrsquo X disappears by second-order kineticsat rates proportional to X and [] Rate = k(X)[]However in contrast to adsorption and solution hydro-carbons compete for [] Thus rates of ingestion are notindependent of other hydrocarbonsWe can distinguish between ingestion and either adsorp-
tion or solution through competitive addition If solidhydrocarbons are mere solvents hydrocarbon X will gointo solid-solution at rates proportional to concentrationsof X independent of some other hydrocarbon Y If how-ever X reacts with [] and Y competes with X for [] Xwill go into the solid at rates inversely proportional to YDo hydrocarbons compete in their addition to solid
hydrocarbonsTo put this question to experimental test two vials were
charged with identical amounts of Mowry Shale andan equal molar mixture of ethane propane iso-butaneand n-butane (C2-C4) Both vials were heated at 75degCfor 200 hours One (Vial A) was diluted with argon by50 five times over the 200 hours and the other (Vial B)was diluted with equal amounts of methane five timesThe only difference in the two reactions was dilutionswith argon in one (Vial A) and dilutions with methane inthe other (Vial B) Thus C2-C4 gas concentrations in eachvial diminished equally with each argon and methanedilution Concentrations over time should be about thesame in A and B if Mowry Shale is passive and onlyremoves C2-C4 hydrocarbons by adsorption or solution Ifit removes them by ingestion and C1-C4 hydrocarbonscompete for [] C2-C4 concentrations in Vial A shouldfall progressively below those in Vial BAnother vial (C) was charged with beach sand with a
thin coating of n-octadecane (~ 1) to assess adsorptionand solution The C2-C4 hydrocarbon mixture was addedand the vial was heated and diluted with methane as wasVial BIf Mowry Shale consumes hydrocarbons classically
through adsorption and solution exclusively the ratio ofsums sum (C2-C4)A sum (C2-C4)B should remain constantover time If however Mowry Shale ingests C2-C4 theratio of slums sum (C2-C4)A sum (C2-C4)B should progressto zero over timeHydrocarbon gas concentrations (C2-C4) over time in the
three vials are shown in Table 1 The differences betweenVials A and B over time are dramatic Mowry Shaleconsumed 163 μg C2-C4 g-1 in argon (Vial A) comparedto under 30 μg g-1 in methane (Vial B) Figure 1 shows thedecline in n-butane gas concentrations over time in Aand B Concentrations of n-butane in B fall exponentially
consistent with sequential 50 dilutions but compositionof C2-C4 remains essentially constant over time (Table 1B)The blue line passing through the B data is not the regres-sion line for that data It is the dilution line indicatingwhere the data should plot if only dilution were loweringn-butane gas concentrations Hydrocarbon concentrationsin A fall sharply below the blue dilution line progressing tozero over time signaling almost total ingestion Moreover
Table 1 Hydrocarbon ingestion Mowry Shale 75degC200 hours
Weight Concentrations in gas over time
VIAL A 1 2 3 4 5 6
μg C2g 83993 13629 4720 1239 0114 0028
μg C3g 101548 11542 3113 0693 0036 0010
μg iC4g 124533 13942 4059 1032 0065 0020
μg nC4g 86679 4290 1051 0184 0007 0007
VIAL B 1 2 3 4 5 6
μg C2g 69046 32556 8803 5489 2623 1595
μg C3g 93766 44174 12430 7606 3249 1558
μg iC4g 119893 59328 19538 12789 5971 3032
μg nC4g 114537 57104 17266 11075 5403 2734
VIAL C 1 2 3 4 5 6
μg C2g 106474 54830 12063 7282 4088
μg C3g 149244 73379 10149 5855 3118
μg iC4g 191697 92384 10637 6208 3464
μg nC4g 177661 83205 3061 1749 1080
Percent wt Compositions in C2-C4 over time
VIAL A 1 2 3 4 5
C2g 2117 3140 3647 3936 5116
C3g 2559 2659 2405 2200 1612
iC4g 3139 3212 3136 3280 2938
nC4g 2185 988 812 583 334
VIAL B 1 2 3 4 5
C2g 1738 1685 1517 1485 1521
C3g 2360 2287 2142 2058 1884
iC4g 3018 3071 3366 3460 3462
nC4g 2883 2956 2975 2996 3133
VIAL C 1 2 3 4 5
C2g 1703 1805 3359 3452 3479
C3g 2388 2415 2826 2776 2654
iC4g 3067 3041 2962 2943 2948
nC4g 2842 2739 852 829 919
Sample preparation and experimental procedures are described elsewhere[10] Each 5 ml vial was charged with 1 g shale and gas composed of a 2 mlmixture of ethane propane isobutane and n-butane equal volumes and about2 ml of either methane (Vials B amp C) or argon (Vial A) 2 ml gas was removed andanalyzed 5 times over 200 hours and replaced with argon (Vial A) or methane(Vials B amp C) Concentrations are gas concentrations in the vials prior to eachdilution calculated from the concentrations in the 2 ml samples removed witheach dilution
Mango Geochemical Transactions 2013 145 Page 3 of 9httpwwwgeochemicaltransactionscomcontent1415
n-butane was selectively withdrawn from Vial A Percentn-butane (C2-C4) fell sharply in A and remained essentiallyconstant in B (Figure 2) Concentrations at terminationwere 16 μg g-1 in B and 0064 μg g-1 in A a 250-folddifferenceC2-C4 concentrations in Vial C fell over time propor-
tional to their molecular weights consistent with solution inn-octadecane The ratio of iso-butanen-butane approachedequilibrium (~ 3 at 75degC) consistent with acid-catalyzedisomerization promoted by the mild acidity of beach sand[19] The equivalent reaction in Vial B showed no changein iso-butanen-butane or in the composition of C2-C4Thus Mowry Shale in B showed no evidence of isomeriza-tion activity or adsorption under the reaction conditions
We conclude from this that the solubility of hydrocarbonsin Mowry Shale by solution in liquid and solid hydrocar-bons is relatively insignificant under these conditionsMowry Shale in argon thus consumed C2-C4 hydrocar-
bons vigorously and selectively at 75degC over 200 hoursThe same shale in methane totally rejected the same C2-C4
hydrocarbons under the same conditionsMethane ingestion- Fayettville Shale was exposed to nine
sequential cycles of methane pressurization and exhaustionat 100degC Vessels filled with shale were pressurized (450 psi)sealed and slowly vented The shale released only traceamounts of C2 and higher hydrocarbons during exhaus-tion There was no evidence of free methane in the shaleafter these experiments Heating vented samples in Argonat 100degC produced only trace amounts of methane andhigher hydrocarbons substantially less than the originalsampleMethane was indeed consumed by Fayetteville Shale but
not as free methane It appeared in the solid hydrocarbonsin the Rock-Eval S2 peak not in the free hydrocarbon S1peak (Figure 3 and Table 2) Remarkably the shale returnedto its original Rock-Eval composition when exposed to thesame exhaustion experiments in 2 methane Thus thesolid S2 hydrocarbons in Fayetteville Shale had increased in
Time1 2 3 4 5 6
103
102
102
100
10-1
10-2
10-3
Figure 1 n-Butane ingestion in Mowry Shale from argon andmethane Concentrations of hydrocarbons in vials over time (in arbitraryunits) are in Table 1 Blue solid dots are gas concentrations of n-butanein methane (Vial B) and red solid dots are gas concentrations in argon(Vial A) The blue line traces the concentration of n-butane diminishingby 50 with each dilution It is not the regression line for the Vial B dataThe red line is the DED regression line for the Vial A data Data pointsbelow the blue line reflect n-butane ingestion into Mowry Shale
Time
1 2 3 4 5 6
n
-But
ane
5
10
15
20
25
30
35
Figure 2 wt n-Butane in C2-C4 in Vials A and B Concentrations of hydrocarbons in vials over time (in arbitrary units)are in Table 1B Red Vial A (argon) Blue Vial B (methane)
S2S1
300 C 550 C
S2S1
300 C 550 C
Figure 3 Rock-Eval signals for Fayetteville Shale before andafter exposure to methane Upper panel is the FID trace for thestarting shale and the lower panel is the FID trace for the sameshale exposed to 100 methane (Table 2)
Mango Geochemical Transactions 2013 145 Page 4 of 9httpwwwgeochemicaltransactionscomcontent1415
mass by about 50 on exposure to high methane partialpressures and decreased in mass by 50 when exposed tolow methane partial pressures Samples with increased solidhydrocarbon mass showed no evidence of free methaneeither at 300degC in Rock-Eval analysis or at 100degC for onehour in our analysisFayetteville Shale thus consumes methane at 100degC
nearly doubling its S2 mass Mowry Shale consumes n-butane selectively in preference to ethane propane andiso-butane In excess methane methane is consumed tothe exclusion of butane Shales therefore consume lighthydrocarbons by competitive addition to receptors gener-ating high molecular weight hydrocarbons consistent withthe proposed equilibrium between methane carbon andhigher hydrocarbons (Reaction 1)Gas-Solid Equilibrium Kinetic Simulations - Consider a
source rock with free gas of concentration (Cx) where Cx
is a light hydrocarbon containing x carbon atoms It is incommunication with solid hydrocarbon with the capacityto generate (Cx) from some catalytic intermediate [Cx]where [] denotes the concentration of open catalyticsites the receptors noted above [Cx] forms through reac-tion (3) from [Cn] a high molecular weight hydrocarbonbonded to an active site for example (CH2)n-M wheren gt gt x an intermediate discussed elsewhere [10]
Cnfrac12 thorn ⋯frac12 ltfrac14gt Cxfrac12 thorn Cnminusxfrac12 eth3THORNWe shall assume [Cn] and [Cn-x] in reaction 3 are
indistinguishable when n is large (n ~ n-x) and that [Cn] istherefore a constant in the kinetics of [Cx] generation Gasgeneration proceeds through reaction (4) a reversiblereaction [] bonds selectively to various hydrocarbonsand only to hydrocarbons
Cxfrac12 ltfrac14gt Cxeth THORN thorn ⋯frac12 eth4THORN
A hydrogen balance is ignored throughout this schemeAll hydrocarbons in brackets are unsaturated CnH2nand those in parentheses are saturated CnH2n+2 Thusreaction (3) is hydrogen neutral Reaction (4) however isnot and should be ([Cx] + H2 = (Cx) + []) [10] Weassume for simplicity that hydrogen is in excess andthat it moves easily from the pool to [Cx] generating(Cx) and from (Cx) to the pool generating [Cx]Reactions (3) and (4) are within a closed system a sealed
source rock for example Gas escapes confinement throughreaction (5)
Cxeth THORN frac14gt Cx eth5THORNReaction (6) summarizes the kinetic steps interconverting
free gas and solid-state gas as symbolized by [Cx] and [Cn]
Cnfrac12 thorn ⋯frac12 ltfrac14gt Cxfrac12 ltfrac14gt Cxeth THORN thorn ⋯frac12 eth6THORNThe rate of [Cx] generation is proportional to []
[Cn] Because [Cn] is constant and [] becomes constantover time (steady-state) the rate of gas generation fromsolid hydrocarbon is constant over time It will continuegenerating [Cx] and free gas (Cx) until their concentrationsbecome sufficiently high to promote reverse reactions atrates equal to forward reactions At that point reaction(6) is at steady-state (equilibrium) (Cx) and [Cx] are thenat their maximum concentrations and [] is at its mini-mum concentration This is the state of a sealed (closed)source rock in the subsurface We are interested in thedynamics of that system when the rock is opened andreaction (5) is significant How will (Cx) decline overtime when the system is at equilibrium and the rate ofreaction (5) exceeds the rate of generation (reaction 3)Three possibilities are considered in the following kinetic
simulations The first is classical first-order expulsionwithout generation or equilibrium of any kind The kineticmodel thus contains only free in-place gas (Cx) [Cn] [Cx]and [] are all zero In the second (Cx) and [Cx] intercon-vert at equilibrium but [Cn] does not generate [Cx] gasgeneration does not attend gas release in other words Inthe third reaction (6) is fully operative two reservoirs ofgas [Cx] and (Cx) at equilibrium are depleted while [Cx]is generated at a constant rate from [Cn]Each possibility is treated assuming equal rate constants
and equivalent intermediate concentrations Figure 4displays a schematic of the reactions used in the kineticsimulations A small fraction of gas in reservoir A wasremoved by first-order kinetics in each iteration Δ(Cx) =(02(Cx)) and all other concentrations altered accordinglyas described in Figure 3 Thus Δ(Cx) over iterationssimulates expulsion rates over time Δ(Cx) is henceforthreferred to as lsquoratersquo denoted R and iteration as lsquotimersquo(t) Figure 5 shows the decline curves R vs t for threehypothetical rocks In the first (no catalytic activity) R
Table 2 Rock-Eval analysis of Fayetteville Shale beforeand after exposure to methane 450 psi 100degC
Samples S1 S2 S3 TOC Tmax
Starting 42 83 027 335 446
100 CH4 367 1245 028 369 443
2 CH4 356 797 025 335 443
Shale was prepared for analysis by grinding in argon to 60 mesh Three aliquotswere treated as follows Aliquot 1 analyzed directly by Rock-Eval Aliquot 2Rock-Eval analysis after 9 exposures to methane (450 psi 100degC 10 min) Aliquot3 Rock-Eval analysis after 9 exposures to methane (450 psi 100degC 10 min) followedby 5 exposures to 2 methane in helium (450 psi 100degC 10 min) Samples insealed brass containers were pressurized to 450 psi at 100degC for 10 minutes in eachexposure and slowly vented (1 minute) to atmospheric pressure Samples showedno evidence of adsorbed methane after sequential exposures to methane standardgc analysis 1 g shale in 5 ml Ar 100degC 1 hr S1 =mg g-1 volatile hydrocarbonslt 300degC S2 =mg g-1 solid hydrocarbon cracking 350 ndash 550degC S3 =mg CO2 g
-1TOC = organic carbon Values of starting shale are averages of triplicateanalyses with sd S1 plusmn 03 S2 plusmn 03 TOC plusmn 14 TMAX plusmn 3 Values for products aresingle analyses although one (100 CH4) was verified in a second analysisRock-Eval analyses by GeoMark Research Humble Texas
Mango Geochemical Transactions 2013 145 Page 5 of 9httpwwwgeochemicaltransactionscomcontent1415
declines exponentially (ED) as expected thus describingthe straight line on log scale In the equilibrium modelsR declines by double exponential decay (DED) withoutgeneration and by double exponential decay with a constant(DED1) with generation (equation 7) where Rt is theexpulsion rate at time t (R)i is the initial expulsion ratefor free gas (Cx) [R]i is the initial expulsion rate for solidhydrocarbon gas [Cx] and C is the constant for rate ofgeneration from [Cn]
Rt frac14 Reth THORNieminusat thorn Rfrac12 ieminusbt thorn C eth7THORN
Figure 6 shows DED1 curves with different values of Creflecting different levels of generation attending produc-tion Therefore rates of production from source rocksreleasing gas in equilibrium (reaction 6) should decline byDED1 reflecting free gas declining exponentially solid-stategas declining exponentially and generated gas at a constantrate C
Gas production Miller Heirs well Fayetteville Shale -Many gas wells decline classically by simple exponentialdecay but there are notable exceptions mainly in lowporosity-permeability wells including unconventional wells[20-24] Figure 7 shows typical non-classical decay for awell producing from a source rock in this example theMiller Heirs well producing from Fayetteville Shale Theline passing through the data is the DED1 line calculatedfrom the kinetic model in Figure 5 It is not a best-fit
Figure 4 Schematic diagram of kinetic model simulating gasgeneration from gas-solid equilibrium A and B are reservoirscharged with native gas (Cx) is in A and [Cx] is in B (reaction 8)Reservoir C resides in B Open catalytic sites [] reside in C and Bunspecified in diagram Gas passes reversibly between reservoirs asindicated by first-order kinetics (k1 = 007) and by second-order kinetics(k-1 = 0007) for generation of [Cx] Gas passes to the surface from A byfirst-order kinetics controlled by rate constant k2 (02) Catalytic gas isgenerated in C from [Cn] at a constant rate controlled by second-orderrate constant k (00004) considered irreversible in this simulationGenerated gas passes directly into B Each reservoir is filled with aninitial quantity of gas assumed non-depletable in C (100) and depletableby first-order kinetics in A ((Cx) = 200) and B ([Cx] = 200) The initial valueof [] was assumed 5 with all concentrations unitless Reaction 8 wassimulated by iterating kinetic steps by first or second-order changesuntil concentrations of [] [Cx] and (Cx) were constant (steady-state)For example the concentration of [Cx] at iteration ii was [Cx]ii = [Cx]i +(k[ ]i[Cn]) + (k-1(Cx)i[]i)-(k1[Cx]i) All concentrations were similarlycalculated at each iteration
Iterations10 20 30 40 50
(Cx)
103
102
101
100
10-1
10-2
Figure 5 Kinetic simulation of gas-solid equilibrium The kineticscheme in Figure 3 was simulated in 50 iterations with the followingrestrictions Black Curve Reaction 8 where [Cn] = [Cx] = 0 BlueCurve Reaction 8 where [Cn] = 0 Red Curve Reaction 8 Startingconcentrations [] = 5 [Cn] = 100 (constant) [Cx] = 200 (Cx) = 200(400 in first curve) Rate constants 00004 [Cn] = gt [Cx] 007 [Cx] = gt(Cx) 0007 (Cx) = gt [Cx] 02 (Cx) = gt Cx The curves represent 50 firstand second-order iterations For example the concentration of (Cx)on iteration ii is (Cx)ii = (Cx)i + (07[Cx]i) ndash (007(Cx)i) ndash (2(Cx)i)Equations for lines (t = time) black (Cx) = 500 exp(-223 t) blue (Cx) = 224exp(-243 t) + 273 exp(-029 t) red (Cx) = 223exp(-243 t) + 155 exp(-045 t) + 125
0
5
10
15
20
25
30
35
40
0 10 20 30 40 50 60
MM
cfm
on
th
time (months)
k = 016k = 008k = 004k = 0
Figure 6 Effects of generation on double exponential decaycurves from Gas-Solid Equilibrium Kinetic Model The kinetic modelin Figure 3 (modified units) generates the family of DED1 curvesshown with zero-order rate constants for generation from k = 0 tok = 0016 ([Cn] = gt [Cx])
Mango Geochemical Transactions 2013 145 Page 6 of 9httpwwwgeochemicaltransactionscomcontent1415
equation line to the data Showing the theoretical curvesuperimposed on field data in this way illustrates theremarkable fit between theory and field data RegressingMiller Heirs data to DED1 gives an exact fit (R2 = 099)while regressing the data to single exponential decaygives a substantially poorer fit R2 = 084 The constant Cin the DED1 regression equation was significant through-out production accounting for 37 of produced gas at25 monthsRegressing the same data to double exponential decay
without a constant (DED eq 7 where C = 0) gives anequally strong correlation (R2 = 099) however It istherefore impossible to evaluate the constant C from thedata fit to DED1 in Figure 7 If the data has genuinelinearity ndash two sources of gas declining exponentiallyand one constant - then any DED equation that fits thedata between time 0 and n will necessarily underestimatethe data beyond n The DED line will fall exponentiallywhile the data approaches the constant C Therefore thetest for linearity (C) lies beyond n where the respectiveregression curves predict the futureThe Miller Heirs data were regressed between times 0
and 50 months by DED and DED1 The two regressionsgave similar curves with high degrees of correlation tothe data between these time limits (R2 ~ 099) Howeveronly the DED1 equation predicts the Miller Heirs databeyond 50 months (Figure 8) The DED line fall sharplybelow the Miller Heirs data It pojects exponential decline
while the data describes a largely linear rate of declinebeyond 50 months Figure 8 leaves little doubt aboutthe dimensions of decline in this well There are clearlythree and DED1 (eq 9) describes them very well DED1 isthus a property of Miller Heirs production data and thegas-solid hydrocarbon equilibrium model as Figure 7 soclearly illustrates
A New light hydrocarbon generation modelFew question the biological pedigree of higher hydro-carbons (biomarkers) in petroleum [34] Their carbonstructures are precise fits to the carbon skeletons ofbio-precursors Light hydrocarbons between C1 and aboutC10 are different They do not resemble biological parents[25] and they display distinctive patterns in compositionnot seen in the higher hydrocarbons Methane throughbutane (C1-C4) are constrained to thermodynamic equilib-rium [710] and the hexanes and heptanes (C6-C7) displayinvariant compositions [2627] for example A propor-tionality between (n-C6i-C7) and (n-C7i-C6) perhapsthe highest correlation yet reported for hydrocarbonsin crude oils (R2 = 099) illustrates their extraordinarycompositional order [27]It is in this context that methane-solid hydrocarbon
equilibrium must be weighed With methane in equilibriumwith ethane and propane [7] it should come as no surprisethat it would be in equilibrium with the solid hydrocarbonsgenerating it In fact there is a strong possibility that alllight hydrocarbons form along the same path with lighthydrocarbons and solid hydrocarbons at equilibriumIt is illustrated in a new model for light hydrocarbongeneration presented here The model unifies otherwisedisparate elements of light hydrocarbon chemistry naturalgas at thermodynamic equilibrium invariance in the higher
time (months)10 20 30 40 50 60
MM
cfm
onth
0
5
10
15
20
Figure 7 Production decline data for Miller Heirs 1-10H wellproducing from Fayetteville Shale The Millers Heirs well is in theArkoma Basin Arkansas Lease 383264348 January 2006 - August2011 The line passing through the production data is the declinecurve calculated from the kinetic model in Figure 3 with the followingrate constants and initial concentrations (63 iterations) k = 000012k1 = 01 k-1 = 0005 k2 = 016 [Cn] = 100 (constant) [Cx] = 250 (Cx) = 90[] = 5 The rate constants and starting concentrations in Figure 3 werehand-adjusted to these values to approximate the general shape ofthe Miller Heirs data The line is not a best-fit line or the DED1regression line to the data The respective DED1 regression equationsare Miller Heirs data (R2 = 099) R = 207 e-0266t + 671 e-0039t + 150Model Blue line R = 160 e-0197t + 660 e-00526t + 195
time (months)50 52 54 56 58 60 62
MM
cfm
onth
17
18
19
20
21
22
23
24
25
Figure 8 Production data for Millers Heirs wells beyond50 months with regression lines for DED and DED1 between 0and 50 months The data in Figure 6 were regressed to doubleexponential decay with a constant C (DED1) and without a constant(C = 0) (DED) between 0 and 50 months Red line R = 214 e-025t +70 e-0022t Blue line R = 208 e-0263t + 668 e-00364t + 133
Mango Geochemical Transactions 2013 145 Page 7 of 9httpwwwgeochemicaltransactionscomcontent1415
light hydrocarbons ingestion and gas generation duringproduction It does this by bringing light hydrocarbons andsolid hydrocarbons into equilibrium through catalyticintermediates [Cx] and []
Cnfrac12 thorn ⋯frac12 ltfrac14gt Cxfrac12 ltfrac14gt Cx thorn ⋯frac12
[Cx] represents the intermediate shaping product struc-tures and compositions Metathesis of [Cx] brings C1 to C4
to equilibrium [10] and molecular rearrangements of [Cx]bring C5 to C7 isomers to invariance [2627] Ingestionwhich links methane to [Cx] and thus to solid hydrocar-bons is the critical step in the proposed methane-solidhydrocarbon equilibrium Mowry and Fayetteville Shalesingest light hydrocarbons in substantial amounts and withhigh selectivity Mowry Shale in argon with open receptorsingests C2-C4 hydrocarbons vigorously and the same shalein methane with pacified receptors totally rejects the samehydrocarbons under the same conditions (Figures 1 and 2)Generation and storage is expressed in the model through[Cn] + [] lt = gt [Cx] It accounts for the linearity in doubleexponential decay decline curves (Figures 7 amp 8) Thuseach component of the general equilibrium model hasempirical supportMost catalytic reactions are reversible and approach
thermodynamic equilibrium over time (residence time)It therefore follows that C1-C4 hydrocarbons residing inclosed source rocks over geologic time will be at molecularand isotopic thermodynamic equilibrium and steady statewith respect to compositional change However oncethe rock is opened and old hydrocarbons escape newhydrocarbons will be generated and their residence timescan be on the order of hours C1-C4 could then be removedfrom equilibrium and the C6 and C7 hydrocarbons typicallyconstrained to constant compositions including metastableequilibria [26-28] displaced from these compositions aswell In other words molecular and isotopic compositionsof hydrocarbons generated at steady state can be distinctfrom hydrocarbons generated at pre-steady state Ourresearch has focused on hydrocarbons generated at steadystate over geologic time There is less know about pre-steady state because there have been fewer opportunitiesto find and analyze pre-steady state products Howeverwe have encountered oils from conventional reservoirswith bizarre C6 and C7 distributions consistent with pre-steady state kinetics at the onset of oil generation [29]Unconventional production from source rocks offersopportunities for finding similar pre-steady state hydrocar-bons Compositions could transition between states in earlyproduction capturing molecular and isotopic biases onlyrarely seen in conventional reservoirs The laboratory forfinding evidence of that transition is in the field fromwells producing oil and gas from source rocks where thetransition might be captured and analyzed
ConclusionsProduction rates declining by DED1 is not in itselfsignificant But the coincidence of theory and data inFigure 6 is It implicates gas-solid hydrocarbon equilibriain the production of gas from Fayetteville ShaleIngestion gives the hypothesis additional and independent
support First it is unprecedented Light hydrocarbons reactwith solid hydrocarbons in source rocks under conditionswhere they do not react with ordinary solid hydrocarbonsMethane perhaps the least reactive hydrocarbon knowndisappears in Fayetteville Shale at 100degC leaving no trace ofCH4 It does not emerge in RockEval analysis in the S1 peakat 300degC but later as some higher hydrocarbon in the S2peak at 443degC (Table 2) Methane thus becomes part of thesolid hydrocarbon ingesting it C1 + [] = gt [C1] Thereactions between C1-C4 hydrocarbons and Mowry Shaleat 70degC are equally striking Adamantanes like methane inthermal stability and reactivity become highly reactive oncarbon surfaces [30] Solid hydrocarbons in source rocksare not ordinary hydrocarbons They possess receptorsperhaps catalytic that react with light hydrocarbons atlow temperatures generating solid hydrocarbons of greatermass The Miller Heirs field data and the ingestion resultsreported here make a substantial case for methane andsolid hydrocarbons in equilibrium in source rocks The factthat a general equilibrium also accounts for other proper-ties of light hydrocarbons - natural gas at thermodynamicequilibrium and higher hydrocarbons in constant composi-tions ndash makes that case even stronger The capacity ofsolid hydrocarbons to ingest gas reported here raisesthe possibility of substantially more gas in shales thananalytically apparent and far more gas in shale depositsthan currently recognizedOnly the question of reversibility and perhaps generation
remain Catalysis would seem a given since methane couldnot react with solid hydrocarbon at 70degC (Table 1) withoutcatalytic assistance It is in my view extremely unlikelythat methane could be found in equilibrium with ethaneand propane in reservoir rocks [7] and not have been inequilibrium with solid hydrocarbons in source rocks TheMiller Heirs production curve in Figure 7 suggests that itis and that gas generated from solid hydrocarbons sustainsproduction over time (Figure 8) That possibility becomesnear certainty should hydrocarbons produced from sourcerocks transition from steady state to pre-steady state andthose produced from conventional reservoirs do not
Competing interestsThe author declares that there are no competing interests
AcknowledgementsAuthor thanks Petroleum Habitats and Worldwide Geochemistry for theirgenerous support
Received 4 June 2013 Accepted 5 December 2013Published 12 December 2013
Mango Geochemical Transactions 2013 145 Page 8 of 9httpwwwgeochemicaltransactionscomcontent1415
References1 Evans CR Rogers MA Bailey NJL Evolution and alteration of petroleum in
western Canada Chem Geol 1971 8147ndash1702 McNab JG Smith PV Betts RL The evolution of petroleum Petrol Eng
Chem 1952 442556ndash25633 Tissot BP Welte DH Petroleum Formation and Occurrence New York Springer 19844 Hunt JM Petroleum Geochemistry and Geology New York Freeman 19955 Mango FD The stability of hydrocarbons under time-temperature
conditions of petroleum genesis Nature 1991 352146ndash1486 Mango FD Methane concentrations in natural gas the genetic
implications Org Geochem 2001 321283ndash12877 Mango FD Jarvie DM Herriman E Natural gas at thermodynamic equilibrium
implications for the origin of natural gas Geochem Trans 2009 1068 Mango FD Jarvie DM Low-temperature gas generation from marine
shales Geochem Trans 2009 1039 Mango FD Jarvie DM The low-temperature catalytic path to natural gas
wet gas to dry gas over experimental time Geochem Trans 2009 101010 Mango FD Jarvie DM Metathesis in the generation of low-temperature
gas in marine shales Geochem Trans 2010 11111 Mango FD Jarvie DM Herriman E Natural catalytic activity in a marine
shale for generating natural gas Proc Roy Soc A 2010 4663527ndash353712 Lewan MD Korarba MJ Wueckaw D Iestrzynski A Evaluating transition-metal
catalysis in gas generation from Permian Kupferscheifer by hydrouspyrolysis Geochica Cosmochim Acta 2008 724069ndash4093
13 Parnell J Native platinum in pyrobitumen from Fonda New YorkAm Mineral 1988 731170ndash1171
14 Yen TF Chemical aspects of metals in native petroleum In The Role ofTrace Metals in Petroleum Ann Arbor MI Ann Arbor Science Publishers Inc19751ndash30
15 Pan C Jiang L Liu J Zhang S Zhu G The effects of pyrobitumen on oilcracking in confined pyrolysis experiments Org Geochem 2012 4529ndash47
16 Alexander R Berwick LJ Pierce K Single carbon surface reactions of1-octadecene and 236-trimethylphenol on activated carbon implicationsfor methane formation in sediments Org Geochem 2011 42540ndash547
17 Somorjai GA Introduction to Surface Chemistry and Catalysis New York JohnWiley amp Sons 1994489
18 Plambeck JA Introductory University Chemistry I Solutions and Solubility ofGases 2013 wwwchemualbertacacoursesplambeckp101pou82htm
19 Pines H The Chemistry of Catalytic Hydrocarbon Conversions New YorkAcademic 19816
20 Arps JJ Analysis of decline curves Trans AIME 1945 160228ndash24721 Raghavan R Behavior of wells completed in multiple producing zones SPEFE
1989219ndash23022 Fetkovich MJ Works AM Thrasher TS Bradley MD Depletion performance of
layered reservoirs without crossflow SPEFE 199023 Ilk D Rushing JA Perego AD Blasingame TA Exponential vs hyperbolic
decline in tight gas sands ndash Understanding the origin and implications forreserve estimates using Arpsrsquo decline curves paper SPE 116731 presented2008 Annual Technical Conference amp Exhibition Denver CO 2008
24 Valko PP Lee J A better way to forecast production from unconventional gaswells paper SPE 134231 presented 2010 Annual Technical Conference ampExhibition Florence Italy 2010
25 Mango FD The light hydrocarbons in petroleum a critical review OrgGeochem 1997 26417ndash440
26 Mango FD An invariance in the isoheptanes of petroleum Science 1987237514ndash517
27 Mango FD The origin of light hydrocarbons Geochim Cosmochim Acta2000 641265ndash1277
28 Helgeson HC Knox AM Owens CE Shock EI Petroleum oil field watersand authigenic mineral assemblages are they in metastable equilibriumin hydrocarbon reservoirs Geochim Cosmochim Acta 1993 573295ndash3339
29 Mango FD Pre-steady state kinetics at the onset of oil generationOrg Geochem 1990 1641ndash48
30 Berwick L Alexander R Pierce K Formation and reactions of alkyl adamantanesin sediments carbon surface reactions Org Geochem 2011 42752ndash761
doi1011861467-4866-14-5Cite this article as Mango Methane and carbon at equilibrium in sourcerocks Geochemical Transactions 2013 145
Submit your next manuscript to BioMed Centraland take full advantage of
bull Convenient online submission
bull Thorough peer review
bull No space constraints or color figure charges
bull Immediate publication on acceptance
bull Inclusion in PubMed CAS Scopus and Google Scholar
bull Research which is freely available for redistribution
Submit your manuscript at wwwbiomedcentralcomsubmit
Mango Geochemical Transactions 2013 145 Page 9 of 9httpwwwgeochemicaltransactionscomcontent1415
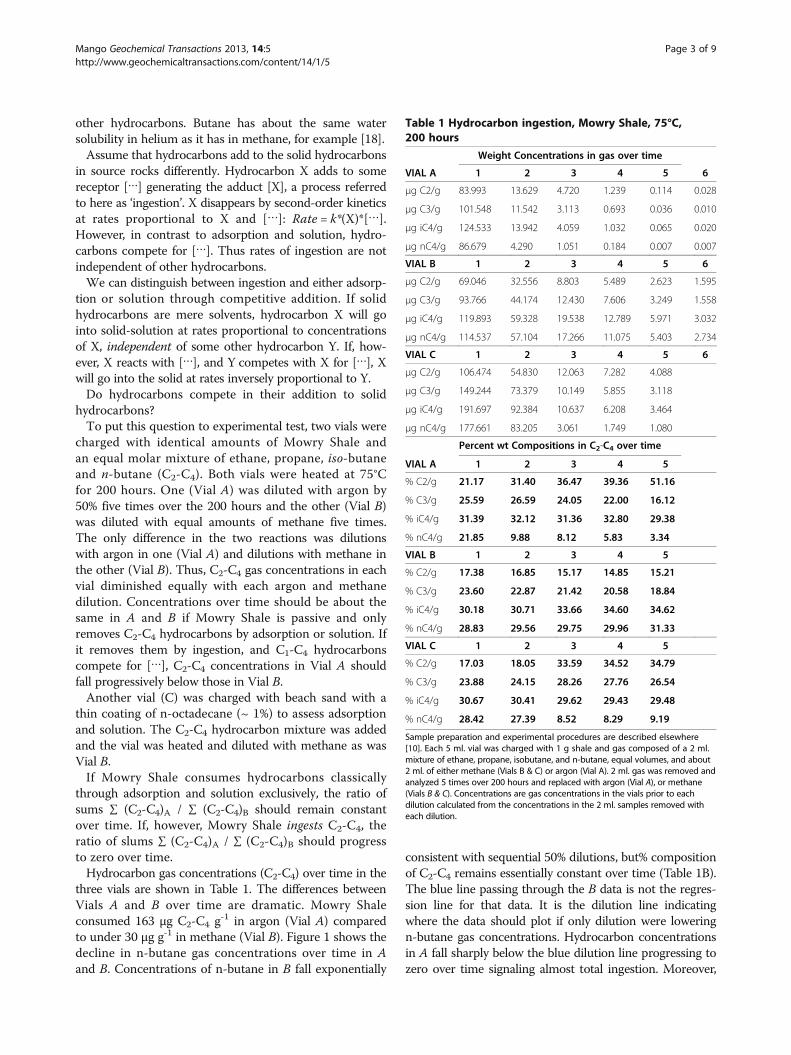