Embed Size (px)
DESCRIPTION
This is Information about metastock
Citation preview
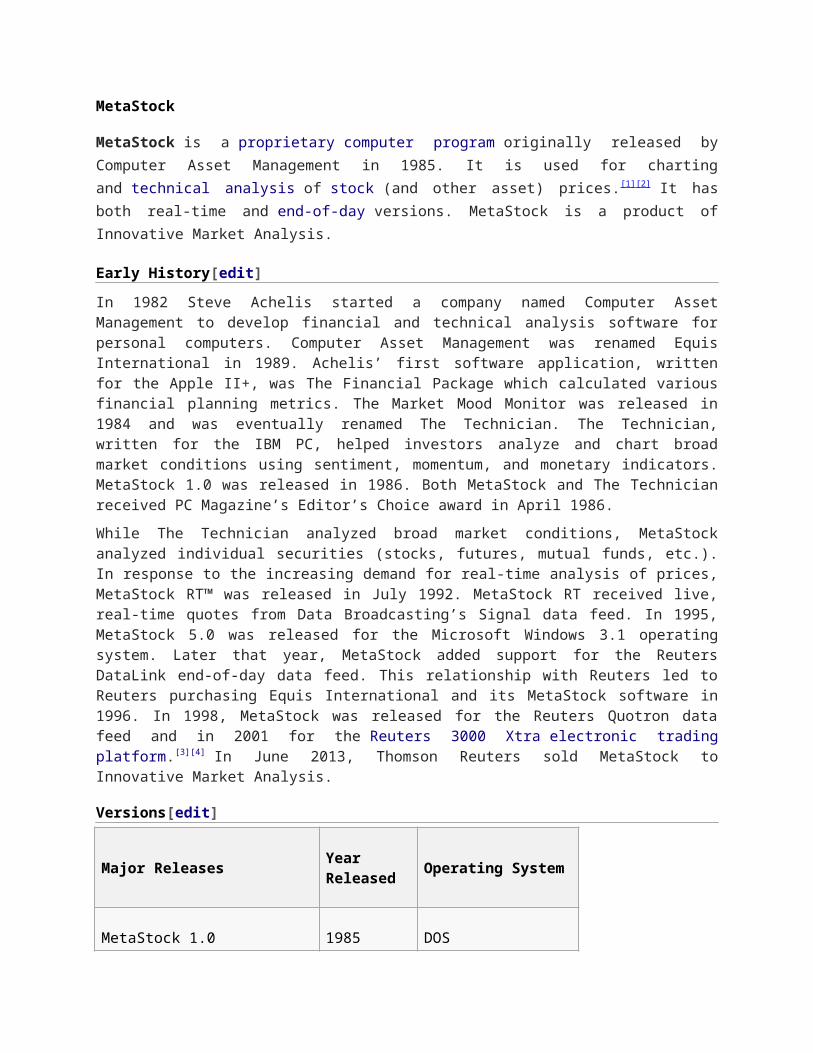
MetaStock
MetaStock is a proprietary computer program originally released by Computer Asset Management in 1985. It is used for charting and technical analysis of stock (and other asset) prices.[1][2] It has both real-time and end-of-day versions. MetaStock is a product of Innovative Market Analysis.
Early History[edit]
In 1982 Steve Achelis started a company named Computer Asset Management to develop financial and technical analysis software for personal computers. Computer Asset Management was renamed Equis International in 1989. Achelis’ first software application, written for the Apple II+, was The Financial Package which calculated various financial planning metrics. The Market Mood Monitor was released in 1984 and was eventually renamed The Technician. The Technician, written for the IBM PC, helped investors analyze and chart broad market conditions using sentiment, momentum, and monetary indicators. MetaStock 1.0 was released in 1986. Both MetaStock and The Technician received PC Magazine’s Editor’s Choice award in April 1986.
While The Technician analyzed broad market conditions, MetaStock analyzed individual securities (stocks, futures, mutual funds, etc.). In response to the increasing demand for real-time analysis of prices, MetaStock RT™ was released in July 1992. MetaStock RT received live, real-time quotes from Data Broadcasting’s Signal data feed. In 1995, MetaStock 5.0 was released for the Microsoft Windows 3.1 operating system. Later that year, MetaStock added support for the Reuters DataLink end-of-day data feed. This relationship with Reuters led to Reuters purchasing Equis International and its MetaStock software in 1996. In 1998, MetaStock was released for the Reuters Quotron data feed and in 2001 for the Reuters 3000 Xtra electronic trading platform.[3][4] In June 2013, Thomson Reuters sold MetaStock to Innovative Market Analysis.
Versions[edit]
Major Releases Year Released Operating System
MetaStock 1.0 1985 DOS
MetaStock 2.0 1987 DOS
MetaStock 3.0 1989 DOS
MetaStock 4.0/4.5 RT 1992 DOS

MetaStock 5.0 1995 Windows 3.1
MetaStock 6.0 1996 Windows95/NT
MetaStock 6.5 1997 Windows95/NT
MetaStock 6.5 for Quotron 1998 Windows95/NT
MetaStock 6.5 for Reuters Terminal 1998 Windows95/98/NT
MetaStock 7.0 1998 Windows95/98/NT
Reuters MetaStock Pro 7.1 2001 Windows95/98/NT/2000
MetaStock 8.0 2002 Windows 2000/XP
MetaStock 9.0 2004 Windows 2000/XP
MetaStock 10.0 2006 XP
MetaStock 10.1 2007 XP/Vista
MetaStock 11.0 2008 Windows XP/Vista/7
MetaStock 12.0 2012 Windows XP/Vista/7/8
MetaStock 13.0 2013 Windows XP/Vista/7/8
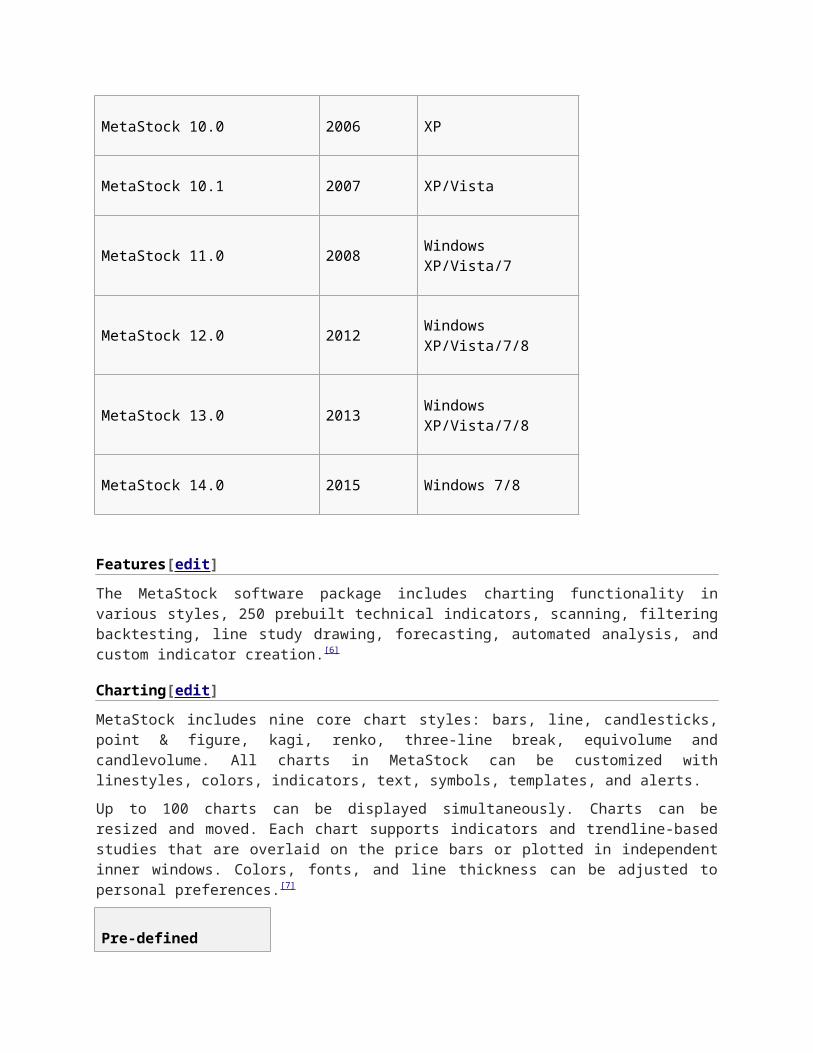
MetaStock 14.0 2015 Windows 7/8
Features[edit]
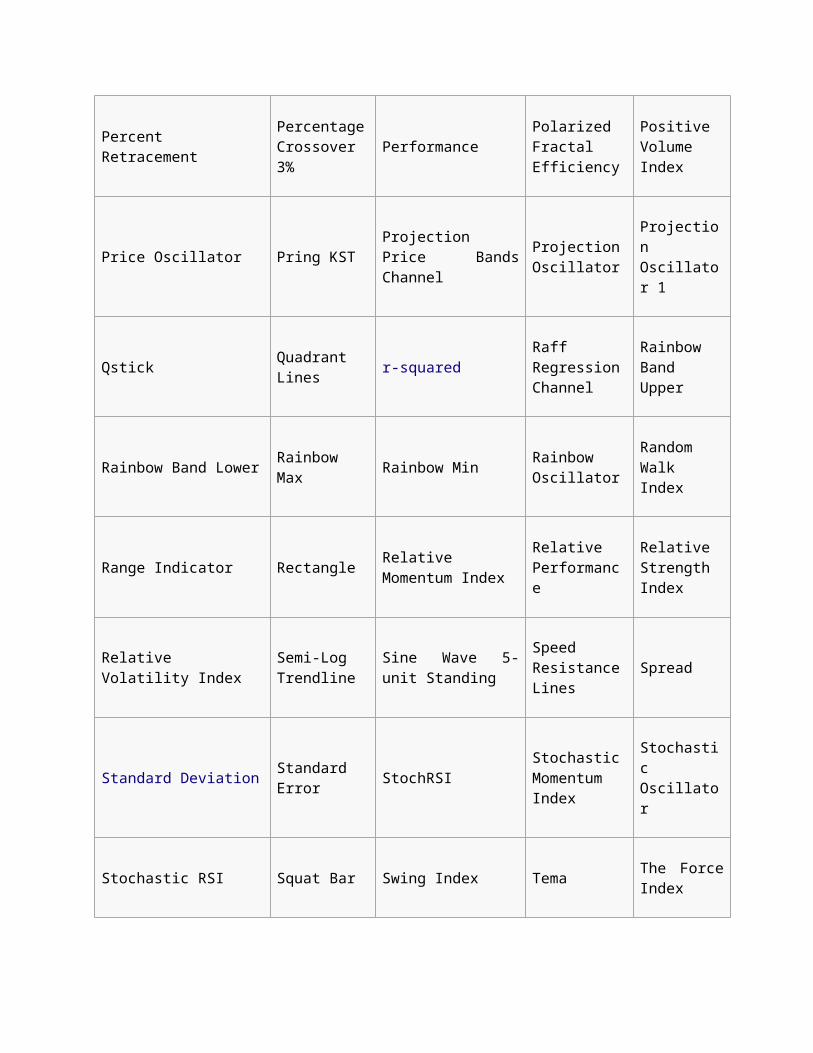
The MetaStock software package includes charting functionality in various styles, 250 prebuilt technical indicators, scanning, filtering backtesting, line study drawing, forecasting, automated analysis, and custom indicator creation.[6]
Charting[edit]
MetaStock includes nine core chart styles: bars, line, candlesticks, point & figure, kagi, renko, three-line break, equivolume and candlevolume. All charts in MetaStock can be customized with linestyles, colors, indicators, text, symbols, templates, and alerts.
Up to 100 charts can be displayed simultaneously. Charts can be resized and moved. Each chart supports indicators and trendline-based studies that are overlaid on the price bars or plotted in independent inner windows. Colors, fonts, and line thickness can be adjusted to personal preferences.[7]
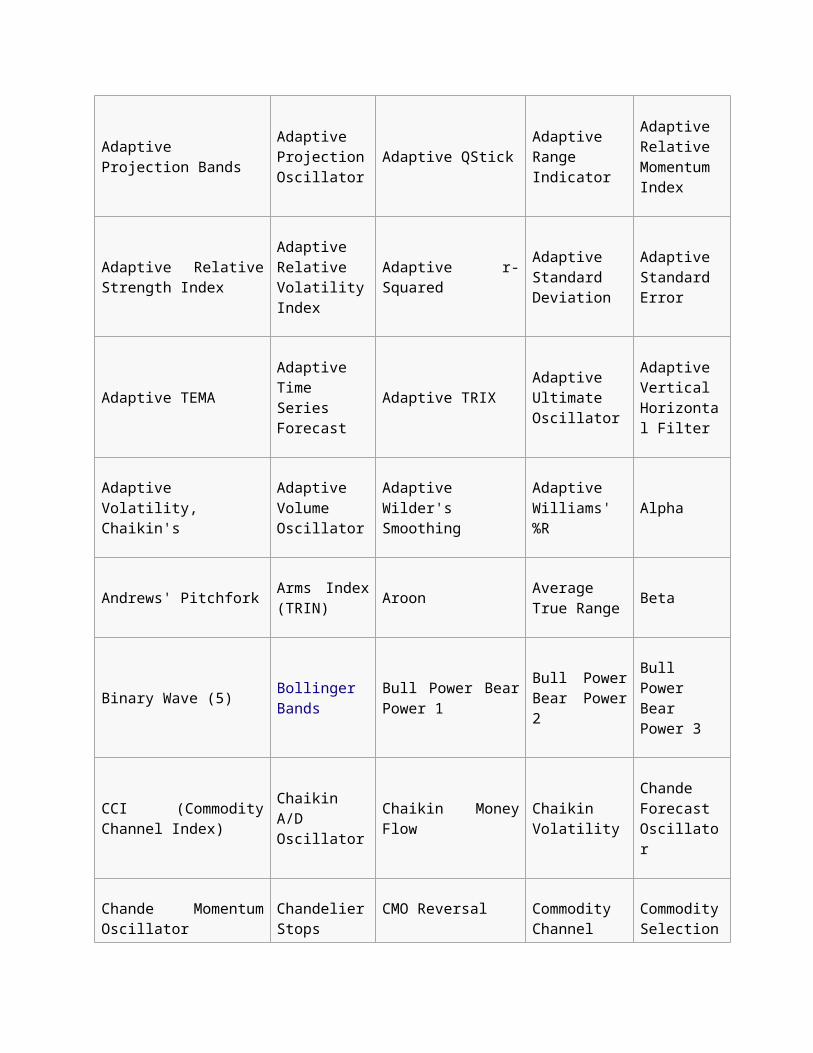
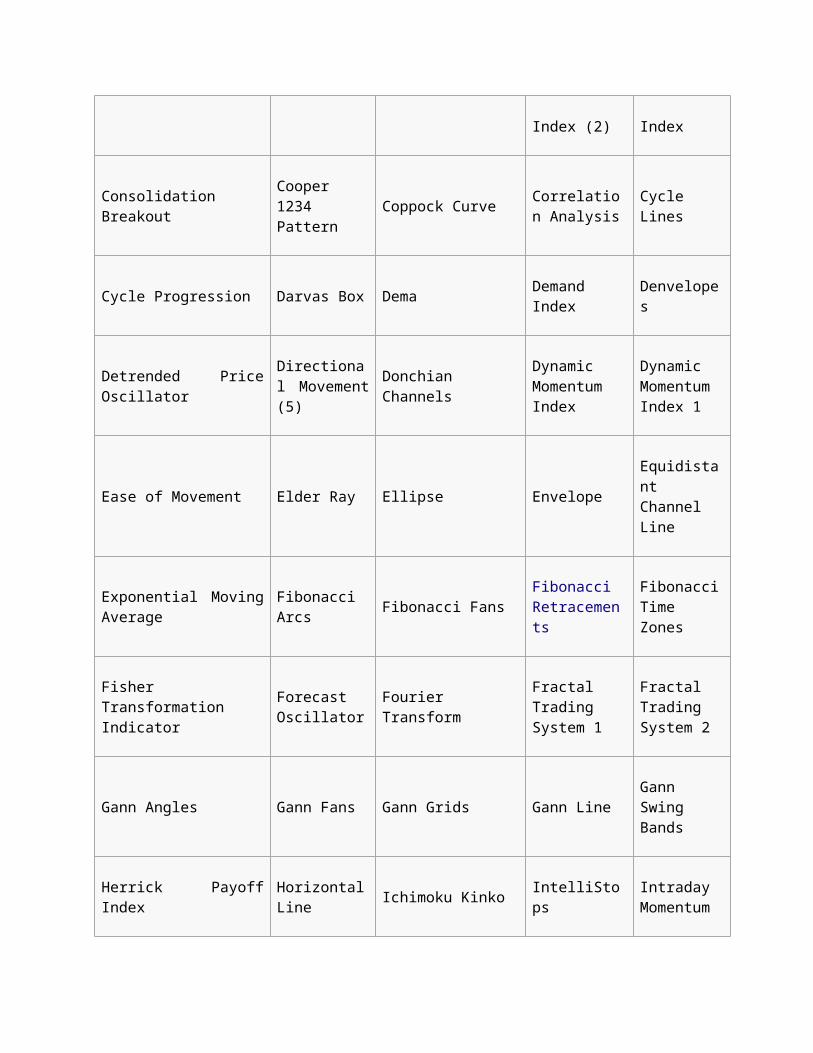
Pre-defined Indicators in MetaStock
Accumulation/DistributionAccumulation Swing Index
Adaptive Aroon
Adaptive Average Directional Movement
Adaptive Average Directional Movement
Adaptive Average True Range
Adaptive CCIAdaptive Chaikin Money Flow
Adaptive Chande Momentum Oscillator
Advance Decline Line
Adaptive Detrended Price Oscillator
Adaptive Directional Movement +/- DI
Adaptive Directional Movement Index
Adaptive Directional Movement Rating
Adaptive Ease of Movement
Adaptive Inertia Adaptive Adaptive Linear Adaptive Linear Adaptive

Intraday Momentum Index
Regression IndicatorRegression Slope
MACD
Adaptive Mass IndexAdaptive Mesa Sine Wave
Adaptive Money Flow Index
Adaptive Moving Average
Adaptive Moving Average Exponential
Adaptive Moving Average Simple
Adaptive Moving Average Weighted
Adaptive Polarized Fractal Effiency
Adaptive Price Oscillator
Adaptive Price Rate-of-Change
Adaptive Projection BandsAdaptive Projection Oscillator
Adaptive QStickAdaptive Range Indicator
Adaptive Relative Momentum Index
Adaptive Relative Strength Index
Adaptive Relative Volatility Index
Adaptive r-SquaredAdaptive Standard Deviation
Adaptive Standard Error
Adaptive TEMAAdaptive Time Series Forecast
Adaptive TRIXAdaptive Ultimate Oscillator
Adaptive Vertical Horizontal Filter
Adaptive Volatility, Chaikin's
Adaptive Volume Oscillator
Adaptive Wilder's Smoothing
Adaptive Williams' %R
Alpha
Andrews' Pitchfork Arms Index Aroon Average True Beta
(TRIN) Range
Binary Wave (5) Bollinger BandsBull Power Bear Power 1
Bull Power Bear Power 2
Bull Power Bear Power 3
CCI (Commodity Channel Index)
Chaikin A/D Oscillator
Chaikin Money FlowChaikin Volatility
Chande Forecast Oscillator
Chande Momentum Oscillator
Chandelier Stops
CMO ReversalCommodity Channel Index (2)
Commodity Selection Index
Consolidation BreakoutCooper 1234 Pattern
Coppock CurveCorrelation Analysis
Cycle Lines
Cycle Progression Darvas Box Dema Demand Index Denvelopes
Detrended Price OscillatorDirectional Movement (5)
Donchian ChannelsDynamic Momentum Index
Dynamic Momentum Index 1
Ease of Movement Elder Ray Ellipse EnvelopeEquidistant Channel Line
Exponential Moving Average
Fibonacci Arcs Fibonacci FansFibonacci Retracements
Fibonacci Time Zones
Fisher Transformation Indicator
Forecast Oscillator
Fourier TransformFractal Trading System 1
Fractal Trading System 2
Gann Angles Gann Fans Gann Grids Gann LineGann Swing Bands
Herrick Payoff Index Horizontal Line Ichimoku Kinko IntelliStopsIntraday Momentum
Inverse Fisher Transform of RSI
Klinger Oscillator
Linear RegressionLinear Regression Lines
Linear Regression Slope
Long Sell Short Sale - 5 Day MACD (2) MACD Histogram 1MACD Histogram 2
Market Facilitation Index
McClellan OscillatorMcClellan Summation Index
Meisels Overbought/Oversold
Median PriceMESA Sine Wave
MomentumMoney Flow Index
Moving Average - Simple
Moving Average - Exponential
Moving Average - Weighted
Moving Average - Time Series
Moving Average - Triangular
Moving Average - Ribbon
Moving Average - Variable
Moving Average - Volume Adjusted
Natenberg's Volatility (Daily)
Negative Volume Index
Odds Probability Cones
On Balance Volume
Open Interest
Option DeltaOption Expiration
Option Gamma Option Life Option Price
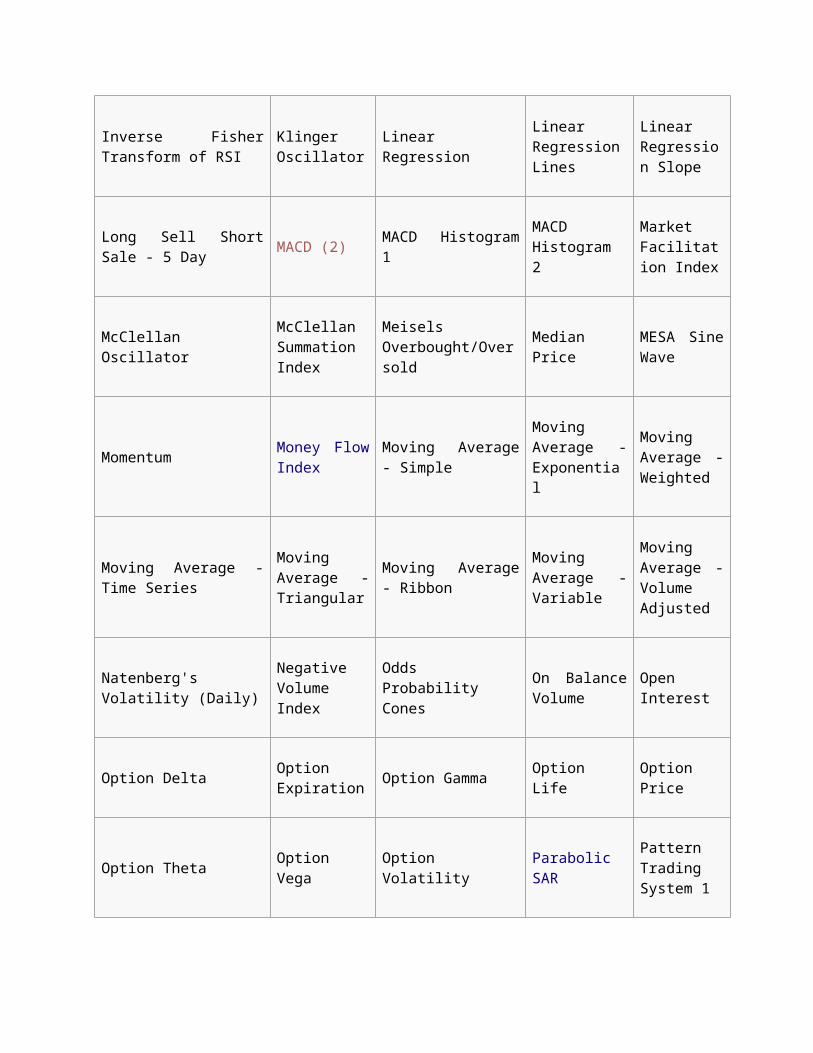
Option Theta Option Vega Option Volatility Parabolic SARPattern Trading System 1
Percent RetracementPercentage Crossover 3%
PerformancePolarized Fractal Efficiency
Positive Volume Index
Price Oscillator Pring KSTProjection Price Bands Channel
Projection Oscillator
Projection Oscillator 1
Qstick Quadrant Lines r-squaredRaff Regression Channel
Rainbow Band Upper
Rainbow Band Lower Rainbow Max Rainbow MinRainbow Oscillator
Random Walk Index
Range Indicator RectangleRelative Momentum Index
Relative Performance
Relative Strength Index
Relative Volatility IndexSemi-Log Trendline
Sine Wave 5-unit Standing
Speed Resistance Lines
Spread
Standard Deviation Standard Error StochRSIStochastic Momentum Index
Stochastic Oscillator
Stochastic RSI Squat Bar Swing Index TemaThe Force Index
Time Series Forecast Tirone Levels Trade Volume Index TrendlinesTrendline by Angle
TRIXTurtle Trader Bands
Typical PriceUltimate Oscillator
Vertical Horizontal Filter
Vertical LineVolatility Breakout (Chaikin)
Volatility Indicators (3) VolumeVolume Oscillator
Volume Rate of ChangeWeighted Close
Wilder's SmoothingWilliams' A/D, %R
Zig Zag
Scanning and Filtering[edit]
The MetaStock Explorer allows traders to scan through thousands of securities using trading criteria to find the ones that fit their specific strategy. Explorations are written using the MetaStock Formula Language. Traders can base their explorations off of the pre-built criteria included with MetaStock or they can use their own criteria. For example, a pre-built scan is included that shows a report of securities that are trading above their 200-day moving average. Another shows securities that have triggered a buy signal based on the MACD indicator. Explorations can be linked so that the filtered results of one exploration can subsequently be filtered by another.[9]
Backtesting[edit]
The Enhanced System Tester allows traders to create, back-test, compare, and optimize trading strategies before risking money in the markets. System tests are written using an extended version of the MetaStock Formulas Language. Backtesting answers the question, “How much would I make or lose if I traded this security or these securities using these buy and sell rules?” Traders can change and edit conditions such as entry, exit, stops, order sizes, and commissions to make the simulation more realistic. The buy and sell conditions can be optimized in order to show the best performing parameters. For example, by optimizing, a trader can learn which moving average performed the best for IBM over the last five years.[10]
Automated Chart Analysis[edit]
The Expert Advisor reveals the interpretive analysis of industry professionals through alerts, commentary, symbols and trends. MetaStock allows for various types of alerts; from simple price and

volume to complex indicator triggers and multiple conditions that show buy and sell signals. The expert commentary offered by MetaStock shows how experts would assess the chart being viewed. For example, a pre-built expert for MetaStock shows how Bollinger Bandswould be interpreted according to John Bollinger’s rules. The expert automatically alerts the user to special conditions using buy and sell arrows, text, audio, or video according to the analysis criteria.[11]
Custom Indicators[edit]
The MetaStock indicator builder is a formula writing module with a wide array of math and investing functions. Custom indicators are created by combining one or more formulas written in the MetaStock Formula Language. This language is somewhat similar to Microsoft Excel formulas. Custom indicators can be referenced by system tests, explorations, and expert advisors with the fml() function.[12]
Formula Language[edit]
Custom indicators, system tests, explorations, and expert advisors are written using the MetaStock Formula Language. Loosely patterned after the Microsoft Excel formula language, the MetaStock Formula Language is tailored to the mathematics of technical analysis. There are 267 functions. Formulas can contain up to 2,500 characters (1,024 in the System Tester).
A formula that computes the difference between a 39-day and 200-day simple moving average is shown below:
mov(close, 39, simple) – mov(close, 200, simple)
Formulas can also contain conditional statements using IF/THEN/ELSE as shown below:
If(close > mov(close,200,exponential),1, -1)
This would read as “if the close is greater than a 200-day exponential moving average then plot a 1, else plot a -1. Formulas can use variables as shown below:
X:= 39; Y:=200; mov(close, X, simple) – mov(close, Y, simple)
Formulas can prompt the user for input when plotted as follows: X:= Input(“How many periods for the moving average?”, 10, 200, 40); Mov(close,X,simple)
In this example, the variable X can range from 10 to 200; it has a default value of 40. The value represented by the variable X is substituted in the moving average formula.[13]
Forecasting[edit]
A new tool called The Forecaster was introduced with MetaStock version 13.0. This tool uses statistical analysis and other methods to analyze past events in order to forecast future price moves. This power tool is on par with the System Tester, Explorer and Expert Advisor and is accessible from MetaStock's Power Console. The primary mechanism for viewing forecasted prices with The Forecaster is with the patent-pending “Forecast Cloud”. The cloud allows you visualize high probability future price movement through an analysis of price action following past events (i.e.,. moving average crossovers, indicator overbought/oversold conditions, candlestick patterns, etc.). When version 14.0 was released the ability to forecast based on patterns (either hand drawn or copied from the chart) was introduced.
The forecast cloud can be overlaid directly on a chart to help see how the forecast performed in the past following each event. A forecast cloud can be projected beyond the most recent day in order to see projected price movement into the future thereby allowing traders to set profit targets, stops, etc. for better trade management. A detailed statistical report shows specific probabilities for forecasted prices including margin of error, standard deviation and other metrics.
67 built-in Event Recognizers include volatility-based indicators like Bollinger Bands and Chaikin A/D, momentum-based indicators like RSI and Stochastics, trend-based indicators like MACD, a variety of Moving Averages, and popular candlestick patterns.
Data Feeds[edit]
MetaStock uses data feeds provided by Thomson Reuters LLC. The end-of-day software uses Reuters DataLink. Reuters DataLink provides data from all of the world’s major markets including North America, Europe, and Asia. Users can access an unlimited number of instruments for charts, system testing, and explorations. Historical data coverage begins in 1980 for North American equities, indices, and mutual funds and as far back as 1973 for some futures. International data goes back at least five years.
Prior to MetaStock 12.0, MetaStock accessed Thomson Reuter’s BDN (Bridge Data Network) data feed. BDN data was broken into three regional packages: North/South America, Europe, Middle East and Africa, and Asia/Pacific. All regions came with FOREX data. BDN brought both end-of-day and real-time market data to MetaStock Pro users. Historical data included with BDN went back as far as 25 years. A real time news feed was included with subscriptions. News came from Reuters, Dow Jones, Factiva and hundreds of other sources.[14]
The XENITH real-time datafeed replaced the BDN datafeed beginning with MetaStock Pro 12.0. The XENITH datafeed is a retail variant of the institutional level Eikon datafeed. MetaStock 12.0 continues to work with the Reuters DataLink feed.
File Format[edit]
Data records for MetaStock include up to 11 fields including: Date, Trade time, Name, Ticker, Open price, High price, Low price, Close price, Volume, and Open Interest.
The legacy (pre-12.0) MetaStock file format is a binary file format and originated from the Computrac file format. There are four files associated with the format: MASTER, EMASTER, XMASTER, F*DAT, and F*.MWD.
Prior to version 12.0, MetaStock provided a utility for converting data to and from various formats including ASCII, Excel, Lotus 1-2-3 and TC2000. In Metastock 12 this utility was removed.[15] MetaStock 12 cannot read legacy MetaStock file format files stored locally on the user's drive. MetaStock 12.0 and beyond access data through a live, direct connection from Thomson Reuters feeds (DataLink for end-of-day daily data and XENITH for real-time intraday data).
With MetaStock 13.0, local data access was reintroduced. In addition to accessing live data through a direct connection with Thomson Reuters feeds, MetaStock 13.0 will natively read locally stored Comma-Separated-Value (CSV) files.