Embed Size (px)
Citation preview
Metals Removal in Conventional Wastewater Treatment Process
and Membrane Bioreactor Process
Pardi Sukapanpotharam Bob Bucher
King County Department of Natural Resources and ParksWastewater Treatment Division
Presentation Objectives
Present metal removal efficiency data from MBR pilot plants.
Compare metal removal efficiency between MBR pilots and conventional treatment.
Discuss the effect of process configuration and operating conditions on the metal removal efficiency.
3
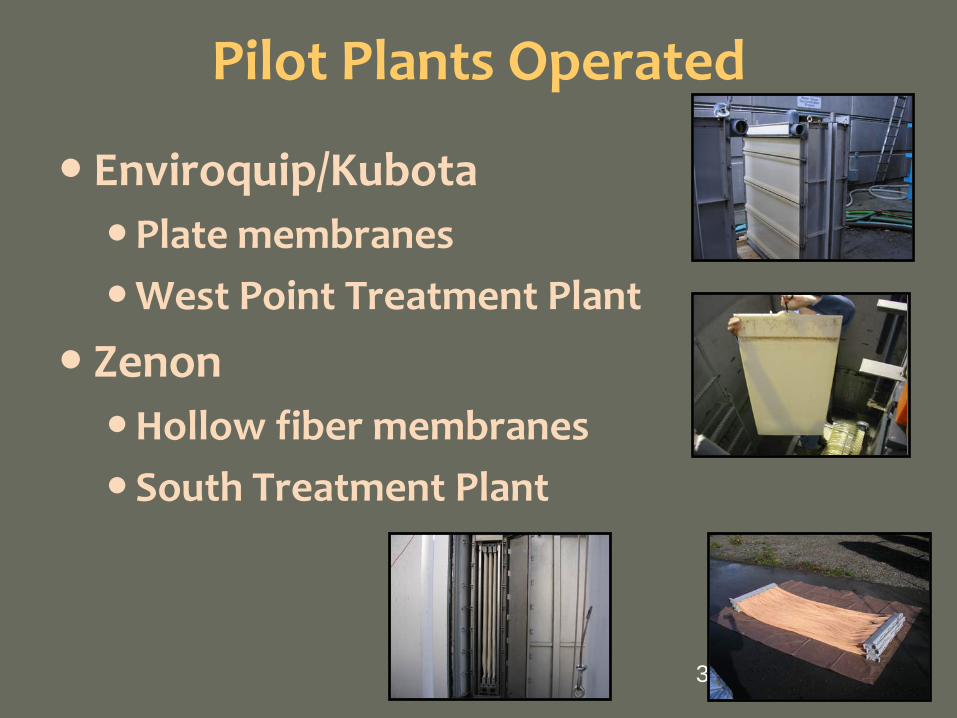
Pilot Plants Operated
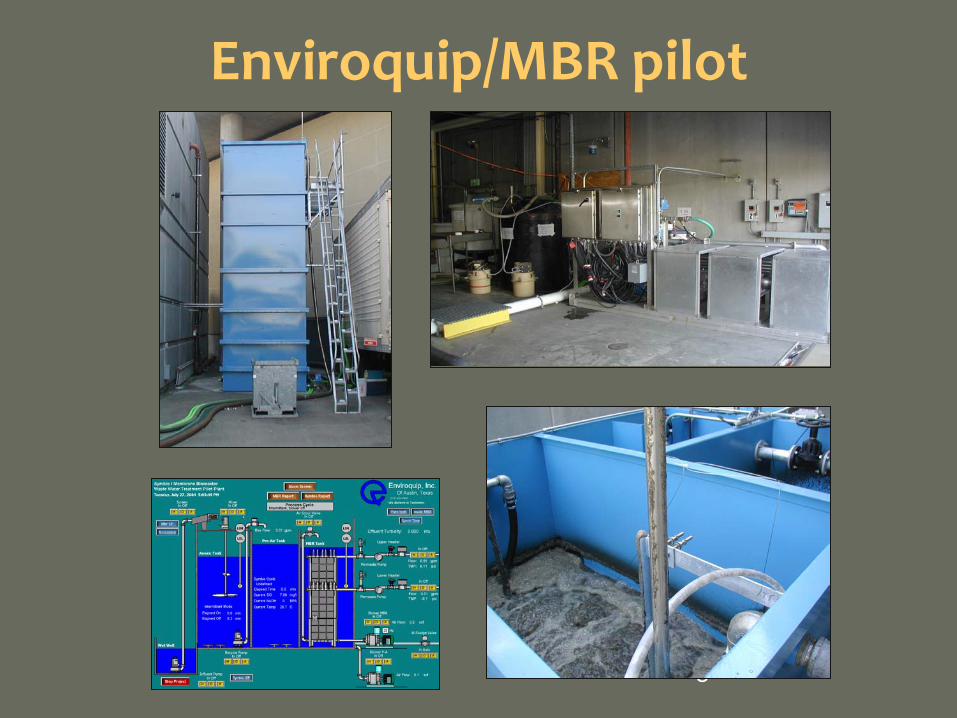
Enviroquip/Kubota Plate membranesWest Point Treatment Plant
ZenonHollow fiber membranesSouth Treatment Plant
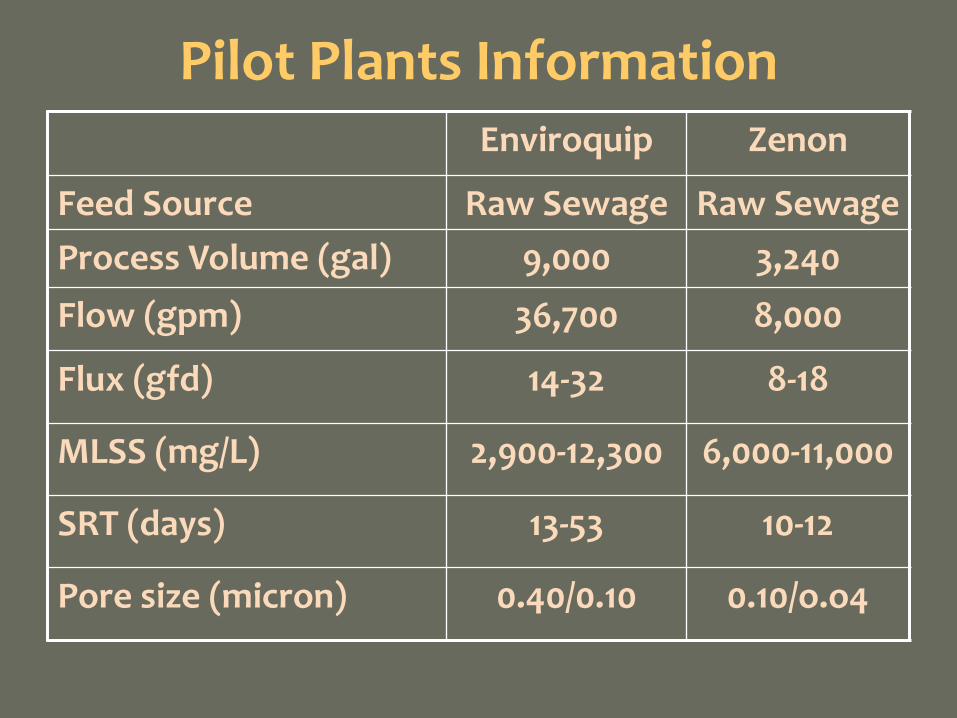
Pilot Plants InformationEnviroquip Zenon
Feed Source Raw Sewage Raw SewageProcess Volume (gal) 9,000 3,240
Flow (gpm) 36,700 8,000
Flux (gfd) 14-32 8-18
MLSS (mg/L) 2,900-12,300 6,000-11,000
SRT (days) 13-53 10-12
Pore size (micron) 0.40/0.10 0.10/o.o4
5
Enviroquip/MBR pilot

6
Zenon Pilot

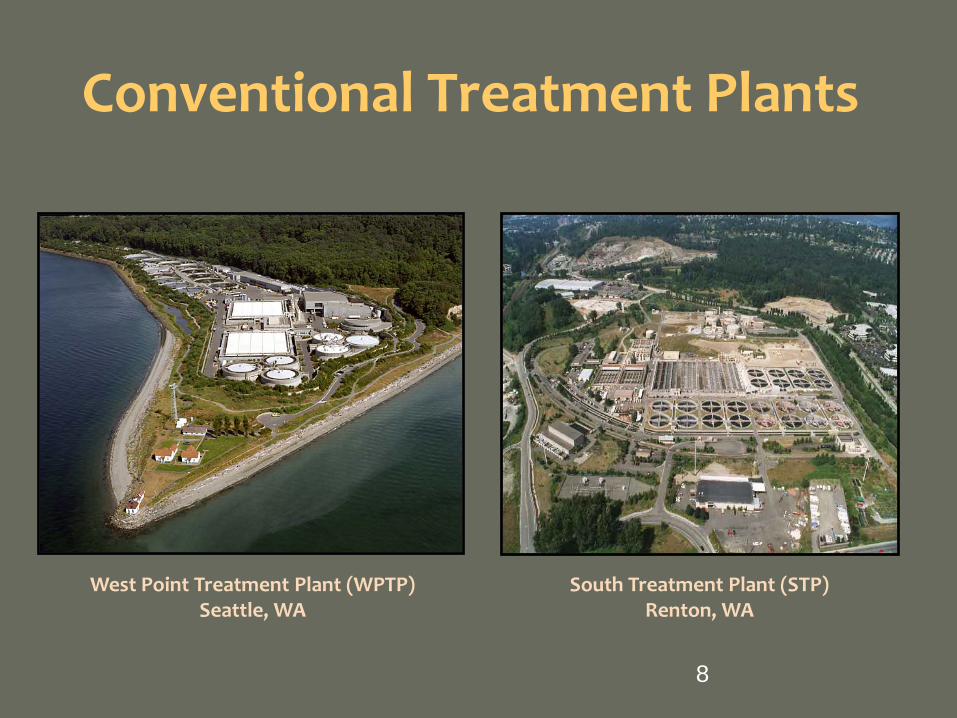
Conventional Treatment Plants
WTP STP
ProcessPri. Clarifiers
HPO SecondarySec. Clarifiers
Pri. ClarifiersCAS SecondarySec. Clarifiers
Flow (MGD) 70-110 65 - 95
MLSS (mg/L) 1,800-2,500 2,000-2,500
SRT (days) 2-4 3-5
8
Conventional Treatment Plants
West Point Treatment Plant (WPTP)Seattle, WA
South Treatment Plant (STP)Renton, WA
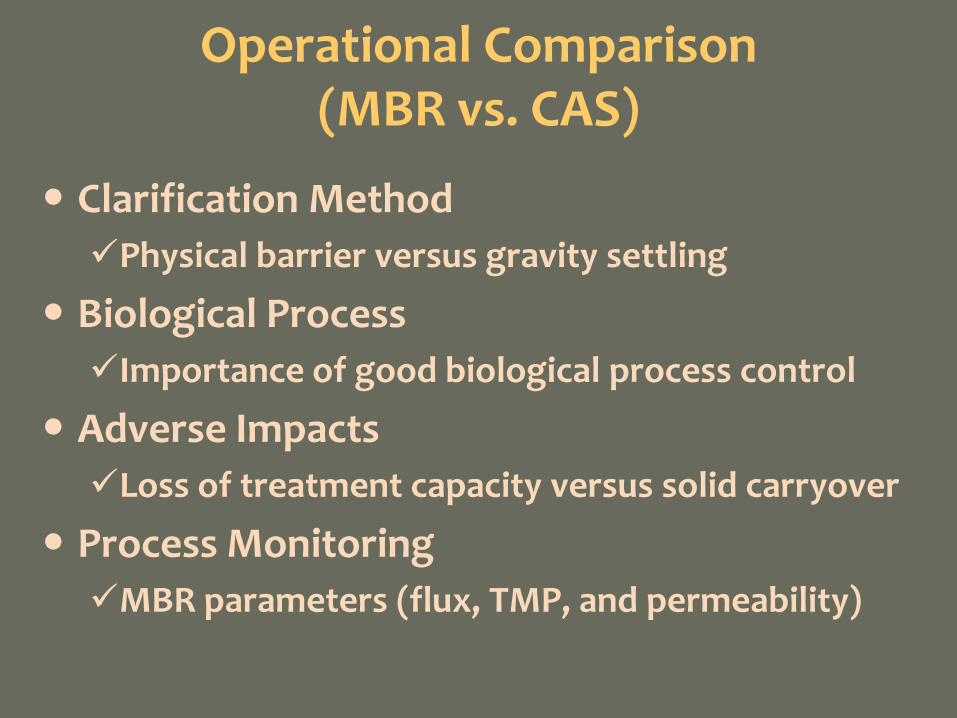
Operational Comparison(MBR vs. CAS)
Clarification MethodPhysical barrier versus gravity settling
Biological ProcessImportance of good biological process control
Adverse ImpactsLoss of treatment capacity versus solid carryover
Process MonitoringMBR parameters (flux, TMP, and permeability)

Metal Sampling During MBR Operation
24-hr compositePilot influentPilot effluentTreatment plant effluent
Grab (WTP Study only)Mixed liquor
Frequency - Bi-weekly Analytical Methods - ICP, ICP-MS, CVAA

List of Metals Analyzed Aluminum Antimony Arsenic Barium Beryllium *
Cadmium Calcium Chromium Cobalt Copper
Lead Magnesium Mercury Molybdenum Nickel Selenium *
Silver Thallium *
Vanadium Zinc
*concentrations below MDL (0.2-2 µg/L) in the influent
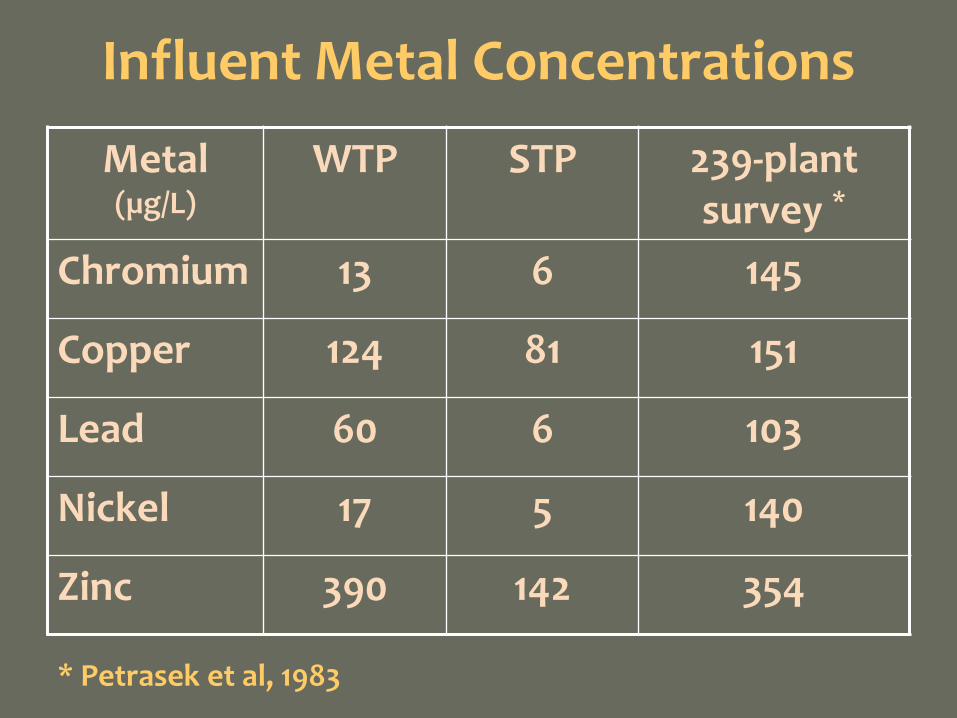
Influent Metal Concentrations
Metal (µg/L)
WTP STP 239-plant survey *
Chromium 13 6 145
Copper 124 81 151
Lead 60 6 103
Nickel 17 5 140
Zinc 390 142 354
* Petrasek et al, 1983
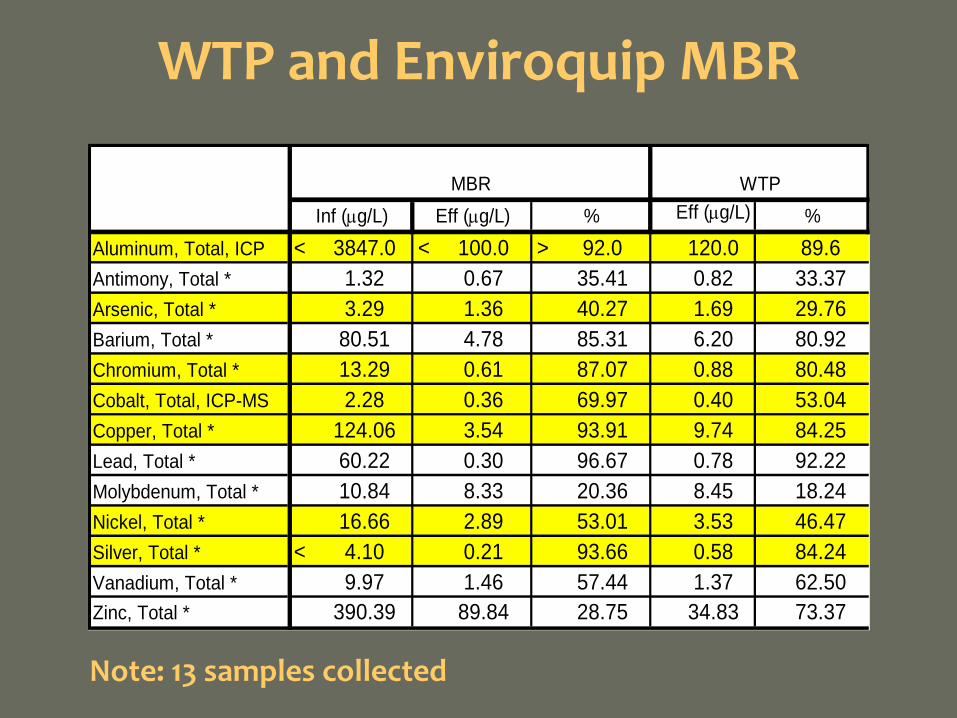
WTP and Enviroquip MBR
Eff (µg/L)
Aluminum, Total, ICP < 3847.0 < 100.0 > 92.0 120.0 89.6Antimony, Total * 1.32 0.67 35.41 0.82 33.37Arsenic, Total * 3.29 1.36 40.27 1.69 29.76Barium, Total * 80.51 4.78 85.31 6.20 80.92Chromium, Total * 13.29 0.61 87.07 0.88 80.48Cobalt, Total, ICP-MS 2.28 0.36 69.97 0.40 53.04Copper, Total * 124.06 3.54 93.91 9.74 84.25Lead, Total * 60.22 0.30 96.67 0.78 92.22Molybdenum, Total * 10.84 8.33 20.36 8.45 18.24Nickel, Total * 16.66 2.89 53.01 3.53 46.47Silver, Total * < 4.10 0.21 93.66 0.58 84.24Vanadium, Total * 9.97 1.46 57.44 1.37 62.50Zinc, Total * 390.39 89.84 28.75 34.83 73.37
WTPEff (µg/L) % %
MBRInf (µg/L)
Note: 13 samples collected
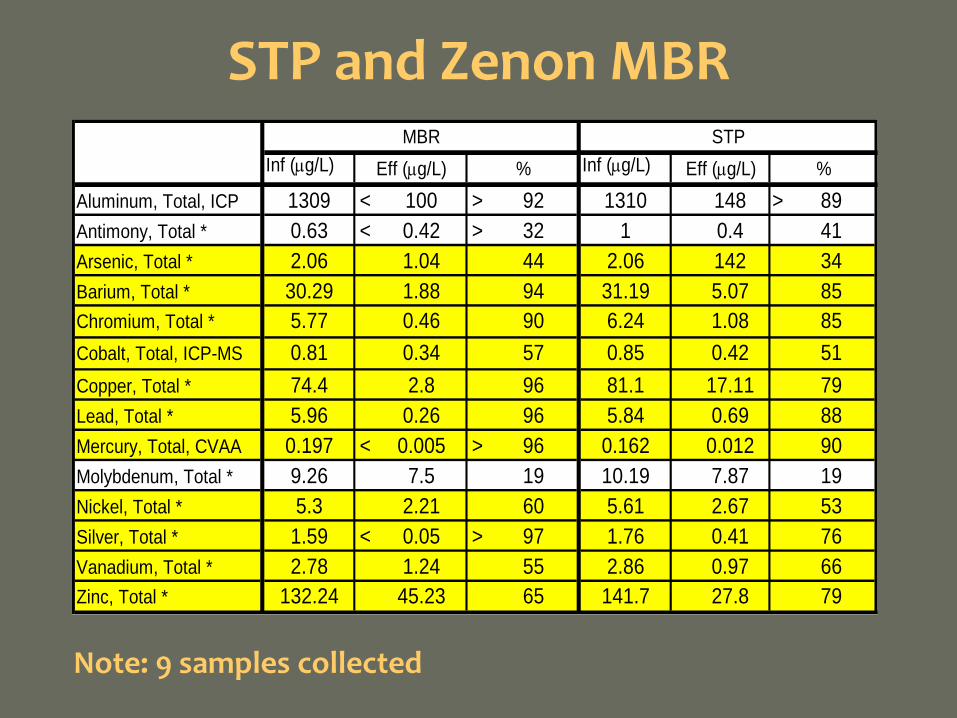
STP and Zenon MBR
Inf (µg/L) Inf (µg/L)
Aluminum, Total, ICP 1309 < 100 > 92 1310 148 > 89Antimony, Total * 0.63 < 0.42 > 32 1 0.4 41Arsenic, Total * 2.06 1.04 44 2.06 142 34Barium, Total * 30.29 1.88 94 31.19 5.07 85Chromium, Total * 5.77 0.46 90 6.24 1.08 85Cobalt, Total, ICP-MS 0.81 0.34 57 0.85 0.42 51Copper, Total * 74.4 2.8 96 81.1 17.11 79Lead, Total * 5.96 0.26 96 5.84 0.69 88Mercury, Total, CVAA 0.197 < 0.005 > 96 0.162 0.012 90Molybdenum, Total * 9.26 7.5 19 10.19 7.87 19Nickel, Total * 5.3 2.21 60 5.61 2.67 53Silver, Total * 1.59 < 0.05 > 97 1.76 0.41 76Vanadium, Total * 2.78 1.24 55 2.86 0.97 66Zinc, Total * 132.24 45.23 65 141.7 27.8 79
Eff (µg/L) Eff (µg/L)STP
% %MBR
Note: 9 samples collected

Comparing Removal Efficiencies
0
10
20
30
40
50
60
70
80
90
100
Barium Copper Lead Zinc
% R
emov
al
Enviroquip
WTP
Zenon
STP

Comparing Effluent Concentrations
0
20
40
60
80
100
120
Barium Copper Lead Zinc
Con
cent
ratio
ns (u
g/L)
EnviroquipWTPZenonSTP
0.300.78
0.260.69

Barium Effluent ConcentrationEnviroquip vs WTP
0
2
4
6
8
10
12
1-Aug-04 20-Sep-04 9-Nov-04 29-Dec-04 17-Feb-05 8-Apr-05 28-May-05 17-Jul-05
Date
Ba C
once
ntra
tion
(ug/
L)
MBR EffWTP Eff
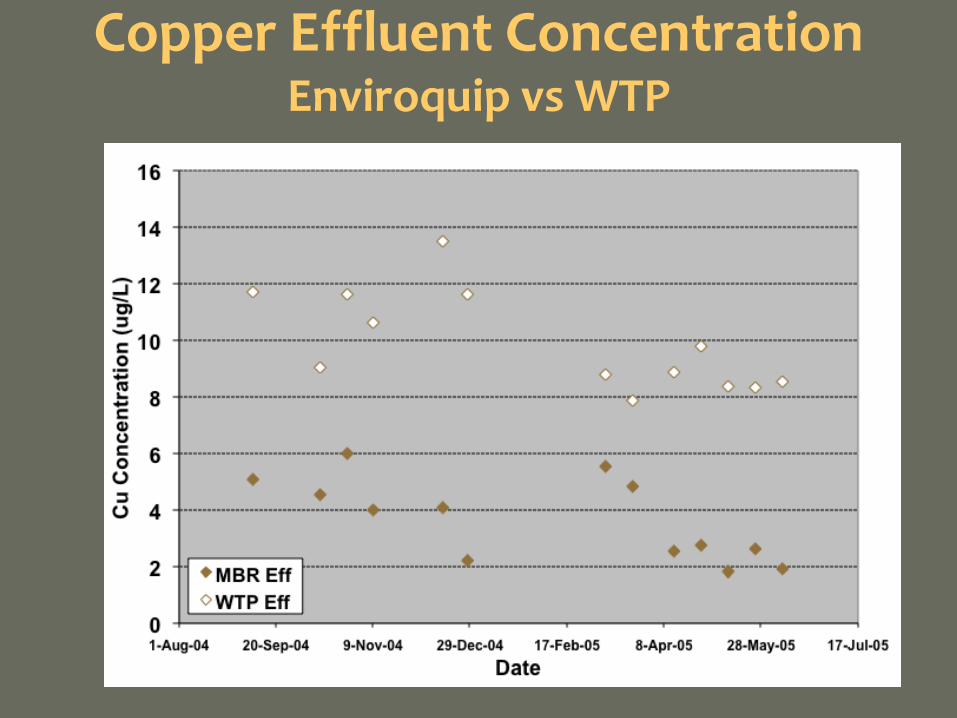
Copper Effluent ConcentrationEnviroquip vs WTP
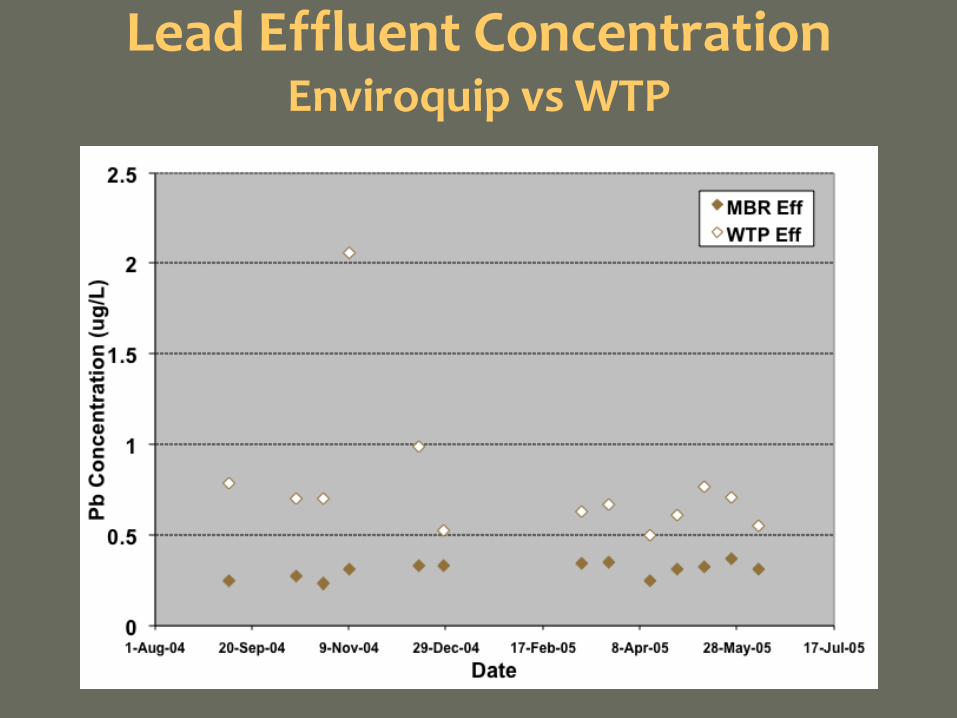
Lead Effluent ConcentrationEnviroquip vs WTP
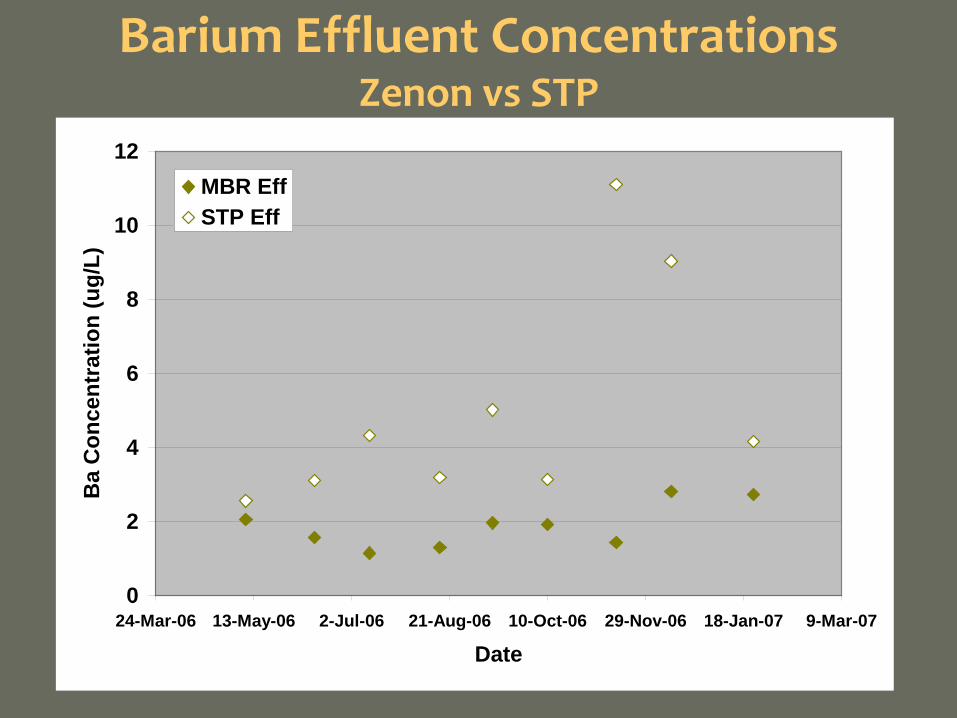
Barium Effluent ConcentrationsZenon vs STP
0
2
4
6
8
10
12
24-Mar-06 13-May-06 2-Jul-06 21-Aug-06 10-Oct-06 29-Nov-06 18-Jan-07 9-Mar-07
Date
Ba
Con
cent
ratio
n (u
g/L)
MBR EffSTP Eff

Metals Removal – Solids SeparationHYPOTHESIS: Membrane filtration provides enhanced metals removal.
M
M
MM
M
M
M
M
M
M
M
M
M
M
M
M
M
M
M
+M
CLARIFIER
TESTING: Compare filtered (0.45 µm) and unfiltered CAS effluent to identify the effect of filtration.
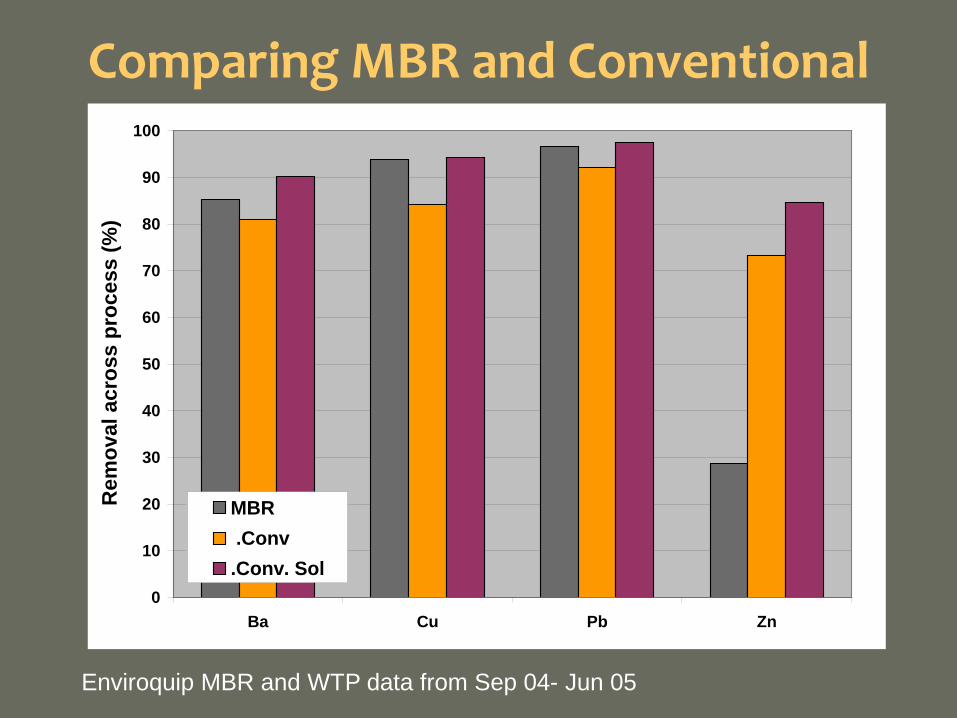
Comparing MBR and Conventional
Enviroquip MBR and WTP data from Sep 04- Jun 05
0
10
20
30
40
50
60
70
80
90
100
Ba Cu Pb Zn
Rem
oval
acr
oss
proc
ess
(%)
MBR .Conv.Conv. Sol
Metals Removal - Effect of Biological Process Operating Conditions
Hypothesis: Higher MLSS concentration and longer SRT will enhance metals removal.
Testing: Evaluate metals removal as a function of MLSS and SRT.
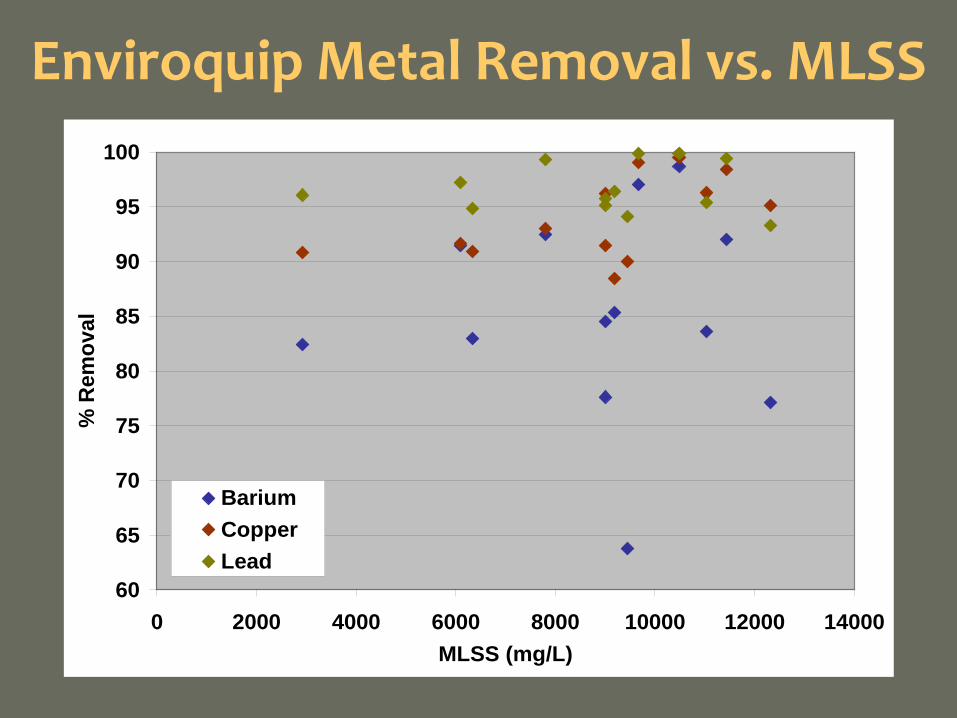
Enviroquip Metal Removal vs. MLSS
60
65
70
75
80
85
90
95
100
0 2000 4000 6000 8000 10000 12000 14000MLSS (mg/L)
% R
emov
al
BariumCopperLead

Enviroquip Metal Removal vs SRT
60
65
70
75
80
85
90
95
100
0 10 20 30 40 50 60SRT (d)
% R
emov
al
BariumCopperLead

Zenon Metal Removal vs. MLSS
80
82
84
86
88
90
92
94
96
98
100
6000 7000 8000 9000 10000 11000 12000
MLSS (mg/L)
% R
emov
al
Ba
Cu
Pb
Summary
MBR pilots had better metal removal efficiency compared to conventional activated sludge/clarifier.
Membrane filtration is a contributing factor in the increased metal removal efficiency.
No clear correlation existed between biological operating conditions (SRT or MLSS) and metals removal.

Acknowledgements
Enviroquip/Kubota and GE-Zenon for providing pilot equipment.
King County treatment plant staff for maintenance and operations support.
King County treatment plants process laboratory and Environmental Laboratory for analytical support.
Metals Removal in Conventional Wastewater Treatment Process
and Membrane Bioreactor Process
QUESTIONS
King County Department of Natural Resources and ParksWastewater Treatment Division


![Biochar Absorbents for Heavy Metals and Volatile Organics ... · • Industrial wastewater is discharged into the water [3] - 90% of wastewater produced. Background and Motivation](https://img.dokumen.tips/doc/110x75/5e8c9eab237ced4c09084272/biochar-absorbents-for-heavy-metals-and-volatile-organics-a-industrial-wastewater.jpg)


