Embed Size (px)
Citation preview

This article was downloaded by: [134.117.10.200]On: 29 November 2014, At: 12:04Publisher: Taylor & FrancisInforma Ltd Registered in England and Wales Registered Number: 1072954 Registered office: Mortimer House,37-41 Mortimer Street, London W1T 3JH, UK
Soil and Sediment Contamination: An InternationalJournalPublication details, including instructions for authors and subscription information:http://www.tandfonline.com/loi/bssc20
Metal contaminations in sediment of the upper reachof Yangtze River: Mianyuan River in Longmenshanregion, (China) using geochemical and multivariatestatistical analysesZeming Shiab, Xinyu Wangab & Shijun Niab
a Geochemistry Department of Chengdu, University of Technology, Chengdu, Chinab Sichuan Province Key laboratory of Nuclear Techniques in Geosciences, Chengdu, ChinaAccepted author version posted online: 25 Nov 2014.
To cite this article: Zeming Shi, Xinyu Wang & Shijun Ni (2014): Metal contaminations in sediment of the upper reach ofYangtze River: Mianyuan River in Longmenshan region, (China) using geochemical and multivariate statistical analyses, Soiland Sediment Contamination: An International Journal, DOI: 10.1080/15320383.2015.962124
To link to this article: http://dx.doi.org/10.1080/15320383.2015.962124
Disclaimer: This is a version of an unedited manuscript that has been accepted for publication. As a serviceto authors and researchers we are providing this version of the accepted manuscript (AM). Copyediting,typesetting, and review of the resulting proof will be undertaken on this manuscript before final publication ofthe Version of Record (VoR). During production and pre-press, errors may be discovered which could affect thecontent, and all legal disclaimers that apply to the journal relate to this version also.
PLEASE SCROLL DOWN FOR ARTICLE
Taylor & Francis makes every effort to ensure the accuracy of all the information (the “Content”) containedin the publications on our platform. However, Taylor & Francis, our agents, and our licensors make norepresentations or warranties whatsoever as to the accuracy, completeness, or suitability for any purpose of theContent. Any opinions and views expressed in this publication are the opinions and views of the authors, andare not the views of or endorsed by Taylor & Francis. The accuracy of the Content should not be relied upon andshould be independently verified with primary sources of information. Taylor and Francis shall not be liable forany losses, actions, claims, proceedings, demands, costs, expenses, damages, and other liabilities whatsoeveror howsoever caused arising directly or indirectly in connection with, in relation to or arising out of the use ofthe Content.
This article may be used for research, teaching, and private study purposes. Any substantial or systematicreproduction, redistribution, reselling, loan, sub-licensing, systematic supply, or distribution in anyform to anyone is expressly forbidden. Terms & Conditions of access and use can be found at http://www.tandfonline.com/page/terms-and-conditions

ACCEPTED MANUSCRIPT
ACCEPTED MANUSCRIPT 1
Metal contaminations in sediment of the upper reach of Yangtze River: Mianyuan River in
Longmenshan region, (China) using geochemical and multivariate statistical analyses
Zeming Shi 1, 2
, Xinyu Wang * 1, 2
and Shijun Ni 1, 2
1Geochemistry Department of Chengdu University of Technology, Chengdu, China
2Sichuan Province Key laboratory of Nuclear Techniques in Geosciences, Chengdu, China
Address correspondence to Xinyu Wang. Geochemistry Department of Chengdu University of
Technology, Chengdu, China, 610059, E-mail:[email protected]
Metal contamination in sediment of Mianyuan River (one of major upper reaches of the Yangtze
River) in Longmenshan Region (China) was investigated at 2012. Means of metal concentrations
in sediment (<74μm) were Cr: 59.93±19.8% mg/kg; As: 7.21±50.2% mg/kg; Se: 0.45±66.3%
mg/kg;Pb: 19.89±29.3% mg/kg; Zn: 78.98±31.9% mg/kg; Cd: 0.69±28.3% mg/kg; Ba:
0.71±34.0% g/kg; Mn: 0.55±62.2% g/kg. This study suggested: (1) concentrations of Cd, As, Cr
and Pb in Mianyuan River sediment were lower than them of middle and lower reaches of the
Yangtze River; (2) increasing of metals during the period from 2006 to 2009 was probably
related to the destroy of tailings piles by the WenChun earthquake in 2008; (3) organic materials
decided the distribution of Cd, Se, As, Ba, and Mn in upstream sediment, while the iron and
manganese minerals controlled the distribution of Ba, Cr, and Zn in downstream sediment; (4)
sources of Cd, Se and As were geogenic, while sources of Cr, Zn, Ba and Mn were
anthropogenic; (5) the source of Pb in upstream sediment was probably automobile exhaust, but
that of Pb in downstream sediment was geogenic.
Keywords Sediment contaminations, Heavy metals, Geo-accumulation index, Multi statistical
analysis, Mianyuan River
Dow
nloa
ded
by [
134.
117.
10.2
00]
at 1
2:04
29
Nov
embe
r 20
14

ACCEPTED MANUSCRIPT
ACCEPTED MANUSCRIPT 2
1.Introduction
Chemical analysis of sediment is considered as a good means to evaluate the metal
contamination in aqueous environment because the sediment is vulnerable to pollution
(Chabukdhara and Nema, 2012). Increasing of heavy metal concentrations in sediment has
attracted increasing attention, due to metal’s toxicity and bioavailability for organisms (Karlsson
et al., 2010; Boularbah et al., 2006; Madoni and Romeo, 2006; Zabetoglou et al., 2002). Heavy
metal contamination in sediments of the Yangtze River (Song et al., 2011; Yang et al., 2009;
Zhang et al., 2009), the Yellow River (Nie et al., 2010; Bai et al., 2012), the Nile River (Chen et
al., 2010; Awadallah et al., 1996) and the Amazon River (Guimaraes et al., 2000; Malm et al.,
1995) have been reported. Commonly, this kind of contamination is as a result of human
activities, especially industrial development, fertilizer usage and discharge of urban sewage.
However, those metals from lithosphere sometimes can result in high value in sediment.
Therefore, we should distinguish the anthropogenic source and geogenic source of metals in
order to prevent further contamination.
The Yangtze River, known in China as the Chang Jiang or Yangzi, is the longest river in
China, Asia and the third longest in the world. Pollution of heavy metals in Yangtze River has
attracted general attention because the Yangtze River was important water source to Chinese,
especially for those who live in the south of China. Many studies have been undertaken aiming
to assess the metal contamination in the middle reach (Song et al., 2011) and lower reach (Yi et
al., 2011; Yang et al., 2009) of Yangtze River. However, few literatures investigated the situation
of metal contamination in upper reach of Yangtze River. Mianyuan River, one of the major
Dow
nloa
ded
by [
134.
117.
10.2
00]
at 1
2:04
29
Nov
embe
r 20
14

ACCEPTED MANUSCRIPT
ACCEPTED MANUSCRIPT 3
upper reaches of the Yangtze River, is located in the Longmenshan region in the northwestern
edge of the Sichuan Basin, between the pre-fault and main central fault of Longmenshan (Zhou
et al., 2013). The WenChun earthquake destroyed the Mianyuan River and made two dammed
lakes in 2008 (Cui et al., 2011; Cui et al., 2009).
Along the riverbank of Mianyuan River, there were phosphate mining zone, industry zone,
residential region, and agriculture area that constituted a series of potential contamination
sources to river. In this study, the Mianyuan River was selected to reflect the metal
contamination in sediment of upper reach of the Yangtze River. Geochemical and multivariate
statistical analysis was undertaken to identify the category of metal sources in Mianyuan River.
Pollution indices were used to assess the metal contamination in sediment.
2. Materials and methods
2.1. Study area
The Mianyuan River is located at the south-west of China. It flows through multiple strata
(Aurora, Cambrian, Devonian, Permian and Triassic carbonate), and through the industrial and
agricultural areas. Mianyuan River originates from the north of the Jiudingshan Mountains and
flows through the cities of Mianzhu and Deyang (Figure 1). Its length, catchment area, and
average annual runoff are 114 km, 1212 km2, and 690 million tons, respectively. After mixing
with the Shiting River and Yazi River, the Mianyuan River reaches the city of Jintang (Figure 1).
2.2. Sampling
The filed sampling was finished at April, 2012. In total, sediment samples of sixteen sites were
collected along the river (Figure 1). Sediment at site 1 (S1) was chosen as the background
sample. No visible contamination sources were found around S1. Site 2 and Site 4 were both
Dow
nloa
ded
by [
134.
117.
10.2
00]
at 1
2:04
29
Nov
embe
r 20
14

ACCEPTED MANUSCRIPT
ACCEPTED MANUSCRIPT 4
located near phosphate mining zones. Site 3 and Site 7 were dammed lakes formed by the
WenChun earthquake. Site 6 was near the Tsingping County. Site 10 was in a destroyed dam that
was located near Hanwang City. Site 11 was at an industrial zone. Site 12 was an artificial lake
in the city of Deyang. Sites between 13 and 16 were at an agricultural zone. In addition, site 16
was near the Jintang City.
2.3. Chemical analysis and X-ray Diffraction spectrometry
Deionized water of Nano system was used in the procedure of chemical analysis. Analytical
grade chemicals and a blank sample were used in determination. Containers were washed and
rinsed with deionized water before use. Sediments were dried in air and sieved with a sieve of
200 meshes after crushing. Following that, the fine sediment powder (<74 μm) was digested with
the mixture of HNO3, HClO4 and HF according to the USEPA procedure (USEPA-3052, 1996).
Diluted samples were analyzed according to USEPA procedure (USEPA-3050B, 1996). As and
Se were determined using atomic fluorescence spectrometry (AFS). The precision and accuracy
ranged from 0.2% to 4%; mean recovery percentages range from 96% to102%. Al, Cr, Mn, Fe,
Zn, Cd, Ba, and Pb were determined using inductively coupled plasma mass spectrometry (ICP-
MS); precision and accuracy ranged from 2.1% to 5.8%; mean recovery percentages ranged from
-94.2% to 102.1%. K, Na, Ca, Mg, and SiO2 were measured using inductively coupled plasma
atomic emission spectrometer (ICP-AES); precision and accuracy ranged from 0.8% to 2.0%;
mean recovery percentages ranged from -98.0 % to 102.0 %. Content of total organic carbon
(TOC) was determined according to the method: titration with Cr3+
after wet oxidation
(Schumacher, 2002). Means of heavy metals’ concentrations in sediment were presented and
Dow
nloa
ded
by [
134.
117.
10.2
00]
at 1
2:04
29
Nov
embe
r 20
14

ACCEPTED MANUSCRIPT
ACCEPTED MANUSCRIPT 5
compared with values in aqueous sediments of other regions (Table 1). Primary mineral
composition of sediment was identified using X-ray Diffraction spectrometry (XRD).
2.4. Multivariate statistical analysis
Data were tested for normality (Anderson-Darling’s test) using the software of SigmaXL
(Version 6.2). Cluster analysis (CA), principal component analysis (PCA), and linear correlation
analysis(LCA)were performed using software SPSS (Windows version 19.0), on the basis of
analytical result. The details of these methods were summarized as below:
2.4.1. Cluster analysis (CA)
The aim of cluster analysis is to explore the potential clusters of variables. Hierarchical cluster
analysis (HCA) examines distances between variables to classify them into different clusters
(Chabukdhara and Nema, 2012). The most similar variables are grouped together until all
variables are grouped. R-cluster analysis with the linkage method of “Between Group” is
adopted in this study. The result of CA about heavy metals is presented (Figure 2).
2.4.2. Linear correlation analysis (LCA)
The linear correlation efficient can show the linear correlation between two variables. The
Pearson linear correlation efficient with certain confidence levels (P < 0.0.1 and P < 0.05) was
calculated and presented (Table 2). Data were tested for homogeneity by Bartlett’s test using the
software of SigmaXL (Version: 6.2).
2.4.3. Principal component analysis (PCA)
Principal component analysis is a method using less integrated components to replace original
variables still maintaining most of the information is not lost. Principal components are linear
combinations of original variables. The principal components are named as component 1, 2, 3
Dow
nloa
ded
by [
134.
117.
10.2
00]
at 1
2:04
29
Nov
embe
r 20
14

ACCEPTED MANUSCRIPT
ACCEPTED MANUSCRIPT 6
etc. by the order of loading from highest to lowest. This method has been widely used to explore
anthropogenic pollution source of metals in sediment (Chabukdhara and Nema, 2012; Varol,
2011). Result of PCA about heavy metals in sediment is presented (Figure 3).
2.5. Pollution indices used in assessment
Geo-accumulation index (Igeo), contamination factor (CF), and pollution load index (PLI) were
used as indicators to show the degree of contamination.
2.5.1. Geo-accumulation Index (Igeo)
Igeo = log2 (Cn/1.5Bn) (2)
The geo-accumulation index is defined as equation (2). Bn represents the concentration in
background sample and 1.5 is the background matrix correction factor (Varol, 2011). According
to the value of Igeo , the pollution content can be classified as: Class 0 (practically unpolluted)
when Igeo < 0; Class 1 (unpolluted to moderately polluted) when 0 < Igeo < 1;Class 2 (moderately
polluted) when 1 < Igeo< 2; Class 3 (moderately to heavily polluted) when 2 < Igeo < 3; Class 4
(heavily polluted) when 3 < Igeo < 4; Class 5 (heavily to extremely polluted) when 4 < Igeo < 5;
Class 6 (extremely polluted) when 5 < Igeo (Müller, 1969). The result of geo-accumulation
indices of heavy metals is presented (Table 3).
2.5.2. Contamination factor (CF) and pollution load index (PLI)
CF = Cmetal/Cbackground (3)
CF is defined as equation (3). If CF < 1, it means low contamination; If 1 < CF < 3, it means
moderate contamination; If 3 < CF < 6, it means considerable contamination; If CF > 6, it means
the very high contamination (Hakanson, 1980).
PLI = (CF1×CF2×CF3×……CFn)1/n
(4)
Dow
nloa
ded
by [
134.
117.
10.2
00]
at 1
2:04
29
Nov
embe
r 20
14

ACCEPTED MANUSCRIPT
ACCEPTED MANUSCRIPT 7
Pollution load index is defined as equation (4). It shows the extent of total pollution at specific
site. CF1, CF2, CF3, CFn represent the CF of different heavy metals (1, 2, 3…). There is no
pollution when PLI < 1; There is pollution when PLI > 1 (Tomlinson et al., 1980). The
resultsabout CF and PLI of metal in sediment were calculated and presented (Table 3).
3. Results
3.1. Division of upstream and downstream
The stratum of upstream is the quaternary sandy clay, while the stratum of downstream is
limestone of pre-Devonian. Therefore, sediment samples of the Mianyuan River were divided
into upstream (from S1 to S7) and downstream (from S8 to S16).
3.2. Primary mineral composition of sediment and chemical weathering
Analysis of XRD of sediments showed the existence of quartz (SiO2), calcite (CaCO3), albite
(NaAlSi3O8), dolomite (CaMg(CO3)2), and orthoclase (KAlSi3O8). The significant positive linear
correlation between Ca and Mg (Table 2) was attributed to the existence of dolomite and calcite
in which Ca2+
in lattice can be replaced by Mg2+
in isomorphism. The positive linear correlations
among Al, Na and SiO2 (Table 2) were attributed to the chemical composition of albite.
Moreover, the negative linear correlation between groups of Ca-Mg and Al-Na-SiO2 was due to
the chemical weathering of carbonate minerals (calcite and dolomite). The weathering of
carbonates in sediment will correspondingly improve the percentages of quartz and albite in
sediment.
Dow
nloa
ded
by [
134.
117.
10.2
00]
at 1
2:04
29
Nov
embe
r 20
14

ACCEPTED MANUSCRIPT
ACCEPTED MANUSCRIPT 8
4. Discussion
4.1. Sediment contaminations by metals
4.1.1. Temporal variance of heavy metals in sediment of Mianyuan River
Total heavy metals in same fraction of sediment were determined at 2006 and 2009 in earlier
studies (Table 4). The average concentrations of heavy metals in sediment at 2012 follow the
order: Mn > Ba > Zn > Cr > Pb > As > Cd > Se, which was compatible with the order: Zn > Cr >
Pb > As > Cd at 2009 (Zheng, 2010). Means of Pb, Cd, and As in river sediment all increased
from 2006 to 2009 but decreased from 2009 to 2012 (Table 4). The increasing of Cd, As and Pb
were related to phosphate mining in upstream (Zheng, 2010). The decreasing of Cd, As and Pb
during the period from 2009 to 2012 was contradictory with the situation that the phosphate
mining continued and even further in this period. Authors inferred that the increasing of heavy
metals in sediment at 2009 was related to the earthquake at 2008. In fact, many phosphate-tailing
piles were destroyed by earthquake at May 12, 2008 (Xu et al., 2012), e.g. the phosphate mine
near S4 (Figure 1). These hazardous materials were washed into the river by rain following the
earthquake (Zhou et al., 2013). After natural remediation during the period from 2009 to 2012,
Cd, As, and Pb in sediment started back to the value of pre-earthquake in spite of the continuous
developing of phosphate mines. Cr in sediment has been growing during the period from 2006 to
2012. This reveals that Cr in sediment probably had more complicated sources than other metals.
4.1.2. Comparison of heavy metals in sediments with other aqueous systems
Concentrations of As, Cr, Pb, Zn and Cd in sediment of Mianyuan River were much lower than
them in sediments of the middle reach and lower reach of Yangtze River (Table 1). It suggested
that metal contamination of middle and lower reaches of Yangtze River were much more serious
Dow
nloa
ded
by [
134.
117.
10.2
00]
at 1
2:04
29
Nov
embe
r 20
14

ACCEPTED MANUSCRIPT
ACCEPTED MANUSCRIPT 9
than upper reach. The Pearl River was the third longest river in China, after the Yangtze River
and Yellow River. Metal concentrations in sediment of the Mianyuan River were also lower than
Pearl River (Table 1). The contamination of Zn in sediment of Pearl River was more serious than
all the reaches of Yangtze River (Table 1). The concentrations of Pb and Cd in sediment of
Mianyuan River were also lower than the TasikChini Lake of Malaysia. The concentration of Cr
in sediment of Mianyuan River was lower than that of the Hara Biosphere Reserve of Iran, while
Zn in sediment of Mianyuan River was higher than that of the Hara Biosphere Reserve of Iran.
4.1.3. Effect of organic materials on the distribution of heavy metals in sediment
Significant positive linear correlations were found among the heavy metal pairs in upstream
sediment: Zn - Cr, Ba - Zn, As - Cd, Se - Cd, As - Se, Mn - Ba, Mn - Zn (Table 2). Total organic
carbon (TOC) showed significant and positive linear correlations with heavy metals (Se, As, Cd,
Ba and Mn) in upstream sediment (Table 2), because organic materials of sediment can adsorb
heavy metals (Marchand et al., 2011; Li et al., 2007; Clemente and Bernal, 2006). It suggested
that the adsorption of heavy metals by organic materials decided the distribution of heavy metals
in upstream sediment. However, there were no significant linear correlations between TOC and
heavy metals in downstream sediment.
4.1.4. Effect of iron and manganese on the distribution of heavy metals in sediment
In downstream sediment, there were significant and positive linear correlations among metal
pairs: Cr - Ba, Cr - Zn, Cr - Pb, Cr - Cd, Cr - Mn, Ba - Pb, Ba - Zn, Ba - As, Ba - Mn, Pb - Zn, Pb
- Cd, Pb - As, Pb - Mn, Zn - Cd, Zn - As, Zn - Mn, Cd - As, Cd - Se, Cd - Mn, As - Mn, Se - Mn
(Table 2). Fe and Mn showed significant and linear correlations with Ba, Al, Cr, and Zn in
downstream sediment, because the iron and manganese minerals can adsorb trace metals (Wang
Dow
nloa
ded
by [
134.
117.
10.2
00]
at 1
2:04
29
Nov
embe
r 20
14

ACCEPTED MANUSCRIPT
ACCEPTED MANUSCRIPT 10
et al., 2012; Covelo et al., 2007; Yu et al., 2001). Therefore, the adsorption by iron and
manganese minerals controlled the distribution of Ba, Al, Cr, and Zn in downstream sediment.
The analysis of XRD did not show existence of iron or manganese oxides or hydroxides, due to
the lower content of Fe and Mn in sediment (XRD can only show minerals exceeding 1% of
sediment sample in weight).
4.2. Geo-accumulation index
The result of geo-accumulation index of metals in sediment showed that: (1) geo-accumulation
indices of Cr, Cd, As, Se and Zn in sediment ranged from -1.03 to 0.02, -1.76 to 0.65, -1.52 to
0.90, -1.63 to 1.29 and -0.62 to 0.49, respectively. It suggested Cr, Cd, As, Se and Zn in
sediment in sediment were unpolluted to moderately polluted. Means of Igeo of Cr, Cd, As, Se
and Zn in sediment were -0.42, -0.71, -0.50, -0.40 and -0.10, respectively, all of which were
lower than 0. It suggested that Cr, Cd, As, Se and Zn in the river sediment were not seriously
polluted; (2) the maximum value of geo-accumulation index of Se was 1.29 at S6, which was the
only site with Igeo of Se higher than one. It suggested that there was a potential selenium source
near the Tsingping town; (3) geo-accumulation index of Pb in sediment ranged from -0.58 to
0.84 and have an average value of 0.13. It suggested Pb in river sediment was unpolluted to
moderately polluted. Nevertheless, the mean of Igeo of Pb in sediment was positive, which was
different from Cr, Cd, As, Se and Zn, all of which had negative average values of Igeo. This
suggested that there was anthropogenic pollution of Pb in this river; (4) geo-accumulation index
of Ba and Mn in sediment were much higher than other metals. Means of Igeo of Ba and Mn in
sediment both were higher than 1, which suggested that Ba and Mn of river sediment were
moderately contaminated.
Dow
nloa
ded
by [
134.
117.
10.2
00]
at 1
2:04
29
Nov
embe
r 20
14

ACCEPTED MANUSCRIPT
ACCEPTED MANUSCRIPT 11
4.3. Multi statistical analysis
The loading of principal component can reflect the proportion of this component in explaining
the total variance of data. The score of each variable can show the percentage of this variable in
contributing the principal component.
Cd, Se, As in sediment
The principal component upstream - 1 can explain 57.04 % total variance of metals in
upstream sediment (Figure 3a and Table 5). Upstream - 1 had strong positive loadings on Cd, Se,
and As (Table 5). Cd, Se, and As in upstream sediment were also classified in the same cluster
(Figure 2a). The linear correlations of Cd - Se, Cd - As, and Se - As in sediment were positive
and significant in statistics (Table 2). It suggested that Cd, Se and As in sediment had same
source that was the component upstream - 1 represented. There were significant negative linear
correlations between trace elements (Cd, Se, As) and major element Na in upstream and
downstream sediment (Table 2). Only Albite (NaAlSi3O8) in sediment did have Na. The mineral
of albite commonly existed in soil and sediments. Its synthesis in laboratory still needs extreme
conditions, e.g., temperature above 200℃ and high pressure of four to five times atm.
(Trembath, 1973; Martin, 1969). It suggested that albite cannot form in surficial environment,
due to the constraints of temperature and pressure. Although the concentrations of metals (Cr,
Pb, and Zn) in water were much higher than those of Cd, As, and Se, only Cd, As, and Se in
sediment did have linear negative correlations with Na in albite. It suggested that Cd, As, and Se
of sediment were not adsorbed by albite. Cd, As, and Se must have existed in the pristine albite
before the albite entered the sediment (Wang et al, 2014). Therefore, Cd, Se, and As in upstream
Dow
nloa
ded
by [
134.
117.
10.2
00]
at 1
2:04
29
Nov
embe
r 20
14

ACCEPTED MANUSCRIPT
ACCEPTED MANUSCRIPT 12
and downstream sediment all had geogenic source. The component upstream - 1 (Figure 3a) and
component downstream - 2 (Figure 3b) can be understood as the geologic origin.
Cr and Zn in sediment
Component upstream - 2 can explain 21.56 % total variances of metals in upstream (Figure 3a
and Table 5). Upstream - 2 had strong positive loadings on Cr and Zn (Table 5). There was
significant linear correlation between Cr and Zn in upstream sediment (Table 2). Cr and Zn were
also classified in the same cluster (Figure 2a). Opposite to the geogenic component upstream - 1,
upstream - 2 represented the anthropogenic source. Similarly, opposite to the geogenic
component downstream - 2, downstream - 1 represented the anthropogenic source.
Therefore, Cr and Zn in upstream and downstream sediment both had anthropogenic sources.
Ba, Mn and Pb in sediment
Component upstream - 3 can explain 18.85 % total variance of metals in upstream sediment
(Figure 3a, Table 5). Upstream - 3 had strong positive loading on Pb, moderate loadings on Ba
and Mn (Table 5). Therefore, Ba, Mn, and Pb probably had a kind of source that represented the
mix of anthropogenic and geogenic sources (Figure 3a, Table 5). Further cluster analysis
revealed that Pb in upstream sediment had unique, different variance from other metals, which
can be treated as a separate cluster (Figure 2a). A road extended from S2 to S6 with a distance
about 6 meters from the river (Figure 4). Pb in upstream sediment probably was affected by
exhaust of the automobiles using petrol containing lead. After S6, Pb was included by the
geogenic component downstream - 2 (Table 5). Therefore, Ba, Mn and Pb in upstream sediment
had the mix of geogenic and anthropogenic sources. Ba and Mn of downstream had
anthropogenic source, while Pb of downstream had geogenic source.
Dow
nloa
ded
by [
134.
117.
10.2
00]
at 1
2:04
29
Nov
embe
r 20
14
ACCEPTED MANUSCRIPT
ACCEPTED MANUSCRIPT 13
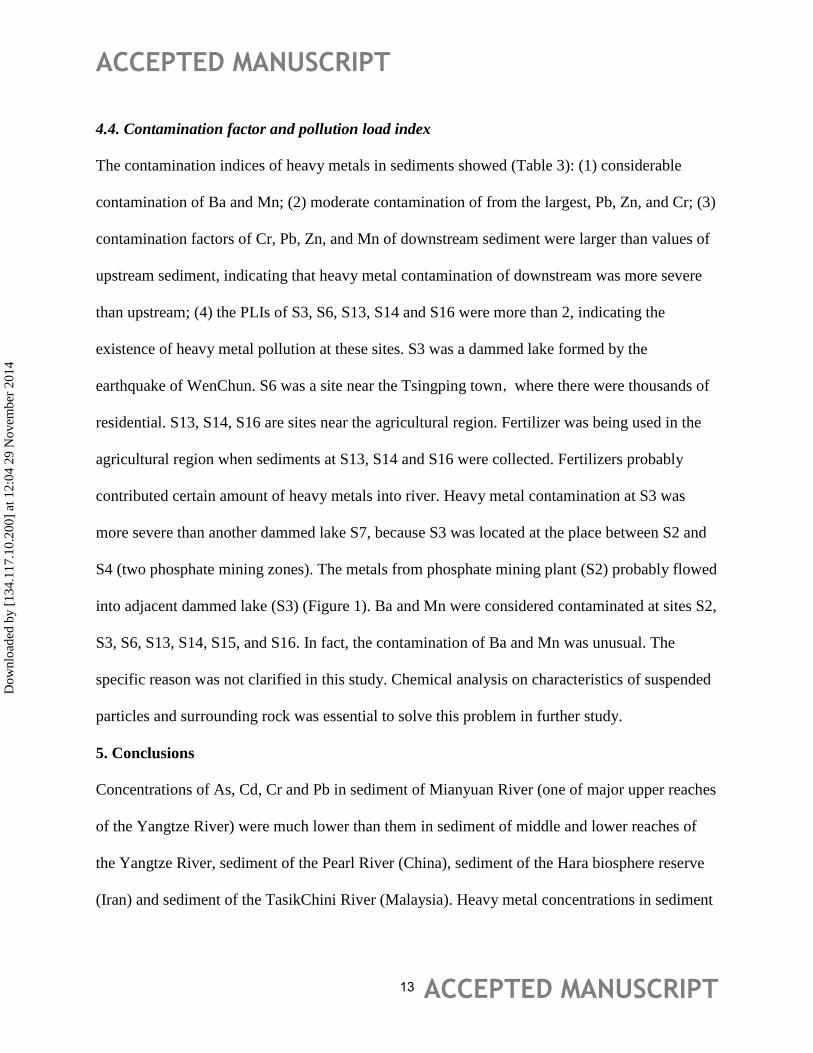
4.4. Contamination factor and pollution load index
The contamination indices of heavy metals in sediments showed (Table 3): (1) considerable
contamination of Ba and Mn; (2) moderate contamination of from the largest, Pb, Zn, and Cr; (3)
contamination factors of Cr, Pb, Zn, and Mn of downstream sediment were larger than values of
upstream sediment, indicating that heavy metal contamination of downstream was more severe
than upstream; (4) the PLIs of S3, S6, S13, S14 and S16 were more than 2, indicating the
existence of heavy metal pollution at these sites. S3 was a dammed lake formed by the
earthquake of WenChun. S6 was a site near the Tsingping town,where there were thousands of
residential. S13, S14, S16 are sites near the agricultural region. Fertilizer was being used in the
agricultural region when sediments at S13, S14 and S16 were collected. Fertilizers probably
contributed certain amount of heavy metals into river. Heavy metal contamination at S3 was
more severe than another dammed lake S7, because S3 was located at the place between S2 and
S4 (two phosphate mining zones). The metals from phosphate mining plant (S2) probably flowed
into adjacent dammed lake (S3) (Figure 1). Ba and Mn were considered contaminated at sites S2,
S3, S6, S13, S14, S15, and S16. In fact, the contamination of Ba and Mn was unusual. The
specific reason was not clarified in this study. Chemical analysis on characteristics of suspended
particles and surrounding rock was essential to solve this problem in further study.
5. Conclusions
Concentrations of As, Cd, Cr and Pb in sediment of Mianyuan River (one of major upper reaches
of the Yangtze River) were much lower than them in sediment of middle and lower reaches of
the Yangtze River, sediment of the Pearl River (China), sediment of the Hara biosphere reserve
(Iran) and sediment of the TasikChini River (Malaysia). Heavy metal concentrations in sediment
Dow
nloa
ded
by [
134.
117.
10.2
00]
at 1
2:04
29
Nov
embe
r 20
14

ACCEPTED MANUSCRIPT
ACCEPTED MANUSCRIPT 14
of Mianyuan River increased during the period from 2006 to 2009, which was probably related
to destroy of tailing piles by WenChun earthquake (2008). Metal contamination in Mianyuan
River increased during the period from 2006 to 2009, while decreased during the period from
2009 to 2012. Organic materials controlled the distribution of As, Se, Cd, Ba, and Mn of
upstream sediment, while the iron and manganese minerals determined the distribution of Ba, Cr,
and Zn of downstream sediment. Linear correlation analysis and XRD indicated that the sources
of Cd, Se and As of upstream and downstream sediments were geogenic. The sources of Cr and
Zn of upstream and downstream sediment were anthropogenic. Ba, Mn, and Pb of upstream
sediment had combined geologic and anthropogenic sources. The contamination of Pb in
upstream sediment was related to the automobile exhaust. Ba and Mn in sediments were
moderately contaminated, compared to the background sample. There was heavy metal
contamination at dammed lake (S3), Tsingping town (S6) and agricultural regions (S13, S14,
S15 and S16).
Acknowledgements
The National Nature Science Foundation of China (41373120) financially supported this
research. The support from geochemistry department and laboratory of Chengdu University of
Technology were important to this study. In addition, we thank the Professor Liang Jinlong for
technical guidance about fieldwork and help from Hou Yun; Zhang Cong and Yu Zhongmei. We
are grateful to the comments of reviewers and editors that help improve our article.
Dow
nloa
ded
by [
134.
117.
10.2
00]
at 1
2:04
29
Nov
embe
r 20
14

ACCEPTED MANUSCRIPT
ACCEPTED MANUSCRIPT 15
References
Awadallah R., Soltan M., and Rashed M. 1996. Relationship between heavy metals in mud
sediments and beach soil of the River Nile. Environ. Intern.22(2), 253-258.
Bai J., Xiao R., Zhang K., and Gao H. 2012. Arsenic and heavy metal pollution in wetland soils
from tidal freshwater and salt marshes before and after the flow-sediment regulation regime in
the Yellow River Delta, China. J. Hydrol. 450-451(11), 244-253.
Boularbah A., Schwartz C., Bitton G., Aboudrar W, Ouhammou A, and Morel J.L. 2006. Heavy
metal contamination from mining sites in South Morocco: 2. Assessment of metal accumulation
and toxicity in plants. Chemosphere. 63(5), 811-817.
Chabukdhara M., and Nema A.K. 2012. Assessment of heavy metal contamination in Hindon
River sediments: a chemometric and geochemical approach. Chemosphere. 87, 945-953.
Chen Z., Salem A., Xu Z., and Zhang W. 2010. Ecological implications of heavy metal
concentrations in the sediments of Burullus Lagoon of Nile Delta, Egypt. Estuarine, Coastal and
Shelf Science.86(3), 491-498.
Clemente R., and Bernal M.P. 2006. Fractionation of heavy metals and distribution of organic
carbon in two contaminated soils amended with humic acids. Chemosphere.64(8), 1264-1273.
Covelo E., Vega F., and Andrade M. 2007. Competitive sorption and desorption of heavy metals
by individual soil components. J. Hazard. Materials. 140(1), 308-315.
Cui P., Chen X. Q., Zhu Y. Y., Su F. H., Wei F. Q., Han Y. S., and Zhuang J. Q. 2011. The
Wenchuan earthquake (May 12, 2008), Sichuan province, China, and resulting geohazards. Nat.
Hazards. 56(1), 19-36.
Dow
nloa
ded
by [
134.
117.
10.2
00]
at 1
2:04
29
Nov
embe
r 20
14

ACCEPTED MANUSCRIPT
ACCEPTED MANUSCRIPT 16
Cui P., Zhu Y. Y., Han Y. S., Chen X. Q., and Zhuang J. Q. 2009. The 12 May Wenchuan
earthquake-induced landslide lakes: distribution and preliminary risk evaluation. Landslides,
6(3), 209-223.
Ebrahimpour M., and Mushrifah I. 2008. Heavy metal concentrations in water and sediments in
Tasik Chini, a freshwater lake, Malaysia. Environ. Monit. Assess. 141(1-3): 297-307.
Guimaraes J.R.D., Roulet M., Lucotte M., and Mergler D. 2000. Mercury methylation along a
lake–forest transect in the Tapajós river floodplain, Brazilian Amazon: seasonal and vertical
variations. Sci. Total Environ.261(1-3), 91-98.
Hakanson L. 1980. An ecological risk index for aquatic pollution control. A sedimentological
approach. Water Res.14(8), 975-1001.
Karlsson K., Viklander M., Scholes L., and Revitt M. 2010. Heavy metal concentrations and
toxicity in water and sediment from stormwater ponds and sedimentation tanks. J. Hazard.
Mater.178(1-3), 612-618.
Li R.Y., Yang H., Zhou Z.G., Lü J.J., Shao X.H., and Jin F. 2007. Fractionation of heavy metals
in sediments from Dianchi Lake, China. Pedosphere. 17(2), 262-272.
Madoni P., and Romeo M.G. 2006. Acute toxicity of heavy metals towards freshwater ciliated
protists. Environ. Pollut. 141(1), 1-7.
Malm O., Castro M.B., Bastos W.R., Branches F.J., Guimaraes J.R., and Zuffo C.E. 1995. An
assessment of Hg pollution in different goldmining areas, Amazon Brazil. Sci. Total
Environ.175(2), 127-140.
Dow
nloa
ded
by [
134.
117.
10.2
00]
at 1
2:04
29
Nov
embe
r 20
14

ACCEPTED MANUSCRIPT
ACCEPTED MANUSCRIPT 17
Marchand C., Allenbach M., and Lallier-Vergès E. 2011. Relationships between heavy metals
distribution and organic matter cycling in mangrove sediments (Conception Bay, New
Caledonia). Geoderma. 160(3), 444-456.
Martin R.F. 1969. The hydrothermal synthesis of low albite. Contributions to Mineralogy and
Petrology. 23(4), 323-339.
Müller G. 1969. Index of geoaccumulation in sediments of the Rhine River. Geojournal. 2 (3),
108-118.
Nie M., Xian N., Fu X., Chen X., and Li B. 2010. The interactive effects of petroleum-
hydrocarbon spillage and plant rhizosphere on concentrations and distribution of heavy metals in
sediments in the Yellow River Delta, China. J. Hazard. Mater.174(1-3), 156-161.
Niu H., Deng W., Wu Q., and Chen X. 2009. Potential toxic risk of heavy metals from sediment
of the Pearl River. J. Environ. Sci.21(8), 1053-1058.
Nowrouzi M., Mansouri B., Nabizadeh S., and Pourkhabbaz A. 2014. Analysis of heavy metals
concentration in water and sediment in the Hara biosphere reserve, southern Iran. Toxicol. Ind.
Health. 30(1), 64-72.
Schumacher B.A. 2002. Methods for the determination of total organic carbon (TOC) in soils
and sediments. Environmental Protection Agency: Washington, D.C., USA.
Song Y., Ji J., Yang Z., Yuan X., Mao C., and Frost R.L. 2011. Geochemical behavior
assessment and apportionment of heavy metal contaminants in the bottom sediments of lower
reach of Changjiang River. Catena. 85(1), 73-81.
Dow
nloa
ded
by [
134.
117.
10.2
00]
at 1
2:04
29
Nov
embe
r 20
14

ACCEPTED MANUSCRIPT
ACCEPTED MANUSCRIPT 18
Tomlinson D.C., Wilson J.G., and Harris C.R. 1980. Problems in the assessment of heavy metals
levels in estuaries and the formation of a pollution index. Helgoländer Meeresuntersuchungen.
33(1-4), 566-575.
Trembath L.T., 1973. Hydrothermal synthesis of albite: NaOH on obliquity. Mineralogical
Magazine. 39, 455-63.
USEPA-3052.1996. Microwave assisted acid digestion of siliceous and organically based
matrices; Environmental Protection Agency: Washington, D.C., USA.
USEPA-3050B. 1996. Acid digestion of sediments, sludges, and soils. Environmental Protection
Agency: Washington, D.C., USA.
Varol M. 2011. Assessment of heavy metal contamination in sediments of the Tigris River
(Turkey) using pollution indices and multivariate statistical techniques. J. Hazard. Mater.195,
355-364.
Wang L., Tang W., and Qin B. 2007. The survey of Cd and other elements in river Sediments
affected by phosphorite deposit and coal mine in the area of Longmenshan Mountain, Sichuan
Province (written in Chinese with an English abstract). Geological Science and Technology
Information. 6(26), 36-41.
Wang X.Y., Ni S.J., and Shi Z.M. 2014. Uranium distribution in the sediment of the Mianyuan
River near a phosphate mining region in China and the related uranium speciation in water.
Chem Erde-Geochem. DOI:http://dx.doi.org/10.1016/j.chemer.2014.03.001.
Wang Y., Feng X.H., and Villalobos M. 2012. Sorption behavior of heavy metals on birnessite:
Relationship with its Mn average oxidation state and implications for types of sorption sites.
Chem. Geol.292, 25-34.
Dow
nloa
ded
by [
134.
117.
10.2
00]
at 1
2:04
29
Nov
embe
r 20
14

ACCEPTED MANUSCRIPT
ACCEPTED MANUSCRIPT 19
Xu M., Wang Z., Qi L., Liu L., and Zhang K. 2012. Disaster chains initiated by the Wenchuan
earthquake. Environ. Earth Sci. 65(4), 975-985.
Yang Z., Wang Y., Shen Z., Niu J., and Tang Z. 2009. Distribution and speciation of heavy
metals in sediments from the mainstream, tributaries, and lakes of the Yangtze River catchment
of Wuhan, China. J. Hazard. Mater.166(2-3), 1186-1194.
Yi Y., Yang Z., and Zhang S. 2011. Ecological risk assessment of heavy metals in sediment and
human health risk assessment of heavy metals in fishes in the middle and lower reaches of the
Yangtze River basin. Environ. Pollut.159(10), 2575-2585.
Yu K.C., Tsai L.J., Chen S.H., and Ho S.T. 2001. Correlation analyses on binding behavior of
heavy metals with sediment matrices. Water Res.35(10), 2417-2428.
Zabetoglou K., Voutsa D., and Samara C. 2002. Toxicity and heavy metal contamination of
surficial sediments from the Bay of Thessaloniki (Northwestern Aegean Sea) Greece.
Chemosphere. 49(1), 17-26.
Zhang W., Feng H., Chang J., Qu J., Xie H., and Yu L. 2009. Heavy metal contamination in
surface sediments of Yangtze River intertidal zone: an assessment from different indexes.
Environ. Pollut.157(5), 1533-1543.
Zheng L. 2010. Geochemical characteristics of heavy metals pollution in sediments from
Tuojiang drainage (written in Chinese with English abstract). Master’s thesis. Chengdu
University of Technology.
Zhou J., Cui P., and Fang H. 2013. Dynamic process analysis for the formation of Yangjiagou
landslide-dammed lake triggered by the Wenchuan earthquake, China. Landslides, 10(3), 331-
342.
Dow
nloa
ded
by [
134.
117.
10.2
00]
at 1
2:04
29
Nov
embe
r 20
14
ACCEPTED MANUSCRIPT
ACCEPTED MANUSCRIPT 20
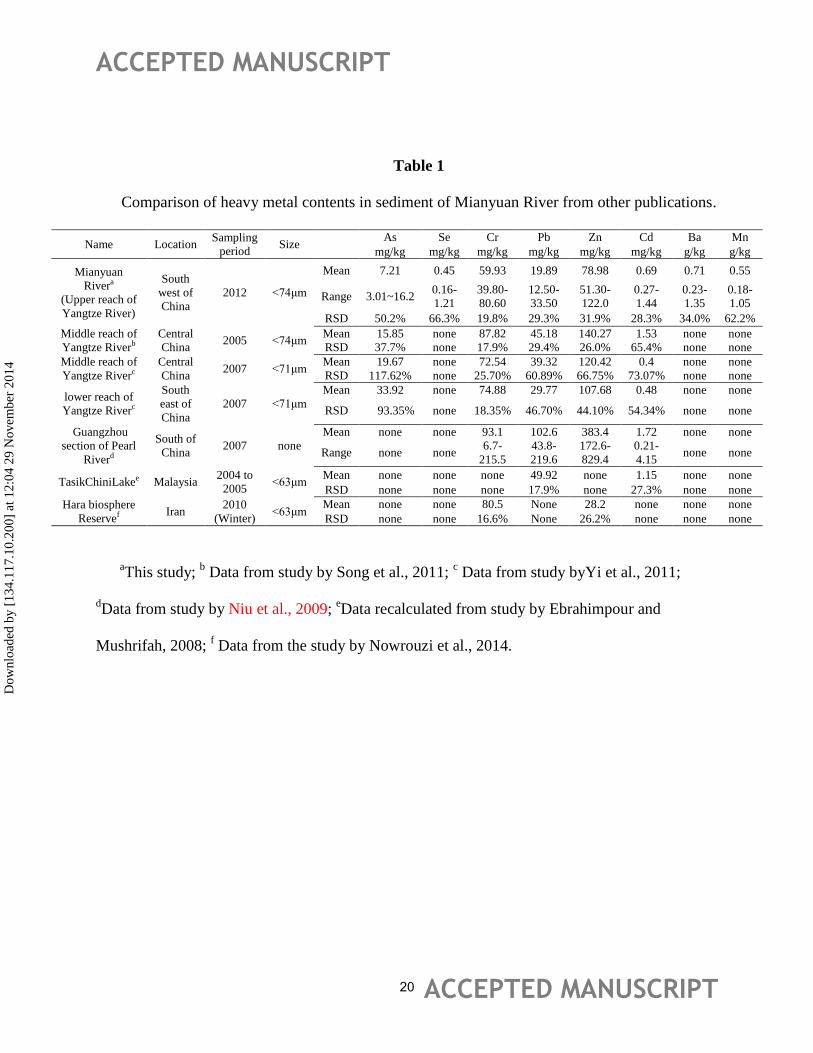
Table 1
Comparison of heavy metal contents in sediment of Mianyuan River from other publications.
Name Location Sampling
period Size
As Se Cr Pb Zn Cd Ba Mn
mg/kg mg/kg mg/kg mg/kg mg/kg mg/kg g/kg g/kg
Mianyuan
Rivera
(Upper reach of
Yangtze River)
South
west of
China
2012 <74μm
Mean 7.21 0.45 59.93 19.89 78.98 0.69 0.71 0.55
Range 3.01~16.2 0.16-
1.21
39.80-
80.60
12.50-
33.50
51.30-
122.0
0.27-
1.44
0.23-
1.35
0.18-
1.05
RSD 50.2% 66.3% 19.8% 29.3% 31.9% 28.3% 34.0% 62.2%
Middle reach of
Yangtze Riverb
Central
China 2005 <74μm
Mean 15.85 none 87.82 45.18 140.27 1.53 none none
RSD 37.7% none 17.9% 29.4% 26.0% 65.4% none none
Middle reach of
Yangtze Riverc
Central
China 2007 <71μm
Mean 19.67 none 72.54 39.32 120.42 0.4 none none
RSD 117.62% none 25.70% 60.89% 66.75% 73.07% none none
lower reach of
Yangtze Riverc
South
east of
China
2007 <71μm
Mean 33.92 none 74.88 29.77 107.68 0.48 none none
RSD 93.35% none 18.35% 46.70% 44.10% 54.34% none none
Guangzhou
section of Pearl
Riverd
South of
China 2007 none
Mean none none 93.1 102.6 383.4 1.72 none none
Range none none 6.7-
215.5
43.8-
219.6
172.6-
829.4
0.21-
4.15 none none
TasikChiniLakee Malaysia 2004 to
2005 <63μm
Mean none none none 49.92 none 1.15 none none
RSD none none none 17.9% none 27.3% none none
Hara biosphere
Reservef Iran
2010
(Winter) <63μm
Mean none none 80.5 None 28.2 none none none
RSD none none 16.6% None 26.2% none none none
aThis study;
b Data from study by Song et al., 2011;
c Data from study byYi et al., 2011;
dData from study by Niu et al., 2009;
eData recalculated from study by Ebrahimpour and
Mushrifah, 2008; f Data from the study by Nowrouzi et al., 2014.
Dow
nloa
ded
by [
134.
117.
10.2
00]
at 1
2:04
29
Nov
embe
r 20
14

ACCEPTED MANUSCRIPT
ACCEPTED MANUSCRIPT 21
Table 2
Pearson correlation matrix of heavy metals and the linear correlations with major elements in sediment
Upstream Cr Ba Pb Zn Cd As Se Mn Al Fe Ca Mg Na K SiO2 TOC
Cr 1
Ba 0.444 1
Pb -0.332 0.456 1
Zn 0.916a 0.692 0.006 1
Cd 0.379 0.511 -0.130 0.337 1
As 0.430 0.577 -0.103 0.383 0.979a 1
Se 0.274 0.668 0.138 0.310 0.944a 0.964
a 1
Mn 0.515 0.898a 0.560 0.764
b 0.372 0.454 0.525 1
Al -0.051 0.090 0.494 0.175 -
0.777b
-0.743 -0.637 0.209 1
Fe 0.652 0.298 0.093 0.730 -0.366 -0.302 -0.342 0.446 0.717 1
Ca 0.221 -0.050 -0.593 -0.020 0.797b 0.764
b 0.622 -0.159
-
0.981a
-0.585 1
Mg 0.142 -0.205 -0.639 -0.137 0.707 0.666 0.517 -0.298 -
0.979a
-0.623 0.986a 1
Na -0.328 -0.028 0.455 -0.067 -
0.811b
-
0.814b
-0.698 0.037 0.910a 0.441 -0.920
a
-
0.913a
1
K -0.577 -0.151 0.721 -0.435 -0.575 -0.541 -0.338 -0.042 0.577 0.057 -0.708 -0.642 0.503 1
SiO2 -0.193 0.168 0.625 0.090 -0.732 -0.699 -0.550 0.255 0.975a 0.584 -0.987
a
-
0.997a
0.941a 0.633 1
TOC 0.256 0.714 0.363 0.343 0.845b 0.875
a 0.958
a 0.637 -0.457 -0.216 0.426 0.326 -0.586
-
0.103
-
0.371 1
Downstream Cr Ba Pb Zn Cd As Se Mn Al Fe Ca Mg Na K SiO2 TOC
Cr 1
Ba 0.794b 1
Pb 0.671b 0.937
a 1
Zn 0.882a 0.916
a 0.829
a 1
Cd 0.708b 0.897
a 0.975
a 0.800
a 1
As 0.546 0.859a
0.891a 0.677
a 0.881
a 1
Dow
nloa
ded
by [
134.
117.
10.2
00]
at 1
2:04
29
Nov
embe
r 20
14

ACCEPTED MANUSCRIPT
ACCEPTED MANUSCRIPT 22
Se 0.261 0.555 0.661 0.394 0.678b 0.865
a 1
Mn 0.795b 0.991
a 0.955
a 0.939
a 0.914
a 0.834
a 0.528 1
Al 0.684b 0.383 0.253 0.687
b 0.232 -0.059 -0.315 0.446 1
Fe 0.886a 0.667
b 0.506 0.890
a 0.493 0.341 0.039 0.697
b 0.906
a 1
Ca -0.433 -0.184 -0.041 -0.435 0.007 0.299 0.637 -0.245 -
0.888a
-
0.697b
1
Mg -
0.857a
-0.592 -0.426 -
0.810a
-0.417 -0.160 0.169 -0.626 -
0.947a
-0.964a 0.818
a 1
Na -0.272 -0.486 -0.616 -0.344 -0.662 -0.819a
-
0.976a
-0.465 0.318 -0.012 -
0.669b
-0.185 1
K -0.361 -0.293 -0.004 -0.173 0.029 -0.089 0.235 -0.198 -0.116 -0.241 0.233 0.323 -0.263 1
SiO2 0.541 0.359 0.244 0.577 0.200 -0.117 -0.501 0.424 0.904a 0.750
b -0.967
a
-
0.863a
0.520 -
0.229 1
TOC -0.604 -0.378 -0.254 -0.415 -0.360 -0.423 -0.289 -0.340 -0.199 -0.419 -0.040 0.338 0.394 0.408 -
0.066 1
a.Correlation is significant at the 0.01 level;
b.Correlation is significant at the 0.05 level
Dow
nloa
ded
by [
134.
117.
10.2
00]
at 1
2:04
29
Nov
embe
r 20
14

ACCEPTED MANUSCRIPT
ACCEPTED MANUSCRIPT 23
Table 3
Geo-accumulation index (Igeo),contamination factor(CF) and pollution load index (PLI) of
heavy metals in river sediment
Upstream Geo-accumulation index (Igeo)
Cr Ba Pb Zn Cd As Se Mn
1 -0.58 -0.58 -0.58 -0.58 -0.58 -0.58 -0.58 -0.58
2 -0.14 1.17 -0.14 0.33 -1.61 -1.09 -1.63 1.40
3 -0.44 1.41 -0.08 -0.10 0.04 0.20 0.99 1.39
4 -0.79 0.96 0.22 -0.47 -1.56 -1.14 -0.31 0.76
5 -0.64 0.98 0.40 -0.21 -1.09 -0.72 0.01 1.50
6 -0.35 1.52 0.11 0.13 0.55 0.37 1.29 1.55
7 -1.03 0.77 0.11 -0.59 -1.76 -1.52 -1.31 0.73
Upstream-mean -0.57 1.14 0.10 -0.15 -0.91 -0.65 -0.16 1.22
Downstream Geo-accumulation index (Igeo)
Cr Ba Pb Zn Cd As Se Mn
8 -0.63 0.50 -0.04 -0.52 -1.16 -1.14 -0.63 0.56
9 -0.65 0.48 -0.12 -0.50 -1.52 -1.18 -1.11 0.53
10 -0.37 0.62 0.05 -0.13 -0.37 -0.14 0.15 0.79
11 -0.43 0.68 -0.32 -0.51 -1.12 -0.77 -0.87 0.46
12 -0.33 0.63 -0.16 -0.62 -1.16 -0.58 -0.82 0.49
13 -0.19 1.95 0.84 0.49 0.65 0.90 0.44 2.34
14 -0.06 1.67 0.63 0.39 0.51 0.50 0.48 1.99
15 -0.14 1.17 -0.14 0.33 -1.61 -1.09 -1.63 1.40
16 -0.01 1.60 0.63 0.49 0.55 -0.16 -1.11 2.06
Downstream-mean -0.31 1.03 0.15 -0.06 -0.58 -0.41 -0.57 1.18
Min -1.03 -0.58 -0.58 -0.62 -1.76 -1.52 -1.63 -0.58
Max 0.02 1.95 0.84 0.49 0.65 0.90 1.29 2.34
Mean-total -0.41 1.08 0.13 -0.10 -0.71 -0.50 -0.40 1.20
Upstream Contamination factor (CF) and pollution load index(PLI)
Cr Ba Pb Zn Cd As Se Mn PLI
1 1 1 1 1 1 1 1 1 1
2 1.36 3.38 1.36 1.88 0.49 0.70 0.48 3.95 1.29
3 1.11 3.98 1.42 1.40 1.54 1.72 2.97 3.92 2.01
4 0.87 2.93 1.74 1.09 0.51 0.68 1.21 2.54 1.23
5 0.96 2.97 1.98 1.30 0.70 0.91 1.52 4.23 1.53
6 1.18 4.31 1.62 1.65 2.20 1.94 3.67 4.38 2.35
7 0.74 2.56 1.62 1.00 0.44 0.52 0.61 2.48 1.01
Mean-upstream 1.04 3.36 1.62 1.39 0.98 1.08 1.74 3.58 1.64
Downstream Contamination factor (CF) and pollution load index(PLI)
Cr Ba Pb Zn Cd As Se Mn PLI
8 0.97 2.13 1.46 1.04 0.67 0.68 0.97 2.21 1.15
Dow
nloa
ded
by [
134.
117.
10.2
00]
at 1
2:04
29
Nov
embe
r 20
14

ACCEPTED MANUSCRIPT
ACCEPTED MANUSCRIPT 24
9 0.96 2.10 1.38 1.06 0.52 0.66 0.70 2.17 1.06
10 1.16 2.30 1.55 1.37 1.16 1.36 1.67 2.60 1.58
11 1.11 2.41 1.20 1.06 0.69 0.88 0.82 2.06 1.17
12 1.19 2.33 1.34 0.98 0.67 1.00 0.85 2.10 1.20
13 1.32 5.78 2.68 2.10 2.36 2.81 2.03 7.57 2.85
14 1.43 4.78 2.33 1.97 2.13 2.11 2.09 5.94 2.54
15 1.36 3.38 1.36 1.88 0.49 0.70 0.48 3.95 1.29
16 1.49 4.54 2.33 2.10 2.20 1.34 0.70 6.28 2.13
Mean-downstream 1.22 3.31 1.74 1.51 1.21 1.28 1.15 3.88 1.71
Min 0.74 1 1 0.98 0.44 0.52 0.48 1 1
Max 1.49 5.78 2.68 2.1 2.36 2.81 3.67 7.57 2.85
Mean-total 1.15 3.33 1.69 1.46 1.12 1.20 1.38 3.76 1.69
Dow
nloa
ded
by [
134.
117.
10.2
00]
at 1
2:04
29
Nov
embe
r 20
14

ACCEPTED MANUSCRIPT
ACCEPTED MANUSCRIPT 25
Table 4
Means of heavy metals in the sediment of Mianyuan River at different time
Cr
mg/kg
Pb
mg/kg
Zn
mg/kg
Cd
mg/kg
As
mg/kg
Se
mg/kg
Mn
g/kg
Ba
g/kg
Sample
number Year Reference
46.1 16.4 None 0.69 7 None None None 21 2006 (Wang et al., 2007)
55.36 29.4 97.21 0.79 10.14 None None None 18 2009 (Zheng, 2010)
59.93 19.89 78.98 0.69 7.21 0.45 0.55 0.71 16 2012 This study
Dow
nloa
ded
by [
134.
117.
10.2
00]
at 1
2:04
29
Nov
embe
r 20
14

ACCEPTED MANUSCRIPT
ACCEPTED MANUSCRIPT 26
Table 5
Total variance explained and rotated component matrices of data from upstream and downstream
Upstream Component
Upstream-1 Upstream-2 Upstream-3
Cr 0.286 0.954 -0.193
Ba 0.511 0.486 0.659
Pb -0.103 -0.143 0.962
Zn 0.245 0.963 0.170
Cd 0.973 0.095 -0.33
As 0.967 0.155 0.016
Se 0.960 0.585 0.406
Mn 0.293 0.603 0.724
% Total variance 57.04 21.56 18.85
% Cumulative
variance 57.04 78.60 97.45
Downstream Component
Downsteam-1 Downstream-2
Cr 0.929 0.271
Ba 0.825 0.477
Pb 0.544 0.806
Zn 0.932 0.439
Cd 0.530 0.802
As 0.307 0.934
Se -0.42 0.931
Mn 0.832 0.457
% Total variance 81.08 13.00
% Cumulative
variance 81.08 94.08
Dow
nloa
ded
by [
134.
117.
10.2
00]
at 1
2:04
29
Nov
embe
r 20
14

ACCEPTED MANUSCRIPT
ACCEPTED MANUSCRIPT 27
Figure 1.Sampling sites along the Mianyuan River (Wang et al., 2014)
Figure 2.Dendrogram showing clustering of heavy metals in sediment of (a) upstream and (b)
downstream
Dow
nloa
ded
by [
134.
117.
10.2
00]
at 1
2:04
29
Nov
embe
r 20
14

ACCEPTED MANUSCRIPT
ACCEPTED MANUSCRIPT 28
Figure 3.PCA of heavy metals in sediment of (a) upstream and (b) downstream
Figure 4.A road extending from phosphate mine (S2) to the Tsingping County (S6)
Dow
nloa
ded
by [
134.
117.
10.2
00]
at 1
2:04
29
Nov
embe
r 20
14