Embed Size (px)
Citation preview
Int. J. Electrochem. Sci., 12 (2017) 9865 – 9881, doi: 10.20964/2017.10.29
International Journal of
ELECTROCHEMICAL SCIENCE
www.electrochemsci.org
Metal Complexes and Determination of Nalidixic Acid by
Potentiometric and Conductometric Methods
O. A. Farghaly
1,*, H. M. Al–Saidi
2, A. H. Naggar
1, I. M. El–Mabrouk
3
1 Chemistry Department, Faculty of Science, Al–Azhar University, Assiut Branch, 71524, Assiut,
Egypt. 2 Department of Chemistry, University College in Al–Jamoum, Umm Al–Qura University, 21955,
Makkah, Saudi Arabia 3 Chemistry Department, Faculty of Science, Sebha University, Sebha, Libya
*E–mail: [email protected]
Received: 17 June 2017 / Accepted: 30 July 2017 / Published: 12 September 2017
Ten metal ions viz, Fe(III), Cr(III), La(II), Sn(II), Co(II), Ba(II), Pd(II), Ti(II), Sr(II) and Zr(IV), were
selected to elucidate their interaction with nalidixic acid (NA) using potentiometric and
conductometric methods. The ligand ionization and the complexes stability constants have been
obtained at 25±1.0 ºC and 0.01 M ionic strength of NaCl in 25 % (v/v) aqueous–ethanol solution.
Complexes of 1:1, 1:2 and/or 1:3 metals to ligand ratios were formed depending on the nature of the
ligand or metal ions. As well as, the stoichiometry of complexes confirmed by the conductometric
method. Also simple, precise, rapid and low–cost potentiometric and conductometric methods for NA
determination and tablets are proposed. NA present in tablets containing known quantity of drug was
potentiometrically titrated by 0.1 M of NaOH using a combined glass pH electrode. The detection limit
was 0.19 mg L–1
. The calibration graph was found to be linear in the range of 0.23–2.55 mg L–1
. The
correlation coefficient (r) was calculated to be 0.9952. The standard deviation (SD) was < 1.0. No
interferences were observed in the presence of common components of the tablets. The percentage
recoveries of NA in tablet dosage formulations by potentiometric and conductometric methods were
(95.8–98.68) %, with standard deviations (SD) were within (0.18–0.4) (n=5).
Keywords: Nalidixic acid, metal complexes, potentiometric and conductometric determination,
tablets.
1. INTRODUCTION
Quinolones are gyrase inhibitors that are widely used clinically as antibiotics. They are active
against many gram–positive and gram–negative bacteria. Nalidixic acid (1–ethyl–1,4–dihydro–7–
methyl–4–oxo–1,1,8–naphthyridine–3–carboxylic acid) (NA) is widely used to treat infections of the
urinary tract. It is effective against most Proteus strains, Klebsiella, Enterobacter, some Salmonella and
Int. J. Electrochem. Sci., Vol. 12, 2017
9866
Shigella strains, and Escherichia coli. It is rapidly and almost completely absorbed from the gastro-
intestinal tract and about 93 % of NA is bound to plasma protein [1–4]. NA has the following
structure:
Several types of analytical procedures have been proposed for the analysis of NA in pure form,
pharmaceuticals formulations and biological fluids. These procedures include high–performance liquid
chromatograph (HPLC) [5–7], voltammetry [8–10], fluorometric [11–13], spectrophotometric [14, 15]
and potentiometric method [16]. Although all these method showed an excellent recovery but they still
required special instruments, reagents and experience.
The use of Gran plot [17] for finding the equivalence point of a potentiometric titration has
several advantages over the more commonly used procedure of inflection point determination of a
sigmoidal logarithmic plot such as a pH titration curve. Several applications of Gran plot have
appeared in the literature like fluoride concentration by use of a specific ion electrode [18], acid rain
analysis [19] and the measurement of percent strong acid found in atmospheric aerosols over the
northeastern United States [20].
Recently, great attention has been paid to use potentiometric methods in study of binary and
ternary complexes of transition metals with molecules of biological and pharmaceutical interest [21–
30]. The significance of potentiometric methods as the most accurate and widely applicable technique
in studies related to ionic equilibria of different complexes [31]. It should be noted that the presence of
metal ions in biological fluids could have a significant effect on the therapeutic action of such organic
compounds [32]. Such metal complexes were produced also from reactions between NA and several
metal complexes [33–39].
The objective of this work was study of the complexation equilibrium between NA and metal
ions such as Pb (II), Cr (III), Fe (III), La (III), Sn (II), Co (II), Ti (II), Zr (IV), Ba (II) and Sr (II), by
accurate and widely applicable potentiometric and conductometric methods. Also, potentiometric and
conductometric methods (for the first time) were development to the determination of NA of pure and
tablet dosage formulations. Although, several method were used to determination of NA but it still
required high cost instruments, reagents and experience, but these methods are simple, precise, rapid,
low–cost and showed an excellent recovery. These methods are based on the potentiometric and
conductometric titrations of NA (carboxyl group) in aqueous solutions with sodium hydroxide
solution.

Int. J. Electrochem. Sci., Vol. 12, 2017
9867
2. EXPERIMENTAL
2.1. Apparatus
All pH measurements were carried out on pH–meter model ELE international, using combined
glass electrode (accurate total 0.01 pH units). Conductometric titration measurements were carried out
using conductivity meter model 4320, Jenway, using an immersion cell. The electrode system was
calibrated in terms of hydrogen ion concentrations instead of activities; thus all constants determined
in this work are concentration constants. The stoichiometry and stability constants were calculated
using numerical and computerized programs (Excel) [21].
2.2. Materials
Nalidixic acid (NA) was purchased from Sigma (St Louis, MO, USA) and sodium hydroxide
(BDH) were used as such. All other metal ions solutions (as nitrates and chlorides salts) were used as
purchased with an analytical grade from (BDH, UK, GENEVA or INDIA).
Pharmaceutical formulations: Nalidram (Tablet) (Memphis Chemicals, Egypt), Nalidixic acid
(Tablet) (Dar Al–daoa–Jordan) and Uroneg (Tablet) (Micro Labs Limited–India). Each of them labeled
to contains 500 mg NA per tablet.
2.3. Procedure
2.3.1. Metal complexes of NA
A stock standard solution of NA (1.0×10⁻²
mol L–1
) was prepared by dissolving the product
from Sigma in 25 % (v/v) aqueous ethanol medium. Standard solutions were prepared from the stock
solution by appropriate dilution with double distilled water. Working solutions have shown enough
stability during all time of storage. Generally, the following solutions: (a) 0.001 M HCl + 0.009 M
NaCl; (b) solution (a) + 0.001 M NA; and (c) solution (b) + 0.001 M metal ion, were prepared and
titrated against standared CO2–free NaOH solution [40] at room temperature.
In all titrations, the total volume was maintained constant at 50 mL with ionic strength 0.01 M
NaCl at 25±1.0 ºC. Multiple titrations were carried out for each system. The pH–meter was calibrated
before and after each titration using three standard buffer solutions at pH 4,7 and 10.
Conductometric titration were carried out at room temperature by titration 25 mL of 1×10⁻³
M
of each metal ion with 1×10⁻²
M of NA solution in 0.5 mL increments. Correction for the dilution
effect is performed by multiplying the values of specific conductance by factor (25 + v) / 25, where V
is the volume of titrant added.
2.3.2. Determination of NA
2.3.2.1. In pure form
A standard solution (25 mL) of NA (1×10⁻²
M) (ionic strength (I) adjusted to 0.5 M with
NaNO3) was prepared by suitable dilution of the stock solution. Then, an aliquot of 15 mL of NA
solution was transferred to a thermostated glass cell (25±1.0 ºC) then potentiometrically and
conductometrically titrated with a standard solution of NaOH 0.1 M adjusted of ionic strength.

Int. J. Electrochem. Sci., Vol. 12, 2017
9868
2.3.2.2. In Tablets
Ten tablets of dosage form were weighed to calculate the average tablet weight. They were
finely powdered and homogenized. A portion of the powder equivalent to 100 mg of NA was
accurately weighed and dissolving in ethyl alcohol and filtered. The filtrate was diluted with double
distilled water and its ionic strength was adjusted to 0.5 M with NaNO3. Finally, a portion of this
solution was diluted with double distilled water in a 25 mL flask and analyzed under the same
procedure described in pure form. The quantity per tablet was calculated from the standard calibration
curve.
3. RESULTS AND DISCUSSION
3.1. Formation constants of NA complexes:
3.1.1. Potentiometric studies of NA with some metal ions:
The interaction of NA with selected ten metal ions viz; Pb (II), Cr (III), Fe (III), La (III), Sn
(II), Co (II), Ti (II), Zr (IV), Ba (II) and Sr (II), was studied using potentiometric and conductometric
methods. In the potentiometric method, the ionization constant of NA and stability constants of the
formed complexes have been tabulated at 25±1.0 ºC, ionic strengths ( 0.01 M) NaCl in 25 % (v/v)
aqueous ethanol medium.
3.1.2. Determination of the proton–NA stability constant:
Potentiometric titration of nalidixic acid (NA) in the presence of 0.001 M hydrochloric acid
was carried out with ionic strength, of I = 0.01 M NaCl at 25±1.0οC and using carbonate-free CO2
sodium hydroxide as a titrant. The obtained titration curve is shown in Fig.1.
The values of ńA (average number of proton attached per ligand) as determined according to
Irving and Rossotti [41.42] were obtained from the titration curves data using solutions (a) and (b).
Calculation of proton-ligand dissociation constants were carried out by plotting ńA against pH (Fig.2).
The value of logK1H (the first proton dissociation constant of NA) is the pH value
corresponding to ńA = 0.5. The average number of proton attached per ligand (ńA) was calculated at
different pH values using Irving and Rossotti[41.42], as shown in eq. (1).
1..............)(
))((
10
21
o
c
oo
LTVV
ENVVyAn
Where: Y = 2 (number of dissociable protons in the ligand), V0 is the initial volume, V1 and V2
are the volume of alkali required to reach the same pH in mineral acid (HCl) and (HCl + NA)
solutions, respectively. TcL0
is the total concentration of the ligand, N0
is the normality of the alkali and
E0 is the initial concentration of free acid.

Int. J. Electrochem. Sci., Vol. 12, 2017
9869
Figure 1. Potentiometric titration curves of NA: (a) HCl, (b) NA, (c) Ba (II), (d) Co (II), (e) Pb (II), (f)
Sn (II) and (g) Cr (III) with I = 0.01 M NaCl at 25±1.0 °C.
Figure 2. Proton–ligand formation curve of NA, I = 0.01 M NaCl at 25±1.0 °C.
The values obtained of logK1H (the first proton dissociation constants of the NA) was 6.4. The
pKa value obtained by treatment was good agreement with literatures [16, 33] for several sets of
potentiometric data as we can see in Table 1.
However, the reaction mechanism is shown as follow:
Int. J. Electrochem. Sci., Vol. 12, 2017
9870
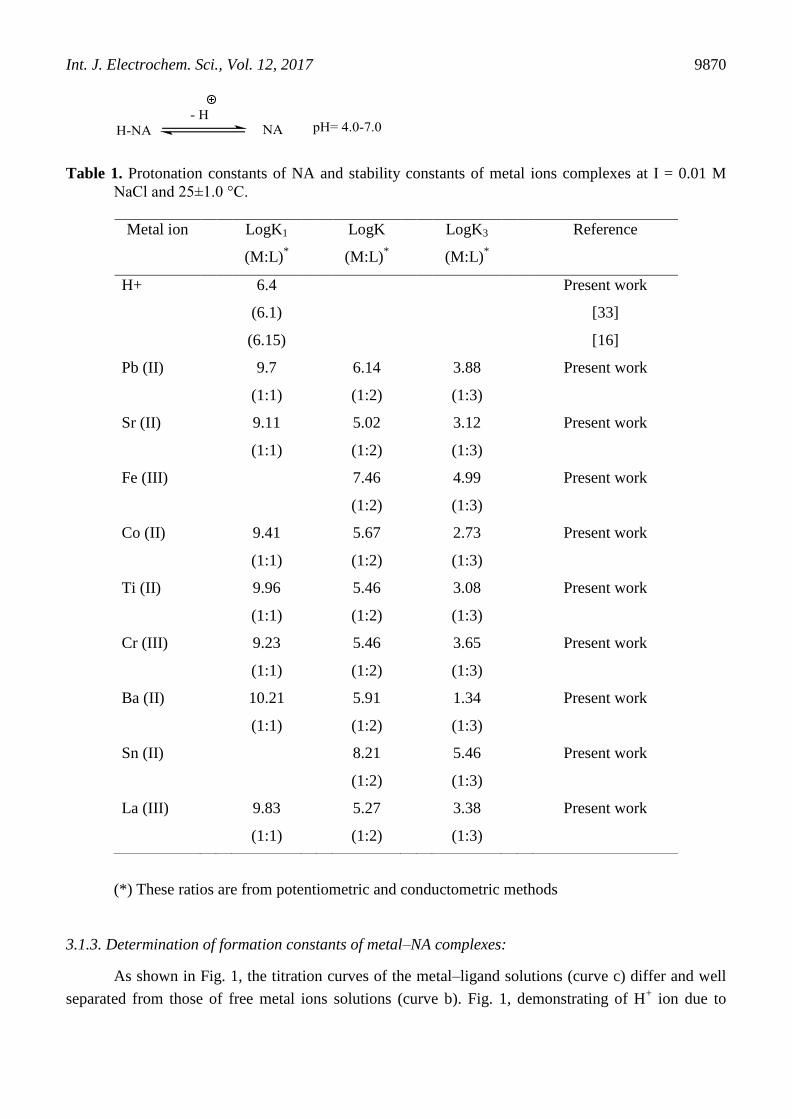
Table 1. Protonation constants of NA and stability constants of metal ions complexes at I = 0.01 M
NaCl and 25±1.0 °C.
(*) These ratios are from potentiometric and conductometric methods
3.1.3. Determination of formation constants of metal–NA complexes:
As shown in Fig. 1, the titration curves of the metal–ligand solutions (curve c) differ and well
separated from those of free metal ions solutions (curve b). Fig. 1, demonstrating of H+ ion due to
Metal ion LogK1
(M:L)*
LogK
(M:L)*
LogK3
(M:L)*
Reference
H+ 6.4 Present work
(6.1)
(6.15)
[33]
[16]
Pb (II) 9.7
(1:1)
6.14
(1:2)
3.88
(1:3)
Present work
Sr (II) 9.11
(1:1)
5.02
(1:2)
3.12
(1:3)
Present work
Fe (III) 7.46
(1:2)
4.99
(1:3)
Present work
Co (II) 9.41
(1:1)
5.67
(1:2)
2.73
(1:3)
Present work
Ti (II) 9.96
(1:1)
5.46
(1:2)
3.08
(1:3)
Present work
Cr (III) 9.23
(1:1)
5.46
(1:2)
3.65
(1:3)
Present work
Ba (II) 10.21
(1:1)
5.91
(1:2)
1.34
(1:3)
Present work
Sn (II) 8.21
(1:2)
5.46
(1:3)
Present work
La (III) 9.83
(1:1)
5.27
(1:2)
3.38
(1:3)
Present work

Int. J. Electrochem. Sci., Vol. 12, 2017
9871
complexation. The values of (average number of ligand molecules per metal ion) and pL (free ligand
exponent) were calculated using Irving and Rossotti [41, 42], Eq. 2, 3:
(2)
(3)
The values were plotted against the corresponding pL values to obtain the formation curves
of the complexation equilibria Fig. 3. From these curves the values of the stability constants were
computed using standard procedures based on the calculations of and pL as described previously
[21]. The stoichiometry of the chelates depends on the nature of the metal ion and ligand. As shown in
Table 1, we observe that the most metal ions investigated form complexes with NA in the molar ratio
metal to ligand 1:1, 1:2 and 1:3. On the other hand, Fe (III), Sn (II) and Zr (IV) metal ions form
complexes with stoichiometric ratios 1:2 and 1:3. This is due to the nature of metal ions. The stability
constants of complexes formed between NA and metal ions investigated in this work for 1:2
(metal:ligand) follow this order [43, 44]:
Zr (IV) > Cr (III) > Fe (III) > Sn (II) > Pb (II) > Ba (II) > Co (II) > La (III) > Ti (II) > Sr (II)
Figure 3. Metal ion–NA formation curves: (a) Sn (II), (b) Fe (III), (c) Ti (II), (d) Co (II), (e) Ba (II), I
= 0.01 M NaCl at 25±1.0 °C.
Int. J. Electrochem. Sci., Vol. 12, 2017
9872
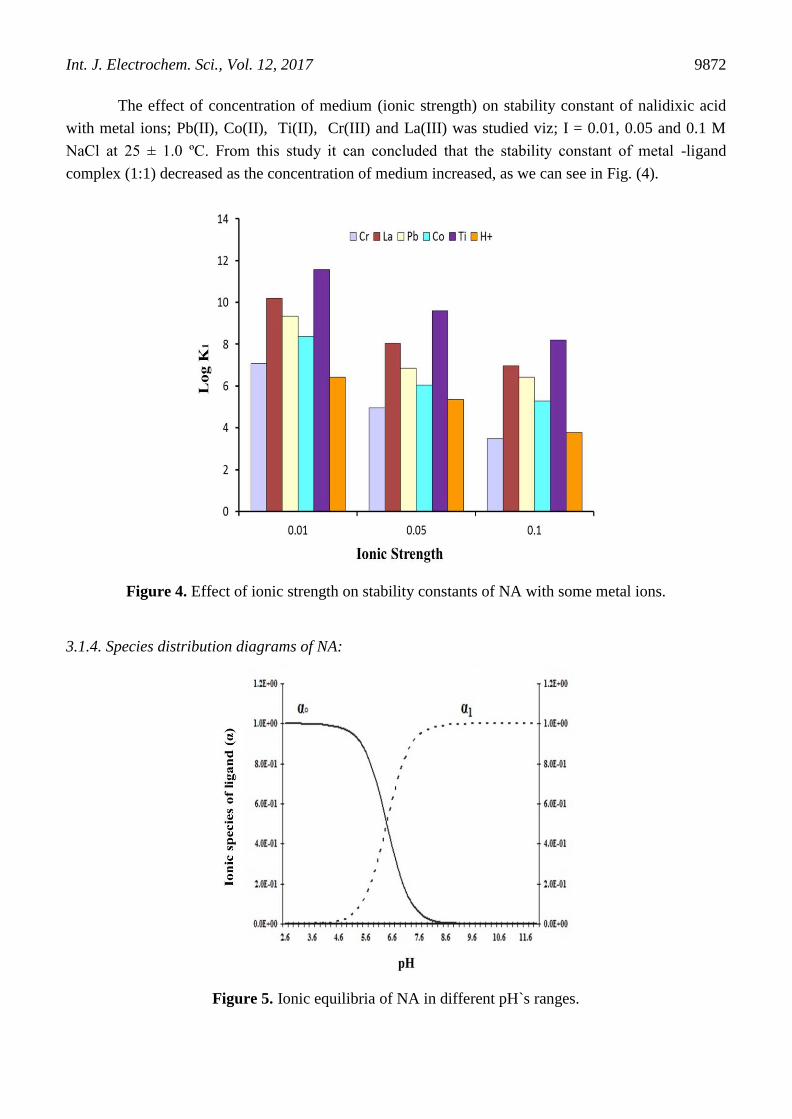
The effect of concentration of medium (ionic strength) on stability constant of nalidixic acid
with metal ions; Pb(II), Co(II), Ti(II), Cr(III) and La(III) was studied viz; I = 0.01, 0.05 and 0.1 M
NaCl at 25 ± 1.0 ºC. From this study it can concluded that the stability constant of metal -ligand
complex (1:1) decreased as the concentration of medium increased, as we can see in Fig. (4).
Figure 4. Effect of ionic strength on stability constants of NA with some metal ions.
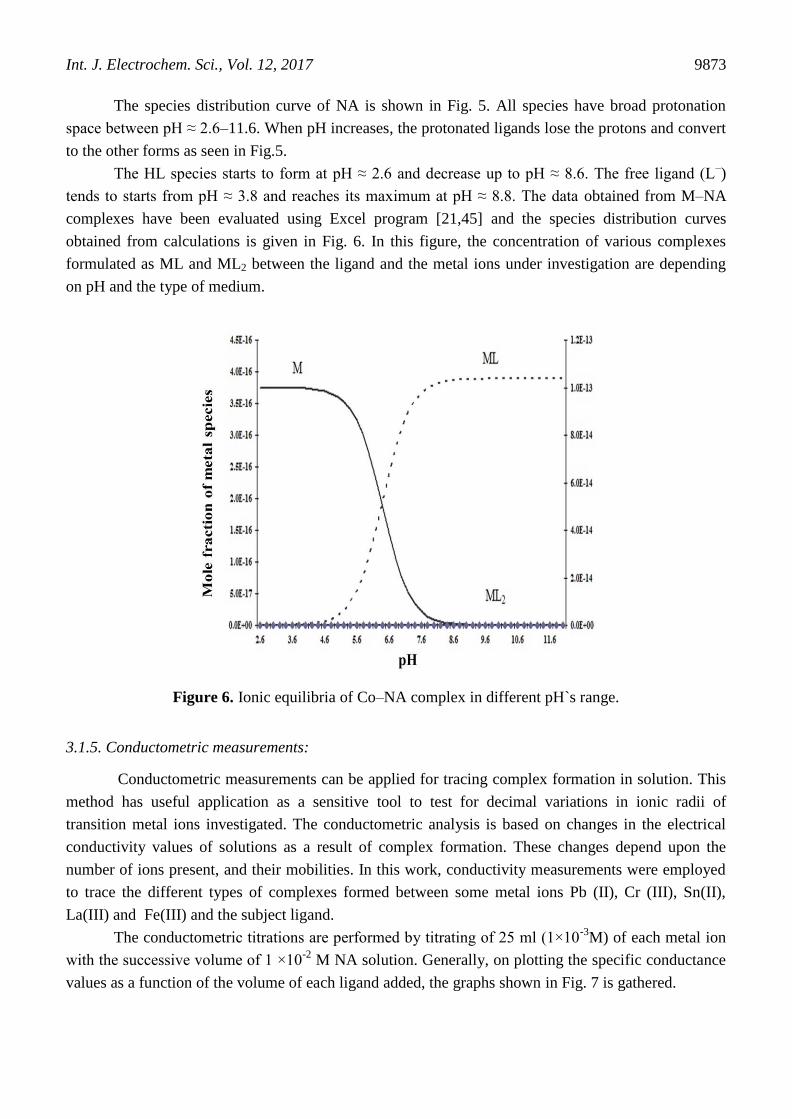
3.1.4. Species distribution diagrams of NA:
Figure 5. Ionic equilibria of NA in different pH`s ranges.
Int. J. Electrochem. Sci., Vol. 12, 2017
9873
The species distribution curve of NA is shown in Fig. 5. All species have broad protonation
space between pH ≈ 2.6–11.6. When pH increases, the protonated ligands lose the protons and convert
to the other forms as seen in Fig.5.
The HL species starts to form at pH ≈ 2.6 and decrease up to pH ≈ 8.6. The free ligand (L–)
tends to starts from pH ≈ 3.8 and reaches its maximum at pH ≈ 8.8. The data obtained from M–NA
complexes have been evaluated using Excel program [21,45] and the species distribution curves
obtained from calculations is given in Fig. 6. In this figure, the concentration of various complexes
formulated as ML and ML2 between the ligand and the metal ions under investigation are depending
on pH and the type of medium.
Figure 6. Ionic equilibria of Co–NA complex in different pH`s range.
3.1.5. Conductometric measurements:
Conductometric measurements can be applied for tracing complex formation in solution. This
method has useful application as a sensitive tool to test for decimal variations in ionic radii of
transition metal ions investigated. The conductometric analysis is based on changes in the electrical
conductivity values of solutions as a result of complex formation. These changes depend upon the
number of ions present, and their mobilities. In this work, conductivity measurements were employed
to trace the different types of complexes formed between some metal ions Pb (II), Cr (III), Sn(II),
La(III) and Fe(III) and the subject ligand.
The conductometric titrations are performed by titrating of 25 ml (1×10⁻³
M) of each metal ion
with the successive volume of 1 ×10⁻²
M NA solution. Generally, on plotting the specific conductance
values as a function of the volume of each ligand added, the graphs shown in Fig. 7 is gathered.
Int. J. Electrochem. Sci., Vol. 12, 2017
9874
The relationships show well defined breaks corresponding to the stiochiometric ratios 1: 1, 1: 2
and/ or 1: 3, M: L. These results are in agree with those obtained by potentiometric method (Table 1).
Figure 7. Conductometric titration curves of 25 mL metal ions (1×10⁻³
M) with NA (1×10⁻²
M): (a) Fe
(III), (b) Cr (III), (c) La (III), (d) Co (III), (e) Pb (II).
3.2. Potentiometric determination of NA:
Although NA was determined previously by several analytical techniques, the proposed
method in the current article is still characterized as simple, low cost and do not involve laborious
time–consuming sample preparation.
In current work, we aimed to determine NA using the neutralization reaction involving the
acidic property of NA. The proposed methods depend on the principle that substance, which is weakly
acidic in an aqueous medium, exhibit enhanced acidity in non–aqueous media thus allowing their easy
determination. In the present titrimetric methods, the weakly acidic property of NA was titrated with
NaOH using potentiometric and conductometric end point detection.
The main concept of a Gran plot is that a linear relationship can be found between the analyte
concentration (NA) during titration and the volume of base added as titrant (NaOH). Such that a plot of
this relationship versus the volume of titrant will yield a straight line that intercepts the titrant volume
axis at the equivalence volume for the analyte [17, 46].
NA is one basic acid having dissociation constant pK1 = 6.4 (carboxyl group). Observing the
value of NA, it can be foreseen that the titration curve presents a clear inflection for the first point of
equivalence since K1 = 1×10–6.4
.
Int. J. Electrochem. Sci., Vol. 12, 2017
9875
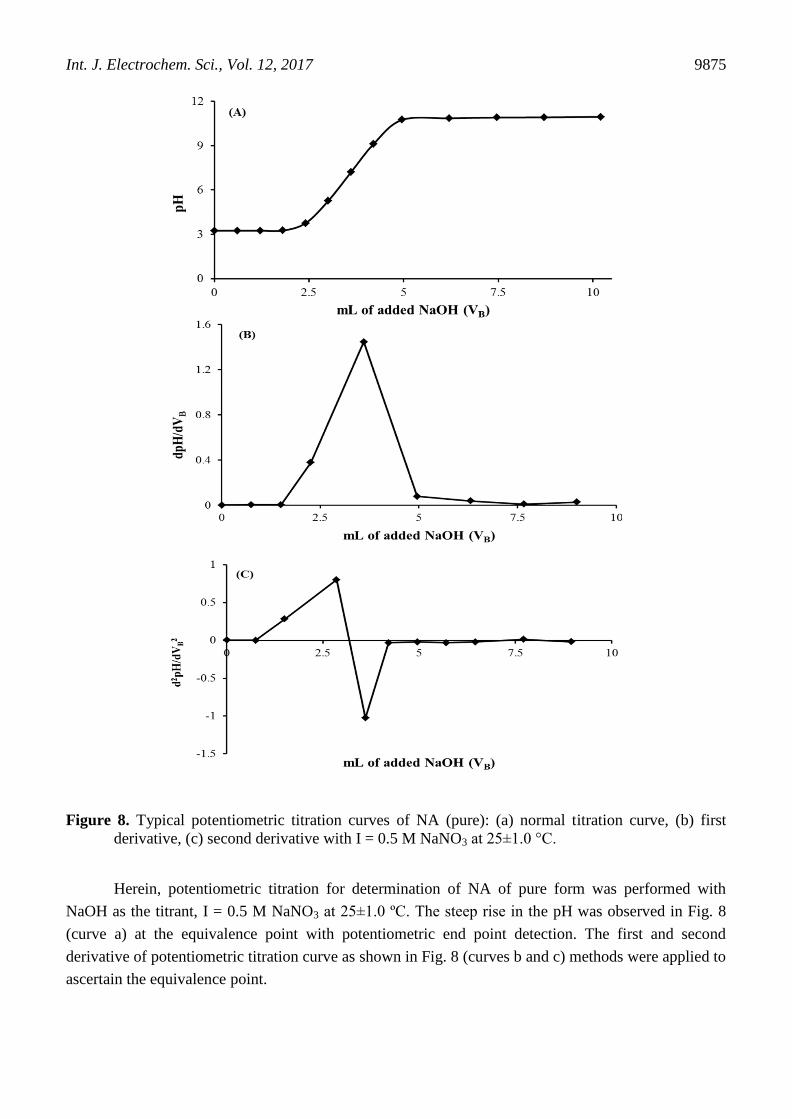
Figure 8. Typical potentiometric titration curves of NA (pure): (a) normal titration curve, (b) first
derivative, (c) second derivative with I = 0.5 M NaNO3 at 25±1.0 °C.
Herein, potentiometric titration for determination of NA of pure form was performed with
NaOH as the titrant, I = 0.5 M NaNO3 at 25±1.0 ºC. The steep rise in the pH was observed in Fig. 8
(curve a) at the equivalence point with potentiometric end point detection. The first and second
derivative of potentiometric titration curve as shown in Fig. 8 (curves b and c) methods were applied to
ascertain the equivalence point.
Int. J. Electrochem. Sci., Vol. 12, 2017
9876
Also, the conductometric analysis is based on changes in the electrical conductivity values of
solutions as a result of neutralization by the base. These changes depend upon the number of ions
present, and their mobilities. In this work, conductivity measurements were employed to determine the
weakly acidic NA by titration with sodium hydroxide.
Generally, on plotting the specific conductance values as function of the volume of 0.1 M
sodium hydroxide. This relationships show a well-defined break corresponding to the end point of
neutralization.
3.2.1. Effect of ionic strength on the determination of pure NA:
To study the effect of ionic strength on the determination of nalidixic acid of pure form using
potentiometric method, aliquots equivalent 5×10⁻³
M of the drug was determined by the varying the
ionic strength of medium in range (0.05-1.0) M NaNO3. The recovery increase with increasing
concentration of the NaNO3 solution, and it was found that 0.5M NaNO3 gave the best value of the
recovery (in closed 100 %). Thus, it was used in the determination of nalidixic acid of pure and dosage
forms. The results are listed in table 2.
Table 2. Effect of ionic strength on the percentage recovery for pure NA.
Ionic Strength
(M)
Add from pure
(mg)
Found
(mg)
Percentage recovery ± SD
(%)
0.05 500 405.5 81.1 ± 0.35
0.1 500 449.5 89.9 ± 0.25
0.5 500 494.0 98.8 ± 0.23
0.75 500 574.5 114.9 ± 0.42
1 500 655.5 131.1 ± 0.19
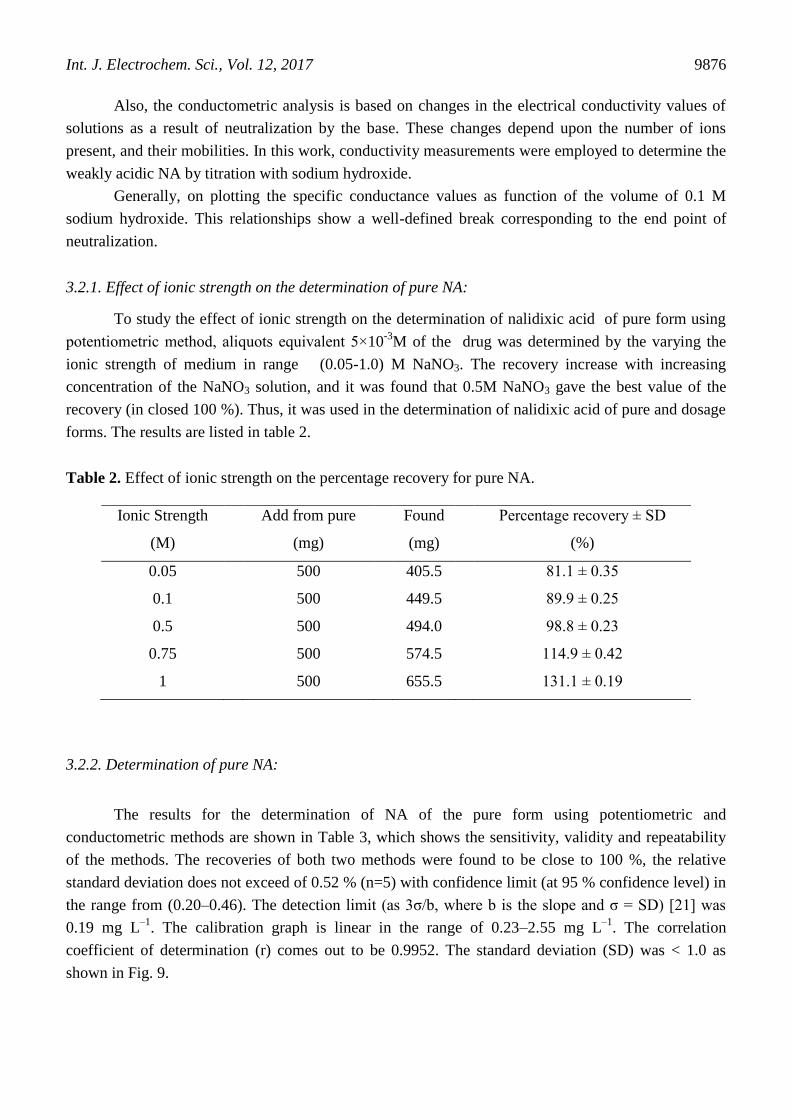
3.2.2. Determination of pure NA:
The results for the determination of NA of the pure form using potentiometric and
conductometric methods are shown in Table 3, which shows the sensitivity, validity and repeatability
of the methods. The recoveries of both two methods were found to be close to 100 %, the relative
standard deviation does not exceed of 0.52 % (n=5) with confidence limit (at 95 % confidence level) in
the range from (0.20–0.46). The detection limit (as 3σ/b, where b is the slope and σ = SD) [21] was
0.19 mg L–1
. The calibration graph is linear in the range of 0.23–2.55 mg L–1
. The correlation
coefficient of determination (r) comes out to be 0.9952. The standard deviation (SD) was < 1.0 as
shown in Fig. 9.
Int. J. Electrochem. Sci., Vol. 12, 2017
9877
Table 3. Determination of NA in pure form by using proposed methods with I = 0.5 M NaNO3 at
25±1.0 °C.
Add of pure
(mg/L)
Found
(mg/L)
Recovery
(%)
SD
(n=5)
Confidence (n=5)
α =0.05
0.232 0.222
(0.221)
95.5
(95.1)
0.45
(0.52)
0. 39
(0. 46)
0.697 0.671
(0.668)
96.34
(95.8)
0.38
(0.46)
0.33
(0.40)
1.161 1.142
(1.135)
98.4
(97.8)
0.35
(0.42)
0.31
(0.37)
1.625 1.628
(1.615)
100.2
(99.4)
0.28
(0.38)
0.25
(0.33)
2.09 2.142
(2.115)
102.5
(101.2)
0.23
(0.31)
0.20
(0.27)
2.55 2.657
(2.64)
104.2
(103.5)
0.22
(0.33)
0.19
(0.29)
The data between brackets were from conductivity method
Figure 9. Linearity range of NA.
Int. J. Electrochem. Sci., Vol. 12, 2017
9878
3.2.3. Effect of interferences:
To assess the usefulness of the proposed method, the effect of the common components
(additives and excipients), which often accompany NA of the pure form, viz; (D(+) lactose
monohydrate, sodium chloride and sodium acetate) were investigated in a concentration range at least
100 times higher than that of NA. No interferences observed in this concentration range.
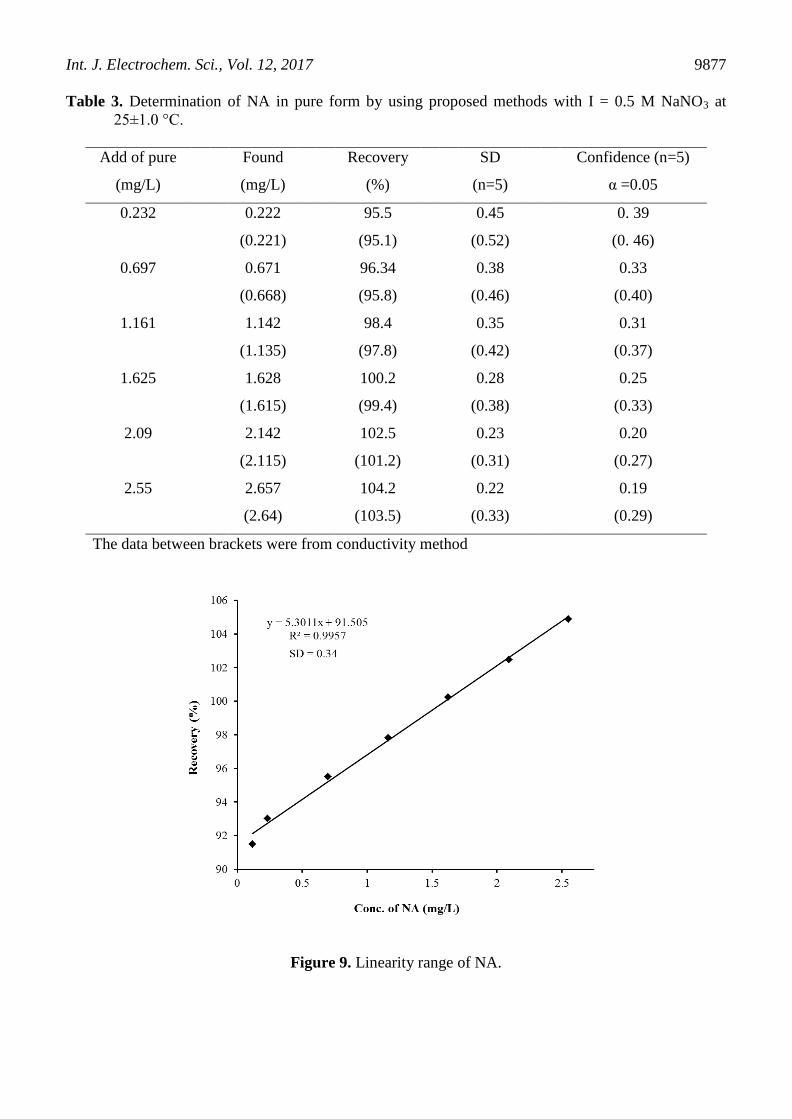
3.2.4. Analytical application:
The proposed methods were successfully applied for NA determination in tablet formulation. In
Fig. 10, curves a, b and c are: the typical potentiometric titration curve with only one inflection point,
the first and the second derivative of the potentiometric curve, respectively.
Figure 10. Typical potentiometric titration curves of NA (tablet): (a) normal titration curve, (b) first
derivative, (c) second derivative with I = 0.5 M NaNO3 at 25±1.0 °C.
Int. J. Electrochem. Sci., Vol. 12, 2017
9879
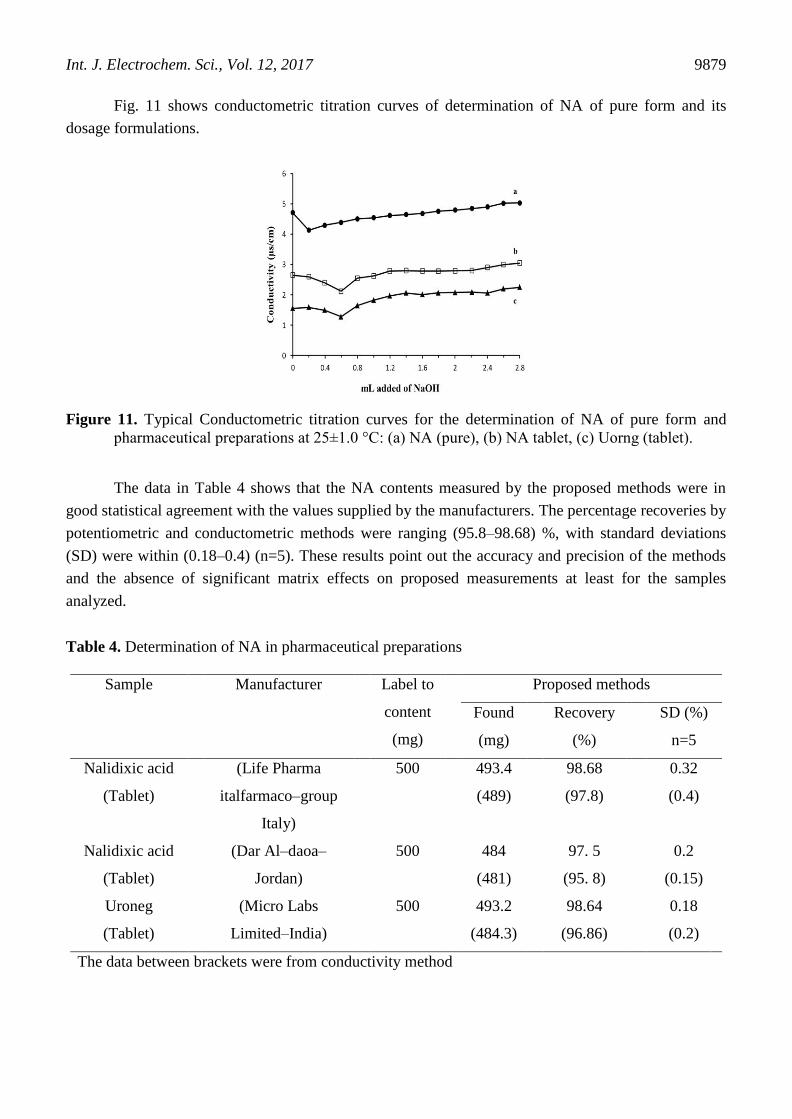
Fig. 11 shows conductometric titration curves of determination of NA of pure form and its
dosage formulations.
Figure 11. Typical Conductometric titration curves for the determination of NA of pure form and
pharmaceutical preparations at 25±1.0 °C: (a) NA (pure), (b) NA tablet, (c) Uorng (tablet).
The data in Table 4 shows that the NA contents measured by the proposed methods were in
good statistical agreement with the values supplied by the manufacturers. The percentage recoveries by
potentiometric and conductometric methods were ranging (95.8–98.68) %, with standard deviations
(SD) were within (0.18–0.4) (n=5). These results point out the accuracy and precision of the methods
and the absence of significant matrix effects on proposed measurements at least for the samples
analyzed.
Table 4. Determination of NA in pharmaceutical preparations
Sample Manufacturer Label to
content
(mg)
Proposed methods
Found
(mg)
Recovery
(%)
SD (%)
n=5
Nalidixic acid
(Tablet)
(Life Pharma
italfarmaco–group
Italy)
500 493.4
(489)
98.68
(97.8)
0.32
(0.4)
Nalidixic acid
(Tablet)
(Dar Al–daoa–
Jordan)
500 484
(481)
97. 5
(95. 8)
0.2
(0.15)
Uroneg
(Tablet)
(Micro Labs
Limited–India)
500 493.2
(484.3)
98.64
(96.86)
0.18
(0.2)
The data between brackets were from conductivity method
Int. J. Electrochem. Sci., Vol. 12, 2017
9880
4. CONCLUSION
Potentiometric and conductometric methods are excellent methods for calculation of stability
constant of metal ligand complexes. NA has one dissociation constant logK1
H = 5.0. However, NA
forms complexes with metal ions of types 1:1, 1:2 and/or 1:3 (M: L) complexes. The stoichiometric
ratio that obtained from the potentiometric method is well agreement with the results of
conductometric method. Finally, the species distribution of ligands and its metal complexes under
investigated are variables during the pHʼs ranges.
Compared with many of already existing methods used for the determination of NA, which
required special instruments, reagents and experience, our method exhibited the advantages of simple
operations, fast response, low cost and sufficient accuracy in determination of NA in pharmaceutical
formulation with high recovery ranging 95.8 – 98.68 % and no interferences observed.
References
1. R. Gleckman, S. Alvarez, D. W. Joubert, S. J. Matthews, Am. J. Hosp. Pharm., 36 (1979) 1071–
1076.
2. S. C. Sweetman, (Ed) Martindale, The Extra Pharmacopiea, 33 Ed., Royal Pharmaceutical Society,
London, 2002; pp. 227.
3. The United States Pharmacopial convention: The United States Pharmacopeia xxv / the National
Formulary xx / Rockvile, USP Inc. 2002; pp. 1183.
4. E. W. McChesney, E. J. Froelich, G. Y. Lesher, A. V. R. Crain, D. Rosi, Toxicol. Appl. Pharm., 6
(1964) 292–309.
5. M. Horie, K. Saito, Y. Hoshino, N. Nose, E. Mochizuki, H. Nakazawa, J. Chromatogr. A, 402
(1987) 301–308.
6. N. H. Foda, J. Liq. Chromatogr., 18 (1995) 4135–4147.
7. A. Daneshfar, H. J. Lotfi, T. Khezeli, Acta Chromatographica, 23 (2011) 567–577.
8. P. Norouzi, M. R. Ganjali, B. Larijani, S. Karamdoustc, Croatica Chemica Acta (CCACAA), 81
(2008) 423–430.
9. M. S. Ibrahim, I. S. Shehatta, M. R. Sultan, Talanta, 56 (2002) 471–479.
10. A. Guiberteau Cabanillas, M. I. Rodríguez Cáceres, M. A. Martínez Cañas, J. M. Ortiz Burguillos,
T. Galeano Díaz, Talanta, 72 (2007) 932–940.
11. I. D. Merás, A. M. de la Peña, M. I. R. Cáceres, F. S. López, Talanta, 45 (1998) 899–907.
12. I. D. Merás, A. M. de la Peña, F. Salinas, I. R. Cáceres, Analyst, 119 (1994) 1215 – 1219.
13. M. L. Wang, S. C. Chen, J. C. Lien, S. C. Kuo, J. AOAC Int., 85 (2002) 572–575.
14. Y. F. Mestre, L. L. Zamora, J. M. Calatayud, Anal. Chim. Acta, 438 (2001) 93–102.
15. N. Murgu, Pharmazie. 19 (1964) 724–725.
16. I. Shehatta, Z. Phys. Chem., 216 (2002) 1167–1183.
17. G. Gran, Analyst, 77 (1952) 661–671.
18. R. J. Barnhard, J. Chem. Educ., 60 (1983) 679–680.
19. C. E. Ophardt, J. Chem. Educ., 62 (1985) 257–258.
20. R. J. Ferek, A. L. Lazarus, P. L. Haagenson, J. W. Winchester, Environ. Sci. Technol., 17 (1983)
315–324.
21. H. A. Mohamed, H. M. A. Wadood, O. A. Farghaly, J. Pharm. Biomed. Anal., 28 (2002) 819–826.
22. A. H. Amrallah, N. A. Abdalla, E. Y. El–Haty, Talanta, 46 (1998) 491–500.
23. A. A. Abdel Gaber, O. A. Farghaly, M. A. Ghandour, H. S. El–Said, Monatshefte fur Chemie, 131
(2000) 1031–1038.
Int. J. Electrochem. Sci., Vol. 12, 2017
9881
24. N. M. Abdel–Latif, H. M. Abdel–Wadood, O. A. Farghaly, Egypt J. Anal. Chem., 15 (2006) 71.
25. M. A. Ghandour, E. Aboul–Kasim, A. H. Amrallah, N. A. Abdalla, O. A. Farghaly, J. Indian Chem.
Soc., 76 (1999) 480–482.
26. M. A. Ghandour, E. Aboul–Kasim, A. H. Amrallah, O. A. Farghaly, J. Indian Chem. Soc., 70
(1993) 615–617.
27. O. A. Farghaly, N. A. Mohamed, A. A. Gahlan, M. A. El–Mottaleb, Indian J. Anal. Chem., 7 (2008)
294–300.
28. A. H. Naggar, H. A. Mauof, A. A. Ekshiba, O. A. Farghaly, Pharm. Chem. J., 3 (2016) 125–137.
29. W. M. Yousef, K. Alenezi, A. H. Naggar, T. M. Hassan, S. Z. Bortata, O. A. Farghaly, Int. J.
Electrochem. Sci., 12 (2017) 1146–1156.
30. G. P. Daniele, O. Zerbinati, V. Zelano, J. G. Ostacoli, J. Chem. Soc. Dalton Trans., 2711 (1998).
31. F. J. C. Rossotti, H. Rossotti, The Determination of Stability Constants and Other Equilibrium
Constants in Solution, McGraw–Hill Book Company, Inc., New York, (1961).
32. S. Kirschner, K. Y. Wei, D. Francis, G. J. Bergam, J. Med. Chem., 9 (1966) 369–372.
33. K. Timmers, R. Sternglanz, Bioinorg. Chem., 9 (1978) 145–155.
34. V. Uivarosi, Molecules, 18 (2013) 11153–11197.
35. N. B. Behrens, G. M. Diaz, Inorganica Chim. Acta, 125 (1986) 21–26.
36. J. R. Anacona, M. Mundaray, E. Bastardo, J. Coordination Chem., 53 (200l) 281–288.
37. M. Zaky, M. Y. El–Sayed, S. M. El–Megharbel, S. Abo Taleb, M. S. Refat, Russ. J. Gen. Chem., 83
(2013) 2488–2501.
38. A. Debnath, N. K. Mogha, D. T. Masram, Appl. Biochem. Biotechnol., 175 (2015) 2659-2667
39. F. A. I. Al–Khodir, M. S. Refat, J. Mol. Struct., 1094 (2015) 22–35.
40. Vogel's Text Book of “Quantitative Inorganic Analysis”, Revised by J. Bassett, R. C. Denny, G. H.
Jeffery and J. Menoham; 4th
Longman London, 302 (1978).
41. H. Irving, H. S. Rossotti, J. Chem. Soc., (1953) 3397–3405.
42. H. Irving, H. S. Rossotti, J. Chem. Soc., (1954) 2904–2910.
43. H. Irving, R. J. P. Williams, Nature, 162 (1948) 746–747.
44. H. Irving, R. J. P. Williams, J. Chem. Soc., (1953) 3192–3210.
45. G. A. H. Gouda, G. A. M. Ali, T. A. Seaf Elnasr, International Journal of Nanomaterials and
Chemistry,1(2015) 39-44.
46. J. A. Boiani, J. Chem. Educ., 63 (1986) 274–276.
© 2017 The Authors. Published by ESG (www.electrochemsci.org). This article is an open access
article distributed under the terms and conditions of the Creative Commons Attribution license
(http://creativecommons.org/licenses/by/4.0/).
![nor -nalidixic acids - chempap.org Reaction of ferric ions with nalidixic and nor-nalidixic acids aE ... and ?ior-nalidixic acid [1] (II, 7-methyl-4-hydroxy ... of the dissociation](https://img.dokumen.tips/doc/110x75/5b3f30b27f8b9a91078bd7bd/nor-nalidixic-acids-reaction-of-ferric-ions-with-nalidixic-and-nor-nalidixic.jpg)