Embed Size (px)
Citation preview
LUND UNIVERSITY
PO Box 117221 00 Lund+46 46-222 00 00
Metabolomics of Weight Loss and Weight Maintenance in Obese Humans
Geidenstam, Nina
2016
Link to publication
Citation for published version (APA):Geidenstam, N. (2016). Metabolomics of Weight Loss and Weight Maintenance in Obese Humans. Lund: LundUniversity: Faculty of Medicine.
General rightsCopyright and moral rights for the publications made accessible in the public portal are retained by the authorsand/or other copyright owners and it is a condition of accessing publications that users recognise and abide by thelegal requirements associated with these rights.
• Users may download and print one copy of any publication from the public portal for the purpose of private studyor research. • You may not further distribute the material or use it for any profit-making activity or commercial gain • You may freely distribute the URL identifying the publication in the public portalTake down policyIf you believe that this document breaches copyright please contact us providing details, and we will removeaccess to the work immediately and investigate your claim.

1
Metabolomics of Weight Loss and Weight
Maintenance in Obese Humans

2

3
Metabolomics of Weight Loss and
Weight Maintenance in Obese
Humans
Nina Geidenstam
DOCTORAL DISSERTATION
by due permission of the Faculty of Medicine, Lund University, Sweden.
To be defended in “Jubileumsaulan”, Jan Waldenströms gata 5,
Skånes Universitets Sjukhus, Malmö.
Wednesday 4th of May 2016, at 9.00.
Faculty opponent
Professor Henrik Antti
Department of Chemistry, Umeå University, Sweden

4
Organization
LUND UNIVERSITY
Document name
DOCTORAL DISSERTATION
Faculty of Medicine
Department of Clinical Sciences, Malmö
Date of issue
May 4th, 2016
Author(s) Nina Geidenstam Sponsoring organization
Title and subtitle
Metabolomics of weight loss and weight maintenance in obese humans
Abstract
The prevalence of obesity and obesity-related complications are increasing worldwide. Weight loss has shown to improve insulin sensitivity and decrease the risk of developing type 2 diabetes (T2D). Even so, little is known about how metabolites, other than glucose, are affected after weight loss and weight maintenance treatment.
Impaired glucose tolerance (IGT) is a common trait of obesity and is studied during an oral glucose tolerance test (OGTT). In this thesis, we identified 16 distinct metabolite OGTT profiles (change from fasting, 30 and 120 min.) that deviated from the glucose tolerant lean group. These deviations were grouped as; a delayed reduction in the levels of five fatty acids, increased levels at 30 min. of five amino acids (incl. isoleucine and leucine), and a blunted increase at 30 min. of six metabolites. When we followed up these obese individuals after weight loss and weight maintenance, roughly half of these metabolites improved towards the expected healthy profile. Specifically, enhanced suppression of aromatic amino acids (tyrosine and phenylalanine) was associated with decreased insulinogenic index after weight loss. On the contrary, the glucose-elicted suppression of four amino acids and three fatty acids improved after weight maintenance, parallelling an improved glucose tolerance. This suggests that diet-induced weight loss followed by weight maintenance results in changes in metabolite OGTT profiles associated with either hepatic insulin sensitivity or peripheral glucose tolerance.
Obesity is associated with altered levels of fasting circulating amino acids. We found that eight out of the 18 detected amino acids were associated with obesity, independently of age, sex, T2D and blood pressure. Six of these amino acids were improved after weight maintenance. From this, we created scores based on amino acids and risk factors at baseline that are either informative of the level of association to obesity or the potential benefit, or lack of benefit, by reducing the included amino acids to those that are expected to normalize with a weight loss and weight maintenance program.
Finally, we validated previous findings and further explored the data in a larger cohort at baseline and one year after participating in a non-surgical weight loss program. Changed levels in 30 metabolites were uniqe in those with a ≥10% weight loss compared to those with <10% weight loss. In addition, we found weight loss to be associated with 13 baseline metabolite levels, and interestingly, many of these are common food additives. We also saw that the obesity predictive scores were modifiable with weight loss.
The thesis adds to the understanding of metabolite alterations in obesity-driven IGT and the benefits of weight loss followed by weight maintenance. Our findings suggest several metabolites that may be valuable to consider when evaluating who will benefit from weight loss treatments.
Key words: amino acids, BMI, fatty acids, impaired glucose tolerance, insulin resistance, metabolite profiling, metabolomics, obesity, OGTT, prediction, weight loss, weight maintenance
Classification system and/or index terms (if any)
Supplementary bibliographical information Language English
ISSN and key title: 1652-8220 ISBN 978-91-7619-277-1
Recipient’s notes Number of pages 159 Price
Security classification
I, the undersigned, being the copyright owner of the abstract of the above-mentioned dissertation, hereby grant to all reference sourcespermission to publish and disseminate the abstract of the above-mentioned dissertation.
Signature Date

5
Metabolomics of Weight Loss and
Weight Maintenance in Obese
Humans
Nina Geidenstam

6
Front cover: Northern Sweden. Photo by Sebastian Ortega
Back cover: Photo by Jasmina Kravić
Copyright © Nina Geidenstam 2016
Faculty of Medicine | Department of Clinical Sciences, Malmö
Clinical Obesity
ISSN 1652-8220
ISBN 978-91-7619-277-1
Lund University, Faculty of Medicine Doctoral Dissertation Series 2016:51
Printed in Sweden by Media-Tryck, Lund University
Lund 2016

7
Till minne av min pappa
“The important thing is not to stop questioning.
Curiosity has its own reason for existing”
Albert Einstein

8
“Do. Or do not. There is no try.”
Yoda

9
Content
List of papers ..........................................................................................................11
Abbreviations .........................................................................................................13
Introduction ............................................................................................................15
Obesity .........................................................................................................15
Metabolic regulation ....................................................................................15 Fasting conditions ................................................................................15 Prandial and postprandial conditions ...................................................16 Circulating metabolite levels and obesity ............................................17
Impaired glucose response ...........................................................................18 Metabolite profiles of impaired glucose tolerance ..............................19
Weight loss and weight maintenance ...........................................................20 Metabolite changes with weight loss and weight maintenance ...........20
Aims .......................................................................................................................23
General methodology .............................................................................................25
Study participants .........................................................................................25 Obesity cohort .....................................................................................25 Normal weight glucose tolerant cohort ...............................................25 Malmö Diet and Cancer cohort ...........................................................26
Glucose and insulin analysis ........................................................................26
Metabolomics analysis .................................................................................27 Gas chromatography mass spectrometry .............................................28 Liquid chromatography mass spectrometry ........................................29 Sample preparation ..............................................................................29
Statistical analysis ........................................................................................29 Obesity and diabetes scores .................................................................31
Results and Discussion ...........................................................................................33
Metabolite responses during an OGTT ........................................................33 Differences in metabolite profiles during an OGTT between obese and
normal weight individuals (paper I) ....................................................33

10
Change in metabolite profiles during an OGTT after weight loss and
weight maintenance (paper II) .............................................................35 Heterogeneity within the obese group (paper I-II) ..............................37
Altered fasting metabolite levels improved with weight loss and weight
maintenance treatment ..................................................................................38 Change in fasting amino acid levels with weight loss and weight
maintenance (paper III) .......................................................................38 Further evaluation of change in amino acid levels after participating in
a weight loss program (paper IV) ........................................................39
Amino acid levels predictive of weight loss treatment ................................40 BMI-associated amino acid levels (paper III) .....................................40 Obesity and treatment-modifiable scores (paper III) ...........................41 Evaluation of the obesity scores in a different weight loss cohort
(paper IV) ............................................................................................43
Weight loss-associated metabolite levels .....................................................44 Baseline metabolites associated with change in BMI (paper IV) ........44 Weight-loss induced change in metabolite levels associated with
decrease in BMI (paper IV) .................................................................45
Major conclusions ..................................................................................................47
Summary in Swedish – Populärvetenskaplig sammanfattning ..............................49
Fetma – ett (över)viktigt problem ................................................................49 Metabolomik........................................................................................49 Bristfällig ämnesomsättning och glukosbelastning .............................49
Viktnedgångsbehandling ..............................................................................50 Glukosbelastning efter viktnedgång ....................................................50 Aminosyror relaterade till BMI och förändring vid viktnedgång ........51 Sammanfattning ...................................................................................51
Acknowledgements ................................................................................................53
References ..............................................................................................................57

11
List of papers
This thesis is based on the following manuscripts
I Geidenstam N, Spégel P, Mulder H, Filipsson K, Ridderståle M,
Danielsson A. Metabolite profile deviations in an oral glucose
tolerance test – a comparison between lean and obese individuals.
Obesity. 2014; 22(11):2388-95.
II Geidenstam N, Danielsson A, Spégel P, Ridderståle M. Changes in
glucose-elicited blood metabolite responses following weight loss and
long term weight maintenance in obese individuals with impaired
glucose tolerance. Diabetes research and clinical practice. 2016;
113: 187-97.
III Geidenstam N, Magnusson M, Danielsson A, Gerszten R, Wang T,
Reinius L, Mulder H, Melander O, Ridderståle M. Amino acid
signatures predictive of beneficial effects of weight loss. Manuscript
submitted.
IV Geidenstam N, Al-Majdoub, Ekman M, Spégel P, Ridderstråle M.
Metabolite profiling of obese individuals before and after a one year
weight loss program. Manuscript.

12

13
Abbreviations
AHT Anti-hypertensive treatment
BCAA Branched-chain amino acids
BMI Body mass index
CIR Corrected insulin response
CVD Cardiovascular disease
DI Disposition index
DM-AA Diabetes-predictive amino acid score
FFA Free fatty acids
IFG Impaired fasting glucose
IGI Insulinogenic index
IGT Impaired glucose tolerance
ISI Insulin sensitivity index
GC/MS Gas chromatography/mass spectrometer
HOMA-IR Homeostasis model assessment-estimated insulin
resistance
HOMA-β HOMA for β-cell function
MDC Malmö diet and cancer
MDC-CC MDC cardiovascular cohort
OB-BMI score Score based amino acids associated with obesity
(defined by BMI)
OGTT Oral glucose tolerance test
OPLS-DA Orthogonal projections to latent structures
discriminant analysis
PCA Principal component analysis
SBP Systolic blood pressure

14
TCA cycle Tricarboxylic acid cycle
T2D Type 2 diabetes
WLWM program Weight loss and weight maintenance program
WLWM-BMI score Score based on amino acids associated with obesity
by BMI that are modified after a weight loss and
weight maintenance program
WC Waist circumference

15
Introduction
Obesity
Obesity is a global public-health problem which started to increase in the mid-20th
century1. The worldwide prevalence of overweight adults was over 1.9 billion
(39%) in 2014, and out of these, 600 million (13%) were obese2. The obesity
epidemic is predicted to continue to such degree that by 2030, 40-50% of the adult
population will be obese3. The obesity prevalence in children and adolescents has
also become more common, and this increases the risk of developing obesity-
related complications earlier than otherwise4-6
. Obesity is defined as having a body
mass index greater than 30 kg per square meter (kg/m2) and is most commonly the
result of energy surplus7. An extended period of over-nutrition, in combination
with decreased physical activity, is linked to development of several
complications. The etiology of obesity-related complications is not yet fully
understood but glucose intolerance as a result of obesity has been linked to
conditions such as insulin resistance, type 2 diabetes (T2D), cardiovascular
disease, cancer, and osteoporosis8-10
.
Metabolic regulation
Fasting conditions
All cells need energy to perform various biological processes, and different tissues
have different means to maintain a constant energy supply. For instance, red blood
cells and the brain use glucose as their energy source (ketone bodies can be used
during starvation), whereas most peripheral tissues use both glucose and fatty
acids as energy source, depending on blood concentrations of these nutrients11
.
The human body can efficiently regulate the glucose levels by secreting hormones
and through different tissue-specific glucose transporters12
. Through rigorous
glucose regulation, circulating glucose levels are present at a relatively constant
concentration. Due to that, the red blood cells and brain almost exclusively use
glucose as their energy source; the body can store glucose as glycogen in the liver

16
and skeletal muscles13, 14
. When glucose levels decrease (e.g. during the night),
release of glucagon from pancreatic α-cells stimulates glycogen breakdown in the
liver as well as glucose synthesis via gluconeogenesis. In addition, fatty acids,
stored as triglycerides in the adipose tissue, are the main source of energy for
peripheral tissues during fasting15
. Triglycerides are degraded to fatty acids and
glycerol by lipases16
. They are then released to the bloodstream to become
available as energy source for other tissues. Once fatty acids have entered the cell,
β-oxidation of fatty acids produces acetyl coenzyme A (acetyl CoA), a substrate
for the tricarboxylic acid (TCA) cycle. Glycerol, which is also released, can be
converted both to pyruvate and glucose in the liver15, 16
.
Amino acids are another source of energy, although the main use of amino acids is
in protein metabolism. There are 20 amino acids that are used in proteins. Of these
20 amino acids, nine (histidine, lysine, methionine, phenylalanine, threonine,
tryptophan, isoleucine, leucine and valine) are essential (or semi-essential) for
humans, and cannot be synthesized de novo. The first step of amino acid
degradation is removal of the amino group via transamination, and the remaining
carbon molecule is metabolized into glucose, acetyl CoA, or one of several TCA
cycle intermediates. Most amino acids are mainly degraded in the liver except for
branched-chain amino acids (BCAAs): isoleucine, leucine and valine, which are
mainly degraded in skeletal muscles, kidneys and heart17, 18
. When measuring
metabolite levels during an extended fast, ketone bodies and non-esterified fatty
acids have shown to increase in the blood already after a few hours. On the
contrary, a noticeable increase in BCAAs was first noticed after 24 hours, which is
in accordance with amino acids being used primarily for protein metabolism and
not as an energy source19
.
Prandial and postprandial conditions
In food, fatty acids, amino acids and glucose, are found as lipids, proteins and
carbohydrates, such as starch. These first need to be degraded into smaller
components so nutrients can be absorbed from the small intestine, transported
through the hepatic portal vein into the liver to then enter the blood circulation.
Larger fatty acids and lipids are hydrophobic and therefore absorbed through the
lymphatic vessels before entering the circulation (i.e. they bypass the liver).
Postprandial increased blood concentrations of glucose, amino acids and fatty
acids stimulate and potentiate insulin secretion from the pancreatic β-cells20-22
.
This stimulates the peripheral tissue, like skeletal muscles and adipose tissue, to
take up these nutrients from the circulation (Figure 1). These adaptions take place
to achieve glucose homeostasis. Also, lipolysis and proteolysis in skeletal muscle,
liver and adipose tissue are inhibited, which reduces the release of these

17
metabolites. This process thereby induces the switch from catabolism to
anabolism.
Figure 1 Postprandial regulation
Postprandial circulatory increase of glucose, amino acids and fatty acids leads to increased insulin secretion from the pancreatic β-cells. This further leads to increased uptake of metabolites into peripheral tissues (such as liver, skeletal muscle and adipose tissue) and decreased release of fatty acids from the adipose tissue.
Circulating metabolite levels and obesity
Failure in metabolic regulation is a common trait of obesity which may lead to
altered circulating metabolite levels, such as glucose. Pathophysiological changes
in people with obesity are often present long before the onset of chronic
hyperglycemia and T2D23
. Elevated plasma fatty acids and increased intracellular
lipids in obese individuals inhibit insulin sensitivity in muscle, thus dysregulation
of fatty acids have been linked to insulin resistance24
. It is also believed that
chronically high fatty acid concentrations have a “lipotoxic” effect on the
pancreas25
. Also, increased levels of valine, leucine, isoleucine, tyrosine and
phenylalanine, and decreased levels of glycine in non-diabetic obese subjects was
reported by Felig et al already in 196926
. Others have confirmed these
observations through recent advancement in the use of metabolomics techniques,
which can efficiently analyze large sets of metabolites27-30
. In addition, several
altered metabolite levels identified in obese, when compared to lean subjects, may
be suitable as biomarkers for metabolic complications related to obesity28-35
.
Rauschert et al summarized a list of recent reports including potential metabolite
biomarkers for obesity33
. For instance amino acids, carnitines and glycerol have
↑ Glucose
↑ Amino acids
↑ Fatty acids
↑ Insulin release
↑ Uptake of glucose, amino acids and fatty acids
↓ Release of fatty acids

18
been associated with BMI30, 33
. Recent reports have specifically shown elevated
levels BCAAs in individuals who are at risk of developing diabetes36
, in those with
established diabetes27, 37
, and in overweight and obese humans27
. Also, BCAAs
together with aromatic amino acids (tyrosine and phenylalanine), have been
associated with, and shown to predict, the development of insulin resistance38, 39
,
as well as the risk of developing T2D36, 40
. Specifically, a set of isoleucine,
tyrosine and phenylalanine showed strong predictive potential for incident T2D36
.
A score calculated from these three amino acids, called diabetes-predictive amino
acid score (DM-AA score), has also been associated with risk of future
cardiovascular disease (CVD)41
. If there is causation between the BCAA and
aromatic amino acids is not known, but they share the same transporter across cell
membranes in a competitive manner, i.e. uptake is both regulated by the
concentration of its own amino acid, but also that of its competitors42
. Several
hypotheses have been presenting trying to link dysregulation of lipids and amino
acids, specifically the BCAAs. For instance, the activity of the branched-chain α-
ketoacid dehydrogenase (BCKD), which is one of the enzymes in BCAA
degradation, may also be inhibited by increased β-oxidation of fatty acids. This
would then lead to increased BCAA levels35
. In addition, another theory is that
over-nutrition leads to preferential use of glucose and lipid substrates, which may
lead to a reduced need for amino acid catabolism34
. Albeit, one theory is not
excluding the other and it is therefore likely that it may be a mixture of several
metabolic processes causing the increased levels of BCAAs.
Impaired glucose response
A well-established approach to study the postprandial response is to perform an
oral glucose tolerance test (OGTT). Glucose clearance during an OGTT is also
used in the clinic to evaluate glucose tolerance43
. Healthy glucose tolerant subjects
have fasting plasma glucose levels of 5.5 mmol/l or lower and a 2-hour glucose
level of <7.8 mmol/l after the OGTT (Figure 2). Insufficient insulin action, either
due to decreased insulin sensitivity or insufficient insulin release, results in
impaired fasting glucose (IFG) and/or impaired glucose tolerance (IGT). People
with IFG have elevated fasting plasma glucose (between 5.6-6.9 mmol/l) but
normal response during OGTT. IGT is defined as 2-hour glucose levels between
7.8-11.0 mmol/l44
. IFG and IGT are prediabetic states, and common traits of
obesity45
, that may proceed to develop T2D. T2D is defined as fasting levels of
≥7.0 mmol/l and 2-hour plasma glucose levels of ≥11.1 mmol/l44, 46
.

19
Figure 2 Oral Glucose Tolerance Test Plasma glucose levels during an OGTT. Graph illustrates example of average glucose response in people with normal glucose tolerance (NGT), the prediabetes states; impaired glucose tolerance (IGT) and impaired fasting glucose (IFG) and type 2 diabetes (T2D). Some individuals may have both IFG and IGT (not illustrated)
47, 48.
Metabolite profiles of impaired glucose tolerance
Since obesity is a metabolically complex disorder, it is relevant to study the flux of
metabolites that occurs during energy regulation and is thus present in the
pathology of obesity and its complications. Metabolomics, the systematic study of
small molecules in cells and biological systems, has been performed on blood
samples acquired during an oral glucose load in healthy subjects with normal
weight19, 49-52
and overweight52, 53
. In healthy individuals with a normal glucose
tolerance, the expected glucose- and insulin-provoked decrease of free fatty acids
and glycerol was observed49, 50, 52
. This is due to the fact that fatty acid release
from adipose tissue is efficiently switched off by insulin, reducing the blood
concentration of fatty acids and glycerol. The oral glucose load has also shown
decreased circulating levels of amino acids and β-hydroxybutyrate, which reflect
the reduced proteolysis and ketogenesis, respectively52
. Shaham et al52
, and the
extended study by Ho et al53
, observed a blunted decrease in valine,
isoleucine/leucine, methionine, β-hydroxybutyrate, pyridoxate, and a blunted
increase of lactate during an OGTT in obese insulin resistant subjects. Another
study in young obese individuals (20 years), reported 25 metabolite response
differences between obese and lean including amino acids (e.g. alanine, glycine,
phenylalanine and BCAAs) and fatty acids (C16:0, C16:1, C18:2 and C18:3)54
.
0
2
4
6
8
10
12
14
16
18
0 30 60 90 120
Plasma Glucose (mmol/L)
Time (minutes)
T2D
IGT
IFG
NGT

20
Weight loss and weight maintenance
Weight loss achieved by a combination of restricted calorie intake, increased
physical activity and behavioral support has been reported to reduce the incidence
of IGT and the risk of developing T2D in obese individuals55-58
. Weight loss can
be achieved by restricting caloric intake (e.g. initially by low-calorie diet),
bariatric surgery or with drugs (such as orlistat and liraglutide)59-61
. Bariatric
surgery is the most effective way of weight reduction but not all are eligible for
surgery, and it would be economically unfeasible to operate everyone who is obese
globally. Thus, diet-induced or drug-mediated weight reduction would be
preferable. Nevertheless, the drugs that are currently on the market typically report
only about 5-10% body weight loss while the corresponding weight loss following
bariatric surgery is in the range of 25-30%59, 60, 62
. Another dilemma is that weight
regain is common, about half of the participants return to baseline weight within
five years of weight loss, since it is easy to fall back to previous eating and living
habits63
. Lifestyle intervention combining low-calorie diet, behavioral therapy, and
if possible, physical activity, have showed best success in non-surgical weight loss
and also in weight maintenance55
.
Metabolite changes with weight loss and weight maintenance
Altered fasting metabolite levels observed in insulin resistant obese subjects have
revealed several metabolic changes that are related to weight reduction64-67
. For
instance, elevated saturated fatty acids (myristic-, palmitic- and stearic acid),
monounsaturated fatty acids (oleic- and eicosenoic acid) and several
polyunsaturared fatty acids (including linoleic- and arachidonic acid) decreased
after an 8-week weight loss64
. These authors also observed a positive association
between palmitoleic acid at baseline and change of body fat, but the decrease of
fatty acid was not significant. Lien et al performed metabolite profiling in 27
obese individuals after a behavioral weight loss intervention, after weight
maintenance and after weight regain65
. They observed change in levels of fasting
metabolites, hormones and clinically measured variables, and thereby showing
large metabolic change depending on if they were catabolic, anabolic or when
achieving a new steady state, at different stages (i.e. weight loss, weight gain and
weight maintenance). This illustrates that levels of many metabolites, in addition
to glucose, were affected by weight change. Another study found BCAAs to
predict improvement in insulin resistance with moderate weight loss66
. However,
the potential weight loss associated improvements of the BCAAs are controversial,
and further analysis is required64-68
. Furthermore, metabolite analysis after weight
loss have also been performed in obese children69
. This study observed significant

21
increase of glutamine, methionine, the acyl-alkyl phosphatidylcholine PCaeC36:2
and the three measured lysophosphatidylcholines (LPCaC18:1, LPCaC18:2 and
LPCaC20:4) one year after weight loss, compared to the group without weight
reduction. Thus, intriguing findings regarding metabolite changes due to weight
loss have been presented, but further research is necessary to provide clarity in
which metabolites are linked to a healthier metabolic profile.

22

23
Aims
The overall aim of this thesis was to elucidate the metabolite changes present in
obese humans after diet-induced weight loss followed by weight maintenance. I
investigated this by including both fasting levels and the metabolite response
during an oral glucose load.
Specific aims for the respective papers:
I Identify differences in metabolite profiles during an OGTT in insulin
resistant obese individuals and insulin sensitive individuals with
normal weight.
II Investigate if the altered metabolite profiles during an OGTT in obese
individuals (from Paper I) are modified with a weight loss and weight
maintenance intervention.
III Identity fasting amino acid levels that are associated with obesity and
investigate if weight loss and weight maintenance can improve levels
of these amino acids. We also aim to test if amino acids can predict
the potential benefit of a combined weight loss and weight
maintenance program.
IV Validate previous findings and further explore metabolite data using a
larger cohort. Specifically, analyze if weight reduction is associated
with baseline metabolite levels and weight loss-induced change in
metabolites levels.

24

25
General methodology
This section describes an overview of the methodology used in this thesis. For a
detailed description, please review the respective paper.
Study participants
Obesity cohort
In all studies, some or all included participants attended the obesity outpatient unit
at the Department of Endocrinology, Skåne University Hospital, Malmö, Sweden.
Paper I and II included 14 obese participants with IGT, who were subjected to an
OGTT. The intervention study (paper II-III) included diet-induced weight loss (per
protocol ≥10%, low-calorie diet of <1,200 kcal/day) and weight maintenance (per
protocol ±5% weight change to define weight stability). The intervention also
included group-based therapy lead by a dietitian. OGTT was conducted at baseline
(paper I), after weight loss and weight maintenance (paper II). In paper III, 12
obese individuals participating in the intervention study were included to evaluate
change in fasting levels of glucose, insulin and metabolite levels. None of the
participants in paper I-III were diagnosed with T2D, cardiovascular disease or
taking any medications related to metabolic disease. In paper IV, a total of 84
individuals visited the outpatient unit and participated in a program with the aim to
lose weight by non-surgical means. This weight loss program consisted of
participation in behavioral therapy (individually or in group) and a prolonged
period of low-calorie diet. Overnight fasted blood samples were collected before
and after treatment. The study outline of the obese cohort is illustrated in Figure 3.
All participants gave their written informed consent and the ethics committee at
Lund University, Sweden, approved the study.
Normal weight glucose tolerant cohort
A small glucose tolerant group with normal weight (n=6) was included for
comparison in paper I and II. This group has been reported in detail previously49
.

26
Metabolite profiling was performed during an OGTT after an overnight fasting,
and samples were collected at 15, 30, 45, 60, 75, 90, 105 and 120 minutes. In
paper I, data was reanalyzed using only time points 0, 30 and 120 minutes.
Figure 3 Study outline Study outline for the obese cohort. Paper I included only OGTT at baseline, and was compared to metabolite response during an OGTT from a lean cohort. Paper II included OGTT at baseline, weight loss and weight maintenance. Paper III included fasting samples of obese participating in the weight loss intervention (pilot) and Paper IV included subjects participating in a weight loss program (validation).
Malmö Diet and Cancer cohort
In paper III, a subset of the population-based Malmö Diet and Cancer (MDC)
cohort of 28,449 people, enrolled between 1991 and 1996 in Southern Sweden,
was included. A subset of 6,103 individuals was randomly selected to participate
in the MDC cardiovascular cohort (MDC-CC)70
. Metabolomics analysis was
performed in subjects from a nested incident CVD case-control study (n=506)
with subjects matched for gender, age, Framingham risk score, and from a nested
incident diabetes case-control study (n=326) in the MDC-CC41
. A total of 804
subjects were included in the analysis, after exclusion of subjects who participated
in both studies and with incomplete data.
Glucose and insulin analysis
Oral glucose tolerance test (OGTT) was performed according to standard
procedures of 75g glucose mixed in water and consumed after an overnight fast.
Blood samples were collected at fasting (0 minutes) and after 30 and 120 minutes
(paper I-II). Plasma glucose and serum insulin levels were measured at fasting
(paper I-IV) and during an OGTT (at 30 and 120 minutes, paper I-II). Indices were
calculated to evaluate insulin sensitivity and response including; insulin sensitivity
Obese Cohorts OGTT (n=14)
Paper II Fasting (n=12)
Paper III Fasting (n=84)
Paper IV
Baseline
Weight loss (>10%)
Weight maintenance (± 5%) Follow up
Baseline
OGTT (n=14) Paper I
Baseline
27
index (ISI), corrected insulin response (CIR), disposition index (DI) and
insulinogenic index (IGI)47, 71, 72
. Insulin resistance and β-cell function were
estimated by the homeostasis model assessment-estimated insulin resistance
(HOMA-IR) and HOMA-β, respectively73
. How each index was calculated is
presented as follows.
𝐼𝑆𝐼 =10,000
√([𝐺𝑙𝑢𝑐𝑜𝑠𝑒0 𝑚𝑖𝑛 𝑥 𝐼𝑛𝑠𝑢𝑙𝑖𝑛0 𝑚𝑖𝑛] 𝑥 [𝑚𝑒𝑎𝑛 𝑂𝐺𝑇𝑇𝑔𝑙𝑢𝑐𝑜𝑠𝑒 𝑥 𝑚𝑒𝑎𝑛 𝑂𝐺𝑇𝑇𝑖𝑛𝑠𝑢𝑙𝑖𝑛])
𝐶𝐼𝑅 = 100 𝑥 𝐼𝑛𝑠𝑢𝑙𝑖𝑛30 𝑚𝑖𝑛
𝐺𝑙𝑢𝑐𝑜𝑠𝑒30 𝑚𝑖𝑛 𝑥 (𝐺𝑙𝑢𝑐𝑜𝑠𝑒30 𝑚𝑖𝑛 − 3.89)
𝐷𝐼 = 𝐶𝐼𝑅 𝑥 𝐼𝑆𝐼
𝐼𝐺𝐼 = (𝑖𝑛𝑠𝑢𝑙𝑖𝑛30 𝑚𝑖𝑛 − 𝑖𝑛𝑠𝑢𝑙𝑖𝑛0 𝑚𝑖𝑛)
(𝑔𝑙𝑢𝑐𝑜𝑠𝑒30 𝑚𝑖𝑛 − 𝑔𝑙𝑢𝑐𝑜𝑠𝑒0 𝑚𝑖𝑛)
𝐻𝑂𝑀𝐴 − 𝐼𝑅 = (𝑓𝑎𝑠𝑡𝑖𝑛𝑔 𝑔𝑙𝑢𝑐𝑜𝑠𝑒 [𝑚𝑚𝑜𝑙/𝑙] 𝑥 𝑓𝑎𝑠𝑡𝑖𝑛𝑔 𝑖𝑛𝑠𝑢𝑙𝑖𝑛 [µ𝑈/𝑚𝑙]
22.5
𝐻𝑂𝑀𝐴 − 𝛽 =𝑓𝑎𝑠𝑡𝑖𝑛𝑔 𝑖𝑛𝑠𝑢𝑙𝑖𝑛 [µ𝑈/𝑚𝑙] 𝑥 20
𝑓𝑎𝑠𝑡𝑖𝑛𝑔 𝑔𝑙𝑢𝑐𝑜𝑠𝑒 [𝑚𝑚𝑜𝑙/𝑙] − 3.5
Metabolomics analysis
The collectively named “omics”-fields include genomics (the study of the genome,
i.e. “what can happen”), transcriptomics (the study of the transcriptome, i.e. “what
appear to be happening”), proteomics (the study of the proteome, i.e. “what makes
it happen”) and metabolomics (the study of the metabolome, i.e. “what is
happening and has happened”). Hence, metabolomics links the genotype with the
phenotype74
. Metabolomics is the systematic study of metabolites, i.e. small
molecules (<1500 Da) from cells, tissues or biofluids that are substrates,
intermediates or end products of metabolic reactions75
. Several metabolomics
techniques are available that efficiently detect and quantifies compounds, for
example gas chromatography mass spectrometry (GC/MS)76
, liquid
chromatography mass spectrometry (LC/MS)77
and nuclear magnetic resonance
(NMR) spectroscopy78
. The advantage of NMR is that it is a quantitative method;
however, the disadvantages, compared to MS-based methods, are lower
sensitivity, dynamic range and resolution. In this thesis, I have not used NMR so it
will not be addressed further. Advantages and disadvantages for the use of GC/MS
and LC/MS, will be addressed in following paragraphs. Overall, it is possible to

28
detect up to thousands of metabolites using MS-based techniques, although this
necessitates the use of several methods with different characteristics.
Gas chromatography mass spectrometry
In my thesis, I have used GC/MS to analyze metabolites in the obese and normal
weight cohorts. The advantages with this method are that it has a high separation
efficiency, robustness and throughput, while the main disadvantage that it only
measures volatile analytes79
. Metabolites are generally non-volatie, but can be
made volatile by derivatization80
. The retention is based on partitioning between
the mobile phase (consisting of a carrier gas) and a stationary phase (consisting of
a liquid residing on the inside the capillary wall). The GC is coupled to a time-of-
flight (TOF) mass analyzer, via electron ionization (EI) ion source. In the EI
source, an electron is extracted from the analyte, resulting in the formation of an
unstable radical cation. This ion then fragments, yielding a set of fragments
characteristic for a specific analyte. The hereby formed ions are accelerated into
the TOF mass analyzer, where they are separated based on their mass-to-charge
ratio (m/z). The analytes are identified based on the time when they elute from the
GC column, normally expressed as a retention index, and by matching their
fragmentation pattern, i.e. their mass spectra, to mass spectra found in databases.
The general procedure is illustrated in Figure 4.
Figure 4 Schematic protocol for metabolite profiling by gas chromatography mass spectrometry Metabolites are extracted from blood (serum or plasma), derivatized (A) and injected into the gas chromatograph (B).
The metabolites are separated based on their partitioning between the gas phase and a thin layer on the inner surface of a capillary column (C). The metabolites are ionized. In this process, several fragments are formed from the same metabolite. These fragments are then separated in the TOF analyzer, and their flight time (i.e. the time it takes for them to reach the detector), which is proportional to the m/z of the metabolite, determine (D).
Carrier gas
Flow regulator
Waste
Oven
Detector
Metabolite extraction
Column
Gas
Sample injector
A
B
C
D

29
Liquid chromatography mass spectrometry
Amino acids in the MDC-CC cohort was profiled using liquid chromatography-
tandem mass spectrometry (LC-MS/MS) and has been described in detailed36, 41
.
The difference between GC and LC is that in an LC the separation is based on
partitioning of analytes between a liquid phase (instead of gas) and a stationary
phase that usually is covalently bound to solid particles. An advantage with LC is
that it is applicable also to non-volatile metabolites, without any prior
derivatization. Hence, LC can be used to analyze large polar metabolites as well as
thermolabile metabolites. The disadvantages with LC/MS compared to GC/MS are
lower reproducibility, lower robustness, longer analysis times and lower separation
efficiency74, 79
.
Sample preparation
Sample preparation prior to metabolomics analysis is very important to reduce
biases in the determination of metabolite concentrations. In my thesis, I have
analyzed both serum (paper I-II and IV, obese cohort) and plasma samples (paper
I, lean cohort and paper III, both obese and MDC-CC cohort). Absolute
concentration of metabolites may vary between plasma and serum samples81
.
However, in my work I have focused on variation, rather than absolute levels.
Analysis by GC/MS is associated with some variation in the extraction and
derivatization yield, as well as in the performance of the GC/MS. I have used a
cocktail of isotope labeled standards, added prior to extraction, to correct for this
variation.
Statistical analysis
Metabolomics techniques generate datasets with a large number of variables
(metabolites) and many metabolites are also, since they are often strongly
biologically linked, highly correlated. This increases the complexity of analyzing
metabolomics data. In addition, analyses by GC and LC are associated with drift,
due to e.g. a continuous contamination of the equipment which affects the
sensitivity. Because of this we have restricted the number of samples analyzed in a
batch to approximately a hundred. Variation within a batch can be corrected for
using internal standards82
, whereas variation between batches is corrected for
using other methods. In paper IV we used ComBat to adjust for batch effects83, 84
.
Samples were scaled to unit variance to reduce inter-individual variations within
an analysis and double-centered (paper I-III), i.e. normalized to the mean of the

30
three measurements for each individual (either the three OGTT time points or
baseline, weight loss and weight maintenance) to reduce intra-individual
variation85
. Most statistics assumes the data to be normally distributed however
sometimes this requirement is not fulfilled. Metabolites with skewed distribution
were therefore transformed to resemble a normal distribution prior to analysis.
Multivariate data analysis is a useful tool for examination and visualization of
large datasets. Many of these methods aim to find latent variables and structures
that more efficiently describe the data (i.e. with fewer dimensions), as compared to
traditional uni-, bi-, and few-variable methods. For these calculations we used
SIMCA 13 (Umetrics, Umeå, Sweden). Principal component analysis (PCA) is an
unsupervised method, which aims at describing the variation in the data. PCA was
used to examine the datasets for potential outliers and to generate a first overview
of the data86
. Orthogonal projections to latent structures discriminant analysis
(OPLS-DA) is a supervised classification method which focuses the analysis on
variation in metabolite levels responsible for the class discrimination87
. OPLS-DA
was used to find metabolite patterns discriminating between OGTT time points
(paper I-II) or between weight loss phases (paper III). All multivariate models
were evaluated by a 7-fold cross-validation88
. In cross-validation, the analysis is
performed on a subset of the samples (i.e. training set) and the analysis is then
validated in another subset of the data (i.e. testing set), this was then performed
seven times with different subsets to reduce variability. Significant changes were
estimated from jack-knifed confidence intervals89
, which is based on “leave one
out” procedure which means starting from the whole sample, then leaving one
sample out and the parameter of interest is estimated from this smaller sample set.
For descriptive analysis of clinical variables, paired Student’s t-test (for normally
distributed data), Wilcoxon Signed Rank Test (for skewed data) and x2-test for
categorical variables, was used to assess difference in anthropometric data among
the obese individuals. Non-parametric Mann-Whitney’s U test was used when
comparing measures between obese and lean individuals. Spearman’s rank
correlation coefficient was used to test for correlations between different variables
or small sets of metabolites. Multiple testing was performed using Benjamini-
Hochberg false discovery rate (FDR) correction (paper IV)90
. Linear regression
was performed to associate BMI, or change in BMI with metabolite levels,
adjusting for age, gender and T2D status (paper III-IV). Statistics were calculated
using IBM SPSS statistics v.20 (IBM Corp. 2011, Armonk, NY, USA) or in R84
.

31
Obesity and diabetes scores
OB-BMI score & OB-WC score
In paper III, we aimed to create amino acids profile scores for obesity (OB): OB-
BMI and OB-WC, which included amino acids associated with obesity and known
risk factors for CVD and T2D status. Noticeably, amino acids were chosen over
other known altered metabolites, such as fatty acids, due to recent findings that
amino acids alone are associated with metabolic diseases36, 39, 41, 91
. This
encouraged us to test this for obese subjects as well. In order to construct these
scores, backward elimination regression was performed for all amino acids
associated with BMI or waist circumference (WC), respectively, in the MDC-CC
cohort adjusted for age, sex, diabetes status, anti-hypertension treatment and
systolic blood pressure. The resulted amino acids were tested for their association
to categorical measures of obesity database (BMI and WC, general obesity
[BMI>30 kg/m2], and abdominal obesity [WC>108 cm for men; >88 cm for
woman32
]). The OB-BMI and OB-WC scores were constructed from the amino
acid levels weighted by the β-coefficients. By constructing a score that includes
both amino acids and known risk factors such as blood pressure and age, we may
access a metabolic risk score more reflective of metabolic health than solely
looking at BMI.
WLWM-BMI score & WLWM-WC score
From the OB-scores we constructed a second set of scores for BMI and WC that
aimed to reflect the treatment-modifiable part of the amino acid constitution by
including only if they are modifiable in the obesity cohort. Thus, these scores was
created using the same variables as for the OB-scores but without those amino
acids that did not show improvement as a result of the full weight loss and weight
maintenance (WLWM) intervention, i.e. WLWM-BMI and WLWM-WC (in Paper
III). Hence, the OB-scores assess the total amino acid-associated burden of
obesity, whereas the WLWM-scores assess the portion of this burden which may
be improved by weight loss and weight maintenance programs. The OB and
WLWM-scores were constructed in paper III and further tested in the larger cohort
in paper IV.
DM-AA score
The diabetes-predictive amino acid score (DM-AA score) consists of isoleucine,
tyrosine and phenylalanine and has shown to predict the risk of developing both
T2D and cardiovascular disease36, 41
. The DM-AA score is equal to the
standardized score of z-score of log isoleucine + z-score of log tyrosine + z-score
of log phenylalanine. This score was evaluated both in paper III and IV.

32

33
Results and Discussion
Metabolite responses during an OGTT
Differences in metabolite profiles during an OGTT between obese and
normal weight individuals (paper I)
In order to access the postprandial alterations present in obesity, an oral glucose
challenge was performed in 14 insulin resistant obese individuals (BMI 43.6±1.5
kg/m2 [mean±SEM]) at three time-points (0, 30 and 120 minutes). These OGTT-
profiles were then compared to the response found in an insulin sensitive group
with normal weight (BMI 22.4±2.4 kg/m2). Fasting and 30 minute concentrations
of glucose in the obese group were the same as in the lean group, whereas 2-hour
glucose concentrations were elevated in the obese group (p<0.01). Both fasting
and 2-hour insulin concentrations were elevated in the obese group (p<0.0001 and
p<0.01, respectively). This together with higher HOMA-IR (p<0.0001), HOMA-β
(p<0.001), insulin sensitivity index (ISI; p<0.0001), corrected insulin response
(CIR; p=0.017) but not the disposition index (DI) indicated that the peripheral
insulin sensitivity was decreased but β-cell activity appeared to be adequate.
Even though IGT is often observed prior to established T2D, not all people with
IGT develop T2D. Thus, additional metabolic markers found during a
conventional OGTT may improve the understanding of insulin resistance45, 46
. In
the obese group, 59 metabolite profiles were identified and OPLS-DA analysis
showed clear metabolite level separation between the OGTT time points. Figure 5
show an onset-decay-plot of the metabolite response during an OGTT in the obese
group. Metabolite levels that are responsible for the classification of OPLS-DA in
the obese group reveal several alterations compared to the expected response seen
in lean individuals49, 52, 53
. Under healthy conditions, circulating fatty acids
decrease rapidly upon glucose-provoked insulin release49
. More specifically, a
faster decline has been observed for the monounsaturated fatty acids compared to
the saturated counterparts50
. Although, a delayed response of fatty acids was
observed in the obese group (Figure 5). Additionally, the OGTT response of
amino acids and their derivates has been studied and the BCAAs, among others,
are also expected to decrease upon insulin release in healthy individuals49, 52, 53
.

34
However, a delayed and/or lack of decrease was observed in the insulin resistant
obese group (Figure 5 and paper I).
Figure 5 Onset-decay-plots of metabolite levels during an OGTT in the obese group Alterations in metabolite profiles during an OGTT in the obese group. Two horizontal and two vertical lines (red) in the plot represent the relative significance border, i.e. metabolites in the center square have non-significant (n.s.) change during the OGTT. Fatty acid and amino acid clusters are highlighted by dashed and dotted circles, respectively. P(corr)[1]: loadings f0or the predictive component of assigned model scaled as correlations. α-KG; α-ketoglutarate, β-HB; β-hydroxybutyrate, P; phosphate.
When comparing the metabolite OGTT-response in the insulin resistant obese to
the glucose tolerant lean group, 16 deviating metabolite profiles (out of the 32
metabolites which were common in both datasets). These deviations were
categorized into three groups. 1) Delayed reduction in levels of five fatty acids
(including palmitic acid, lauric acid, oleic acid, pentadecanoic acid and stearic
acid). 2) Increased levels at 30 minutes of five amino acids (including asparagine,
glutamate, taurine, tyrosine, isoleucine and leucine). 3) A blunted increase at 30
minutes of six metabolites (including pyrophosphate, threonic acid, phenylalanine,
serine, glyceric acid and aspartate). The delayed responses indicate that insulin
resistance in peripheral tissues affects many metabolites, either directly or
indirectly. In addition, a delayed decrease in levels of β-hydroxybutyrate, glycerol,
hypoxanthine and several amino acids may reflect a dysregulation of ketogenesis,
lipolysis, nucleotide degradation and proteolysis52, 53
.
Alanine Citrate
Creatinine Cysteine
Capric acid
Erythritol
Glutamate Glutamine
Glutaric acid
Glyceric acid
β-glycerophosphorate
Glycerol 3-P
Glycerol
Glycine
Enanthic acid
Palmitic acid
Caproic acid
Inositol P
Isocitrate Isoleucine
Lauric acid
Lysine Malate
Citramalic acid
Myo-inositol
Oleic acid Pentadecanoic acid
Phenyl-alanine
Pyroglutamic acid
Pyrophosphate
Serine
Succinate
Taurine Myristic acid
Threonine
Valine β-alanine
Fructose
Putrescine
Methionine Uracil
Tyrosine Leucine
Phosphoric acid
Threonic acid
Adenine
Hypoxanthine
Uric acid
Stearate
Inosine
Proline Tryptophan
β-HB
Xylose
Asparagine
Mannose
Linoleic acid Elaidic acid
Glucose Insulin
-1
-0.8
-0.6
-0.4
-0.2
0
0.2
0.4
0.6
0.8
-1 -0.8 -0.6 -0.4 -0.2 0 0.2 0.4 0.6 0.8 0-30 min p(corr)[1]
n.s.
30-1
20 m
in p
(corr
)[1]

35
Change in metabolite profiles during an OGTT after weight loss and
weight maintenance (paper II)
All 14 non-diabetic obese individuals (BMI=43.7±1.5 kg/m2) completed the
weight loss and weight maintenance program, with a mean weight loss of 17%
(BMI change from weight loss 36.2±1.7 kg/m2 to weight maintenance 34.9±1.8
kg/m2). Insulin resistance and sensitivity (judged by fasting insulin, HOMA-IR,
ISI) and β-cell function (judged by HOMA-β, CIR, IGI) improved during weight
loss, reflecting improved hepatic insulin response. Furthermore, improvement of
glucose tolerance (judged by IGT-status or 2-hour glucose levels, AUCGlucose and
AUCInsulin), was first noticed after weight maintenance, thus reflecting improved
peripheral insulin sensitivity.
A total of 58 metabolite profiles during an OGTT (at fasting, 30 and 120 minutes)
at baseline, weight loss and weight maintenance were analyzed in the obese group.
In addition, the changes in the OGTT-elicited metabolite patterns occurred
differentially during weight loss and weight maintenance. Metabolite OGTT-
response improvement was determined from the OGTT response reported in lean
healthy individuals49, 52, 53
. Out of the 16 altered metabolite profiles identified in
paper I, roughly half of these improved towards a lean profile after the weight loss
program. Table 1 shows groups of improved metabolite profiles, either after
weight loss or weight maintenance, compared to the expected healthy profile.
Surprisingly, only three metabolites (tyrosine, malate and pyrophosphate) were
identified to have a statistically significant improved profile after weight loss. It is
probable though, that more early improvements would be significant in a larger
cohort. In addition, phenylalanine was not grouped with weight loss improvement
since it did not share the same profile as the primary lean reference group49
, but it
shares the same profile reported by Shaham et al52
. Therefore, further investigation
may clarify whether phenylalanine should be included in the weight loss
improvement group. In addition, both phenylalanine and tyrosine, which are
closely biologically linked, showed alteration during the first 30 minutes. IGI
reflects the initial insulin response (during the initial 30 minutes). This motivated
the analysis to determine if IGI was associated with change in the aromatic amino
acids. Glucose-elicited suppression of the aromatic amino acids tyrosine and
phenylalanine was enhanced after weight loss. The enhanced suppression
(analyzed as AUC) of tyrosine and phenylalanine, respectively, was associated
with improved IGI after weight loss (tyrosine: r=0.72, p=0.013; phenylalanine:
r=0.63, p=0.039).
The OGTT-elicited suppression and/or lack of increase in levels of nine
metabolites, together with glucose and insulin, improved towards the lean profile
after weight maintenance, paralleling an improvement in glucose tolerance (Table
1). All identified fatty acids improved towards the lean profile first after weight

36
maintenance, except stearate, which did not improve during the course of weight
loss treatment. Stearate, which is a saturated fatty acid, has shown a slower
decrease during OGTT than its monounsaturated counterpart oleate50
.
Table 1 Metabolite OGTT-profiles at baseline, weight loss and weight maintenance
Grey shadow represent metabolite profiles at baseline for obese individuals which was presented and published in paper I. *Pyrophosphate improves during weight loss, although return to baseline profile after weight maintenance.
Recent reports have shown that a cluster of BCAAs, together with the aromatic
amino acids (tyrosine and phenylalanine), were associated with HOMA-IR in
overweight and obese humans38
. Importantly, weight loss-mediated improvement
of this cluster paralleled an improvement in HOMA-IR66
. Furthermore, HOMA-IR
has been reported to associate with hepatic insulin resistance regardless of glucose
tolerance capacity92
, and therefore, our results may indicate a connection between
aromatic amino acids and hepatic insulin sensitivity. Likewise, the improved
insulin-mediated deterioration of BCAAs and fatty acids may indicate increased
insulin sensitivity in peripheral tissues after weight maintenance. This points
towards careful consideration of metabolite markers during a weight loss program
to determine when a metabolic improvement is expected to show. Moreover, in
paper I and II, we identified several altered metabolite responses during an OGTT
to improve towards a healthier profile after participating in the weight loss
program. A summary of the metabolic pathways that improved in the obese group
after weight loss and weight maintenance, along with markers that were identified
during the OGTT, are presented in Figure 6.
OBESE OBESE OBESE LEAN
Metabolite (Group)
Baseline 0, 30, 120 min
0-120 p-value
Weight loss 0, 30, 120 min
0-120 p-value
Weight maintenance 0, 30, 120 min
0-120 p-value
Reference profile
0, 30, 120 min
Ref.
We
igh
t lo
ss
imp
rov
em
en
t Tyrosine (Amino acid)
0.019
0.011
0.004
49, 52
Malate (TCA-cycle)
49
Pyrophosphate*
(Inorganic ion)
49
We
igh
t m
ain
ten
an
ce
im
pro
ve
men
t
Glutamate (Amino acid)
49
Glutamine (Amino acid)
0.023
49
Isoleucine (Amino acid)
0.035
0.004
49, 52
Leucine (Amino acid)
0.048
0.005
49, 52
Laurate (Fatty acid)
<0.001
<0.001
<0.001
49
Oleate (Fatty acid)
<0.001
<0.001
<0.001
49
Palmitate (Fatty acid)
<0.001
<0.001
<0.001
49
Glucose (Carbohydrate)
<0.001
<0.001
0.019
49
Insulin (Hormone)
0.002
<0.001
<0.001
49
Hypoxanthine (Purine)
0.019
52, 53
Glycerol (Sugar alcohol)
0.001
0.055
<0.001
52

37
Figure 6 Summary of metabolites during an OGTT These metabolites (with specific markers pointed out) are expected to decrease in insulin sensitivity situation, but show altered response in obese insulin resistant humans and, more importantly, improve with weight loss treatment. These markers may therefore be used to evaluate improved energy metabolism after weight loss and weight maintenance. Tyrosine improved already after weight loss, whereas the others have a noticeable improvement after weight maintenance, when peripheral insulin sensitivity improved.
Heterogeneity within the obese group (paper I-II)
Metabolite analysis also revealed a larger heterogeneity in metabolite response
during the OGTT in the obese group compared to lean (paper I). To illustrate this,
we focused on the 2-hour decline of the BCAAs isoleucine and leucine, as well as
FFAs (palmitatic-, lauric-, oleic-, pentadecanoic- and stearic acid). Concerning
isoleucine and leucine, we observed a consistent decrease in lean of 51±2%,
whereas in obese the response was scattered with an average of 19±13%.
Considering the fatty acids, a strong decrease of 79±2% was noticed in the lean
group and a weaker decrease of 55±3% in the obese group. A potential
explanation may be that the β-cell function (assessed by HOMA-β) associated
with levels of isoleucine and leucine at each time point (fasting: p<0.0001, 30
minutes: p=0.016 and 120 minutes: p=0.02). This may indicate the ability to
secrete compensatory insulin, is affecting the isoleucine and leucine levels. In
addition, the 2-hour fatty acid level or the decrease of fatty acids were associated
with HOMA-β (p=0.008), 2-hour glucose (p<0.0001), 2-hour insulin (p<0.001),
HOMA-IR (p=0.001) and ISI (p<0.0001). This suggests that fatty acids, which are
normally very responsive to insulin, are also strongly affected by insulin
resistance. Recent studies have observed elevated BCAA levels together with a
high-fat diet to be associated with development of obesity-related insulin
resistance26, 28
.
Glucose-provoked insulin release
Glycolysis & Gluconeogenesis
↓ Glucose
Lipolysis ↓ Glycerol ↓Fatty acids
markers: laurate, oleate,
palmitate
Proteolysis ↓ Amino acids markers: isoleucine,
leucine, tyrosine, glutamate, valine
Nucleotide degradation
↓ Hypoxanthine marker: purine
Ketogenesis ↓ Ketone bodies marker:
β-hydroxybyturate
38
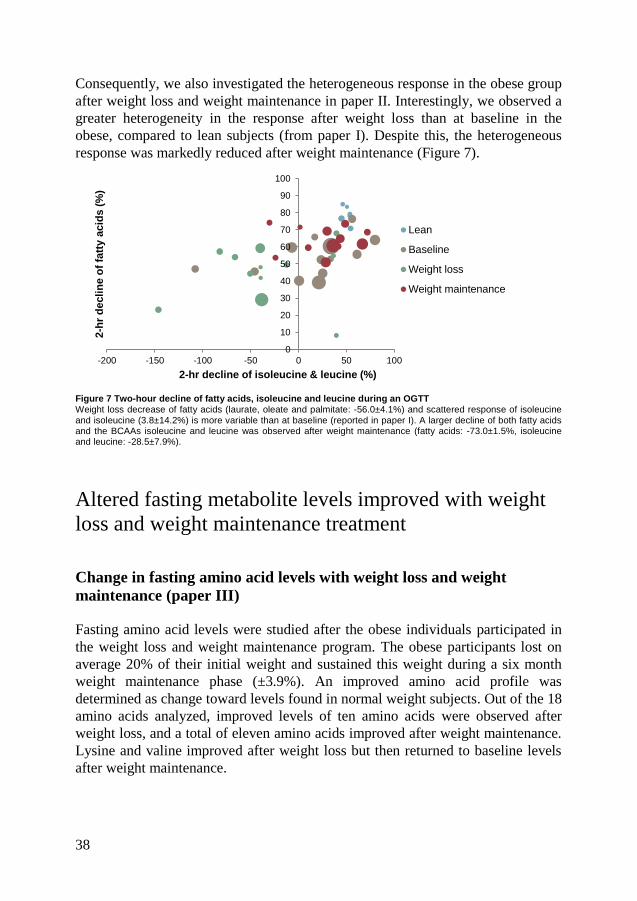
Consequently, we also investigated the heterogeneous response in the obese group
after weight loss and weight maintenance in paper II. Interestingly, we observed a
greater heterogeneity in the response after weight loss than at baseline in the
obese, compared to lean subjects (from paper I). Despite this, the heterogeneous
response was markedly reduced after weight maintenance (Figure 7).
Figure 7 Two-hour decline of fatty acids, isoleucine and leucine during an OGTT Weight loss decrease of fatty acids (laurate, oleate and palmitate: -56.0±4.1%) and scattered response of isoleucine and isoleucine (3.8±14.2%) is more variable than at baseline (reported in paper I). A larger decline of both fatty acids and the BCAAs isoleucine and leucine was observed after weight maintenance (fatty acids: -73.0±1.5%, isoleucine and leucine: -28.5±7.9%).
Altered fasting metabolite levels improved with weight
loss and weight maintenance treatment
Change in fasting amino acid levels with weight loss and weight
maintenance (paper III)
Fasting amino acid levels were studied after the obese individuals participated in
the weight loss and weight maintenance program. The obese participants lost on
average 20% of their initial weight and sustained this weight during a six month
weight maintenance phase (±3.9%). An improved amino acid profile was
determined as change toward levels found in normal weight subjects. Out of the 18
amino acids analyzed, improved levels of ten amino acids were observed after
weight loss, and a total of eleven amino acids improved after weight maintenance.
Lysine and valine improved after weight loss but then returned to baseline levels
after weight maintenance.
0
10
20
30
40
50
60
70
80
90
100
-200 -150 -100 -50 0 50 100
2-h
r d
ecli
ne
of
fatt
y a
cid
s (
%)
2-hr decline of isoleucine & leucine (%)
Lean
Baseline
Weight loss
Weight maintenance

39
Further evaluation of change in amino acid levels after participating in
a weight loss program (paper IV)
To validate our findings from paper III, fasting levels were analyzed in a larger
obese cohort (n=84) before (BMI 42.6±5.6, mean±SD) and after participating in a
weight loss program (BMI 36.1±6.5, duration 0.9 years [range: 0.3-3.1]). Over 70
serum metabolites were identified in all subjects at baseline and follow-up, and
58% metabolites changed with the average weight loss of 18.8±14 kg. Metabolite
change from baseline to follow-up was observed for 42 metabolites (58%) and 30
of these metabolites were unique for those with a weight loss greater than 10%.
Due to the timespan and structure of the weight loss program, baseline and follow-
up in this paper are comparable with baseline and weight maintenance in paper III.
Weight loss-induced change in levels of asparagine, alanine, aspartate, tyrosine,
phenylalanine, glutamate, isoleucine and leucine were confirmed in this paper and
consistent with other reports65, 66, 68
. Even so, the decrease in levels of the BCAA
valine, could not be confirmed in this report, compared to paper III, and has shown
inconsistent change in other reports as well64, 66-68
. A summary of metabolites that
are modifiable with weight loss and weight maintenance is presented in Figure 8.
Figure 8 Metabolite changes with weight loss and weight maintenance in obese humans
A schematic overview of some amino acids and general fatty acid involvement in energy metabolism. Bold font indicates that the metabolite was analyzed in this thesis. Red arrow indicates if we observed change during the weight loss treatment. *indicates if the altered metabolite levels have been reported in obese individuals, all except glycine and asparagine are elevated. The potential decrease of valine was not conclusive and needs to be further validated.
Glucose*
Glycolysis
Pyruvate
Acetyl CoA
Citrate
α-ketoglutarate
Succinyl CoA
Fumarate
Oxaloacetate
Isoleucine*
Methionine Threonine
Valine*
Glutamate*
Glutamine Arginine Proline*
Histidine*
Phenylalanine*
Tyrosine*
Leucine*
Acetoacetate
β-oxidation
Triglycerides*
FFA* & Glycerol* Cysteine* Cystine
Glycine* Serine
Threonine
Asparagine*
Aspartate*
TCA cycle
↓
↑
↓
↓
↓
↓
↑
↑
↓
↓
↓
↓
Tryptophan* Alanine*
↓
Lysine*
Crotonyl CoA ↓
↓
↓ ↓
↓
↓

40
Amino acid levels predictive of weight loss treatment
BMI-associated amino acid levels (paper III)
Many studies have observed altered fasting metabolite levels in people with
obesity and/or T2D, compared to healthy glucose tolerant individuals27-29, 93
.
Particularly the amino acids have been associated with metabolic disorders and,
due to their diverse and important metabolic role, have recently received more
focus34-36, 94, 95
. In paper III, fasting amino acid levels were tested against obesity
traits (BMI and waist circumference [WC]) in the MDC-CC cohort, an
independent prospective study and separated from the obese cohort. After
backward elimination, eight of 18 detected amino acids were associated with
obesity (positive association: alanine, glutamate, isoleucine, phenylalanine,
tyrosine and valine, and negative association: asparagine and glycine), and
adjusted for age, gender, T2D, systolic blood pressure and anti-hypertensive
treatment. The amino acids were also tested against categorical measures of
obesity (BMI and WC, Figure 9).
Figure 9 Odds ratio for amino acids associated with obesity Amino acid levels were analyzed against categorical measures of obesity as either waist circumference (WC) or BMI (WC>88 cm for women and WC>102 cm for men, or BMI≥30 kg/m
2). Analysis was adjusted for age, gender, systolic
blood pressure, anti-hypertensive treatment and type 2 diabetes status. DM-AA; diabetes-predictive amino acids score (including isoleucine, tyrosine and phenylalanine).
The same amino acids were significant in both the BMI and WC models, which
included alanine, asparagine, glutamine, glutamate, glycine, isoleucine, ornithine,

41
phenylalanine, proline, threonine, tyrosine, valine and the DM-AA score. Since
DM-AA score consists of isoleucine, tyrosine and phenylalanine, it is not
surprising that this score showed strong significance. However, considering that
this score was originally found to predict the risk of developing T2D36, 41
, it may
be that this score, and thereby also the individual amino acids, are linked to the
insulin resistant part of the obese individuals. Others have previously reported
association of these amino acids with BMI, however, some studies have also
shown contradicting results28-30, 96-100
. The most consistent findings have been
regarding the BCAAs isoleucine and valine and their elevated levels are associated
with increased BMI, as it was also observed in this report28-30, 97
.
Obesity and treatment-modifiable scores (paper III)
By identifying BMI-associated amino acids, we could utilize these data to create
scores informative of the potential benefit, or lack of benefit, of a weight loss and
weight maintenance program based on the amino acid changes observed. Thus, the
OB-BMI score represents the overall risk, whereas the WLWM-BMI score
represents the treatment-modifiable risk. Both scores were adjusted for gender,
age, systolic blood pressure (SBP), anti-hypertensive treatment (AHT) and T2D
status. We tested the scores both for BMI and WC but since the association model
for amino acids and BMI was higher (r2=0.54) than for WC (r
2=0.31), further
results are limited to the association with BMI. The amino acids included in the
scores are alanine (Ala), asparagine (Asn), glycine (Gly), isoleucine (Ile), tyrosine
(Tyr) and valine (Val).
𝑂𝐵 − 𝐵𝑀𝐼 = 26.8 + 0.92[𝐴𝑙𝑎] − 1.40[𝐴𝑠𝑛] − 0.58[𝐺𝑙𝑦] − 0.61[𝐼𝑙𝑒] + 1.03[𝑇𝑦𝑟] + 1.01[𝑉𝑎𝑙]
+ 0.12[𝑠𝑒𝑥] − 0.061[𝑎𝑔𝑒] + 0.02[𝑆𝐵𝑃] + 0.98[𝐴𝐻𝑇] + 1.50[𝑇2𝐷]
𝑊𝐿𝑊𝑀 − 𝐵𝑀𝐼 = 27.9 + 0.94[𝐴𝑙𝑎] − 1.62[𝐴𝑠𝑛] + 1.33[𝑇𝑦𝑟] − 0.22[𝑠𝑒𝑥] − 0.07[𝑎𝑔𝑒]
+ 0.02[𝑆𝐵𝑃] + 1.04[𝐴𝐻𝑇] + 1.84[𝑇2𝐷]
Whether or not these scores are applicable for clinical evaluation needs to be
tested in an independent study. However, to exemplify and compare the
performance of the OB-BMI and WLWM-BMI scores before and after weight
loss, we simulated different scenarios using realistic amino acid concentrations.
We created two non-diabetic fictional persons, with same sex, age, systolic blood
pressure and no hypertensive treatment. They were constructed to have equal pre-

42
treatment OB-BMI score but containing different amino acid concentration
compositions of the amino acids associated with BMI. Even though the amino acid
levels are realistic, they were intentionally chosen to be highly modifiable by
weight loss for one subject while only partly for the other. The post-treatment OB
score differs depending on how these amino acid profiles are affected by treatment
illustrating the differential benefit of weight loss over the other (Figure 10). When
instead using the treatment-modifiable score, WLWM-BMI, this relative benefit is
apparent already when evaluating the obese individuals prior to weight loss.
Figure 10 OB-BMI and WLWM-BMI before and after weight loss Hypothetical, but realistic, amino acid compositions for two individuals and their OB-BMI and WLWM-BMI scores before (pre) and after (post) a weight loss intervention. The OB-BMI score at baseline was set to be equal, although the specific amino acid concentrations were different.
As this example illustrated, two individuals with the same OB-BMI score at
baseline, but consisting of different amino acid concentrations, show an expected
large score difference after weight loss. Due to this difference in the outcome of
OB-BMI score (post), it is noticeable that the score is sensitive to difference in
amino acid composition. Thus, due to different concentrations of the same amino
acids, one individual (blue) is shown to benefit more over the other (red). When
focusing on the amino acids that are expected to improve, i.e. WLWM score, then
it is possible to see already before treatment which one who would benefit more
from the weight loss program. The WLWM-score was different from the OB-score
depending on the amount of modifiable burden. Hypothetically, the WLWM-
scores could be used in evaluating the treatment-specific likelihood of benefit for
an individual, although this needs to be tested in a clinical trial. Previous
prediction models of weight loss and weight maintenance have included fasting
glucose, HOMA-IR, initial weight trajectories, circulating angiotensin-converting
enzyme, inflammatory markers, psychosocial factors, leptin concentrations or first
evaluating initial weight loss trajectories to predict the outcome101-107
. However, no
model has been successfully implemented in clinical praxis so far. There are
0
100
200
300
400
500
600
700
OB-BMI(pre)
OB-BMI(post)
WLWM-BMI(pre)
WLWM-BMI(post)
Sco
re v
alu
e

43
several factors that need to be improved for application of such model, like easier
analysis tools, better prediction and individualized indicator108
.
Evaluation of the obesity scores in a different weight loss cohort (paper
IV)
In paper IV, we used this larger cohort to also evaluate the obesity scores, OB-
BMI and WLWM-BMI, from paper III. Neither the OB-BMI nor the WLWM-
BMI scores differed at baseline and follow-up when analyzing the complete cohort
or when divided into the weight loss groups (≥10% and <10% weight loss).
However, when looking at the change from baseline to follow-up in score level,
then both scores showed a significant change (p<0.0001). There was no significant
difference when comparing the OB-BMI and WLWM-BMI scores against each
other, which may be due to that the scores only differ in a few amino acids, but it
may also be due to lack of power. Nevertheless, when comparing the change in
scores of an individual from 5 to 10 units decrease in BMI, a larger change was
observed in the WLWM-BMI score, compared to the OB-BMI score (Figure 11).
Figure 11 The change in BMI against change in obesity score Scatter plot illustrating the change in obesity score i.e. OB-BMI (black) and WLWM-BMI (red), from baseline to follow-up and the relative change in BMI. Scores were presented in a logarithmic scale. Shape is depending on weight loss: ≥10% (triangles) and weight loss <10% (circles). Correlation coefficient was calculated for each analysis using Spearman’s rank correlation test. Correlation for OB-BMI score: r = 0.58, p<0.0001 and correlation for WLWM-BMI score: r = 0.55, p<0.0001.
/ ≥10% weight loss
● / ● <10% weight loss
Black = OB-BMI score Red = WLWM-BMI score

44
The DM-AA score was also analyzed, but excluding participants with T2D
(n=27). In paper III, we observed a decreased DM-AA score with weight loss
treatment. In the current study, we saw a borderline significance (p=0.07) in DM-
AA decrease in the ≥10% weight loss group. On the contrary, a significant
increased risk was observed in the <10% weight loss group. When including all
participants, a correlation between the DM-AA score with decreased BMI (r =
0.39, p<0.001) and with HOMA-IR (r ≥0.3, p≥0.01) was observed. The DM-AA
score, which consists of isoleucine, tyrosine and phenylalanine, has been
associated with insulin resistance, both in this report (paper IV) and by others39, 66
.
Weight loss-associated metabolite levels
Baseline metabolites associated with change in BMI (paper IV)
Disturbed energy metabolism is a common trait of pre-diabetic obese individuals,
although the mechanisms behind it are not yet fully understood. Fortunately,
weight loss has shown to improve several obesity-related complications9, 45, 56, 57
. It
would therefore be profitable to identify metabolites alterations that are already at
baseline associated with weight loss success, and thereby provide important
information about how to guide treatment options on an individual level. In paper
IV, we found decreased BMI to be associated with 13 baseline metabolite levels
(Figure 12). Several of these, including glucose, myo-inositol, malate, fumarate,
xylitol and heptanoic acid are involved in energy metabolism. Out of these
metabolites, 2-aminobutyric acid, glyceric acid and xylitol were significantly
associated with categorical separation of weight loss (defined as limit of 10%
weight change). We further looked only at xylitol and found that those subjects
that had lower levels of xylitol (split by half) had a 5.5-fold larger chance of
belonging to the group with ≥10% weight loss. How xylitol is absorbed from food
and metabolized in humans is not well known, but due to their low calorie count
and weak insulin stimulation, it is used as a sweetener. In other words, subjects
that eat these food additives were less likely to benefit from this type of weight
loss program in this report. However, more research needs to be further conducted
to learn more about the metabolic route of xylitol. Since the metabolic regulation
and implication of xylitol is largely unknown, it is not possible at this point to
determine if xylitol is mainly reflecting dietary habits or metabolic processes. For
this reason, it is too preliminary to conclude whether xylitol is involved in a
complex phenotype where sweetened food, other than carbohydrates, has a
negative influence on energy metabolism, or if it rather reflects at a dietary pattern.

45
-1
-0,8
-0,6
-0,4
-0,2
0
0,2
0,4
Lo
ad
ing
s
Figure 12 Baseline metabolites associated with change in BMI Significant metabolites at baseline that was associated with change in BMI. Loadings from the first principal component obtained from multivariate data analysis. Positive loadings reflect higher baseline levels and negative loadings reflect lower baseline levels. Negative change in BMI reflect a decrease from baseline for follow-up.
Weight-loss induced change in metabolite levels associated with
decrease in BMI (paper IV)
We also analyzed the association between change in metabolite levels and weight
loss (Figure 13). In this model, we identified 15 metabolite levels that changed
with weight loss and were associated with a decrease in BMI. These metabolites
included the three BCAAs and tyrosine, all of which were also associated with
improved insulin resistance (data not shown), and are in accordance with a report
by Shah et al66
.
Figure 13 Change in metabolite levels associated with change in BMI
Change in metabolite levels that were significantly associated with change in BMI. Loadings from the first principal component obtained from multivariate data analysis. Positive loadings reflect increased levels and negative loadings reflect decreased levels from baseline to follow-up. Negative change in BMI reflect a decrease from baseline for follow-up.
-1
-0,8
-0,6
-0,4
-0,2
0
0,2
0,4
0,6L
oa
din
gs

46

47
Major conclusions
In this thesis, I have used a metabolomics technique to explore relative metabolite
levels found in glucose intolerant obese individuals after a weight loss regime.
With the aim to identify altered levels typical for obesity traits, and those which
may improve with non-surgical treatment, might lead to better understanding and
evaluation of the heterogeneity normally seen in metabolic disorders. By
combining our results, we hope to provide a more comprehensive insight into the
metabolite changes in obese humans. Furthermore, we identified over 70
metabolites that are present in the obese state, as well as how it may, or may not,
change with weight loss treatment. With our findings, we have been able to
glimpse into the metabolic processes occurring after weight loss, which may thus
reflect a person’s metabolic health.
A summary of the major conclusions:
Metabolite profiles during an OGTT in obese individuals compared to lean
individuals revealed 16 deviating metabolite profiles. These deviations were
categorized into three groups; 1) delayed reduction of five fatty acids, 2)
increased levels at 30 minutes for five amino acids, and 3) a blunted
increase at 30 minutes of six metabolites (aim I).
Roughly half of the 16 deviating metabolite profiles at baseline improved
towards the lean profile after the weight loss program (aim II).
Differential OGTT improvement of metabolite profile during an OGTT
after weight loss compared to weight maintenance. Specifically, aromatic
amino acids improved after weight loss when hepatic insulin sensitivity
increased. On the other hand, BCAAs and several fatty acids improved first
after weight maintenance, concomitant with increased peripheral insulin
sensitivity (aim II).
We found that the heterogeneity observed in the OGTT response at baseline
was surprisingly even more deteriorated after weight loss and distinctly
improved after weight maintenance. Specifically, we observed an improved
decrease of 34% for isoleucine and leucine, and of 17% for FFA from
weight loss to weight maintenance.

48
Ten fasting amino acids were associated with categorical obesity
measurements, i.e. BMI and WC (aim III).
Eleven fasting amino acids improved with weight loss and weight
maintenance (aim III), and eight out of these amino acids were validated in
a larger cohort, including asparagine, alanine, tyrosine, phenylalanine,
glutamate, isoleucine and leucine (aim IV). In total, we observed changed
levels of 30 metabolites in the ≥10% weight loss group in paper IV.
Calculated obesity scores, both for baseline and modifiable with weight loss
were constructed in paper III (aim III) and were further analyzed in the
larger cohort in paper IV (aim IV). In paper IV, we observed that even
though both scores were associated with weight loss, the WLWM-BMI
score indicated a higher responsiveness to weight change. Nevertheless, it is
possible that a larger cohort and/or additional variables are necessary for a
stronger prediction.
We identified 13 metabolites at baseline that were associated with weight
loss, among which xylitol showed a strong and interesting association (aim
IV). Since many of these 13 metabolites are also frequently used
sweeteners, these findings may indicate that dietary habits prior to weight
loss can influence weight loss success.
Finally, weight loss was associated with change in 15 metabolite levels,
including amino acids such as BCAAs, tyrosine and lysine (aim IV).
Collectively, an increased understanding of circulating metabolite changes
associated with weight loss, as well as sustained weight maintenance, was
presented in this thesis. This knowledge is useful to evaluate beneficial weight loss
treatment in the future.

49
Summary in Swedish –
Populärvetenskaplig sammanfattning
Fetma – ett (över)viktigt problem
Förr i tiden ansåg man att övervikt och fetma var ett tecken på rikedom och god
hälsa då det visade att man hade god tillgång till mat. I takt med människans
livsstil har förändrats genom att den är mindre fysiskt krävande och att mat med
hög kalorihalt ofta är både lättillgänglig och billigare, har energiförbrukning
minskat och energiintaget ökat. År 2014 var 1,9 miljarder (39%) vuxna personer
överviktiga i världen, varav 600 miljoner (13%) var diagnostiserade med fetma.
Denna fetmaepidemi förutspås att öka så att upp till 50% av jordens befolkning
kommer att vara feta år 2030. Normalvikt, övervikt och fetma definieras genom att
man räknar ut ett kroppsmasseindex (eng. body mass index [BMI], med enheten
kg/m2). Övervikt klassas om man har ett BMI mellan 25,0 – 29,9 kg/m
2 och fetma
om man har ett BMI över 30,0 kg/m2. Studier har visat att personer med fetma har
ökad risk för att utveckla följdsjukdomar så som typ 2 diabetes (T2D), hjärt-
kärlsjukdomar och sömnapné.
Metabolomik
Metabolomik är en analysmetod då man kan studera mängder med substanser, så
kallade metaboliter (små molekyler) som finns i vävnader, blod och celler. Detta
gör det möjligt att studera ämnen som medverkar i biologiska processer som sker i
kroppen. Vi har använt denna metod för att mäta metaboliter i blodet och för att
studera metabolismen (ämnesomsättningen) hos individer med fetma.
Bristfällig ämnesomsättning och glukosbelastning
Ett ökat energiintag och otillräcklig energiförbrukning, som kombinerat är den
största bidragande faktorn till fetma, resulterar i att fettvävnad lagrar
energiöverskottet som fett. Många med fetma får som konsekvens en bristfällig

50
ämnesomsättning då kroppen inte kan ta upp och omsätta överskottet av energi
från mat. De näringsämnen som främst används som energi är kolhydrater (som
bryts ner till glukos), protein (bryts ner till aminosyror) och fett (fettsyror). Mat tas
upp från magsäcken och tarmen till blodet för att förse kroppen med näring och
samtidigt frisätter så kallade β-celler i bukspottskörteln insulin. Detta hormon får
vävnader att ta upp glukos från blodet och lagra det som glykogen i lever.
Ett sätt att undersöka glukosregleringen efter en måltid är att göra ett s.k.
glukosbelastningstest då man efter en natts fasta dricker en sockerlösning och
därefter mäter blodsocker- och insulinnivåen i blodet. I normala fall ökar nivån av
insulin då sockernivån ökar, vilket får kroppen att ta upp socker från blodet till
vävnader, så den ökade blodsockernivån sjunker tillbaka till grundnivån (sker
oftast inom två timmar). Det är vanligt att personer med fetma har försämrad
förmåga att reglera glukosnivån till en normal nivå och de har då utvecklat
insulinresistens. Detta kan med tiden utvecklas till T2D. Vi har under
glukosbelastningstestet studerat andra metaboliter än glukos i blodet hos personer
med fetma. Det är nämligen känt sedan tidigare att även nivåerna av aminosyror
och fettsyror sjunker vid frisättning av insulin hos friska individer, men det är
mindre känt hur de beter sig vid fetma. Vi har jämfört resultatet från
glukosbelastningen vid fastande, och efter 30 samt 120 minuter mellan individer
med eller utan fetma. Vi kunde då se att de personerna med fetma hade en
halvtimmes försenad sänkning av fem fettsyror jämfört med friska personer. Hos
de överviktiga personerna ökade aminosyranivån de första 30 minuterna innan de
började minska. Medan hos de friska personerna inte fanns någon ökning, bara
sänkning. Dessa skillnader ger en inblick hur en rubbad metabolism ser ut vid
fetma efter en måltid. Vi har härmed identifierat metaboliter med försämrad
respons som är relaterat till den metabolt komplexa åkomman fetma.
Viktnedgångsbehandling
Dagens hjälp för att gå ner i vikt är väldigt generaliserad och inga tydliga riktlinjer
finns. Viktuppgång efter avslutad behandling är vanligt. Vår forskargrupp har
därför studerat olika metaboliter så som aminosyror, fettsyror och kolhydrater efter
viktnedgång, samt efter cirka sex månaders viktstabilitet. Syftet med att studera
detta är att få en ökad förståelse över potentiell förbättring i ämnesomsättning.
Glukosbelastning efter viktnedgång
När vi tittade på metaboliternas respons under en glukosbelastning hos personer
med fetma efter att de gått ner mer än 10% av sin initiala vikt såg vi att

51
aminosyran tyrosin och potentiellt fenylalanin, en relaterad aminosyra till tyrosin,
hade en förbättrad profil efter 30 minuter. Även insulinresistensen verkade vara
förbättrad i levern efter viktnedgångsfasen. Något förvånande såg vi att fler
aminosyror så som isoleucin och leucin, samt några fettsyrors profil förbättrades
först efter viktstabilitetsfasen. Då verkade även insulinkänsligheten i övrig vävnad
(så som muskler och fettvävnad) förbättras.
Aminosyror relaterade till BMI och förändring vid viktnedgång
Vi och andra forskare har sett att vissa aminosyror är associerade med BMI.
Exempelvis så har ökad blodkoncentration av isoleucin, tyrosin och fenylalanin
observerats i personer med fetma. Dessa aminosyror har även associerats till
insulinresistens och T2D. I vår studie kunde vi se att viktminskning resulterade i
minskade nivåer i dessa aminosyror, och de bibehölls lägre även vid viktstabilitet.
Genom att studera aminosyror relaterade till BMI och vilka som förbättrades med
viktnedgång kunde vi konstruera en ekvation med aminosyror som var relaterad
till BMI. Denna ekvation inkluderade även status på högt blodtryck och T2D och
därmed även fångade andra fetmarelaterade riskfaktorer. I en annan
viktnedgångstudie, kunde vi testa ekvationen och såg att risknivån sänktes med
viktnedgångsbehandling. Dock är det för tidigt att utvärdera om ekvationen är
tillräcklig för att kunna användas på individuell nivå.
Sammanfattning
Vår forskning har identifierat en förbättring i flera fetma-relaterade aminosyror
och fettsyror hos personer med fetma efter en viktnedgångsbehandling som även
inkluderade en viktsabilitetsfas. Vi såg att förbättringen sker i olika faser,
sannolikt relaterat till när insulinkänsligheten förbättras vid viktnedgång. Slutligen
kan vi bekräfta att metabolomik är en användbar metod för att studera metaboliter
hos personer med fetma för att få ökad förståelse över vilka metaboliter som kan
tänkas användas för utvärdering av försämrad, men även förbättrad,
ämnesomsättning.

52

53
Acknowledgements
My PhD would not have been possible without the immense help of my
supervisors Professor Martin Ridderstråle and Peter Spégel. Martin, your
enthusiastic, positive and energized personality has helped me go through the
times when it got difficult. We have had many discussions about results and I have
realized how one could analyze metabolomics data endlessly! I don´t know how
many questions I have asked during these years which you patiently answered.
Thank you for always being eager to discuss science with me. Your support and
wide expertise in the field has made my PhD time really enjoyable! Peter, my
always-helping co-supervisor and fast problem solver. Without you, I would not
have managed the metabolomics part of my thesis, which obviously is a big part.
Thank you for all your help! Anders Danielsson, thank you for supervising me
during my first years as a PhD student. I´m sure it wasn´t easy to introduce me to
GC/MS! I’m very thankful for your help, even though you forced me to listen to
blues ;)
Maja, my fellow PhD student in the group, and Maria, our excellent research
nurse, thank you both for all your help with clinical data, for answering my silly
questions and for all the nice chats.
Professor Hindrik Mulder, thank you for your help and for allowing me to
participate in some of your group activities. Thank you Lotta for your happiness,
Laila for your kindness, and Mahmoud for the help and company while running
samples on the LC/MS. My metabolomics buddies, Lotta, Peter, Mahmoud,
Celine, Filip and Widet, we have a nice little metabolomics-community at CRC.
A big thanks to the co-authors; Karin Filipsson, Martin Magnusson, Professor
Olle Melander, Professor Robert Gerszten, Professor Thomas Wang, Lovisa
Reinius, for your contribution in respective articles.
Thanks to Professor Paul Franks for granting me the BLUE ScY scholarship
which made it possible for me to go to Boston.
Professor Joel Hirschhorn, thanks for your kind and generous hospitality
allowing me to be a part of your excellent research group at Children’s Hospital in
Boston and Broad Institute of Harvard and MIT for six months. I learned so much
during this time and will be forever grateful – thank you so much! A special
thanks to Rany Salem for your incredible support and encouragement, what I

54
know about R is mainly thanks to you! Yu-Han Hsu, not only are you a super-
smart PhD student, you are a dear friend who made my stay in Boston really fun,
both inside and outside the lab! Thanks for showing me where to find the best ice
cream and food in Cambridge, where to go climbing, and the Harpoon Brewery
(just for the sake of it, we tried a lot of other beers)! I hope we will meet again
soon! Christina Astley, I had a hard time getting the concept of pleiotropy, but
thanks to you, I think I finally got it . Yu-Han, Rany, Joel, Christina, Mike,
Tune, Sailaja, Jay, Rebecca, and Chris, thanks for the meetings, the nice lunches
and your friendship - I miss you all!
Thanks to Valeri Lyssenko, Professor Leif Groop and the rest of the lab for
introducing me to the field of diabetes research and to the vibrant atmosphere at
LUDC. Thank you Ulrika for all your help “administrating stuff” ;) Jasmina, I´m
sorry for not devoting a chapter just for you , but I hope you know how much I
have enjoyed and looked forward to our lunches when we really talk about
everything from heaven to earth. Thanks Emilia for all spontaneous breaks and
talks . Wenny, you were my first friend at CRC and you were very kind and
helpful throughout my master, followed by nice lunches during our PhD studies.
The DPLU PhD student committee (both former and present); Lovisa, Hanna,
Caroline, Eliana, Robert, Elin, Mia, Linda, Hedvig, Yan, Cajsa, Eliana, Anna
and Christina, thank you all for the great time planning and arranging activities,
and especially for our fun get-togethers. It has also been a lot of fun to go to
conferences with Lovisa, Linda and Eliana in Boston and crazy fun to share an
apartment with Hanna and Lovisa in Barcelona during EASD! Research is really
fun but you guys make it really fun outside of work too!
Christina, my “Boston-sister”, I think the best decision we made together was to
live together in Boston! You were the warmth during months of snow. We were
committed to celebrate all the American traditions and of course to watch some
Ally McBeal . Thank you!
My beloved molecular biologist friends, Emelie, Lovisa, Klara and Hanna! Can
you believe that we are having a 10 year jubilee this year!? Klara, thank you
for celebrating our bachelor’s degree in the best way, by spending over 3 months
in South-East Asia – unforgettable! Hanna, thanks for your help and kindness,
everything from helping me to search for an apartment to teaching me how to do
limoncello drinks . Emelie, you introduced me to the student life in Lund, it was
a loooot of fun. Now you are introducing me to “interesting” bars in Stockholm ;).
Lovisa, my Lurvizzle, how do I even start describing what you have meant for me
in these last 10 years! You also encouraged me to do my exchange abroad in San
Diego, no need to explain how thankful I am for that one ;). You are a wonderful
mix of kind, clever and crazy! It´s been awesome to both be PhD students in the

55
same field and to be able to go to conferences (how fortunate that you went to a
conference in Boston when I was there!). Thank you for being an amazing friend!
Sofie, Brit and Laura, we bonded over crazy parties at UCSD and road-trips
around Cali, and the journeys haven’t stopped! Thanks Sofie and Brit for
visiting me in Boston and for the road-trip around Florida! Humid and amazing!
Brit, my flat-mate in I-House, we almost became one person to the point that we
even got called by one name (“Brina”) haha. You know you have true friends
when you stay close even when living in different countries.
Jon, Cissi, Sarah and Adam, my senior high-school friends, it is always really
fun to meet you and hear about all your adventures, we always have so much to
catch up on and I always look forward to whatever fun, weird and contradicting
conversations we may have.
Carro, I’ve stopped counting how long we have known each other. We have
moved from escaping from kindergarten and playing troll, to cozy wine and dinner
hang outs. It’s lovely when friendships last long.
“My Mexican family”, Fernando, Marta, Feri, Tania, Miguel and sweet little
Leo, thank you for including me in your family, always welcoming me to your
home and making Mexico feel like my second home.
My dear family, thank you for being the best family anyone can wish for! Niklas,
you have an efficient way of greatly mixing brutal criticism and encouraging
support which, I think (I´m probably gonna regret saying this ;) ), is why I kept
daring to go further on the academic path I wanted to go. Sofia, you are not only
my sister-in-law but also my friend, inspiration and sometimes dentist. And my
little sunshine, Johanna! I’m always so surprised how much happiness and love
that can fit in such a little person. Göran, thank you for being so kind and helpful
with stuff I really need help with, such as with the apartment. You are not born
with that kind of knowledge. My mom, Rosmarie, if I were to list everything that
I have to thank you for, this book would have been twice as thick! You have
undoubtedly supported me all years and helped me in every possible way, from
submitting my application to go to San Diego when I was in Asia (despite that you
were a little upset about me going away again) to buying me new leggings because
mine broke 10 min before my half time report. You are simply the best!
My love, Sebastian, you have been incredibly helpful, patient and supportive
during my whole PhD, even during the most stressful time (Respect! ).
Regardless if we are off on an adventure together or watching a movie, next to you
is the best place and where I want to be. Te amo muchisimo!
May the Fourth Be With You

56

57
References
1. Eknoyan G. A history of obesity, or how what was good became ugly and
then bad. Advances in chronic kidney disease 2006; 13(4): 421-7.
2. WHO. Obesity and overweight fact sheet N°311. Available from:
http://wwwwhoint/mediacentre/factsheets/fs311/en/ [02152015] 2015.
3. Finkelstein EA, Khavjou OA, Thompson H, et al. Obesity and severe
obesity forecasts through 2030. American journal of preventive medicine
2012; 42(6): 563-70.
4. Skinner AC, Skelton JA. Prevalence and trends in obesity and severe
obesity among children in the United States, 1999-2012. JAMA pediatrics
2014; 168(6): 561-6.
5. Skelton JA, Cook SR, Auinger P, Klein JD, Barlow SE. Prevalence and
trends of severe obesity among US children and adolescents. Academic
pediatrics 2009; 9(5): 322-9.
6. Skinner AC, Perrin EM, Moss LA, Skelton JA. Cardiometabolic Risks and
Severity of Obesity in Children and Young Adults. The New England
journal of medicine 2015; 373(14): 1307-17.
7. French SA, Epstein LH, Jeffery RW, Blundell JE, Wardle J. Eating
behavior dimensions. Associations with energy intake and body weight. A
review. Appetite 2012; 59(2): 541-9.
8. Sullivan PW, Morrato EH, Ghushchyan V, Wyatt HR, Hill JO. Obesity,
inactivity, and the prevalence of diabetes and diabetes-related
cardiovascular comorbidities in the U.S., 2000-2002. Diabetes care 2005;
28(7): 1599-603.
9. Kahn SE, Hull RL, Utzschneider KM. Mechanisms linking obesity to
insulin resistance and type 2 diabetes. Nature 2006; 444(7121): 840-6.
10. Guh DP, Zhang W, Bansback N, Amarsi Z, Birmingham CL, Anis AH.
The incidence of co-morbidities related to obesity and overweight: a
systematic review and meta-analysis. BMC public health 2009; 9: 88.
11. Cahill GF, Jr. Fuel metabolism in starvation. Annual review of nutrition
2006; 26: 1-22.
12. Deng D, Yan N. GLUT, SGLT, and SWEET: Structural and mechanistic
investigations of the glucose transporters. Protein science : a publication
of the Protein Society 2016; 25(3): 546-58.
13. Exton JH, Friedmann N, Wong EH, Brineaux JP, Corbin JD, Park CR.
Interaction of glucocorticoids with glucagon and epinephrine in the control
of gluconeogenesis and glycogenolysis in liver and of lipolysis in adipose
tissue. The Journal of biological chemistry 1972; 247(11): 3579-88.

58
14. Ruzzin J, Wagman AS, Jensen J. Glucocorticoid-induced insulin
resistance in skeletal muscles: defects in insulin signalling and the effects
of a selective glycogen synthase kinase-3 inhibitor. Diabetologia 2005;
48(10): 2119-30.
15. Finn PF, Dice JF. Proteolytic and lipolytic responses to starvation.
Nutrition 2006; 22(7-8): 830-44.
16. Svendsen A. Lipase protein engineering. Biochimica et biophysica acta
2000; 1543(2): 223-38.
17. Krebs HA. Some aspects of the regulation of fuel supply in omnivorous
animals. Advances in enzyme regulation 1972; 10: 397-420.
18. Krebs HA, Lund P. Aspects of the regulation of the metabolism of
branched-chain amino acids. Advances in enzyme regulation 1976; 15:
375-94.
19. Krug S, Kastenmuller G, Stuckler F, et al. The dynamic range of the
human metabolome revealed by challenges. FASEB journal : official
publication of the Federation of American Societies for Experimental
Biology 2012; 26(6): 2607-19.
20. Henquin JC. Triggering and amplifying pathways of regulation of insulin
secretion by glucose. Diabetes 2000; 49(11): 1751-60.
21. Schnell S, Schaefer M, Schofl C. Free fatty acids increase cytosolic free
calcium and stimulate insulin secretion from beta-cells through activation
of GPR40. Molecular and cellular endocrinology 2007; 263(1-2): 173-80.
22. Floyd JC, Jr., Fajans SS, Conn JW, Knopf RF, Rull J. Stimulation of
insulin secretion by amino acids. The Journal of clinical investigation
1966; 45(9): 1487-502.
23. Tabak AG, Jokela M, Akbaraly TN, Brunner EJ, Kivimaki M, Witte DR.
Trajectories of glycaemia, insulin sensitivity, and insulin secretion before
diagnosis of type 2 diabetes: an analysis from the Whitehall II study.
Lancet 2009; 373(9682): 2215-21.
24. Boden G, Shulman GI. Free fatty acids in obesity and type 2 diabetes:
defining their role in the development of insulin resistance and beta-cell
dysfunction. European journal of clinical investigation 2002; 32 Suppl 3:
14-23.
25. Unger RH. Lipotoxic diseases. Annual review of medicine 2002; 53: 319-
36.
26. Felig P, Marliss E, Cahill GF, Jr. Plasma amino acid levels and insulin
secretion in obesity. The New England journal of medicine 1969; 281(15):
811-6.
27. Zhou Y, Qiu L, Xiao Q, et al. Obesity and diabetes related plasma amino
acid alterations. Clinical biochemistry 2013; 46(15): 1447-52.
28. Newgard CB, An J, Bain JR, et al. A branched-chain amino acid-related
metabolic signature that differentiates obese and lean humans and
contributes to insulin resistance. Cell metabolism 2009; 9(4): 311-26.
29. Kim JY, Park JY, Kim OY, et al. Metabolic profiling of plasma in
overweight/obese and lean men using ultra performance liquid
chromatography and Q-TOF mass spectrometry (UPLC-Q-TOF MS). J
Proteome Res 2010; 9(9): 4368-75.

59
30. Moore SC, Matthews CE, Sampson JN, et al. Human metabolic correlates
of body mass index. Metabolomics 2014; 10(2): 259-69.
31. Kaddurah-Daouk R, Kristal BS, Weinshilboum RM. Metabolomics: a
global biochemical approach to drug response and disease. Annual review
of pharmacology and toxicology 2008; 48: 653-83.
32. Cheng S, Rhee EP, Larson MG, et al. Metabolite profiling identifies
pathways associated with metabolic risk in humans. Circulation 2012;
125(18): 2222-31.
33. Rauschert S, Uhl O, Koletzko B, Hellmuth C. Metabolomic biomarkers
for obesity in humans: a short review. Annals of nutrition & metabolism
2014; 64(3-4): 314-24.
34. Newgard CB. Interplay between lipids and branched-chain amino acids in
development of insulin resistance. Cell metabolism 2012; 15(5): 606-14.
35. Adams SH. Emerging perspectives on essential amino acid metabolism in
obesity and the insulin-resistant state. Advances in nutrition 2011; 2(6):
445-56.
36. Wang TJ, Larson MG, Vasan RS, et al. Metabolite profiles and the risk of
developing diabetes. Nature medicine 2011; 17(4): 448-53.
37. Fiehn O, Garvey WT, Newman JW, Lok KH, Hoppel CL, Adams SH.
Plasma metabolomic profiles reflective of glucose homeostasis in non-
diabetic and type 2 diabetic obese African-American women. PloS one
2010; 5(12): e15234.
38. Huffman KM, Shah SH, Stevens RD, et al. Relationships between
circulating metabolic intermediates and insulin action in overweight to
obese, inactive men and women. Diabetes care 2009; 32(9): 1678-83.
39. Wurtz P, Soininen P, Kangas AJ, et al. Branched-chain and aromatic
amino acids are predictors of insulin resistance in young adults. Diabetes
care 2013; 36(3): 648-55.
40. Stancakova A, Civelek M, Saleem NK, et al. Hyperglycemia and a
common variant of GCKR are associated with the levels of eight amino
acids in 9,369 Finnish men. Diabetes 2012; 61(7): 1895-902.
41. Magnusson M, Lewis GD, Ericson U, et al. A diabetes-predictive amino
acid score and future cardiovascular disease. European heart journal
2013; 34(26): 1982-9.
42. Fernstrom JD. Branched-chain amino acids and brain function. The
Journal of nutrition 2005; 135(6 Suppl): 1539S-46S.
43. Stumvoll M, Mitrakou A, Pimenta W, et al. Use of the oral glucose
tolerance test to assess insulin release and insulin sensitivity. Diabetes
care 2000; 23(3): 295-301.
44. American Diabetes A. Diagnosis and classification of diabetes mellitus.
Diabetes care 2014; 37 Suppl 1: S81-90.
45. Abbasi F, Brown Jr BW, Lamendola C, McLaughlin T, Reaven GM.
Relationship between obesity, insulin resistance, and coronary heart
disease risk. Journal of the American College of Cardiology 2002; 40(5):
937-43.
46. Alberti KGMM, Zimmet PZ, Consultation W. Definition, diagnosis and
classification of diabetes mellitus and its complications part 1: Diagnosis
60
and classification of diabetes mellitus - Provisional report of a WHO
consultation. Diabetic Med 1998; 15(7): 539-53.
47. Matsuda M, DeFronzo RA. Insulin sensitivity indices obtained from oral
glucose tolerance testing: comparison with the euglycemic insulin clamp.
Diabetes care 1999; 22(9): 1462-70.
48. Abdul-Ghani MA, Tripathy D, DeFronzo RA. Contributions of beta-cell
dysfunction and insulin resistance to the pathogenesis of impaired glucose
tolerance and impaired fasting glucose. Diabetes care 2006; 29(5): 1130-
9.
49. Spégel P, Danielsson AH, Bacos K, et al. Metabolomic analysis of a
human oral glucose tolerance test reveals fatty acids as reliable indicators
of regulated metabolism. Metabolomics 2010; 6(1): 56-66.
50. Zhao X, Peter A, Fritsche J, et al. Changes of the plasma metabolome
during an oral glucose tolerance test: is there more than glucose to look at?
American journal of physiology Endocrinology and metabolism 2009;
296(2): E384-93.
51. Wopereis S, Rubingh CM, van Erk MJ, et al. Metabolic profiling of the
response to an oral glucose tolerance test detects subtle metabolic changes.
PloS one 2009; 4(2): e4525.
52. Shaham O, Wei R, Wang TJ, et al. Metabolic profiling of the human
response to a glucose challenge reveals distinct axes of insulin sensitivity.
Molecular systems biology 2008; 4: 214.
53. Ho JE, Larson MG, Vasan RS, et al. Metabolite profiles during oral
glucose challenge. Diabetes 2013; 62(8): 2689-98.
54. Liu L, Feng R, Guo F, Li Y, Jiao J, Sun C. Targeted metabolomic analysis
reveals the association between the postprandial change in palmitic acid,
branched-chain amino acids and insulin resistance in young obese
subjects. Diabetes research and clinical practice 2015; 108(1): 84-93.
55. Ramage S, Farmer A, Apps Eccles K, McCargar L. Healthy strategies for
successful weight loss and weight maintenance: a systematic review.
Applied physiology, nutrition, and metabolism = Physiologie appliquee,
nutrition et metabolisme 2014; 39(1): 1-20.
56. Tuomilehto J, Lindstrom J, Eriksson JG, et al. Prevention of type 2
diabetes mellitus by changes in lifestyle among subjects with impaired
glucose tolerance. The New England journal of medicine 2001; 344(18):
1343-50.
57. Knowler WC, Barrett-Connor E, Fowler SE, et al. Reduction in the
incidence of type 2 diabetes with lifestyle intervention or metformin. The
New England journal of medicine 2002; 346(6): 393-403.
58. Crandall JP, Knowler WC, Kahn SE, et al. The prevention of type 2
diabetes. Nature clinical practice Endocrinology & metabolism 2008;
4(7): 382-93.
59. Wharton S. Current Perspectives on Long-term Pharmacotherapy for
Obesity. Canadian journal of diabetes 2015.
60. Sjostrom L. Bariatric surgery and reduction in morbidity and mortality:
experiences from the SOS study. International journal of obesity 2008; 32
Suppl 7: S93-7.

61
61. Foster GD, Wyatt HR, Hill JO, et al. A randomized trial of a low-
carbohydrate diet for obesity. The New England journal of medicine 2003;
348(21): 2082-90.
62. Sjostrom L. Review of the key results from the Swedish Obese Subjects
(SOS) trial - a prospective controlled intervention study of bariatric
surgery. Journal of internal medicine 2013; 273(3): 219-34.
63. Sarwer DB, von Sydow Green A, Vetter ML, Wadden TA. Behavior
therapy for obesity: where are we now? Current opinion in endocrinology,
diabetes, and obesity 2009; 16(5): 347-52.
64. Perez-Cornago A, Brennan L, Ibero-Baraibar I, et al. Metabolomics
identifies changes in fatty acid and amino acid profiles in serum of
overweight older adults following a weight loss intervention. Journal of
physiology and biochemistry 2014; 70(2): 593-602.
65. Lien LF, Haqq AM, Arlotto M, et al. The STEDMAN project:
biophysical, biochemical and metabolic effects of a behavioral weight loss
intervention during weight loss, maintenance, and regain. Omics : a
journal of integrative biology 2009; 13(1): 21-35.
66. Shah SH, Crosslin DR, Haynes CS, et al. Branched-chain amino acid
levels are associated with improvement in insulin resistance with weight
loss. Diabetologia 2012; 55(2): 321-30.
67. Laferrere B, Reilly D, Arias S, et al. Differential metabolic impact of
gastric bypass surgery versus dietary intervention in obese diabetic
subjects despite identical weight loss. Science translational medicine
2011; 3(80): 80re2.
68. Piccolo BD, Comerford KB, Karakas SE, Knotts TA, Fiehn O, Adams SH.
Whey protein supplementation does not alter plasma branched-chained
amino acid profiles but results in unique metabolomics patterns in obese
women enrolled in an 8-week weight loss trial. The Journal of nutrition
2015; 145(4): 691-700.
69. Reinehr T, Wolters B, Knop C, et al. Changes in the serum metabolite
profile in obese children with weight loss. European journal of nutrition
2014.
70. Persson M, Berglund G, Hedblad B, Nelson JJ. Elevated Lp-PLA2 levels
add prognostic information to the metabolic syndrome on incidence of
cardiovascular events among middle-aged nondiabetic subjects.
Arteriosclerosis, Thrombosis, and Vascular Biology 2007; 27(6): 1411-6.
71. Hanson RL, Pratley RE, Bogardus C, et al. Evaluation of simple indices of
insulin sensitivity and insulin secretion for use in epidemiologic studies.
American journal of epidemiology 2000; 151(2): 190-8.
72. Phillips DI, Clark PM, Hales CN, Osmond C. Understanding oral glucose
tolerance: comparison of glucose or insulin measurements during the oral
glucose tolerance test with specific measurements of insulin resistance and
insulin secretion. Diabetic medicine : a journal of the British Diabetic
Association 1994; 11(3): 286-92.
73. Matthews DR, Hosker JP, Rudenski AS, Naylor BA, Treacher DF, Turner
RC. Homeostasis model assessment: insulin resistance and beta-cell

62
function from fasting plasma glucose and insulin concentrations in man.
Diabetologia 1985; 28(7): 412-9.
74. Fiehn O. Metabolomics - the link between genotypes and phenotypes.
Plant Mol Biol 2002; 48(1-2): 155-71.
75. Wishart DS. Current progress in computational metabolomics. Briefings in
bioinformatics 2007; 8(5): 279-93.
76. Akoto L, Vreuls RJ, Irth H, Pel R, Stellaard F. Fatty acid profiling of raw
human plasma and whole blood using direct thermal desorption combined
with gas chromatography-mass spectrometry. Journal of chromatography
A 2008; 1186(1-2): 365-71.
77. Perwaiz S, Tuchweber B, Mignault D, Gilat T, Yousef IM. Determination
of bile acids in biological fluids by liquid chromatography-electrospray
tandem mass spectrometry. Journal of lipid research 2001; 42(1): 114-9.
78. Foxall PJ, Spraul M, Farrant RD, Lindon LC, Neild GH, Nicholson JK.
750 MHz 1H-NMR spectroscopy of human blood plasma. Journal of
pharmaceutical and biomedical analysis 1993; 11(4-5): 267-76.
79. Buscher JM, Czernik D, Ewald JC, Sauer U, Zamboni N. Cross-platform
comparison of methods for quantitative metabolomics of primary
metabolism. Anal Chem 2009; 81(6): 2135-43.
80. Gullberg J, Jonsson P, Nordström A, Sjöström M, Moritz T. Design of
experiments: an efficient strategy to identify factors influencing extraction
and derivatization of Arabidopsis thaliana samples in metabolomic studies
with gas chromatography/mass spectrometry. Analytical Biochemistry
2004; 331(2): 283-95.
81. Dettmer K, Almstetter MF, Appel IJ, et al. Comparison of serum versus
plasma collection in gas chromatography--mass spectrometry-based
metabolomics. Electrophoresis 2010; 31(14): 2365-73.
82. Chorell E, Moritz T, Branth S, Antti H, Svensson MB. Predictive
metabolomics evaluation of nutrition-modulated metabolic stress
responses in human blood serum during the early recovery phase of
strenuous physical exercise. J Proteome Res 2009; 8(6): 2966-77.
83. Leek JT, Johnson WE, Parker HS, Fertig EJ, Jaffe AE, Storey JD. sva:
Surrogate Variable Analysis. R package version 3140.
84. Team RC. R: A Language and Environment for Statistical Computing.
2015.
85. Bro R, Smilde AK. Centering and scaling in component analysis. J
Chemometr 2003; 17(1): 16-33.
86. Wold S, Esbensen K, Geladi P. Principal Component Analysis.
Chemometr Intell Lab 1987; 2(1-3): 37-52.
87. Bylesjo M, Rantalainen M, Cloarec O, Nicholson JK, Holmes E, Trygg J.
OPLS discriminant analysis: combining the strengths of PLS-DA and
SIMCA classification. J Chemometr 2006; 20(8-10): 341-51.
88. Wold S. Cross-Validatory Estimation of the Number of Components in
Factor and Principal Components Models. Technometrics 1978; 20(4):
397-405.
63
89. Efron B, Gong G. A LEISURELY LOOK AT THE BOOTSTRAP, THE
JACKKNIFE, AND CROSS-VALIDATION. American Statistician 1983;
37(1): 36-48.
90. Benjamini Y, Hochberg Y. Controlling the False Discovery Rate - a
Practical and Powerful Approach to Multiple Testing. J Roy Stat Soc B
Met 1995; 57(1): 289-300.
91. Wiklund P, Zhang X, Tan X, Keinanen-Kiukaanniemi S, Alen M, Cheng
S. Serum amino acid profiles in childhood predict triglyceride level in
adulthood: A 7-year longitudinal study in girls. The Journal of clinical
endocrinology and metabolism 2016: jc20161053.
92. Tripathy D, Almgren P, Tuomi T, Groop L. Contribution of insulin-
stimulated glucose uptake and basal hepatic insulin sensitivity to surrogate
measures of insulin sensitivity. Diabetes care 2004; 27(9): 2204-10.
93. Tai ES, Tan ML, Stevens RD, et al. Insulin resistance is associated with a
metabolic profile of altered protein metabolism in Chinese and Asian-
Indian men. Diabetologia 2010; 53(4): 757-67.
94. Filla LA, Edwards JL. Metabolomics in diabetic complications. Molecular
bioSystems 2016.
95. Kordalewska M, Markuszewski MJ. Metabolomics in cardiovascular
diseases. Journal of pharmaceutical and biomedical analysis 2015; 113:
121-36.
96. Netzer M, Kugler KG, Muller LA, et al. A network-based feature selection
approach to identify metabolic signatures in disease. Journal of theoretical
biology 2012; 310: 216-22.
97. Zeng M, Liang Y, Li H, et al. Plasma metabolic fingerprinting of
childhood obesity by GC/MS in conjunction with multivariate statistical
analysis. Journal of pharmaceutical and biomedical analysis 2010; 52(2):
265-72.
98. Oberbach A, Bluher M, Wirth H, et al. Combined proteomic and
metabolomic profiling of serum reveals association of the complement
system with obesity and identifies novel markers of body fat mass
changes. J Proteome Res 2011; 10(10): 4769-88.
99. Wahl S, Yu Z, Kleber M, et al. Childhood obesity is associated with
changes in the serum metabolite profile. Obesity facts 2012; 5(5): 660-70.
100. McCormack SE, Shaham O, McCarthy MA, et al. Circulating branched-
chain amino acid concentrations are associated with obesity and future
insulin resistance in children and adolescents. Pediatric obesity 2013; 8(1):
52-61.
101. Kong LC, Wuillemin PH, Bastard JP, et al. Insulin resistance and
inflammation predict kinetic body weight changes in response to dietary
weight loss and maintenance in overweight and obese subjects by using a
Bayesian network approach. The American journal of clinical nutrition
2013; 98(6): 1385-94.
102. Wang P, Holst C, Wodzig WK, et al. Circulating ACE is a predictor of
weight loss maintenance not only in overweight and obese women, but
also in men. International journal of obesity 2012; 36(12): 1545-51.

64
103. Hadziabdic MO, Mucalo I, Hrabac P, Matic T, Rahelic D, Bozikov V.
Factors predictive of drop-out and weight loss success in weight
management of obese patients. Journal of human nutrition and dietetics :
the official journal of the British Dietetic Association 2015; 28 Suppl 2:
24-32.
104. Wang P, Holst C, Andersen MR, et al. Blood profile of proteins and
steroid hormones predicts weight change after weight loss with
interactions of dietary protein level and glycemic index. PloS one 2011;
6(2): e16773.
105. Napolitano A, Miller SR, Murgatroyd PR, et al. Prediction of weight loss
and regain following dietary, lifestyle, and pharmacologic intervention.
Clinical pharmacology and therapeutics 2012; 91(6): 1027-34.
106. Teixeira PJ, Going SB, Houtkooper LB, et al. Weight loss readiness in
middle-aged women: psychosocial predictors of success for behavioral
weight reduction. Journal of behavioral medicine 2002; 25(6): 499-523.
107. Ramel A, Arnarson A, Parra D, et al. Gender difference in the prediction
of weight loss by leptin among overweight adults. Annals of nutrition &
metabolism 2010; 56(3): 190-7.
108. Stubbs J, Whybrow S, Teixeira P, et al. Problems in identifying predictors
and correlates of weight loss and maintenance: implications for weight
control therapies based on behaviour change. Obesity reviews : an official
journal of the International Association for the Study of Obesity 2011;
12(9): 688-708.