Embed Size (px)
Citation preview

General rights Copyright and moral rights for the publications made accessible in the public portal are retained by the authors and/or other copyright owners and it is a condition of accessing publications that users recognise and abide by the legal requirements associated with these rights.
Users may download and print one copy of any publication from the public portal for the purpose of private study or research.
You may not further distribute the material or use it for any profit-making activity or commercial gain
You may freely distribute the URL identifying the publication in the public portal If you believe that this document breaches copyright please contact us providing details, and we will remove access to the work immediately and investigate your claim.
Downloaded from orbit.dtu.dk on: Jun 24, 2020
Metabolomics – an analytical strategy for identification of toxic mechanism of action
Skov, Kasper
Publication date:2015
Document VersionPublisher's PDF, also known as Version of record
Link back to DTU Orbit
Citation (APA):Skov, K. (2015). Metabolomics – an analytical strategy for identification of toxic mechanism of action. NationalFood Institute, Technical University of Denmark.

Metabolomics – An Analytical Strategy for
Kasper SkovPhD Thesis2015

1
Summary
Humans are exposed to chemicals from diverse sources such as foods, pharmaceuticals, cosmetics and the
air (Monosson 2005), which may affect human health, even causing serious disease or death (Nielsen et al
2010a). Toxicology is concerned with the study of toxic effects exerted by chemicals on a living organism,
but also associated to issues related to poisons, being it clinical, industrial, or legal.
Metabolism is the set of chemical reactions that allow an organism to maintain its functions, whereas
metabolites are its intermediates and products. The complete set of small molecule metabolites is referred
to as the metabolome and the comprehensive and quantitative analysis of all metabolites is denoted
metabolomics (Fiehn 2001). The effects of toxic compounds as physiological or chemical induced changes
in the mammalian body are reflected in the plasma metabolome.
In toxicology, compounds with an effect on hormone regulation have attracted much attention. These are
the so‐called endocrine disrupters which mimic natural endogenous hormones and are suspected to be
involved in the observed decreased fertility in Denmark over the last two decades. Since endocrine
disrupting chemicals (EDCs) have effects on humans at low concentration, one of the present challenges in
toxicology is to develop methods capable of measuring exposures and effects at the low end of the scale.
The aim of the present work was to scrutinize the impact toxic chemicals can have on the metabolome, in
particular EDCs at low, human relevant concentrations. In order to accomplish this, a sample preparation
technique suited to handle a wide range of metabolites in the plasma metabolome was developed. The
technique included sub‐fractionation by solid phase extraction into three sub‐samples. The resulting
method showed approximately 2.5 times more molecular features compared to that obtained if only
protein precipitation was applied. The performance of the method was investigated using plasma samples
from rats administered to the environmental pollutant perfluorononanoic acid (PFNA) and was applied in
the metabolome analyses throughout the thesis.
Humans are simultaneously exposed to multiple chemicals, many of which can be detected in human body
fluids; however, the consequences of low dose exposure to complex mixtures of chemicals are poorly
understood. By use of two omics approaches, metabolomics and transcriptomics, the effects on rats caused
by exposure to a 14‐compound mixture (Mix) ± PFNA were profiled. The applied technologies provided
complementary information allowing for a detailed analysis of the affected signalling pathways. Mix alone
caused reduced lipid concentration evident in plasma. The hepatic effects on lipid metabolism were mainly
driven by PFNA by activation of the PPAR receptors. This study verifies that a chemical mixture given at

2
high‐end human exposure levels can affect lipid homeostasis. In a follow‐up study on the importance of
exposure to complex real‐world mixtures, data suggested that mixtures of environmental chemicals at
doses approaching high‐end human exposure levels can cause a hormonal imbalance, with increased
plasma corticosterone levels, and disturb steroid hormones and their regulation.
To evaluate effects caused by low‐dose exposure, data from the PFNA study was used alongside data from
a bisphenol A study. Plasma from pregnant rats and their offspring exposed to bisphenol A at an exposure
concentration of 25 and 250 µg/kg bw/day were analyzed. A decrease in monoacylglycerol(18:0) and
monoacylglycerol(16:0) in the mother animals was observed, while for the male offspring, increase in lyso‐
phosphotidylcholine plasma concentration was observed.
The developed platform detects three main groups of metabolites; a phospholipid fraction, a lipid fraction
and a polar fraction and reveals changes in the metabolome that could not be foreseen using regular
toxicological approaches. The study presents a new approach which improves the basic biochemical
understanding of toxic exposures to the rat. From this data it is feasible not only to determine the endpoint
of the toxic exposure, but to suggest biochemical precursors to the exposure.

3
Resumé(InDanish)
Mennesket er eksponeret for kemikalier fra mange forskellige kilder, blandt andet mad, medikamenter,
kosmetik og atmosfærisk luft (Monosson 2005). Mange af disse kemikalier kan påvirke menneskets
helbred, i nogle tilfælde påføre store skader og i værste fald slå folk ihjel (Nielsen et al 2010a).
Toksikologien er den videnskab der beskæftiger sig med studiet af kemikaliers toksiske effekter på den
levende organisme. Den er også associeret til spørgsmål relateret til giftstoffer, vedrørende kliniske,
industrielle eller juridiske problemer.
Metabolisme er det sæt af kemiske reaktioner som er essentielle for at opretholde organismens funktioner,
mens metaboliter er dens intermediater og produkter. Den samlede mængde af metaboliter benævnes
metabolomet og den omfattende og kvantitative analyse af alle metaboliter kaldes metabolomics (Fiehn
2001). Ændringer forårsaget af stoffer der fysiologisk eller kemisk påvirker den menneskelige krop kan
observeres i plasma metabolomet.
Stoffer, der påvirker hormonreguleringen, har fået stor opmærksomhed i toksikologien. Disse stoffer er
såkaldte hormonforstyrrende stoffer, som efterligner de naturlige hormoner. I Danmark er der observeret
en nedsat fertilitet over de sidste to årtier, og det menes at de hormonforstyrrende stoffer kan være
medvirkende til denne nedgang. Eftersom de hormonforstyrrende stoffer har effekt på mennesket ved lav
koncentration er en af de nuværende udfordringer i toksikologien, at udvikle metoder til måling af
ændringer ved eksponering ved lave koncentrationer.
Formålet med denne afhandling var at undersøge påvirkningen af toksiske kemikalier på metabolomet, især
med fokus på de hormonforstyrrende stoffer ved lav human relevant koncentration.
For at kunne opfylde dette formål, blev en procedure, som var baseret på en sub‐fraktionering udført ved
hjælp af solid‐fase ekstraktion, udviklet til analyse af et bredt udsnit af metaboliter. Metoden kunne
detektere 2,5 gange flere molekylære features end en metode der kun anvendte protein fældning, og blev
testet i et rotteforsøg, hvor dyrene var eksponeret til et miljøkemikalium, perfluornonanone syre (PFNA).
Denne fremgangsmåde blev anvendt i metabolom analyserne i hele denne afhandling.
Mennesket er påvirket af mange kemikalier hver dag, hvoraf nogle kan blive detekteret i kropsvæsker. Men
der er mangel på forståelse for, hvordan komplekse blandinger af disse stoffer vil påvirke os. For at
undersøge dette brugte vi en dels metabolomics og dels transcriptomics tilgang for at undersøge effekten
af PFNA med og uden en mix af 14 relevante kemikalier. Disse to fremgangsmåder blev brugt i kombination
til at analysere en mulig påvirkning af biologiske pathways. Blandingen viste effekt på fedtstofskiftet

4
udtrykt ved en nedgang i plasma fedtstofferne, mens effekterne på leveren primært var fra PFNA ved
aktivering af PPAR receptorerne. Studiet viste således at kemikalieeksponering, ved koncentrationer
relevante for mennesker, kan påvirke fedtstofmetabolismen. Derudover viste forsøget at lav dosis kan
påvirke hormonniveauerne i blodet hos mennesket, ved en forøget corticosterone plasma koncentration,
samt reguleringen af disse.
For yderligere at kunne evaluere lavdosiseksponering blev data fra PFNA studiet anvendt sammen med
data fra et bisphenol A studie. Gravide rotter blev eksponeret til 25 og 250 µg/kg/dag, og blodet fra mødre
og afkom blev analyseret. En nedgang i monoacylglycerol(16:0) og monoacylglycerol(18:0) blev observeret i
mødrene, mens det mandlige afkom viste et øget niveau af lyso‐phosphocholine.
Den udviklede analytiske platform detekterede således tre grupper af metaboliter; fosfolipider, lipider og
en polær fraktion. Platformen viste ændringer som ikke ville være fundet ved regulære toksikologiske
studier. Studierne i denne afhandling præsenterer en ny strategi til at evaluere biokemiske ændringer i
rotter efter toksisk eksponering. Data fra dette studie viser, at det ikke kun er muligt at påvise
toksikologiske endpoints, men muliggør også at observere biokemiske forstadier, ”biomarkører”, for
toksikologiske eksponering.

5
ContentsSummary ............................................................................................................................................................ 1
Resumé (In Danish) ............................................................................................................................................ 3
Preface ............................................................................................................................................................... 7
List of publications ............................................................................................................................................. 8
List of Abbreviations .......................................................................................................................................... 9
Introduction ..................................................................................................................................................... 10
Part I: Toxicology and metabolomics .............................................................................................................. 13
1.1 Toxicology .............................................................................................................................................. 13
1.2 Metabolism and metabolites ................................................................................................................ 15
1.3 Systems biology ..................................................................................................................................... 16
1.4 Metabolomics ........................................................................................................................................ 17
Part II: Analytical challenges in metabolomics ................................................................................................ 20
2 Strategies in metabolomics ...................................................................................................................... 20
2.1 The metabolomics platform .................................................................................................................. 20
2.2 Samples .................................................................................................................................................. 20
2.3 Plasma analysis ...................................................................................................................................... 21
2.4 Targeted versus non‐targeted metabolomics ....................................................................................... 22
2.5 Instrumental setup ................................................................................................................................ 23
2.6 Data processing and statistical methods ............................................................................................... 25
2.7 Challenges with interpreting metabolomics data ................................................................................. 27
3 Part III: Research objectives and biological questions being asked ............................................................. 29
4 Part IV: Material and methods ..................................................................................................................... 30
4.1 Sample collection .................................................................................................................................. 30
4.1.1 PFNA experiment ............................................................................................................................ 30
4.2.1 BPA experiment .............................................................................................................................. 30
4.1.3 Selenium experiment ..................................................................................................................... 31

6
4.2 Sample preparation ............................................................................................................................... 31
4.3 Sample analysis ...................................................................................................................................... 32
4.3.1 High pressure liquid chromatography ............................................................................................ 32
4.3.2 Mass spectrometry ......................................................................................................................... 33
4.3.3 NMR analysis .................................................................................................................................. 34
4.3.4 Gene analysis .................................................................................................................................. 34
4.4 Identification processes ......................................................................................................................... 34
4.5 Metabolite identification ....................................................................................................................... 35
5 Part V: Results and Discussion of individual projects ................................................................................... 38
5.1 Method paper ........................................................................................................................................ 38
5.2 PFNA papers .......................................................................................................................................... 41
5.3 Further testing of the usefulness of metabolomics in low dose toxicity experiments ......................... 47
Part VI: Discussion ........................................................................................................................................... 50
6.1 Observed changes in the lipid fraction .................................................................................................. 50
6.2 Instrumentation ..................................................................................................................................... 51
6.3 Low dose exposure: adverse or biochemical effect? ............................................................................ 52
7 Part VII: Conclusion ....................................................................................................................................... 54
References: ...................................................................................................................................................... 56
Appendix .......................................................................................................................................................... 67
Appedix I: Exposure levels ........................................................................................................................... 67
Appendix II: Mass spectrometer stats ......................................................................................................... 69
Appendix III: NMR data................................................................................................................................ 71
Publications: .................................................................................................................................................... 77

7
Preface
This PhD thesis is submitted as partial requirements for the attainment of my PhD degree. The research has
been conducted between 15th of December 2011 and 15th of December 2014. The animal studies have been
carried out in the Division of Toxicology and Risk Assessment, DTU Food and the metabolic profiling was
performed in Division of Food Chemistry, DTU Food. The NMR experiments have been carried out in
Canada, in the Wishart Group at University of Alberta, Edmonton, Alberta, Canada.
This project would not have been possible without the many people who contributed their time and
expertise. My supervisors have guided me throughout and helped me to grasp what it means to be a
scientist. Therefore, a special thanks to my supervisors, Niels Hadrup, Jørn Smedsgaard and Henrik Lauritz
Frandsen; thank you for your guidance, for aiding in shaping the study and for all the scientific discussions.
Thanks to the laboratory technicians for assisting in purchasing chemicals, help running of the laboratories
and of course, their technical assistance. Thank you Maud Bering Andersen, Liljana Petrevska, Lis
Abildgaard and Lene Gram.
For helping me understand toxicology: Thanks to Ulla Hass, Sofie Christiansen, Anne Marie Vinggaard and
Camilla Taxvig. To Kristine Kongsbak; thank you for the fruitful scientific talks and cooperation. Thank you
Terje Svingen for proof reading.
A special thanks to Mike Wilson, for assisting in R scribing, Rupa Mandal for use of the lab, Ramanarayan
Krishnamurthy for GC analysis and Philip Liu for training me in NMR sampling.
And a thank you to my family, Nina Kimie Lüders Sørensen, Liselotte Skov and Ole Hvilsted Olsen for
assisting in the process and to help me keep up the work throughout the PhD work.
Kasper Skov

8
Listofpublications
Paper I Skov, K., Hadrup, N., Smedsgaard J., Frandsen H., 2015. LC–MS analysis of the plasma
metabolome—A novel sample preparation strategy. Journal of Chromatography B, 978‐979, pp.83–88.
Paper II Hadrup, N., Petersen, M., Skov K., Hansen, N.L., Berthelsen, L. O., Kongsbak K., Boberg, Julie,
Dybdahl, M., Hass, U., Frandsen, H., Vingaard, A. M. Perfluorononanoic acid in combination with 14
chemicals exerts low‐dose mixture effects in rats. Archives of Toxicology, Published online.
Paper III Skov, K., Kongsbak, K., Hadrup, N., Frandsen, H., Svingen, T., Smedsgaard, J., Audouze, K., Eklund,
A. C., Vinggaard, A. M. Exposure to perfluorononanoic acid combined with a low‐dose mixture of 14
human‐relevant compounds disturbs energy/lipid homeostasis in rats. Metabolomics. Published online
Paper IV Skov K., Hadrup N, Axelsted M., Christiansen S., Vingaard A.M., Haas U., Frandsen H. Effect of BPA
on rats and their offspring – a metabolic profiling of low dose exposure to BPA, Manuscript in progress
Paper V Hadrup N., Löschner K.2, Skov K., Ravn‐Haren G., Larsen E.H.2, Mortensen A., Lam H.R., Frandsen H.
Metabolite profiling of urine from rats dosed with Selenium nanoparticles or Selenium ions; Manuscript in
progress

9
ListofAbbreviations
ANOVA
Analysis of Variance
BPA Bisphenol A
DG Diacylglycerol
EDC
FDR
Endocrine Disrupting Chemical
False Discovery Rate
GC
GD
Gas Chromatography
Gestation day
HDL High Density Lipoprotein
HILIC Hydrophilic Interaction Liquid Chromatography
HPLC High Pressure Liquid Chromatography
LC Liquid Chromatography
LDL Low Density Lipoprotein
LOAEL Low observed adverse effect level
Lyso‐PC Lyso‐phosphatidylcholine
MG Monoacylglycerol
MS Mass spectrometry
NMR Nuclear Magnetic Resonance
NOAEL No observed adverse effect level
PC Phosphotidylcholine
PCA Principal component analysis
PFNA Perfluorononanoic acid
PLS Partial Least Square
PLS‐DA
PSU
Partial Least Square‐Discriminant Analysis
Polysulfone
qTOF Quadrupole Time‐of‐Flight
SPE
SPF
Solid Phase Extraction
Specific pathogen‐free
TAG Triacylglycerol
UHPLC Ultra High Pressure Liquid Chromatography

10
Introduction
Humans are exposed to chemicals from various sources including foods, pharmaceuticals, cosmetics and
the air (Monosson 2005). Such exposure can lead to toxic effects resulting in compromised health and even
serious disease or death (Nielsen et al 2010a). The branch of science typically concerned with these toxic
effects is ‘toxicology’, a broad terminology encompassing all aspects of how living organisms are adversely
affected by exposure to chemicals and poisons, also extending to associated problems such as clinical,
industrial, or legal aspects. The prediction of toxic effects and pre‐disease determinations are challenging
and often time‐ and resource‐consuming. Therefore new and more efficient techniques than what is
presently available are needed.
Although toxicology deals with the potential effects on all types of tissues and organs, in this thesis the
focus is on disruptions to hormone regulation in mammals. Compounds that exert such effects are referred
to as endocrine disrupters, or endocrine disrupting chemicals (EDCs) and typically mimic or interfere with
the natural (endogenous) hormones (Vandenberg et al 2012). The impact of EDCs has been widely studied
and implicated as causative of a broad range of reproductive dysfunction phenotypes (Skakkebaek et al
2006). As EDCs can have effects on humans at low concentrations, a particular challenge in toxicology is to
develop methods to detect more subtle effects, both at the molecular and physiological levels. In fact,
effects of low dose exposure can be difficult to establish, as it causes changes to hormone levels and
metabolism only observed at the metabolite level and not detectable by traditional toxicological endpoints.
Therefore, to better understand the real consequences of EDCs, also taking into account less adverse
effects that can later contribute towards adverse health effects, new and improved technologies are
necessary to monitor toxic chemicals.
Significant advances in systems biology over the last couple of decades offer unparalleled opportunities to
unravel some of the complex mechanisms behind the toxic effects caused by chemical exposure. The
‘omics’ strategies, including genomics, transcriptomics, proteomics, metabolomics, are now routinely
applied across biological disciplines, with the combination of two or more ‘omics’ approaches becoming
increasingly more popular.
The metabolism is the set of chemical reactions that allow an organism to maintain its functions and
metabolites being its intermediates and products. The complete set of small molecule metabolites is
referred to as the metabolome and the comprehensive and quantitative analysis of all metabolites is
denoted metabolomics (Fiehn 2001).

11
Analysis of metabolism can give a more mechanistic insight into how specific compounds act and affect a
biological system, including the human body. High resolution mass spectrometry has become the tool of
choice to study metabolism and metabolites, not least due to its very high sensitivity and potential to
detect a spectrum of metabolites, but also its ability to scrutinize the impact of toxic compounds on
metabolites, allowing for determination of interaction.
During the last two decades the application of metabolomics has significantly changed the strategy of
metabolic studies. This change has been very much driven by developments in mass spectrometry, in
particular electrospray ionization MS and affordable high resolution mass analyzers. Today the methods of
choice are liquid chromatography mass spectrometry (LC‐MS), gas chromatography mass spectrometry
(GC‐MS) and nuclear magnetic resonance (NMR) (Robertson et al 2011). Using metabolomics to study the
effects on metabolism by disease or external (environmental) factors has given new insights into diseases
and effects of toxic exposures in humans (Souverain et al 2004; Psychogios et al 2011). Combined with
other strategies such as transcriptomics, genomics and proteomics, metabolomics has proven a powerful
strategy to discover modes‐ and mechanisms‐of‐action underpinning various pathologies. Metabolomics is
also relatively low‐cost and fast, hence a good tool to analyze larger quantities of samples (Gomase et al
2008).
The aim of this thesis was to examine what impact EDCs can have on the metabolome, particularly at low
levels of exposure relevant to real human exposures. A main objective was to develop a method capable of
analyzing a wide range of compounds in the plasma metabolome. This was achieved by the development of
a new sample preparation technique which resulted in acquisition of data on a larger number of analytes
compared to conventional techniques. Also, the metabolomics approach was compared to a more
traditional toxicology approach in order to evaluate whether the new approach performed better than
traditional toxicology protocols. Furthermore, a hypothesis that the metabolomics approach could reveal
better mechanistic insights, and thus a better understanding of low‐dose exposure effects, a lower dose of
exposure than traditional protocols was tested. For one study the systemic change caused by exposure to a
toxic chemical was analyzed by transcriptomics in combination with the results obtained by the
metabolomics analysis.
This thesis focused on developing an improved analytical platform for the analysis of plasma metabolites.
The new method resulted in approximately 2.5‐times more features than a protein precipitation approach.
The method was tested on animals exposed to perfluorononanoic acid (PFNA) for 14 days to evaluate if it
was capable of determining metabolic changes following low‐dose mixture effects in rats. Animals were
first tested by a classical toxicology approach, studying effects on organs, bodyweight and blood

12
parameters. Then secondly by metabolomics and transcriptomics approaches to determine if the method
revealed similar results. Changes in plasma hormone levels were observed by the classical approach and
also corroborated by the metabolomics analysis of the blood plasma. Furthermore, the highest
concentration of PFNA‐exposure caused hepatic steatosis, which could also be predicted from the
metabolomics and transcriptomics data, but with the latter approach also revealing additional insights into
affected regulatory pathways. To further challenge the new strategy, two more low‐dose exposure
experiments (mothers and pups exposed to a low dose of bisphenol A (BPA)) were analyzed. Here, we
found changes in both the mother animals exposed directly to BPA and in the pups exposed via the
placenta and the mother milk. Thus low‐dose exposure could indeed be detected in the plasma
metabolome and hence be used to reveal additional information regarding effects of toxic exposures.
Before discussing the results of the individual studies undertaken during this project, a further overview of
the literature will be presented. Part I will give a general introduction to toxicology and metabolomics,
including an overview of the literature on the application of metabolomics approaches in toxicology. Part II
outlines the analytical methods that were applied to analyze the metabolomes. Furthermore, the analytical
strategies used in metabolomics, mostly targeted and non‐targeted metabolomics, will be discussed, finally
including a short section describing the samples of interest and how they were prepared.
The rest of the thesis contains materials and methods, a compilation of result, a section reporting results
from the individual experiments, and finally; a summary discussion on low‐dose exposure effect on animals
and humans.

13
PartI:Toxicologyandmetabolomics
1.1Toxicology
Toxicology is the branch of biology concerned with the study of adverse effects of chemicals on living
organisms (Nielsen et al 2010b). As mentioned above, toxicology is a science that deals with poisons and
can be described as the study of changes in the physiology or metabolism as a response to a toxic chemical.
The conventional toxicology approach is based on analysis of the effect of a single chemical at increasing
doses to detect possible adverse effects in an organism (Monosson 2005). Within toxicology the “No
Observed Adverse Effect Level” (NOAEL: the highest concentration of compound with no adverse effect)
and the “Lowest Observed Adverse Effect Level” (LOAEL: the lowest concentration of a compound which
shows an adverse effect) (Nielsen et al 2010b) are terms used to characterize the impact of a toxic chemical
evaluated by morphological endpoints, see Figure 1. Traditional methods are based on in vivo studies e.g. in
rats in combination with in vitro studies e.g. cellular studies (Klaassen 2008; Taxvig et al 2011). Toxicokinetic
profiles of chemical substances are usually obtained through in vivo studies and these often are
supplement by in vitro studies focusing on e.g. metabolism (Klaassen 2008). The in vivo experiments are
conducted at different time points e.g. seven days to reveal acute effects, e.g. 90 days to reveal long term
effects and chronic effects by exposing the animals for at least 180 days (Frazier 1991; Nielsen et al 2010b).
Figure 1 The effect of a single toxic chemical at different doses is illustrated in the green curve . The NOAEL and LOAEL doses are indicated. As indicated, cellular changes increase with an increasing dose. The effect of multiple chemical exposure is illustrated in the blue curve, where the animal has been treated with a dose consisting of multiple compounds resulting in a decrease in LOAEL (Nielsen et al 2010b).

14
Conventional toxicology studies are performed at high concentrations (see Figure 1) and aims to 1) identify
toxic effects, 2) identify morphological changes in the exposed organism, and 3) to establish a NOAEL.
Recently, it has been suggested that toxic compounds might interact. Figure 1 shows an example of the
effect of mixtures of toxic compounds which cause an effect different from that observed from a single
compound. Three main mechanisms of interaction have been suggested, namely synergism, antagonism
and addition (Crofton et al 2005; Moser et al 2006; Frische et al 2009; Christiansen et al 2009). With
synergism is understood that two or more compounds interact to cause an effect larger than the sum of
single‐compound effects; 1+1 > 2. Antagonism means that compounds counteract each other’s effects so
that the combined effect is reduced; 1+1 < 2. Addition is the simple scenario where the effects of the single
compounds contribute towards the overall effects as mere sums of each other; 1+1 = 2 (Crofton et al 2005;
Moser et al 2006; Frische et al 2009).
As mentioned above, sources of toxic chemicals are numerous, for instance air pollution, occupational
exposure and food. Chemicals may include pesticides, medical residues, cardboard materials, thermal
printings, plastics, surfactants and many more (Monosson 2005; Crofton et al 2005; Lau 2012). The effect
exerted by these compounds can differ significantly between species, sex, doses, time of exposure, and a
variety of other factors (Colborn et al 1993; Evans et al 2004). Furthermore, two individuals may react
differently to the same toxic chemical due to genetic polymorphisms.
A particular group of compounds which has received much attention is EDCs (Kozlowska‐Tylingo et al
2010). They are compounds that can mimic endogenous steroid hormones (Connolly et al 2011). There is
evidence suggesting that EDCs affect wildlife and humans by causing reproductive, developmental, or
metabolic disorders (Colborn et al 1993; Evans et al 2004; Nicolucci et al 2011; Tse et al 2013). An EDC was
defined by the U.S. Environmental Protection Agency as “an exogenous agent that interferes with
synthesis, secretion, transport, metabolism, binding action, or elimination of natural blood‐borne
hormones that are present in the body and are responsible for homeostasis, reproduction, and
developmental process” (Program and Agency 2001). The potential effects of EDCs have been studied for
more than two decades (Skakkebaek et al 2006) and it is believed that they can affect embryogenesis, fetal
and neonatal development, as well as adult function (Colborn et al 1993).
In 2006, Skakkebaek and co‐workers reported a decline in semen quality, and increase in hypospadias and
testis cancer in Denmark during the last two decades, which could be associated with exposure to EDCs or
other environmental chemicals (Sharpe and Skakkebaek 2003; Skakkebaek et al 2006). EDCs have been
shown to affect human biology at low concentrations of exposure (Christiansen et al 2009; Axelstad et al

15
2011). In 2001 a group of scientists working for the national toxicology program defined low‐dose exposure
as 1) biological changes occurring at doses relevant to human exposure and 2) doses at lower concentration
than used in standard testing protocols (Program and Agency 2001; Tse et al 2013; Christiansen et al 2014).
A low dose exposure might lead to a different metabolic (toxic) response than seen as the normal s‐shaped
response curve, using doses up to maximum tolerated dose, as illustrated in figure 1. This phenomenon is
called hormesis; where compounds show different effects at low concentrations compared to those at high
concentrations (Program and Agency 2001). An example of hormesis is alcohol where it is believed that low
daily doses may have beneficial effects, while high daily doses are unhealthy or even fatal.
In toxicological studies where rodents are exposed to low doses and up to maximum tolerable doses, toxic
effects are often only detected at the higher doses. Below the NOAEL, no effects are seen. Herein, we
applied a metabolomics approach to study EDCs in order to investigate whether changes to the
metabolome could be detected at lower doses than those causing toxic effects. Therefore, metabolism and
metabolites, systems biology, transcriptomics and metabolomics approaches will be briefly discussed
below.
1.2Metabolismandmetabolites
Metabolism encompasses all the chemical and biological reactions necessary to maintain the living state of
a cell or an organism. Compounds that potentially can cause an adverse effect can influence metabolism by
e.g. disrupting regulatory pathways, blocking receptors or interfere with enzymatic reactions (Nielsen et al
2010b). Metabolism is also responsible for the modification and excretion of toxic compounds.
Metabolites are low molecular weight intermediates and products of metabolism, and the complete set of
metabolites referred to the metabolome (Villas‐Bôas et al 2007). It is believed that there are approximately
1000 metabolites in E. coli (Bajad et al 2006). In humans, the number of endogenous metabolites are
estimated to be approximately 3000, present in concentrations ranging from picomolar to millimolar
(Büscher et al 2009). The human metabolome data base hosted by Wishart et al. currently has more than
40.000 entries and include both endogenic and foreign metabolites (Wishart et al 2007; Wishart et al 2009;
Wishart et al 2013).
In humans, food is absorbed by the intestine and transported through the blood to the target destination.
The non‐polar compounds are digested and converted into chylomicrons and transported through the
lymphatic system to the liver from where it is distributed throughout the body (Berg et al 2006). The polar
compounds such as free fatty acids are transported via serum albumin in the blood to reach their target
organs. The liver is main site of metabolism. The liver enzymatically regulates the level of lipids in the blood

16
and removes foreign compounds by enzymatic modification followed by excretion in the urine. The intake
of food and energy levels are regulated by enzymes. The concentrations of metabolites in the body are
closely regulated e.g. by enzymatic reactions. The regulation of transcription is partly regulated by the
concentration of metabolites, as depicted in Figure 2.
At the cellular level two types of metabolic reactions take place: anabolism (‘building up’) and catabolism
(‘breaking down’). Both reactions require countless chemical reactions. Anabolism requires energy for
building molecules, whereas catabolism releases energy as molecules are broken down. The citric acid cycle
– also known as the tricarboxylic acid (TCA) or Krebs cycle, is a catabolic reaction and is outlined below.
Figure 2 TCA cycle (Berg et al 2006). The blue arrows depict enzymes modifying the metabolites. As shown in the figure some enzymes are regulated by the concentrations of ATP, ADP, succinyl‐CoA and NADH. If ADP concentration is high it might suggest a lowering of ATP and therefore an increase in the TCA cycle to produce more ATP. In the contrary, a high ATP concentration will inhibit multiple enzymes to reduce the ATP production
The production of energy is tightly regulated by enzymes and the concentration of certain metabolites. A
high ADP concentration will therefore induce energy production in the TCA cycle while an increased ATP
concentration will inhibit multiple enzymes leading to a reduction in ATP production.
1.3Systemsbiology
Systems biology aims to answer biological questions by applying a more holistic approach than what is
done in more traditional reductionist approaches. It often combines traditional experimental technologies
with powerful computer‐based methodologies, which ultimately allows complex biological systems to be
studied closer to its native state. Figure 3 depicts the central idea; measurements of core components give

17
input to understanding aspects of changes within an organism (Palsson 2009; Snyder and Gallagher 2009).
To improve the understanding of how a given organism reacts to a xenobiotic, it is important to understand
as much as possible of the complete system; genome, transcriptome, proteome and the metabolome.
Figure 3 The classical central dogma used in systems biology. The connection between the DNA, proteins and metabolites (Palsson 2009; Snyder and Gallagher 2009).The genes are transcribed from DNA and controls the protein expression while the proteins are involved in the regulation of metabolites. Furthermore, the metabolites are feedback regulators for the gene and protein expression.
The relationship between the ‘omics’ strategies is that DNA is transcribed into mRNA (transcriptomics),
which is translated into proteins (proteomics), which is involved in the regulation of the metabolome
(metabolomics). Concentrations of metabolites are involved in the control of enzymatic activity and verse
visa. Furthermore, metabolites are involved in the regulation of transcription as well as translation of
mRNA. Determination of all parts of the central dogma could reveal a full picture of how the body reacts at
a given time point, though such measurements are close to impossible to conduct and furthermore if
possible the cost would still be extremely high.
1.4Metabolomics
The term metabonomics was introduced in 1999 by Jeremy Nicholson, Elaine Holm and John Lindon, who
defined the term as ”the quantitative measurement of time‐related multi‐parametric metabolic response
of living systems to pathophysiological stimuli or genetic modifications” (Nicholson et al 1999). A few years
later, Oliver Fiehn introduced the term metabolomics and defined it as ”the comprehensive and

18
quantitative analysis of all metabolites” (Fiehn 2001). An additional term, metabolic profiling, is also
occasionally used as a name for the strategy of analyzing the metabolome. However, the term
metabolomics is the predominant terminology. The objective of metabolomics is to determine the
metabolome; the complete set of smaller metabolites (typically below 1‐2 kDa) in a single organism (Oliver
et al 1998; Goodacre et al 2004; Brown et al 2005). Therefore metabolomics must be seen more as an
analytical strategy based on a comprehensive and quantitative analysis of all metabolites, than an analysis
in its own right, similar to genomics (Lu et al 2008; Psychogios et al 2011; Robertson et al 2011). In reality, it
is not possible to determine all sub‐parts of the entire metabolome in one analytical set‐up, hence a range
of analytical strategies are used, including metabolite profiling and target analysis. While the term
metabolomics is relatively new, the concept of metabolomics has been around for at least 2000 years as it
was believed in ancient China that there was a correlation between health and body fluids and in the
middle age ”urine charts” were used to diagnose health conditions (Lindon and Nicholson 2008). The main
indicators in these old “metabolic” studies was color, taste and smell of urine (Lindon and Nicholson 2008).
Mass spectrometry is the technique of choice for high throughput metabolomics (Feng et al 2008).
Although, as mentioned above it is not yet possible to measure every single metabolite with a single
analytical method (Shulaev 2006; Callahan et al 2009). A high throughput method for metabolome analysis
can reveal information not obtained by the other “omics” approaches and could very easily be applied due
to low cost (Gomase et al 2008). Furthermore, data obtained from metabolomics analyses are more
phenotypic (Gomase et al 2008) compared to transcriptomics and proteomics. The combination of DNA
sequencing, gene expression analysis, protein analysis and metabolite analysis could improve our
understanding of complex systems, much more than the application of single method only. Analysing all
parts simultaneously would possibly reveal a systemic change not observed using a single analytical
method, ultimately increasing the likelihood of determining mode of action of toxic chemicals. However,
many of these technologies are still very costly, at least if several are to be employed at the same time
(Ramirez et al 2013). Also, current available technologies for metabolomics does not allow for an analysis of
the complete metabolome.
The transcriptome and proteome have been analyzed in order to understand the effects of toxic
compounds on gene and protein regulation (Wisselink et al 2010).

19
1.5Useofmetabolomicsconceptsintoxicology
In recent years, new techniques have been introduced to obtain more knowledge about the toxic effects of
a compound. Concepts such as transcriptomics, proteomics and metabolomics are applied to clarify the
mode of action of toxic chemicals (Monosson 2005). In toxicology, metabolomics approaches have been
used over the last 15 years (Robertson et al 2011). The observation of metabolic changes can help
understand effects caused by exposure to toxic compounds. At NOAEL, a metabolomics approach was
shown to be more effective than conventional toxicology approaches in 15.4 % of cases, while in 70 % of
cases the findings were similar (van Ravenzwaay et al 2014). Interestingly, it has been shown that changes
induced by toxic compounds can be detected in the metabolome at NOAEL level e.g. drug induced changes
in the gut microbiota and drug induced choline excretion into urine (Flores‐Valverde et al 2010; Kozlowska‐
Tylingo et al 2010). The detection of perturbations in the metabolome following toxic exposure has been
achieved on multiple different compartments of the human such as organs, blood and urine. However, of
primary interest is blood and urine (Robosky et al 2002). Examples include the determination of blood
parameters such as changes in cholesterol levels, low‐density and high‐density lipoprotein levels (Seidlová‐
Wuttke et al 2005; Hu et al 2010).
In toxicology, the focus of using metabolomics approaches to reveal toxic effects has shifted towards a
more mechanistic‐based approach, including determination of biomarkers for specific diseases (Robertson
et al 2011). Analysis of the metabolome offers many advantages over conventional analytical methods for
evaluating toxicity. “Since animals are sampled using a peripheral biofluid like urine, serial evaluation of the
metabolic consequences of external stimuli such as the onset and regression of toxicity can be obtained
from a single animal” (Robosky et al 2002). Metabolomics approaches have been used in the toxicology
community to determine biomarkers of both renal (Sieber et al 2009) and hepatic toxicity (Antoine et al
2009; McBurney et al 2009). Furthermore, metabolomics approaches show great perspectives for analysis
of low‐dose exposure to toxic chemicals (Ramirez et al 2013). Hence, low‐dose exposure to a compound
such as BPA has been shown to induce changes of the polar fraction of compounds in the plasma (Zeng et
al 2013) and to induce changes in the endoplasmic reticulum response in cellular cultures. Similarly,
phthalates have also been shown to have endocrine disrupting effects at low‐dose exposure, inducing anti‐
androgenic effects in male rats (Christiansen et al 2014).

20
PartII:Analyticalchallengesinmetabolomics
2Strategiesinmetabolomics
As discussed in section 1.4, metabolomics is a strategy used to determine the metabolome: all low
molecular weight metabolites in a given sample at a specific time point (Fiehn et al 2007). This is an
enormous task from an analytical perspective. The methodology is applied to mammals, plants, cell
cultures and environmental systems.
The basic workflow of metabolomics employs a circular strategy (see Figure 4) where analytical chemistry is
tightly integrated with biochemistry and informatics. The first step involves sample collection, quenching to
stop all biochemical processes (if needed) and preparation of sample to match the subsequent analysis
discussed further in section 2.2 and 2.3. The second step involves a chemical analysis to determine the
metabolites in a sample by means of application of various analytical methodologies discussed in section
2.5. Subsequently, chemometrics is applied to classify samples, reveal differences between samples and to
identify potentially relevant biomarkers, as discussed in section 2.6.
Figure 4 The paradigm in metabolomics. Samples representing the specific study are collected, quenched and prepared. Following the sample preparation they are analysed e.g. by LC‐MS. Chemometrics tools are applied to locate metabolites expressed differently in the samples and these are attempted identified by e.g. accurate mass. From the identified metabolites and pattern of metabolites the goal is to achieve understanding of the metabolic effects.
2.1Themetabolomicsplatform
To create a platform for analysis of the metabolome, many aspects have to be considered. A general
outline of the platform is illustrated in Figure 4. Urine or blood would be biological samples of choice, as
they are quite accessible. Then decisions on how to prepare the samples must be considered. Finally, a
choice of analytical instrumentation and data analysis method has to be made. For all of these steps there
are pitfalls and problems, which will be discussed in the following sections.
2.2Samples
Metabolomics has been applied to all types of body fluids, tissues and organs, including blood (serum and
plasma), urine, feces, liver, skin and more (Souverain et al 2004; Psychogios et al 2011). Urine has been one
of the most preferred samples due to the ease of collection, the stability of the samples, and because urine
Samples Analysis Chemometrics Identification Understanding

21
reflects body excretion (the end‐point of metabolism) (Zhang et al 2012b). Blood is not as easily accessible
as urine, but nevertheless often used as it more accurately depicts the metabolic state of the body, e.g. by
including temporal insight into the dynamic process of metabolism. On the analytical end, blood is also
slightly more complex due to the large number of metabolites present, blood cells and proteins, as well as
wide range in concentration and polarity of the metabolites (Dunn and Elis 2005; Psychogios et al 2011;
García‐Sevillano et al 2014). Tissues are more complicated, not least due to the fact that sampling normally
involves an invasive procedure, e.g. through biopsies or recovery of cerebroventricular fluid (Tokushige et
al 2013).
An additional complication when analyzing living organisms, or samples obtained from living organisms, is
that the enzymatic systems need to be stopped to achieve a snapshot picture of the metabolome. The
process employed to ‘freeze’ metabolism in time is referred to as quenching. For microorganisms it is very
important to quench metabolism, as they are very easily stressed and the metabolitic concentration can
change rapidly upon stress (Villas‐Bôas et al 2005). For plasma samples, storage at ‐80OC will arrest the
enzymatic reactions, whereas protein precipitation will denature the enzymes.
2.3Plasmaanalysis
Blood is the main transport medium of metabolites in the body. Hence, the plasma metabolome holds
comprehensive information about the status of the various organs, cells and their regulation (Psychogios et
al 2011). Plasma is obtained from blood samples by addition of anti‐coagulants, followed by simple
centrifugation and removing or decanting of the most buoyant (non‐cellular) portion (Psychogios et al
2011). Plasma contains a significant chemical variety of metabolites from proteins and peptides,
carbohydrates, lipids, nutrients, electrolytes, organic waste products from metabolism to a variety of small
organic molecules (Psychogios et al 2011; Tulipani et al 2013). This chemical diversity of metabolites is by
far the largest challenge in plasma analyses (Souverain et al 2004). Furthermore, a substantial number of
metabolites in the body have the same exact elemental composition. Therefore, it is difficult to segregate
and identify these metabolites by for instance mass spectrometry.
Many different analytical strategies have been used (Psychogios et al 2011) to gain access to the plasma
metabolome, typically by removing some of its components in order to achieve good chromatographic
separation and sensitive mass spectrometric detection. A simple cleanup method involves precipitation of
proteins with an organic solvent e.g. methanol, perchloric acid and acetonitrile (Souverain et al 2004). It has
been suggested that three volumes of ice cold acetonitrile per plasma volume is the best solvent for protein
precipitation (Gage and Stopher 1998; Souverain et al 2004; Michopoulos et al 2010; Tulipani et al 2013).
The combination of protein precipitation with liquid/liquid extraction has been done with success: Bird et

22
al. used hexane to extract lipids after protein precipitation, while Ravenzwaay et al. used a mixture of
ethanol/dichloromethane with water to separate the polar and non‐polar fraction (Bird et al 2011; van
Ravenzwaay et al 2014). As liquid/liquid extractions have been used for decades, a variety of different
solvent combinations have been proposed (Takatera et al 2006; Sandra et al 2010; Ferreiro‐Vera 2012).
An alternative to liquid/liquid extraction is solid phase extraction (SPE), using a solid phase to retain or
remove the compound of interest. As suggested by Tulipani et al. SPE can be used to remove phospholipids
after protein precipitation to increase the information of the remaining metabolites (Tulipani et al 2013).
This effect is due to the fact that phospholipids are extremely easy to ionize in electrospray mass
spectrometry, and will therefore give a significant bias towards phospholipids (matrix like effect). Removing
these will most likely enhance the determination of the remaining metabolites (Ferreiro‐Vera 2012;
Tulipani et al 2013). One of the challenges in analyzing more complex samples such as plasma, is the wide
range in the concentration the metabolites which goes from picomolar to millimolar (Psychogios et al
2011). For the purpose of identifying all metabolites in plasma, purification or cleanup of the plasma
samples might be necessary. As described, a simple approach to remove proteins, or a more complex
approach using SPE or liquid/liquid extraction, can be used. However, each will have advantages and
disadvantages. For SPE purification, it is possible to selectively isolate one specific class of compounds,
though with the risk of losing some of the analytes of interest. The simple sample preparation will have the
advantages that most of the compounds of interest will be preserved and that steps required for the more
complicated purification steps might change the compound concentration of the sample. The disadvantage
of the simple sample preparation is that some of the metabolites might be lost in the analysis of the sample
due to e.g. ion suppression. A purification step of a complex sample can be a good choice to detect possible
changes in the organism though some information might be lost due to the purification process.
2.4Targetedversusnon‐targetedmetabolomics
Broadly speaking, two different approaches are used when evaluation toxicity by metabolomics: i) a
targeted approach that aims to determine a preselected set of metabolites and ii) a non‐targeted approach
that aims to determine a broad range of metabolites. In both cases it is highly desirable to do a relative
quantification of the metabolites. Since targeted metabolomics focuses on a selected class of metabolites,
it allows for a more elaborate sample preparation, including up concentration using e.g. SPE, liquid‐liquid
extraction or derivatization to achieve a high sensitivity approaching 1 pM for some metabolites (Wishart
2010). The non‐targeted approach is normally based on a screening or fingerprinting strategy where all
detectable metabolites are considered. This could involve a crude extraction procedure followed by
injecting the extract directly in a mass spectrometer or rough LC‐MS techniques (Robertson et al 2011).

23
While the non‐targeted metabolomics approach may reveal more information from each sample, the
detection limit is far higher than that of the optimized target approach (100‐200 nM according to Wishart
2010). In both cases, it is critical to note that the metabolome data obtained depends on the applied
analytical procedure unless a validated quantitative target approach is employed. The non‐targeted
metabolomics approach presents a complex fingerprint of the sample that can be efficiently used to classify
samples. However, in the non‐targeted approach it can be difficult to classify an identified metabolic profile
(García‐Sevillano et al 2014), as the differences usually are small compared to major component (e.g.
dominant primary metabolites). In the targeted approach, selected sets of metabolites are determined,
with increased sensitivity and also allow for quantification. However, the most pronounced disadvantage
for targeted metabolomics is that only known metabolites are detectable (Ebbels and Cavill 2009;
Robertson et al 2011).
2.5Instrumentalsetup
Several different analytical methodologies have been used to analyze metabolomes, including NMR, LC‐MS,
GC‐MS and CE‐MS. NMR has been applied in metabolomics for measuring polar compounds such as amino
acids and organic acids. Each of the three methods, NMR and LC‐MS or GC‐MS, have inherit advantages and
disadvantages and neither method can cover analysis of the full metabolome (Brown et al 2005;
Psychogios et al 2011). Therefore, data obtained by metabolomics is dependent on methodology and data
cannot be directly compared across methodologies.
The primary use of NMR has been to analyze proton spectra, although methods analyzing C13 at natural
abundance or enriched has also been applied (Robertson et al 2011). NMR is a strong analytical tool as it
can quantify many metabolites during a single analytical run. NMR has some unique advantages such as
being non‐destructive and non‐biased, as well as offering easy quantification (Wishart 2008). Moreover, it
provides molecular structures, thus giving certainty in the identification of metabolites as compared to
mass‐based identification. One drawback is the fitting of overlapping peaks, though recent research have
developed peak fitting for library searches (Wishart 2008). Furthermore, NMR yields relatively low
sensitivity and large sample sizes are needed, typically 500 µl for plasma (Wishart 2008; Lu et al 2008).
GC‐MS has been used in metabolomics to analyze multiple compounds, from sugars to lipids. GC‐MS relies
on electro impact ionization that breaks the analyte into many fragments, which can be used to identify the
metabolites. One drawback is the need to render all analytes more volatile, generally through
derivatization chemistry, introducing an additional analytical variable (Gomase et al 2008). Non‐volatile
compounds which do not generate derivatives, that are large and/or thermo‐labile, will not be detectable
in gas chromatography (Zhang et al 2012a). Derivatization of the compounds, however, has the advantage

24
that it can assist in structure identification. Furthermore, GC‐MS will yield the same spectra using different
instruments, such that databases can be created to conduct fast and accurate identification. GC‐MS has
been used since the early 1970’s and ever since the development of mass spectrometry the use of GC has
proven to be a strong tool for analysis of a wide range of compounds (Fiehn 2008). Hence, GC‐MS is a
widely used and powerful method, however only volatile metabolites can be analyzed without
derivatization (Gomase et al 2008; Zhang et al 2012a)
HPLC‐MS has been used to study metabolites such as organic acids, sugars, lipids and phospholipids among
others. HPLC‐MS is a strong tool that can analyze a wide polarity range. One major drawback is the
identification of unknown metabolites. Compared to GC‐MS where similar fragmentation patterns are
revealed, even on different instruments, HPLC‐MS does not necessarily show same MS pattern on different
instruments. Therefore, it can be difficult to identify the metabolite doing non‐targeted metabolomics.
Furthermore, ionization using electrospray ionization (ESI) will induce insource fragments along with
adducts which can impend the identification. On the other hand, such adducts and fragments can assist in
identifying pseudo‐molecular ions
High performance liquid chromatography (HPLC) is widely used, as it allows for a broad‐range screening of
analytes. The polar compounds (e.g. amino acids analyzed by HPLC) will normally be separated using
normal phase chromatography. The normal phase has a polar stationary phase retaining the polar
compounds. A method for analyzing very polar compounds such as adenosine‐triphosphate is available:
hydrophilic interaction chromatography (HILIC), which is a part of normal phase chromatography. In HILIC
the stationary phase is surrounded by a water layer which assists in the separation of polar compounds
(Alpert 1990; Ta et al 1994). For analysis of more non‐polar compounds such as lipids, reverse‐phase
chromatography is used. The reverse phase has a non‐polar stationary phase retaining non‐polar
compounds. The columns used for reverse phase chromatography is primarily C18 and C8 columns.
RP‐HPLC is an analytical technique with high reproducibility and sharp chromatographic peaks. RP‐HPLC
combined with mass spectrometry has been used to analyze a wide range of compounds e.g.
phospholipids, neutral lipids and many more. Ikeda et al analyzed triacylglycerols to increase understanding
of MSMS patterns of these. Others have used RP‐HPLC to investigate changes of the lipodome in diseases
and upon exposure to toxic chemicals. Ang et al analyzed day to day variation of phospholipids and free
fatty acids of human plasma (Ang et al 2012) while Garcia‐Sevilliano et al have shown changes in the
lipodome upon toxic exposure of inorganic arsenic (García‐Sevillano et al 2014). RP has a wide application
in metabolomics and can analyze a wide range of metabolites. One of the disadvantages is its poor
separation of polar compounds. However, this can be solved by HILIC which can separate and detect

25
extremely polar compounds (Bajad et al 2006; Callahan et al 2009). Using a HILIC system, one faces
problems with peak shape, ion suppression from the high ion contents in the solvent and poor
reproducibility.
In recent years two different kinds of analysis have been used, the 2 dimensional analytical approaches GC‐
GC and LC‐LC. GC‐GC is a powerful technique which has gained increasing attention over the last two
decades, and can provide greatly increased separation capacity, chemical selectivity and sensitivity for
complex sample analysis, bringing more accurate information about compound retention times and mass
spectra (Hu et al 2010). LC‐LC is a good separation technique for polar compounds as described by Klavins
et al where a combination of an anionic exchange and a porous graphic column to separate compounds
such as sugar phosphates and small organic compounds (Klavins et al 2014). The drawback of a LC‐LC
method is a significantly longer analytical runtime.
Today, MS is probably one of the most important analytical techniques within biotechnology, analyses
ranging from small volatile compounds, complex natural products and proteins to intact viruses (Villas‐Bôas
et al 2007). High resolution instruments can now possibly detect pM with a resolution of 100.000 and a
mass accuracy when internally calibrated at below 1‐2 ppm (Lu et al 2008). The use of high resolution mass
spectrometry increases the accuracy of the mass spectra, reducing the amounts of suggested metabolites
when conducting database searches. The high resolution mass spectrometer is useful for analysis of
complex samples due to resolution, accuracy and sensitivity (Moco et al 2007). Using a qTOF instrument,
the accurate mass along with MS2 can help identify compounds but also possible impurities in the
chromatography (Wolff et al 2001). For the analysis of well characterized samples, a simple mass
spectrometer (e.g. a single quadrupole) might be more robust and thus yield more reliable results for each
sample. For identification of new compounds, this instrument will not be useful while a high resolution
instrument can narrow down the amount of possible compounds, thereby increase the likelihood of
identification. The use of high resolution mass spectrometry can be a powerful tool for identification of
compounds even from a complex matrix.
2.6Dataprocessingandstatisticalmethods
Metabolomics, especially non‐targeted, creates a large amount of data. Chromatographic data has to be
analyzed and for statistical analyses the data has to be sorted into a matrix containing retention times, m/z
values and intensities. To create a matrix, multiple tools are needed, such as time alignment of the
chromatography, scaling of the data and reduction of noise (Idborg et al 2005). Time alignment ensures
that a possible shift in analysis time over the full analytical run will be aligned so that the compounds can
be analyzed in the same “bucket”. In turn, the bucket is created to form the matrix. Scaling is performed to

26
homogenize the data as much as possible. Lastly, since a large proportion of the data can be noise, a
reduction of the noise can reduce the time for identifying differences in the metabolome. To identify these
differences, statistics is a useful tool. Particularly for non‐targeted metabolomics, statistical methods such
as principal component analysis (PCA) and partial least square regression (PLS) are used (Ebbels and Cavill
2009; Robertson et al 2011).
Both unsupervised and supervised statistical tests are applied in metabolomics. The latter includes analysis
of variance (AVONA) and PLS, while the former includes PCA and hierarchical clustering (Shulaev 2006). The
unsupervised statistical tests are used to detect patterns in data with no predefined control and exposed
groups. Furthermore, they can be useful to detect outliers which can then be removed from the dataset. In
a supervised statistical test, the statistical model has predefined knowledge about control group and
exposed group. In the present work ANOVA, PLS and PCA have been applied.
T‐test
The Student’s t‐test aims to identify differences between two groups, and is only applicable if the data are
normally distributed. Data that are not normally distributed can be analyzed with nonparametric tests such
as Mann‐Whitney (Comparisons and Dice 2002). In order to analyze more than two groups, analysis of
variance (ANOVA) can be performed. ANOVA can be used to analyze groups of the same substance and
correlate these results to that of a control group e.g. groups of animals dosed with the same substance in
increasing amounts.
PCA and PLS
Models are often applied to metabolomics data to further illustrate the differences to separate
metabolomes. One such model is a PCA (Ebbels and Cavill 2009). PCA is a projection technique which is
designed to extract, display and rank the variance in a dataset. The purpose is to reduce the dimensionality
while at the same time retain the information in the dataset. The PCA filters out the most significant
variables in the original matrix so instead of looking at a large number of variables the PCA allows
identification of the most influential variables. Another model used for interpretation of changes in
metabolism is the PLS regression (Shulaev 2006; Bartel et al 2013). PLS analysis also uses a collection of
analyses which is translated into a matrix. The number of X variables corresponds to the number of column
in the X table. However, a second table with sample information is also taken into account. Hence, PLS is
referred to as a statistical supervised method. Unlike PCA, which detects the direction of maximum
variation, PLS attempts to identify the best correlation between X and Y tables using linear combinations of
variables in x and y table (Ebbels and Cavill 2009). When using PCA it is important to check if the model can

separate gr
sophisticate
(Wishart 20
Figure 5 3 D aBoth the plotsthe low dose a
The applica
metabolom
In the prese
Robertson e
with the ide
the haystac
2.7Chall
Metabolom
metabolom
conduct an
metabolom
typically loo
samples ref
control ani
(Robertson
roups. If the
ed models, a
010).
and 2 D score ps display differand control.
ation of stat
mics, the iden
ent study PC
et al 2011; B
entification a
ck” (Ebbels a
lengeswit
mics has been
mics has been
alysis of an
me is affected
oks at a snap
flecting the
mals from
et al 2011).
e PCA model
as these mig
plots of male Brences between
tistical analy
ntification of
CA, ANOVA, t
Bartel et al 2
and visualiza
nd Cavill 200
thinterpr
n used to ev
n applied to
imals with r
d by factors
pshot of the
above issue
two differen
This highligh
l cannot dist
ht just over‐
PA animals. Thn the groups, t
ysis is an im
f changed me
t‐test and PL
2013). Using
tion of the c
09).
retingme
valuate a ran
detect chan
respect to b
s such as age
metabolome
es as well as
nt rooms at
hts the need
27
tinguish betw
‐fit the mod
he third dimenthough the thir
mportant ste
etabolites is
LS have been
statistical ap
compounds o
etabolomi
nge of differe
nges in the
both toxicity
e, gender, s
e, it is impor
s technical v
t the same
to be very c
ween the tw
el and intro
sion illustratesrd dimension r
ep in metab
based on st
n applied (Sh
pproaches fo
of interest an
icsdata
ent diseases
metabolome
and disease
strain variati
rtant not to
variation. Fo
facility can
areful when
wo groups it
duce possibl
s how the groueally separates
olomics. Esp
tatistical mod
hulaev 2006;
or non‐targe
nd thereby to
and toxiciti
e upon low d
e, it is impo
ons and so
induce unwa
or instance,
n have diffe
conducting
t is unwise t
le errors into
ups are related s the high dose
pecially in n
dels such as
; Ebbels and
eted metabo
o identify “t
ies. In the pr
dose toxic e
ortant to kno
forth. As m
anted variati
it has been
erent metab
metabolomi
to use more
o the model
to each other.e animals from
non‐targeted
PCA or PLS.
Cavill 2009;
lomics helps
he needle in
resent study
exposure. To
ow how the
etabolomics
ion between
shown that
olic profiles
ics analyses.
e
l
. m
d
.
;
s
n
y
o
e
s
n
t
s

28
For sample preparation certain factors have to be controlled. Temperature, duration, freezing, thawing,
order of analysis are some of the factors that can affect the results. Thawing samples at room temperature
compared to thawing on ice has been shown to change the metabolite composition (Breier et al 2014).
However, for many lipid classes in the plasma metabolome, the stability is high even at 4 degrees for 6
hours (Breier et al 2014). For analysis of primary metabolites in microorganisms it has been shown that
quenching is required to ensure that the metabolite pool stays unchanged (Villas‐Bôas et al 2005). Another
factor which has great impact is gender; a study of pH effects on muscle showed a difference in response
between male and female muscles (Ellis et al 2014). Furthermore, Jeremek et al. have shown that men and
women respond differently to alcohol consumption (Jaremek et al 2013). Using mass spectrometry allows
for randomization of the samples, as the mass spectrometer will have a reduced sensitivity over time due
to reduction of signal in the detector of the mass spectrometer. It has been shown that the instrument run‐
time in an experiment with many samples can be one of the critical factors affecting variance (Burton et al
2008). To ensure that no drifts or malfunction are occurring during the analytical run, a number of quality
control samples reflecting the number of samples are included in the analyses. At the end of the analytical
run the quality control sample must cluster closely in the score plot (Burton et al 2008).
Many studies aim to identify possible biomarkers of diseases, for early detection of illness in humans. For a
range of diseases and exposure to toxic chemicals, biomarkers have been identified (Singh and Li 2011;
Austdal et al 2014). A biomarker reflects changes in a normal biological process and can assist in the
diagnostics of disease (Larson et al 2013). Studies have been conducted where an analysis of the
metabolites is performed in order to understand how diseases affect the metabolome (Chen et al 2014).
Biomarkers have been identified for diseases such as cancer, Alzheimer’s disease, diseases associated with
pregnancy and Parkinson’s disease (Michell et al 2008; Yonezawa et al 2013; Kobayashi et al 2013; Austdal
et al 2014). Metabolic changes have been analyzed in the hope of identifying biomarkers of diseases, to
determine early stages of the diseases (Zhang et al 2012b; Jung et al 2013). A number of biomarkers have
been identified e.g. blood glucose levels as biomarkers for the risk of acquiring diabetes, serum creatine for
kidney failure and prostate specific antigen for prostate cancer (Xia et al 2013a). Metabolomics as an
approach for identification of biomarkers is widely used. But although many biomarkers for diseases and
toxic effects have now been suggested, statistical evidence are often lacking (Leichtle et al 2013).

29
3PartIII:Researchobjectivesandbiologicalquestionsbeingasked
The aims of this study were to achieve new insights into the action of toxic compounds on biological
systems. A metabolomics approach was applied. The primary aim was to develop a sample preparation
procedure and LC‐MS analyses to detect as many metabolites as possible in the plasma metabolome.
Further to use this procedure for the analyses of plasma from rodents exposed to combinations of
endocrine disrupting chemicals for identification of metabolites changed in concentrations which could
serve as biomarkers of toxic effects. Also, to investigate whether changes in concentrations of these
biomarkers could be observed using metabolomics at lower exposures not resulting in toxic effects.
Specifically to:
Development of an analytical method for determining changes in the metabolome due to low‐dose
exposure to toxic chemicals
To illustrate the efficiency of the analytical method, and if the analytical platform can be used to
identify and evaluate low‐ and high‐dose exposure effects to toxic chemicals
Can metabolomics be used to extrapolate data from low‐ to high‐dose exposure?
Is it possible to identify mechanism of action for low dose exposure to a toxic chemical?

30
4PartIV:Materialandmethods
4.1Samplecollection
The Animal study was carried out at the DTU National Food Institute (Mørkhøj, Denmark) facilities. Ethical
approval was given by the Danish Animal Experiments Inspectorate. The authorization number given: 2012‐
15‐2934‐00089 C4. The experiments were supervised by the National Food Institutes in‐house Animal
Welfare Committee for animal care and use.
4.1.1PFNAexperiment
Male Wistar Hannover Galas rats, six weeks of age with pathogen‐free health status, were obtained from
Taconic M&B (Lille Skensved, Denmark), and allowed to acclimatize for one week. The animals were housed
two per cage (Macrolon, Buguggiate, Italy) with light on from 7 am to 7 pm. Room temperature and relative
humidity were 22±1 °C and 55±5%, respectively. Rats were given ad libitum access to acidified tap water
and standard diet (prod. no. 1324 Altromin, Brogården, Gentofte, Denmark). The animals were
administered test substances once a day by gavage for 14 days with corn oil (VWR ‐ Bie & Berntsen, Herlev,
Denmark) as vehicle. The dosing volume was 1 mL/100 g of body weight (bw). At the end of the
experiments, animals were anaesthetized in CO2/O2 and decapitated. Neck blood was collected in
heparinized tubes, and plasma was isolated by centrifugation at 1,000 x g, 4 °C for 10 min. Plasma was
stored at ‐80 °C. Around 1 ml of plasma from each of the 82 animals were obtained.
4.2.1BPAexperiment
A total of 110 time‐mated nulliparous, young adult Wistar rats (HanTac:WH, SPF, Taconic Europe, Ejby,
Denmark) were supplied at gestation day (GD) 3 of pregnancy.
The animals were housed in pairs until GD 17 and alone thereafter under standard conditions in semi‐
transparent polysulfone (PSU) type III cages (PSU 80‐1291HOOSU Type III, Tecniplast, Buguggiate, Italy)
(15x27x43 cm) with Aspen wood chip bedding (Tapvei, Gentofte, Denmark), Enviro Dri nesting material
(Brogaarden, Lynge, Denmark) and Tapvei Arcade 17 (Aspen wood) shelters (Brogaarden). The study was
performed using three blocks (separated by 1 week), and all dose groups were equally represented in the
blocks, i.e. the 22 time‐mated rats per dose group were allocated among blocks. The dams were distributed
into five dose groups (0, 0.025, 0.250, 5 or 50 mg/kg bw per day respectively). Details on study design are
described in Christiansen et al. (2014).

31
At the end of the experiments, animals were anaesthetized in CO2/O2 and decapitated. Neck blood was
collected in heparinized tubes, and plasma was isolated by centrifugation at 1,000 x g, 4 °C for 10 min.
Plasma was stored at ‐80 °C. Around 0.1 ml of plasma obtained from each of the 90 animals.
4.1.3Seleniumexperiment
Urine samples were obtained from a previously reported Se bio‐distribution study (Loeschner et al 2014).
Briefly, four‐week‐old, specific pathogen‐free (SPF) female Wistar rats were obtained from Taconic M&B
(Lille Skensved, Denmark). The rats were allowed to acclimatize for one week. The rats were housed in
pairs with a 12:12‐h light/dark cycle with the lights on from 7 a.m. to 7 p.m. The room temperature was 22
± 1 oC, and the relative humidity was 55 % ± 5 %. The rats were given ad libitum access to a standard diet
(Prod. no.1324, Altromin International, Lage, Germany) and citric acid acidified tap water.
4.2Samplepreparation
The method was based on SPE followed by chemical separation. As illustrated in figure 6 the plasma was
thawed on ice, followed by protein precipitation with three volumes acetonitrile containing 1 % formic acid.
The sample was centrifuged at 10000 g to remove proteins and supernatant added to a hybrid SPE
phospholipid column (30 mg Hybrid SPE Phospholipid column Supelco, Sigma–Aldrich, St. Louis, MO). The
SPE column was first eluted by the addition of 300 μl of 1% formic acid in acetonitrile, and the eluate was
collected in a vial and evaporated to dryness at 50 °C using a gentle stream of nitrogen. The dry residue was
then extracted by adding 200 μl of heptane. The heptane fraction was then transferred to a clean vial. The
residue was then extracted by adding 200 μl of methanol (polar fraction). The heptane fraction was
evaporated at 50 °C using a gentle stream of nitrogen. The dry residues of the heptane fraction was
dissolved in 200 μl of 50:50 (acetonitrile:isopropanol) (lipid fraction).

32
Figure 6 Flow diagram of the SPE method. Proteins were precipitated by adding 300 µl acetonitrile with
1% formic acid followed by SPE clean‐up of the supernatant in three sub‐fractions.
The hybrid SPE column was eluted by 300 μl of 10% ammonium hydroxide in methanol, in order to elute
the phospholipids. The phospholipid fraction was diluted with 200 μl Milli‐Q water and 500 μl of methanol.
4.3Sampleanalysis
4.3.1Highpressureliquidchromatography
The analysis was conducted on a Dionex Ultimate 3000 RS (Thermo Scientific, CA) combined with a Maxis
qTOF mass spectrometer (Bruker Daltonics, Bremen, Germany). The solvents used for the HPLC analyses
were A: 0.1 % formic acid + 5 mM NH4OH in water and B: 0.1 % formic acid in acetonitrile. The flow was 0.3
ml/min and two different solvent gradient systems were used, as described below. The HPLC column was
an Ascentis Express C8 (100x2.11 mm, 2.7 µm) column (Supleco, St. Louis, MO).

33
Table 1 The two gradient systems used in the analysis (Paper I‐IV). The hydrophilic programming was used for the polar fraction while the hydrophobic programming was used for the phospholipid and lipid fraction.
Hydrophilic
0 min; 0 % B
3 min; 5 % B
10 min; 100 % B
12 min; 100 % B
12.1 min; 0 % B
14 min; 0 % B
Injection volume 3 µl
Temperature 40OC
Hydrophobic
0 min; 70 % B
3 min; 75 % B
8 min; 100 % B
10 min; 100 % B
10.1 min; 0 % B
12 min; 0 % B
Injection volume 1 µl
Temperature 50OC
4.3.2Massspectrometry
The settings for the mass spectrometer can be found in the appendix (appendix II). The LC‐MS data were
evaluated using Bruker Daltonics Data analysis 4.0 and/or 4.1. For the multivariate data analysis of mass
spectra, Profile Analysis 2.1 combined with metaboanalyst.ca was used. The data matrix was created by the
“Find Molecular Feature” using a mass range from 50 to 1100 Da, combined with a time alignment function
and a retention time window from 30‐720s and 30‐840s, for the hydrophilic and hydrophobic gradient
system, respectively.
For the quantification of PFNA in the plasma samples, Quantanalysis 2.0 (Bruker Daltonics) was used. To
quantify the PFNA concentrations, a standard curve was constructed between 10 ng/ml and 700 µg/ml. The
high concentration PFNA samples were diluted to fit in the linear range (Paper II). For the analyses of
plasma samples from animals dosed with BPA, a standard curve between 0.01 µg/ml and 300 µg/ml was
created; however BPA was not detected in the samples (Paper IV).
MSMS analysis was performed using the “auto MSMS” function in the data analysis software (Bruker
Daltonics, Bremen, Germany). From each group of animals were two samples selected and MSMS
performed. The auto MSMS function was set to ramping fragmentation energy from 10‐30 eV in the mass
range of 100‐1000 Da e.g. a mass of 100 Da would have 10 eV while a mass of 1000 Da would have 30 eV
fragmentation energy. The auto MSMS creates MSMS patterns for every second scan on the top 3 intensity
peaks.

34
4.3.3NMRanalysis
An NMR analysis was conducted on plasma from the PFNA exposed animals (Paper III). Centrifugal Filter
Units (Merck, Millipore, Darmstadt, Germany) was washed 5 times with 500 µl water to remove excess
glycerol from the production. Five hundred µl of plasma was filtered by centrifugation at 10.000 rpm at 4O C
for 35 min. Two hundred eighty‐five µl of the filtrate was transferred to an Eppendorph vial along with 35
µl D2O and 30 µl 4,4-dimethyl-4-silapentane-1-sulfonic acid (DSS) (internal standard). The sample was
transferred to a Shigemi tube and analyzed by H‐NMR. H‐NMR settings can be found in (appendix II).
4.3.4Geneanalysis
Total RNA from six rat livers each from vehicle control, Low PFNA + Mix, and Mid PFNA ± Mix groups were
separately converted into labeled cRNA and applied to the One‐Color Microarray‐Based Gene Expression
Analysis (Low Input Quick Amp Labeling) version 6.5 (Agilent Technologies, Santa Clara, CA). Labeled cRNA
from each rat was hybridized to Agilent Whole Rat Genome Oligo Microarrays (G4122F) for 17 h at 65 OC.
The hybridized microarrays were scanned using an Agilent DNA Microarray Scanner and evaluated using
the Feature Extraction software version 10.7.3.1 according to protocol GE1_107_Sep09 (Agilent
Technologies) to generate feature extraction files for further analysis. Reads were quality controlled by the
software prior to release of the data. Arrays that did not pass quality control were removed from the
dataset. Based on the quality control reports, two of the six microarrays from the Mid PFNA + Mix group
were excluded from further analysis. The remaining arrays, six from each of control, Low PFNA + Mix, and
Mid PFNA and the remaining four from Mid PFNA + Mix were found to be of high quality. Extracted data
were analyzed using the limma software package (Smyth 2004; Smyth 2005) in R (R Core Team 2012). Data
were background corrected using the ‘normexp’ method (Ritchie et al 2007) and normalized between ar‐
rays using quantile normalization (Smyth and Speed 2003) prior to statistical analyses. Within‐array
replicate probes were replaced with the average expression level. To identify treatment‐specific gene
effects, we fitted a linear model for each gene and applied empirical Bayes statistics (Smyth 2004) for each
relevant two‐group comparison. The false discovery rate (FDR) was controlled using the Benjamini‐
Hochberg method (Benjamini and Hochberg 1995). Reported p‐values for the significantly differentially
expressed genes from the transcriptomics analysis were all adjusted, and p‐values below 0.05 were
considered statistically significant.
4.4Identificationprocesses
Identification of metabolites differing between dosed and control animals is an important aim in the
metabolomics investigation. To understand the change in non‐targeted metabolomics, identification of the
changed metabolite is required. For the identification of unknown metabolites, databases which can assist

35
in the identification are available. The metabolomics community has focus on projects aiming at describing
metabolites, e.g. projects such as The Serum Human Metabolome Project (HUSERMET) (Zelena et al 2009)
and the Metabolomics Standard Initiative (MSI) (Fiehn et al 2007). The collective work of these projects has
led to an information collection which is easily accessible from databases and other web‐based programs,
such as human metabolome database (HMDB.ca) (Wishart et al 2007; Wishart et al 2009; Wishart et al
2013), Kyoto Encyclopedia of Genes and Genomes (KEGG.jp) (Kanehisa and Goto 2000), MassBank
(MassBank.jp), METLIN (metlin.scripts.edu) (Trauger et al 2005; Smith et al 2005) and Lipidmaps
(Lipidmaps.org) (Sud et al 2007; Fahy et al 2009). These projects and databases can help to identify
metabolites from their accurate mass. Projects combining metabolomics data with transcriptomics data
have been conducted, e.g. InMex (InMex.ca) (Xia et al 2013b). Such tools can, along with the knowledge of
pathways and systemic changes, help to identify signs of sickness or health risk assessment (Xia et al
2013b).
4.5Metaboliteidentification
Metabolites found to be significantly different between exposed and control animals were searched for in
databases such as HMDB (Xia et al 2009; Xia et al 2012; Wishart et al 2013), Lipidmaps (Fahy et al 2009),
Metlin (Trauger et al 2005) and MassBank. The identification of metabolites (Paper I‐IV) was corroborated
by MSMS analysis using an auto MSMS approach. The MSMS spectra were acquired using the Maxis qTOF
instrument with a linear collision energy gradient from 10 to 30 eV in the mass range of 100‐1000 Da. The
auto MSMS settings used created MSMS spectra for the three highest intensities in the MS spectrum. This
is useful for 95 % of the compounds; however, low intensity peaks could be difficult to identify when using
this approach. To identify the last 5 % a list of the compounds of interest would have to be created for a
specific MSMS analysis of these compounds. For a sub‐fraction of the significant metabolites MSMS
patterns and retention times were compared with similar data obtained from analysis of a purchased
standard.
To identify the unknown metabolites the following procedure was used:
1) A mass was extracted from the statistical analysis with four decimal accuracy
2) The mass was searched for using HMDB, Metlin, MassBank and/or KEGG (±20mDa)
3) Possible candidates were suggested and if possible, a MSMS pattern was obtained from databases
(lipidmaps or HMDB)
4) The identified MSMS pattern was compared with the MSMS pattern created using the qTOF
instrument – if a match compound was marked as identified, see Figure 7

36
5) For some compounds, e.g. MG(18:0) and MG(16:0), a standard were purchased to verify the
identity of the compound
6) If a compound could not be identified, a m/z value was assigned
Figure 7 Identification process. A mass of interest is identified. The chromatographic peak of the specific mass is evaluated. The mass is searched for in online databases by accurate mass with an accuracy of 2 or 20 mDa. For this specific example 29 suggested metabolites are found using either 2 or 20 mDa. A list of suggested compounds is created and reduced by MSMS, standard and retention time of the compound. A compound is identified if a MSMS pattern can be correlated or in best case if a standard is purchased.
Two examples of identification are shown in Figure 8. The top (a) spectrum shows the MSMS spectrum of
an ion with a mass of 634.5402. The MSMS spectrum shows in addition to the parent ion the pseudo
molecular ion (M+H)+ (m/z 617.5139) along with a loss of water (m/z 599.5033), furthermore two
fragments of 337.2735 and 269.2369 are found. HMDB suggest DG(18:2/18:2) as a possible M+NH4 ion;
which could be correlated to the neutral side chain loss (m/z 337.2735) and loss of the acyl side chain (m/z
263.2369) along with loss of water. Comparing this MSMS pattern with the in silico MSMS pattern of DG
(18:2/18:2) from Lipidmaps shows that all the fragments fit and that the mass deviation is less than 0.6
ppm for all of the fragments. The compound was identified to be DG(18:2/18:2) as it only has one neutral
loss of the side chain, there are multiple other compounds with the same mass e.g. DG(18:1/18:3) or
617.5139
m/z value of interest
Yes
No
Is there a chromatographic peak
1) MSMS verification if possible 2) Standard 3) Evaluation of chromatographic retention time
Search for compounds on online databases (20 mDa
accuracy)
List of compounds: 1) DG(18:1/18:3) 2) DG(18:2/18:2) 3) DG(20:3/16:1) 4) DG(20:2/16:2) 5) …
Not of interest
Identification process

37
DG(16:2/20:2) though as there is only one fragment around 337.27 it has to be a loss of a 18:2 sidechain. If
the compound were DG(18:1/18:3) the MSMS pattern would have a mass of 335.27 and 339.28 comparing
to loss of 18:3 and 18:1, respectively.
Figure 8 The MSMS pattern of diacylglycerol(18:2/18:2) and phosphatidylcholine(20:4).
The MSMS pattern of phosphatidylcholine (20:4) was identified from the MSMS pattern shown in Figure 8b.
The MSMS spectrum contains a psedo‐molecular ion of 544.3399 was found along with a loss of water
(526.3286), lastly a fragment with the mass of 184.0744 was found. The phosphatidylcholine compounds
were identified by a loss of water from the pseudo‐molecular ion along with a phosphorylcholine fragment
of 184.074, Figure 8b.
One metabolite in particular (from Paper III) was difficult to identify. A search in HMDB for the exact mass
revealed three possible compounds with the same elemental composition. A standard of one of the
possible compounds, cholesteryl acetate, was purchased and analyzed in the HPLC system; however, the
retention time of cholesteryl acetate was not similar with the unidentified metabolite. The metabolite was
therefore not identified.

5PartV
5.1Meth
LC–MS anal
Analysis of
of the meta
determinat
Two pre‐tre
based on p
described b
precipitatio
Figure 8 sho
peaks from
revealed a p
injection el
causing det
high‐percen
Figure 9 ProteHowever, upo(grey line). Th
To prevent
the phosph
centrifugati
sub‐fraction
sample into
compounds
V:Results
hodpaper
lysis of the p
the plasma m
abolites. Fo
ion of three
eatment app
protein preci
by Souverai
on followed b
ows a samp
m the first in
problem wit
luted betwe
tector satura
ntage organi
ein precipitatioon a second injhis indicated tha
carry‐over, a
holipids. Prot
ion. The supe
ns. This resu
o three give
s e.g. polar c
sandDisc
r
plasma meta
metabolome
or this study,
distinct met
proaches for
pitation, usi
n et al. (So
by SPE to sep
le obtained
njection (Bla
th precipitati
een 300‐500
ation. This m
c solvent. Ho
on followed byjection of the sat the first sam
a second app
tein precipit
ernatant wa
ulted in a no
es the poss
compounds a
cussiono
abolome—A
e is a complic
, the main a
abolite class
the purificat
ing three vo
ouverain et
parate the ph
by the first
ck chromato
ion of the ph
0 s during th
might have b
owever, poo
y HPLC‐MS. Thesame sample t
mple was not fu
proach was t
tation was p
s placed on a
on‐polar lipi
ibility to op
are best sepa
38
ofindivid
novel samp
cated task d
aim was to a
ses: phospho
tion of plasm
olumes of or
al 2004).
hospholipids
purification
ogram), how
hospholipid
he second H
been resolve
r peak shape
e first injectionthe chromatogully eluted and
tested. For th
performed u
an SPE colum
id and a po
ptimize the
arated in a s
dualproj
ple preparati
ue to the lar
achieve a hig
olipids, neutr
ma samples w
rganic solven
The second
s.
procedure.
wever a seco
in the first r
HPLC‐MS ru
ed with a lo
e and detect
n (black line) reram revealed htherefore elute
his procedur
sing 3 volum
mn and the e
lar fraction;
chromatogr
system starti
ects
on strategy
rge polarity a
gh number o
ral lipids and
were tested
nt followed
d approach
The chroma
ond injection
un. The pho
n resulting
nger run‐tim
or saturation
evealed a chromhigh intensity ped in the secon
re, an SPE co
mes acetonit
eluate subseq
see Figure
aphic condi
ng with a low
and concent
of molecular
polar comp
. The first ap
by HPLC‐MS
was based
atography sh
n (Grey chro
spholipids fr
in high inte
me in the pr
n might still
matogram witpeaks and detnd run.
olumn was us
trile:plasma
quently divid
10. The div
itions for ea
w percentag
ration range
features by
ounds.
pproach was
S analysis as
on protein
howed sharp
omatogram)
rom the first
ensity peaks
resence of a
occur.
h sharp peaks.ector overload
sed to retain
followed by
ded into two
vision of the
ach class of
ge of organic
e
y
s
s
n
p
)
t
s
a
. d
n
y
o
e
f
c
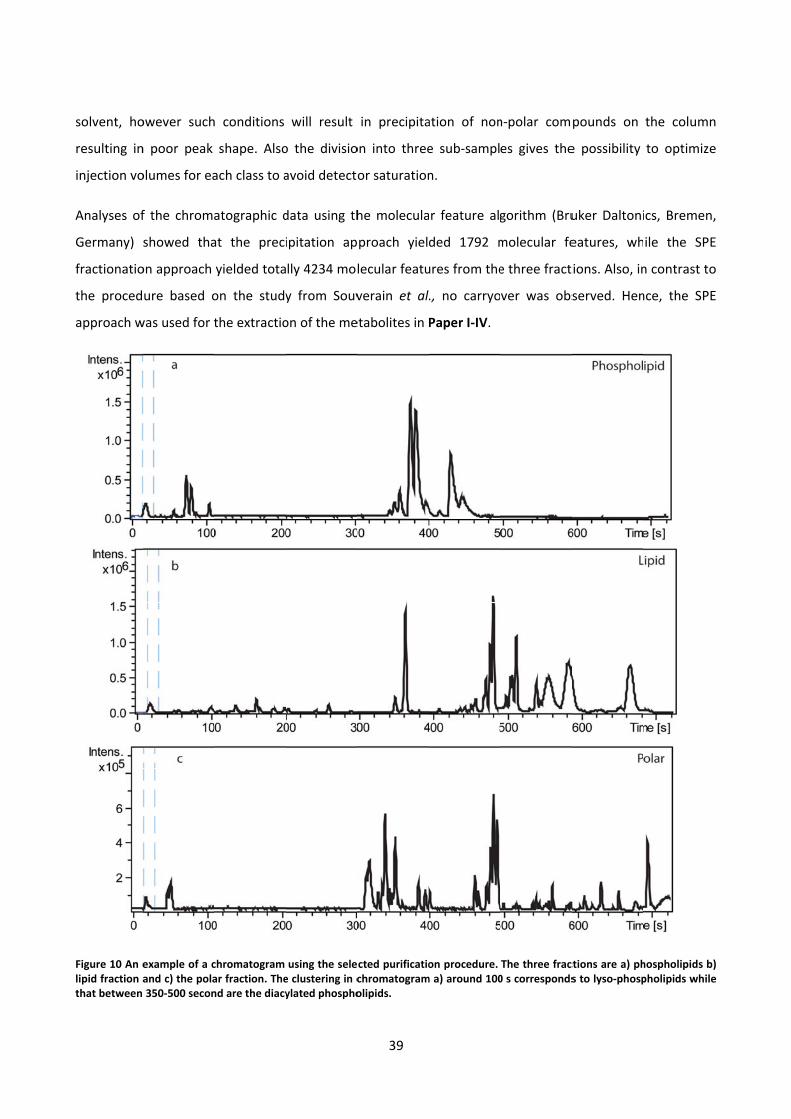
solvent, ho
resulting in
injection vo
Analyses of
Germany)
fractionatio
the proced
approach w
Figure 10 An elipid fraction athat between
owever such
n poor peak
olumes for ea
f the chroma
showed tha
on approach
ure based o
was used for t
example of a cand c) the pola350‐500 secon
h conditions
shape. Also
ach class to a
atographic d
at the preci
yielded tota
on the study
the extractio
chromatogram ar fraction. Thend are the diacy
will result
o the divisio
avoid detecto
data using th
ipitation ap
lly 4234 mol
y from Souv
on of the me
using the selee clustering in cylated phospho
39
in precipita
on into three
or saturation
he molecula
proach yiel
lecular featu
verain et al.
etabolites in P
cted purificatiochromatogramolipids.
ation of non
e sub‐sampl
n.
ar feature alg
ded 1792 m
ures from the
., no carryo
Paper I‐IV.
on procedure. m a) around 100
n‐polar com
es gives the
gorithm (Bru
molecular fe
e three fract
ver was obs
The three fract0 s corresponds
pounds on
e possibility
uker Daltoni
eatures, wh
tions. Also, in
served. Hen
ctions are a) phs to lyso‐phosp
the column
to optimize
ics, Bremen,
ile the SPE
n contrast to
nce, the SPE
hospholipids b)pholipids while
n
e
,
E
o
E
) e

40
The method is similar to that described by Tulipani et al. (Tulipani et al 2013), but with extraction of
phospholipids for analysis since plasma phospholipid concentrations were found to be sensitive to chemical
exposure. Therefore, the phospholipids were extracted from the column for analysis. In Figure 10 , the
three analyzed sub‐fractions are shown. The reason for having three sub‐fractions was to reduce the ion
suppression from both the phospholipids and the neutral lipids by optimization of injection volume and
chromatography. This method was used to analyze all samples in the two studies described in the following
sections; the “PFNA Papers” and “Test of the method – low dose exposure”.
With the established cleanup/purification method, we identified approximately 2.5 times more molecular
features compared to a traditional protein precipitation method (Souverain et al 2004). This is slightly
overestimated, since the selected method will include some compounds twice as these are equilibrium
distributed between the heptane and the methanol extraction solvent. It is notable that the selected
method is based on a non‐targeted approach, which implies less knowledge about the contents of specific
compounds. For analysis of the metabolites on the LC‐MS system it was found that a C8 column was the
best compromise to give a good chromatographic separation of all three sub‐fractions: polar, lipid and
phospholipid. By using a single analytical column, all three sub‐fractions could be analyzed in one sequence,
saving on time and cost of the analyses.
The importance of phospholipids has been described in several studies, e.g. Psychogios et al. (Psychogios
et al 2011) and Kim et al. (Kim et al 2011), who showed that phospholipids were affected by hepatic
steatosis. Furthermore, phospholipids are believed to have signaling activity (Chen et al 2011; Zhang et al
2014). Therefore, changes in phospholipid levels may provide information on specific mechanisms and
effects in mammals. Thus, we thought it important to include these compounds in the analysis.
Using the new SPE based method, three major classes of the plasma metabolites were detectable; the
phospholipids, neutral lipids and the polar fraction. We detected differences in phospholipid, neutral lipid
and polar fractions of the plasma (Paper III, IV and V). The majority of detected changes in phospholipids
were phosphotidylcholine, but neutral lipids such as mono‐, di‐ and triglycerides were also detected.
Furthermore, it was possible to detect steroid hormones in the exposed animals to a certain extent (Paper
III).

5.2PFNA
Paper II + I
in rats” an
relevant co
Perfluoroalk
fluorinated
2013). Perf
concerns re
persistence
2007; Fang
Metabolom
(Nicholson
is well desc
the investig
2010; Demu
those at w
toxicity, as
different up
a more su
conventiona
the endocr
simultaneou
conventiona
approach, w
allows for t
rats were ex
mid and hig
by metabol
Apapers
II: “Perflour
nd “Exposur
mpounds di
kyl acids (PF
hydrophobi
fluorononan
egarding per
, accumulati
et al 2012a;
mics has prev
et al 1999; R
cribed in the
gation of low
ur et al 2013
which overt t
well as bioc
pon high and
ubtle toxicity
al toxicology
ine disruptin
usly, a low
al toxicology
we analyzed
he scrutiny o
xposed to PF
gh were 20 a
omics and tr
ononanoic a
e to Perflou
sturbs the e
FAAs) are st
c linear carb
oic acid (PF
fluoronated
ion among h
Yamada et a
viously been
Robertson et
toxicologica
w‐dose expos
3). Metabolic
toxic effects
chemical cha
d low exposu
y (Paper II
y techniques
ng propertie
dose mixtu
y approach,
d the mRNA
of potential
FNA at three
and 400 time
ranscriptomi
acid in comb
urononanoic
energy/lipid
table, man‐m
bon chain of
FNA) is a P
compounds
umans and w
al 2014).
Figure
n used to a
t al 2005; va
al literature
ures have ju
c changes ar
s are observ
anges can o
ures, a study
) was unde
and a syste
es of PFNA.
re (Mix) wa
we analyzed
levels of liv
responses in
e doses, the l
es higher, res
cs, respectiv
41
bination with
c acid comb
homeostasis
made perflu
varying leng
PFAA with a
s have arisen
wildlife, and
e 11 Structure o
nalyze chan
n Ravenzwa
(Nielsen et a
ust recently b
e likely to be
ved. This me
occur. To eva
y including hi
ertaken. The
ems biology a
To mimic a
as also inclu
d organs and
ver genes a
n the metab
lowest being
spectively. A
vely.
h 14 chemic
bined with
s”
orinated org
gth terminate
a nine‐carbo
n due to thei
extraordina
of PFNA
ges in the
ay et al 2014
al 2010b; Ga
been underta
e initiated al
eans that, a
aluate if the
igh doses wi
e experimen
approach. Th
general hum
uded (see p
d the steroid
nd the plasm
olome to low
g related to h
nalysis of th
als exerts lo
a low‐dose
ganic molec
ed by a carb
on backbone
ir global dist
rily long biol
metabolome
4). The effec
arcía‐Sevillan
aken (Crofto
ready at low
at a high co
e changes in
th overt tox
nt was des
he study was
man exposu
aper II for
d hormones.
ma metabol
w, mid and h
high end hum
e blood and
ow‐dose mix
mixture of
cules charact
boxylic acid (
e. The pote
tribution, en
logical half‐l
e as a resul
ct of high‐do
no et al 2014
on et al 2005
wer exposure
oncentration
n the metab
xicity and low
signed to in
s designed t
ure to severa
details on M
. In the syst
lome. This s
high dose ex
man exposur
the liver wa
xture effects
f 14 human
terized by a
Klenow et al
ential health
vironmental
ife (Lau et al
t of toxicity
ose exposure
4), however,
; Merhi et al
e levels than
both overt
olome were
w doses with
nclude both
o determine
al chemicals
Mix). In the
ems biology
study design
xposure. The
re, while the
s conducted
s
n
a
l
h
l
l
y
e
,
l
n
t
e
h
h
e
s
e
y
n
e
e
d

42
By the conventional toxicology approach, we found effects on steroid hormones and absolute liver weights.
Histopathological analyses of the livers revealed hepatic steatosis indicated by increased cell sizes and a
reduced cell border line. The internal doses of PFNA following the exposure regimen was conducted and
showed a concentration in high dosed animals ranging from 0.54 to 0.6 mg/ml for PFNA and PFNA+Mix,
respectively, while the low dose showed between 396 and 1111 ng/ml, with or without mix, similar to sixty
times human exposure..
Figure 12 Physiological data from the eight groups of animals (paper II). The data show that the highest concentration of PFNA exposure lower the body weight of the animals. Furthermore, is there a change in the liver the cell size as well as the cell borders is changed upon high exposure to PFNA.

43
At low concentration there were only marginal effects detected by the conventional toxicological approach,
although we note that an important finding was on steroid hormones with an increase in testosterone for
PFNA plus Mix and an increase in corticosterone for PFNA alone (Paper II). To gain further insight into the
effects of PFNA with or without Mix analysis of the plasma metabolites was applied. Furthermore,
microarray gene expression analysis was used to determine the transcription of the liver gene mRNA levels.
In animals exposed to Low PFNA only, we also observed changes to the blood metabolome, albeit different
to what was observed with Mix only. In the scoreplot the different exposure groups clustered separated
from each other. The lipid fraction is depicted in Figure 13. There was a clear difference between Low PFNA
and Mix groups, but it was not possible to positively identify the specific metabolites responsible for this
separation.
Figure 13 PLS‐DA plot of the heptane fraction correlating the four groups Control (n = 10), Low PFNA (n = 10), Low PFNA + Mix (n = 10) and Mix (n = 8). The plot illustrates that Mix accounts for a major part of the variance in the dataset (Paper III) (Skov et al 2015).
The plasma lipid concentration for both phospholipids and neutral lipid species were found to be lowered
when the animals were exposed to mixture. The observed high impact of Low PFNA on the corticosterone
in Figure 14c correlates with observations from the conventional toxicological approach employing a
targeted LCMS approach (Paper II Fig 4) which also shows the corticosterone level to be increased at the
low PFNA dose.

44
Figure 14 Representative metabolite changes in the Low PFNA + Mix group. The plotted metabolites belong to two metabolite classes; PC (phosphatidylcholine) and DG (diacylglycerol). Metabolite levels were analyzed statistically for each group by comparison of each group to control (t test). For corticosterone (c) and lyso‐PC(20:4) (d), PFNA alone caused an increased metabolite level, whereas the combination of Mix and PFNA generally caused a decreased metabolite level (DG(22:5/ 18:3 (a) and PC(18:0/16:1) (e)). For lignoceric acid (b) and lyso‐ PC(18:1) (f) the effect by Mix + PFNA is stronger than the effect of Mix or PFNA alone. # = p‐value of 0.053 (Paper III) (Skov et al 2015).
Altered lipid metabolism is a common response to xenobiotic exposure (Zhang et al 2009; Karami‐Mohajeri
and Abdollahi 2011; Androutsopoulos et al 2013). An initial stress‐response to a xenobiotic insult can
increase carbohydrate metabolism to meet a changing energy requirement, subsequently met by increased
lipid and protein metabolism (Karami‐Mohajeri and Abdollahi 2011). The general decrease in plasma lipid
levels observed in the Mix‐exposed rats could reflect this situation, particularly since the exposure lasted
for a prolonged period (14 days), potentially resulting in effects such as hepatic injury. From the highest
exposure levels changes in the liver were found. It can be speculated that if the animals were exposed for a
longer time period with mid dose of PFNA the animals might have developed macroscopic changes in the
liver. Interestingly, two of our identified lysophosphatidylcholines, lyso‐PC(18:2) and lyso‐PC(20:4) have
both been identified as potential blood biomarkers for drug‐induced hepatic phospholipidosis (Saito et al
2014), and in both instances the response is reduced levels. Then, as drug‐induced phospholipidosis has
been associated with liver inflammation and fibrosis (Rigas et al 1986; Lewis et al 1989), it could suggest
that we are observing compromised livers in our rats exposed to Mix, albeit not observed at the
macroscopic level.
DDG(22:5/18:3)
Control
Low PFNA
Low PFNA +
MixMix
0
20000
40000
60000
80000
100000**
Buc
ket i
nten
sity
Lignoceric acid
Control
Low PFNA
Low PFNA +
MixMix
0
10000
20000
30000
40000
50000
**
Buc
ket i
nten
sity
Corticosterone
Control
Low PFNA
Low PFNA +
MixMix
0
20000
40000
60000
80000
**
Buc
ket i
nten
sity
Lyso-PC(20:4)
Control
Mid PFNA
Mid PFNA +
MixMix
0
5000
10000
15000
20000 #
Buc
ket i
nten
sity
PC(18:0/16:1)
Control
Mid PFNA
Mid PFNA +
MixMix
0
50000
100000
150000 **
Buc
ket i
nten
sity
Lyso-PC(18:1)
Control
Mid PFNA
Mid PFNA +
MixMix
0
5000
10000
15000
20000
*
Buc
ket i
nten
sity
a b c
d e f

45
Based on functional annotation of genes dysregulated in the PFNA ± Mix dosing groups, fatty acid
metabolism was the main biochemical function affected (Paper III Table 2). For instance, upregulated genes
such as Crot, Crat, Acox1, Ehhadh, Hadha, Hadhb, Decr2, Eci2, Ech1, are all involved in peroxisomal fatty
acid β‐oxidation, whereas Cpt2, Slc25a20, Acad11, Acadl, Acadm, Acads, Acadvl are all involved in
mitochondrial β‐oxidation. Genes associated with lipid transport, fatty acid activation, and peroxisomal
transport (Apoa2, Abcd3, Cd36, Slc27a2) were also upregulated. Amongst the down regulated genes was
Fatty acid binding protein 5 (Fabp5). Similar effects on lipid homeostasis have been shown in other studies
(Guruge et al 2006; Rosen et al 2007; Fang et al 2012b). Here, the effects on lipid metabolism seem to be
mainly driven by PFNA exposure, as the effects are comparable between animals exposed to Mid PFNA only
and Mid PFNA + Mix.
The mRNA levels of the liver were evaluated by micro array and it was observed that a group of receptors,
the peroxisome proliferator‐activated receptor (PPARs), was activated. In Figure 15, illustrating the
signaling network for PPARs, transcription factors are depicted at the top of the figure while genes and
phenotypic expressions are depicted below. It was found that activation of PPAR is correlated with reduced
lipid concentration and increased beta‐oxidation.
Figure 15 Illustration of a putative hepatic signaling network, from PPAR (and other transcriptional regulators) activation through regulation of gene expression to ultimately dictate phenotypic outcomes. Orange indicates predicted activation and blue indicates predicted inhibition. Shades of red and green indicate level of increased and decreased gene expression, respectively. The network was generated through the use of QIAGEN’s Ingenuity Pathway Analysis (IPA, QIAGEN Redwood City, www.qiagen.com/ingenuity (Paper III) (Skov et al 2015).
G-protein Coupled Receptor Enzyme Nuclear Receptor Transporter Unknown Disease
Predicted RelationshipsLeads to activationLeads to inhibitionFindings inconsistent withstate of downstream moleculeEffect not predicted
Prediction Legend
UpregulatedDownregulated
More Less
Predicted activationPredicted inhibition
More Less
PPARA
PPARG PPARGC1A
MED1RXRA
PPARD
thyroid hormone receptor
concentration of lipid hepatic steatosis oxidation of lipid
oxidation of fatty acid
CYP2B6
HADHBCPT2ACAA1
ACAA2ECI2SLC27A2ABCD3ACADS
ACOX1EHHADH
CD36
ACADM
ACADL
HADHA
NTRK1
MLYCD
ALDH1A1
CYP4A11
PLIN5
NR1I3
GPD1
ACADVL
ADRB3
PEX11A
FABP5CYP4A14
DECR1ACAT1
HADHACOT2
Transcription factors inactivated state
Phenotypical outcome
Gene expression changes

46
PPARs are known regulators of fatty acid β‐oxidation (Kanehisa and Goto 2000), and increased β‐oxidation
results in decreased plasma lipid concentration (Lau 2012). Then, as perfluorinated alkyl acids are known
PPAR‐activators (Vanden Heuvel et al 2006; Lau 2012; U. S. Environmental Protection Agency 2014), effects
observed in livers from the PFNA groups could, at least in part, be explained by this regulatory pathway.
Increased PPAR activation as displayed in Figure 15 could explain the effects shown at high‐dose exposure.
As PPAR activation leads to increased oxidation, more lipids would be present in the liver. It would be of
interest to explore if macroscopic effects such as hepatic steatosis would be observed if the mid dose study
was prolonged to 30 days.
NMR can provide a more precise identification of the metabolites. The plasma samples from the PFNA‐
exposed animals were analyzed by NMR at the Wishart Lab, Edmonton, Canada. The samples were
analyzed for 43 polar compounds (appendix III) and no difference between control and Low PFNA was
found. For the high dosed animals, seven metabolites were significantly different, at the mid dose only one
metabolite, arginine, was changed.
When using the conventional toxicological approach, we found that the animals exposed to the highest
concentrations developed non‐alcoholic liver disease. The transcriptomics and metabolomics data
suggested changes to lipid metabolism. The effects of changed lipid metabolism could be correlated with
activation of PPAR as suggested by the transcriptomics data. We found that the effects were measurable at
a lower level of exposure using metabolomics than what was measurable by more conventional
histopathological analyses. The changes to the metabolome were less specific than a change in physiology.
However, the metabolite profile of the plasma can help to understand how toxic compounds affect
animals, and possibly humans, suggesting a role for systems biology in general and metabolomics in
particular in future toxicological investigations into low dose effects.

47
5.3 Further testing of the usefulness of metabolomics in low dose toxicity
experiments
Paper IV + V: “Metabolic Profiling of Rats and their Offspring Exposed to Low Doses of Bisphenol A” and
“Comparison of biological effect profiles of chemical congeners using metabolite pattern determination
the example of selenium nanoparticles and sodium selenite”
Bisphenol A (BPA) is an industrial chemical used to manufacture polycarbonate plastics, epoxy resins and
thermal printings (Boucher et al 2014). BPA is detectable in consumer products, food, water and dust
(Alonso‐Magdalena et al 2008; Asahi et al 2010; Boucher et al 2014). Human exposure has been confirmed
by analysis of urine, blood and tissue (Asahi et al 2010). The biomarkers of BPA is the compound itself along
with the major metabolite; glucuronidated BPA (Bjerregaard et al 2007).
Selenium (Se) is an element that, in trace amounts, is essential for humans. Se is incorporated as
selenocysteine, and selenium is necessary for the synthesis and catalytic function of selenoproteins such as
peroxidases and reductases (Nogueira and Rocha 2011). At high doses, Se becomes toxic, exhibiting effects
such as emaciation and weight loss (Benko et al 2012).

48
As shown above, the metabolic platform was able to detect effects even at low levels of exposure. In a
follow‐up study, effects of low dose exposure to BPA 25 and 250 µg/kg/day, as well as low dose exposure
to selenium were examined. In the BPA study, mothers were exposed orally to the compounds; offspring
indirectly via placenta and milk. For all three groups of animals, significant changes to the metabolite
profile were found. The mothers exhibited decreased monoglyceride levels e.g. MG(18:0) and an increased
cholesterol concentration (Paper IV). Female pups showed decreased levels of one diacylglycerol (Paper IV).
The male pups showed changes to the phospholipids and diacylglycerol, as shown below, see Figure 16.
Neither the mothers nor the female pups exhibited changes to plasma phospholipid concentrations.
Figure 16 Significantly changed metabolites from the male pups plasma. As shown in a‐c three short chain phospholipids (lyso‐PCs) are significantly increased by exposure to 0.25 mg/kg/day of BPA. Furthermore, two diacylglycerols (DGs) were found to be increased by BPA exposure. One metabolite, figure f, was interesting as it was increased in the male pups while being decreased in the mother animals. The metabolite, not identified, was a pseudoion with the m/z value of 359.149 (Paper IV).
The results confirmed that it was feasible to detect changes in the metabolome upon exposure to low dose
BPA. The concentrations tested in this study should, according to conventional toxicology approach, not
cause any adverse effect on humans (Tyl 2013).
In the selenium study, metabolome analysis was used to examine if changes in urine metabolites upon
exposure to ionic selenium were different than those exposed to nano‐particle selenium. This could provide
information on whether selenium nanoparticles have the same mechanism of action and toxicological
potency as selenium ions. Figure 17 shows that the pattern of effects was statistically similar for the two

49
different selenium formulations. Together with findings for other metabolites, these findings suggest
similar mechanism of action and toxicological potency of selenium nanoparticles and selenium ions (Paper
V). Thus, this study serves to demonstrate the usefulness of metabolomics to compare effects of different
congeners in terms of potency and mechanisms of action.
Figure 17 Plot of two pseudoions found significantly changed upon selenium exposure. As shown on the graph there are two control groups, BSA vehicle and H20 vehicle. From the intensity of the two compounds it can be seen that there is a similar level of the two metabolites in the animals exposed to high concentration of selenium from both the ionic and the nanoparticle sources (Paper V).
Multiple studies have suggested effects on the plasma metabolome exposed to a low dose of chemicals
(Vandenberg et al 2012; Chen et al 2014). The data evaluated in this section are from low dose exposure
studies of PFNA, BPA and selenium (Paper I, III and V). The analysis leads to questions related to the
relevance of such studies, which will be discussed below.
Figure 18 3D PLS‐DA from a Selenium experiment. The water and BSA vehicle are clustered differently in the 3D PLS‐DA plot (Paper V).

50
PartVI:Discussion
The increased focus on metabolic changes in the research community has widened the application scope of
the metabolomics approach. In toxicology, it has been used since the late 1980’s and is now used in
disciplines such as pharmaceutical development, food chemistry and environmental research (Mushtaq et
al 2014). According to Johnson et al. the metabolome is central for the exploration of toxic effects because
metabolites are involved in the mechanisms underlying most effects in the mammalian body (Johnson et al
2011). Metabolomics approaches have been applied to a variety of organisms e.g. yeast, fungi, rodents and
humans. In humans, for the analysis of for instance urine, blood and tissue samples (Souverain et al 2004;
Smedsgaard and Nielsen 2005; Bajad et al 2006; Wishart 2008; Psychogios et al 2011; Tulipani et al 2013).
In the current study, metabolomics was used to investigate its usefulness in toxicology. It was to detect
changes in the plasma metabolome upon exposure of rats to low concentration of toxic chemicals. The
observed changes were mainly in the non‐polar fraction of the plasma metabolome, particularly
phosphotidylcholine and glycerides, discussed in section 6.1. It can be questioned if an alternative method
could have been used for the study of the polar fraction to identify changes. This will be addressed in
section 6.2. Several interesting effects were found at low dose exposure; however the question is whether
these were adverse. This will be addressed in section 6.3.
6.1Observedchangesinthelipidfraction
In the current study, we observed multiple effects in the plasma lipid fraction by metabolomics (Paper II, IV
and V). In recent years, changes in the lipid metabolome has received increasing attention (Ikeda et al
2009; Chen et al 2011). It has been suggested that lipids are not only part of energy storage, but also affects
signaling: For example, phospholipids are known regulators of cellular death (Saito et al 2014). Analysis of
the lipidome has a wide range of application e.g. analysis of cholesterol and triacylglycerol (TAG) levels in
obesity patients (Adams and Lewis 1982; Seidlová‐Wuttke et al 2005), to analyses focusing on toxic
chemicals such as arsenic. Several studies have been performed that focus on changes in the lipid profile
(Funk 2001; Sandra et al 2010; Ferreiro‐Vera 2012; Liu et al 2013; Choi et al 2014; García‐Sevillano et al
2014) and include phospholipid and neutral lipid analyses (Chen et al 2011; Liu et al 2013). The method
performed well and yielded information regarding phospholipids and neutral lipids, as well as cholesterol.
Moreover, a correlation between a low‐dose exposure of environmental chemicals and effects on the
metabolome was revealed (Paper III and IV).

51
In the BPA experiment we observe changes in neutral lipid concentrations; e.g. MG(18:0) and MG(16:0)
(Paper IV) and in DG(18:1/18:3) and DG(18:2/16:0) as discussed in Paper II. This highlights the need for
understanding what impact a change in neutral lipids has on physiology when evaluating metabolism.
Furthermore, increased short chain phospholipid levels were observed for the male pups at low‐dose
exposure levels.
A comparison between the study conducted by Alonso‐Malanga et al. and our BPA study (Paper IV)
suggests that a low‐dose exposure of BPA can interfere with insulin production, resulting in increased
glucose uptake (Alonso‐Magdalena et al 2008). Our results suggest a specific mode of action involving
changes in the lipodome (Paper IV). This might be a contributing factor, alongside a general increase in
obesity, for the steady increase of life‐style diseases in the Western world, including decreased semen
quality in European populations (Skakkebaek et al 2006). Lui et al. (Liu et al 2013) show that the
phospholipid composition is changed in type 2 diabetes patients, which we also observed in male pups. Our
results do not offer a specific answer to the question regarding the impact of toxic chemicals on life‐style
disease. But it shows that the current method can detect changes in the metabolome even at low‐dose
exposure, which may serve as a tool in the future diagnosis and investigation of these diseases.
6.2Instrumentation
UHPLC‐qTOF‐MS has been used throughout this project to identify metabolites based on mass and MS/MS
patterns. In the PFNA study (Paper II) we found that UHPLC‐qTOF‐MS, combined with the sampling strategy
(described above), enabled measurements of changes in the rat metabolome. By using two different
solvent systems for the UHPLC protocol (a hydrophobic and a hydrophilic solvent; see Materials and
Methods), we obtained better separation of the metabolites and a reduced ion suppression compared to
the protein precipitation method (Paper I). In general, the method identified a wide range of non‐polar
compounds with sharp chromatographic peaks. Regarding the separation of high molecular weight
phospholipids, however, peak broadening complicated the identification process (Paper I). The method did
not provide separation of polar compounds such as amino acids or urea. This can be achieved by addition
of a HILIC column and a gradient system for separating the polar compounds (Bajad et al 2006; Boudah et al
2014). In the present project (Paper II), NMR was used to identify concentration changes in polar
metabolites, but no significant changes were found at low dose exposure. At higher doses, the method
revealed changes in 7 out of 43 analyzed metabolites. For analysis of the polar fraction, others have
successfully used NMR to determine differences in the metabolome (Wishart 2008; Psychogios et al 2011;
Zeng et al 2013). CE‐MS and NMR techniques have been used to study changes in the plasma metabolome
following exposure to toxic environmental chemicals such as BPA (Xu and Xu 2013).

52
The interest in the non‐polar part of the metabolome has recently been highlighted (Taguchi et al 2005;
Takatera et al 2006; Sandra et al 2010; Ferreiro‐Vera 2012). Choi et al. (Choi et al 2014) have developed a
method based on a mixture of equal amounts of isopropanol and acetonitrile in the solvent system to
improve the resolution and to provide a better separation of the phospholipids. This, in combination with a
lower percentage organic solvent in the starting condition of the hydrophobic gradient system, might
enhance the chromatography of the lipidome.
Further improvement of the present procedure could be to combine it with other analytical instruments
such as gas chromatography. This has the advantage of being able to analyze the polar metabolites by GC‐
MS. Furthermore, the identification process using GC‐MS can be simplified, as library searches identifying
the metabolites are possible (Fiehn 2001; Fiehn 2002). Multiple studies have now used a combination of
these techniques to observe changes in the polar fraction of the plasma metabolome following exposure to
toxic chemicals (Bajad et al 2006; Sangster et al 2006; Bajad and Shulaev 2007; Lu et al 2008; Boudah et al
2014) (Xu and Xu 2013). By using similar approaches, we most likely would have observed further changes
to the polar fraction. However, the method would have been more time consuming.
6.3Lowdoseexposure:adverseorbiochemicaleffect?
The aim of this part of the work was to investigate whether a metabolomics approach could be applied to
detect changes in the plasma metabolome of rats given low doses. The study was performed by comparing
a metabolome analysis with a conventional toxicity approach of rats exposed to either low or high doses of
chemicals (Paper II and III). It was found that metabolome analysis, for some parameters, could detect
effects similar to those using conventional toxicology protocols e.g. an increase in corticosterone. To
further investigate low dose exposure, two additional experiments were conducted; exposure of BPA or
selenium.
One major question following on from these studies, were if the observed effects were transient (that is, an
acute but reversible physiological response to chemical insult), or adverse (as in prolonged compromised
physiology caused by chemical insult)?
A toxic insult to an organism will likely cause a metabolome change, which is also seen where physiological
effects are not observed. In the Selenium study (Paper V), a difference in the PLS‐DA plots between the
clustering of bovine serum albumin controls and the water controls was observed (see Figure 18). This
indicates that even low dose exposure to a non‐toxic compound can result in measurable effects in the
metabolome. Changes in plasma metabolites can also be used to compare mechanisms of action and
effect‐levels of different congeners, although no definitive identification is obtained (Paper V). In paper V,

53
we conclude that it is highly likely that two different formulations of Se (nanoparticles and ions) have
similar mechanisms of action, although we could not specify the identities of all the significantly changed
metabolites (Paper V).
The conventional toxicological approach is to establish dose levels at which compounds exert adverse
effects. In traditional studies, pathological changes in clinical appearances or in tissues are signs of adverse
effects (Nielsen et al 2010a). Metabolome analysis enables the determination of changes to metabolite
concentrations even at low‐dose exposures. The changes can then be linked to pathological observations or
potential adverse effects. Metabolomics approaches have previously been used to reveal effects in animals
exposed to toxic chemicals (German et al 2005; Shulaev 2006; Robertson et al 2011; Johnson et al 2012).
Ravenzwaays et al. concluded that the metabolomics and the conventional approach display “nearly equal
sensitivity toward determination of NOAEL”; for one case a reduced body weight was observed for both
sexes, whereas a change in metabolite levels was observed in females, but not males (van Ravenzwaay et al
2014).
From the results obtained in this thesis, there is no clear answer as to whether low doses of the specific
chemicals affect metabolism to cause adverse effects. Although, the effect observed for PFNA on
corticosterone levels could be interpreted as an adverse effect. This, however, does not preclude that, for
some chemicals, the use of systems biology in general and metabolome analysis in particular will yield
information that can be extrapolated to adverse effects, e.g. effects on cholesterol metabolism or sets of
biomarkers indicating liver disease. Also, the effects observed in the metabolome following low‐dose
exposure will increase our understanding of how environmental chemicals affect rats, and possibly humans.
In the future, with further advances in systems biology, we expect metabolomics to contribute significantly
towards toxicology testing of whole organisms. Information obtained from metabolomics will assist in the
understanding of the mode of action of toxic chemicals. Many studies have been performed analyzing the
changes in the metabolome upon exposure to toxic chemicals. Changes in the metabolome reflects the
mode of action of a toxic compound and the pattern of changes metabolites is a marker for the toxic effect
e.g. hepatotoxicity. Identification of markers of various toxic effects from animal studies will in the future
provide a database which can be used for screening of chemicals for specific toxic effects.

54
7PartVII:Conclusion
The aim of this thesis was to use metabolomics to study effect‐outcomes in toxicology experiments,
particularly at low dose exposure. A method was developed that allows for analysis of plasma from rats
having been exposed to low doses of toxic compounds. Results obtained from this method were
subsequently compared to results obtained through conventional toxicology protocols. Finally, the method
was used to suggest mode of action of toxic chemicals.
The analytical method was based on SPE sub‐fractioning of the metabolome into a phospholipid, a lipid and
a polar fraction followed by UHPLC‐qTOF analysis. The applicability of the method was demonstrated by
showing changes to the metabolome of animals having been administered a chemical dose comparable
with human exposure of the endocrine disruptor PFNA (Paper I). Nevertheless, there is still room for
improvements to the method, for instance changing the phospholipid solvent and running the polar
fraction in HILIC mode.
To further validate the method, comparisons to a conventional toxicology approach were performed. The
observed effect a low dose of PFNA had on corticosterone correlated with observations from the
conventional toxicology approach using a targeted LCMS approach (Paper II and III).
To investigate the potential impact of low dose exposure, experiments with PFNA, PFNA+Mix, BPA and
selenium were performed in rats. In the PFNA ± Mix exposure experiment, the addition of Mix resulted in a
significantly different metabolite profile with decreased levels of neutral lipids and phospholipids (Paper
III). In the BPA experiment, the rat mothers showed a decreased level of MG(16:0) and MG(18:0), while the
male pups showed increased levels of lyso‐phospholipids (Paper IV). The selenium experiment showed that
ionic selenium and nano‐particle selenium induced similar changes in rat urine, which indicates a minor
importance of the ionization state of selenium (Paper V). In all three experiments changes were observed
following low‐dose exposures (Paper III, IV and V).
An encouraging finding was that metabolomics assisted in suggesting possible modes of action for PFNA
and BPA toxicity. PFNA was suggested to induce hepatic steatosis (Paper III), while BPA changed plasma
cholesterol and phospholipid concentrations (Paper IV).
We observed that a mixture of 14 chemicals at high‐end human exposure levels (Mix), low‐ to mid‐range
doses of PFNA, or a combination of the two, had the potential to alter the blood plasma levels of
diacylglycerols, PCs, and cholesterol derivatives, mimicking some of the features of metabolic syndrome.
These effects can also suggest an inflammatory response, but in either case warrant further investigations.

55
We also observed more subtle changes to the liver transcriptome following Mid PFNA exposure irrespective
of Mix, suggesting that the hepatic effects were driven by PFNA. Transcriptomics analysis suggests
increased PPAR activation, resulting in lowered lipid concentration and increased β‐oxidation. Hence, this
study demonstrates that low‐dose exposure to chemical mixtures can affect the metabolome and cause
disturbed lipid homeostasis, and that ‘omics’ approaches are powerful tools to detect smaller changes not
readily observable at the macroscopic level.
The BPA experiment revealed a change to cholesterol levels in the mothers and a general change to the
lipidome, which could be related to effects due to higher levels of insulin in the plasma; in turn resulting in
an increased biosynthesis of triacylglycerol and a decrease in mono‐ and diacylglycerols in the plasma.
Using a metabolomics approach reveals changes to the metabolome which could not be foreseen using
regular toxicological approaches. We applied a new protocol which can improve the understanding of toxic
compounds and assist in toxicology‐testing to identify possible mechanism of actions. Furthermore, the
metabolomics approach can help in identifying specific pathways or systemic changes caused by a toxic
chemical. The metabolite changes in both the PFNA and BPA papers are very interesting, but the changes
might not give the full picture of how the respective compounds act. From this study, we show that an
metabolomics approach can be used to increase our understanding of how toxic chemicals affect
physiological parameters. It can be discussed if metabolomics can be used as a “stand‐alone” approach, but
we believe that it is important to use this tool as it adds another dimension to that of conventional
toxicology testing.

56
References:
Adams R, Lewis JC (1982) Effects of Gossypol on Reproductive Functions of Male Cynomolgus ( Macaca Fascicularis ) t and Endocrine Monkeys properties and some of their. 241–252.
Alonso‐Magdalena P, Ropero AB, Carrera MP, et al (2008) Pancreatic insulin content regulation by the estrogen receptor ER alpha. PLoS One 3:e2069. doi: 10.1371/journal.pone.0002069
Alpert A (1990) Hydrophilic‐interaction chromatography for the separation of peptides, nucleic acids and other polar compounds. J Chromatogr A 499:177–196.
Androutsopoulos VP, Hernandez AF, Liesivuori J, Tsatsakis AM (2013) A mechanistic overview of health associated effects of low levels of organochlorine and organophosphorous pesticides. Toxicology 307:89–94. doi: 10.1016/j.tox.2012.09.011
Ang JE, Revell V, Mann A, et al (2012) Identification of human plasma metabolites exhibiting time‐of‐day variation using an untargeted liquid chromatography‐mass spectrometry metabolomic approach. Chronobiol Int 29:868–81. doi: 10.3109/07420528.2012.699122
Antoine DJ, Mercer a E, Williams DP, Park BK (2009) Mechanism‐based bioanalysis and biomarkers for hepatic chemical stress. Xenobiotica 39:565–577. doi: 10.1080/00498250903046993
Asahi J, Kamo H, Baba R, et al (2010) Bisphenol A induces endoplasmic reticulum stress‐associated apoptosis in mouse non‐parenchymal hepatocytes. Life Sci 87:431–8. doi: 10.1016/j.lfs.2010.08.007
Austdal M, Skråstad RB, Gundersen AS, et al (2014) Metabolomic biomarkers in serum and urine in women with preeclampsia. PLoS One 9:e91923. doi: 10.1371/journal.pone.0091923
Axelstad M, Boberg J, Hougaard KS, et al (2011) Effects of pre‐ and postnatal exposure to the UV‐filter octyl methoxycinnamate (OMC) on the reproductive, auditory and neurological development of rat offspring. Toxicol Appl Pharmacol 250:278–90. doi: 10.1016/j.taap.2010.10.031
Bajad S, Shulaev V (2007) Highly‐parallel metabolomics approaches using LC‐MS for pharmaceutical and environmental analysis. Trends Analyt Chem 26:625–636. doi: 10.1016/j.trac.2007.02.009
Bajad SU, Lu W, Kimball EH, et al (2006) Separation and quantitation of water soluble cellular metabolites by hydrophilic interaction chromatography‐tandem mass spectrometry. J Chromatogr A 1125:76–88. doi: 10.1016/j.chroma.2006.05.019
Bartel J, Krumsiek J, Theis FJ (2013) Statistical Mehods for the Analysis of High‐Throughout Metabolomics Data. Comput. Struct. Biotechnol. J. 4:
Benjamini Y, Hochberg Y (1995) Controlling the False Discovery Rate: A Practical and Powerful Approach to Multiple Testing. J R Stat Soc Ser B 57:289 – 300. doi: 10.2307/2346101
Benko I, Nagy G, Tanczos B, et al (2012) Subacute toxicity of nano‐selenium compared to other selenium species in mice. Env Toxicol Chem 31:2812–2820.

57
Berg JM, Tymoczko JL, Stryer L (2006) Biochemistry, 6th edn. W. H. Freeman and Company
Bird SS, Marur VR, Sniatynski MJ, et al (2011) Serum lipidomics profiling using LC‐MS and high‐energy collisional dissociation fragmentation: focus on triglyceride detection and characterization. Anal Chem 83:6648–57. doi: 10.1021/ac201195d
Bjerregaard P, Andersen SB, Pedersen KL, et al (2007) Orally administered bisphenol a in rainbow trout (Oncorhynchus mykiss): estrogenicity, metabolism, and retention. Environ Toxicol Chem 26:1910–5. doi: 10.1897/06‐645R.1
Boucher JG, Boudreau a, Atlas E (2014) Bisphenol A induces differentiation of human preadipocytes in the absence of glucocorticoid and is inhibited by an estrogen‐receptor antagonist. Nutr Diabetes 4:e102. doi: 10.1038/nutd.2013.43
Boudah S, Olivier M‐F, Aros‐Calt S, et al (2014) Annotation of the human serum metabolome by coupling three liquid chromatography methods to high‐resolution mass spectrometry. J Chromatogr B Analyt Technol Biomed Life Sci 966:34–47. doi: 10.1016/j.jchromb.2014.04.025
Breier M, Wahl S, Prehn C, et al (2014) Targeted metabolomics identifies reliable and stable metabolites in human serum and plasma samples. PLoS One 9:1–11. doi: 10.1371/journal.pone.0089728
Brown SC, Kruppa G, Dasseux J‐L (2005) Metabolomics applications of FT‐ICR mass spectrometry. Mass Spectrom Rev 24:223–31. doi: 10.1002/mas.20011
Burton L, Ivosev G, Tate S, et al (2008) Instrumental and experimental effects in LC‐MS‐based metabolomics. J Chromatogr B Anal Technol Biomed Life Sci 871:227–235. doi: 10.1016/j.jchromb.2008.04.044
Büscher JM, Czernik D, Ewald JC, et al (2009) Cross‐platform comparison of methods for quantitative metabolomics of primary metabolism. Anal Chem 81:2135–43. doi: 10.1021/ac8022857
Callahan DL, De Souza D, Bacic A, Roessner U (2009) Profiling of polar metabolites in biological extracts using diamond hydride‐based aqueous normal phase chromatography. J Sep Sci 32:2273–80. doi: 10.1002/jssc.200900171
Chen M, Zhou K, Chen X, et al (2014) Metabolomic analysis reveals metabolic changes caused by bisphenol A in rats. Toxicol Sci 138:256–67. doi: 10.1093/toxsci/kfu016
Chen S, Chu Y, Zhao X, et al (2011) HPLC‐MS‐Based Metabonomics Reveals Disordered Lipid Metabolism in Patients with Metabolic Syndrome. J Anal Sci Technol 2:A173–A178. doi: 10.5355/JAST.2011.A173
Choi JM, Kim T‐E, Cho J‐Y, et al (2014) Development of lipidomic platform and phosphatidylcholine retention time index for lipid profiling of rosuvastatin treated human plasma. J Chromatogr B Analyt Technol Biomed Life Sci 944:157–65. doi: 10.1016/j.jchromb.2013.10.029
Christiansen S, Axelstad M, Boberg J, et al (2014) Low‐dose effects of bisphenol A on early sexual development in male and female rats. Reproduction 147:477–87. doi: 10.1530/REP‐13‐0377

58
Christiansen S, Scholze M, Dalgaard M, et al (2009) Synergistic disruption of external male sex organ development by a mixture of four antiandrogens. Environ Health Perspect 117:1839–46. doi: 10.1289/ehp.0900689
Colborn T, vom Saal FS, Soto a M (1993) Developmental effects of endocrine‐disrupting chemicals in wildlife and humans. Environ Health Perspect 101:378–84.
Comparisons M, Dice E (2002) B.M. Brown T.P. Hettmansperger. 44:427–438.
Connolly L, Ropstad E, Verhaegen S (2011) In vitro bioassays for the study of endocrine‐disrupting food additives and contaminants. TrAC Trends Anal Chem 30:227–238. doi: 10.1016/j.trac.2010.10.009
Crofton KM, Craft ES, Hedge JM, et al (2005) Thyroid‐Hormone–Disrupting Chemicals: Evidence for Dose‐Dependent Additivity or Synergism. Environ Health Perspect 113:1549–1554. doi: 10.1289/ehp.8195
Demur C, Métais B, Canlet C, et al (2013) Dietary exposure to a low dose of pesticides alone or as a mixture: The biological metabolic fingerprint and impact on hematopoiesis. Toxicology 308:74–87. doi: 10.1016/j.tox.2013.03.004
Dunn WB, Elis DI (2005) Metabolomics: Current analytical platforms and methodologies. Trends Anal Chem 24:285–294.
Ebbels TMD, Cavill R (2009) Bioinformatic methods in NMR‐based metabolic profiling. Prog Nucl Magn Reson Spectrosc 55:361–374. doi: 10.1016/j.pnmrs.2009.07.003
Ellis RP, Spicer JI, Byrne JJ, et al (2014) 1H NMR metabolomics reveals contrasting response by male and female mussels exposed to reduced seawater pH, increased temperature, and a pathogen. Environ Sci Technol 48:7044–7052. doi: 10.1021/es501601w
Evans NP, North T, Dye S, Sweeney T (2004) Differential effects of the endocrine‐disrupting compounds Bisphenol‐A and Octylphenol on gonadotropin secretion, in prepubertal ewe lambs. Domest Anim Endocrinol 26:61–73. doi: 10.1016/j.domaniend.2003.09.005
Fahy E, Subramaniam S, Murphy RC, et al (2009) Update of the LIPID MAPS comprehensive classification system for lipids. J Lipid Res 50 Suppl:S9–14. doi: 10.1194/jlr.R800095‐JLR200
Fang X, Gao G, Xue H, et al (2012a) Exposure of perfluorononanoic acid suppresses the hepatic insulin signal pathway and increases serum glucose in rats. Toxicology 294:109–15. doi: 10.1016/j.tox.2012.02.008
Fang X, Zou S, Zhao Y, et al (2012b) Kupffer cells suppress perfluorononanoic acid‐induced hepatic peroxisome proliferator‐activated receptor α expression by releasing cytokines. Arch Toxicol 86:1515–25. doi: 10.1007/s00204‐012‐0877‐4
Feng X, Liu X, Luo Q, Liu B (2008) MASS SPECTROMETRY IN SYSTEMS BIOLOGY : AN OVERVIEW. Mass Spectrom Rev 635– 660. doi: 10.1002/mas
Ferreiro‐Vera C (2012) Comparison of sample preparation approaches for phospholipids profiling in human serum by liquid chromatography–tandem mass spectrometry. … Chromatogr A 21–28.

59
Fiehn O (2001) Combining genomics, metabolome analysis, and biochemical modelling to understand metabolic networks. Comp Funct Genomics 2:155–68. doi: 10.1002/cfg.82
Fiehn O (2008) Extending the breadth of metabolite profiling by gas chromatography coupled to mass spectrometry. Trends Analyt Chem 27:261–269. doi: 10.1016/j.trac.2008.01.007
Fiehn O (2002) Metabolomics‐‐the link between genotypes and phenotypes. Plant Mol Biol 48:155–71.
Fiehn O, Robertson D, Griffin J, et al (2007) The metabolomics standards initiative (MSI). Metabolomics 3:175–178. doi: 10.1007/s11306‐007‐0070‐6
Flores‐Valverde AM, Horwood J, Hill EM (2010) Disruption of the steroid metabolome in fish caused by exposure to the environmental estrogen 17alpha‐ethinylestradiol. Environ Sci Technol 44:3552–8. doi: 10.1021/es9039049
Frazier JM (1991) APPLICATION OF THE BASIC TOXICOLOGICAL SCREEN I NG PROCESS TO PROBLEMS IN BOUND RESIDUE TOXICITY * t. 22:821–827.
Frische T, Faust M, Meyer W, Backhaus T (2009) Toxic masking and synergistic modulation of the estrogenic activity of chemical mixtures in a yeast estrogen screen (YES). Environ Sci Pollut Res Int 16:593–603. doi: 10.1007/s11356‐009‐0184‐7
Funk CD (2001) Prostaglandins and leukotrienes: advances in eicosanoid biology. Science 294:1871–5. doi: 10.1126/science.294.5548.1871
Gage R, Stopher DA (1998) Short communication A rapid HPLC assay for voriconazole in human plasma. 17:1449–1453.
García‐Sevillano MA, Contreras‐Acuña M, García‐Barrera T, et al (2014) Metabolomic study in plasma, liver and kidney of mice exposed to inorganic arsenic based on mass spectrometry. Anal Bioanal Chem 406:1455–69. doi: 10.1007/s00216‐013‐7564‐z
German JB, Hammock BD, Watkins SM (2005) Metabolomics: building on a century of biochemistry to guide human health. Metabolomics 1:3–9. doi: 10.1007/s11306‐005‐1102‐8
Gomase V, Changbhale S, Patil S, Kale K (2008) Metabolomics. Curr Drug Metab 9:89–98. doi: 10.2174/138920008783331149
Goodacre R, Vaidyanathan S, Dunn WB, et al (2004) Metabolomics by numbers: acquiring and understanding global metabolite data. Trends Biotechnol 22:245–52. doi: 10.1016/j.tibtech.2004.03.007
Guruge KS, Yeung LWY, Yamanaka N, et al (2006) Gene expression profiles in rat liver treated with perfluorooctanoic acid (PFOA). Toxicol Sci 89:93–107. doi: 10.1093/toxsci/kfj011
Hu J, Zhang Z, Shen W‐J, Azhar S (2010) Cellular cholesterol delivery, intracellular processing and utilization for biosynthesis of steroid hormones. Nutr Metab (Lond) 7:47. doi: 10.1186/1743‐7075‐7‐47

60
Idborg H, Zamani L, Edlund P‐O, et al (2005) Metabolic fingerprinting of rat urine by LC/MS Part 1. Analysis by hydrophilic interaction liquid chromatography‐electrospray ionization mass spectrometry. J Chromatogr B Analyt Technol Biomed Life Sci 828:9–13. doi: 10.1016/j.jchromb.2005.07.031
Ikeda K, Oike Y, Shimizu T, Taguchi R (2009) Global analysis of triacylglycerols including oxidized molecular species by reverse‐phase high resolution LC/ESI‐QTOF MS/MS. J Chromatogr B Analyt Technol Biomed Life Sci 877:2639–47. doi: 10.1016/j.jchromb.2009.03.047
Jaremek M, Yu Z, Mangino M, et al (2013) Alcohol‐induced metabolomic differences in humans. Transl Psychiatry 3:e276. doi: 10.1038/tp.2013.55
Johnson CH, Patterson AD, Idle JR, Gonzalez FJ (2012) Xenobiotic metabolomics: major impact on the metabolome. Annu Rev Pharmacol Toxicol 52:37–56. doi: 10.1146/annurev‐pharmtox‐010611‐134748
Johnson KJ, McDowell EN, Viereck MP, Xia JQ (2011) Species‐specific dibutyl phthalate fetal testis endocrine disruption correlates with inhibition of SREBP2‐dependent gene expression pathways. Toxicol Sci 120:460–74. doi: 10.1093/toxsci/kfr020
Jung J, Kim S‐H, Lee H‐S, et al (2013) Serum metabolomics reveals pathways and biomarkers associated with asthma pathogenesis. Clin Exp Allergy 43:425–33. doi: 10.1111/cea.12089
Kanehisa M, Goto S (2000) KEGG: kyoto encyclopedia of genes and genomes. Nucleic Acids Res 28:27–30.
Karami‐Mohajeri S, Abdollahi M (2011) Toxic influence of organophosphate, carbamate, and organochlorine pesticides on cellular metabolism of lipids, proteins, and carbohydrates: A systematic review. Hum Exp Toxicol 30:1119–1140. doi: 10.1177/0960327110388959
Kim H‐J, Kim JH, Noh S, et al (2011) Metabolomic analysis of livers and serum from high‐fat diet induced obese mice. J Proteome Res 10:722–31. doi: 10.1021/pr100892r
Klavins K, Chu DB, Hann S, Koellensperger G (2014) Fully automated on‐line two‐dimensional liquid chromatography in combination with ESI MS/MS detection for quantification of sugar phosphates in yeast cell extracts. Analyst 1512–1520. doi: 10.1039/c3an01930f
Klenow S, Heinemeyer G, Brambilla G, et al (2013) Dietary exposure to selected perfluoroalkyl acids (PFAAs) in four European regions. Food Addit Contam Part A Chem Anal Control Expo Risk Assess 30:2141–51. doi: 10.1080/19440049.2013.849006
Klaassen (2008) Chaptor 2: Principles of Toxicology. Casarett Doulls Toxicol. pp 11–45
Kobayashi T, Nishiumi S, Ikeda A, et al (2013) A novel serum metabolomics‐based diagnostic approach to pancreatic cancer. Cancer Epidemiol Biomarkers Prev 22:571–9. doi: 10.1158/1055‐9965.EPI‐12‐1033
Kozlowska‐Tylingo K, Namieśnik J, Górecki T (2010) Determination of Estrogenic Endocrine Disruptors in Environmental Samples—A Review of Chromatographic Methods. Crit Rev Anal Chem 40:194–201. doi: 10.1080/10408347.2010.490488
Larson H, Chan E, Sudarsanam S, Johnson DE (2013) Computational Toxicology. 930:253–273. doi: 10.1007/978‐1‐62703‐059‐5

61
Lau C (2012) Perfluorinated compounds. EXS 101:47–86. doi: 10.1007/978‐3‐7643‐8340‐4_3
Lau C, Anitole K, Hodes C, et al (2007) Perfluoroalkyl acids: a review of monitoring and toxicological findings. Toxicol Sci 99:366–94. doi: 10.1093/toxsci/kfm128
Leichtle AB, Dufour JF, Fiedler GM (2013) Potentials and pitfalls of clinical peptidomics and metabolomics. Swiss Med Wkly 143:1–13. doi: 10.4414/smw.2013.13801
Lewis JH, Ranard RC, Caruso A, et al (1989) Amiodarone hepatotoxicity: prevalence and clinicopathologic correlations among 104 patients. Hepatology 9:679–685.
Lindon JC, Nicholson JK (2008) Systems biology Metabolomics. Nature 455:1054–1056. doi: 10.1111/j.1742‐4658.2007.05673.x
Liu L, Wang M, Yang X, et al (2013) Fasting serum lipid and dehydroepiandrosterone sulfate as important metabolites for detecting isolated postchallenge diabetes: serum metabolomics via ultra‐high‐performance LC‐MS. Clin Chem 59:1338–48. doi: 10.1373/clinchem.2012.200527
Loeschner K, Hadrup N, Hansen M, et al (2014) Absorption, distribution, metabolism and excretion of selenium following oral administration of elemental selenium nanoparticles or selenite in rats. Metallomics 6:330–7.
Lu W, Bennett BD, Rabinowitz JD (2008) Analytical strategies for LC‐MS‐based targeted metabolomics. J Chromatogr B Analyt Technol Biomed Life Sci 871:236–42. doi: 10.1016/j.jchromb.2008.04.031
McBurney RN, Hines WM, Von Tungeln LS, et al (2009) The liver toxicity biomarker study: phase I design and preliminary results. Toxicol Pathol 37:52–64. doi: 10.1177/0192623308329287
Merhi M, Demur C, Racaud‐Sultan C, et al (2010) Gender‐linked haematopoietic and metabolic disturbances induced by a pesticide mixture administered at low dose to mice. Toxicology 267:80–90. doi: 10.1016/j.tox.2009.10.024
Michell AW, Mosedale D, Grainger DJ, Barker R a. (2008) Metabolomic analysis of urine and serum in Parkinson’s disease. Metabolomics 4:191–201. doi: 10.1007/s11306‐008‐0111‐9
Michopoulos F, Edge AM, Theodoridis G, Wilson ID (2010) Application of turbulent flow chromatography to the metabonomic analysis of human plasma: comparison with protein precipitation. J Sep Sci 33:1472–9. doi: 10.1002/jssc.200900789
Moco S, Vervoort J, Moco S, et al (2007) Metabolomics technologies and metabolite identification. TrAC ‐ Trends Anal Chem 26:855–866. doi: 10.1016/j.trac.2007.08.003
Monosson E (2005) Chemical mixtures: considering the evolution of toxicology and chemical assessment. Environ Health Perspect 113:383–390.
Moser VC, Simmons JE, Gennings C (2006) Neurotoxicological interactions of a five‐pesticide mixture in preweanling rats. Toxicol Sci 92:235–45. doi: 10.1093/toxsci/kfj189

62
Mushtaq MY, Choi YH, Verpoorte R, Wilson EG (2014) Extraction for metabolomics: access to the metabolome. Phytochem Anal 25:291–306. doi: 10.1002/pca.2505
Nicholson JK, Lindon JC, Holmes E (1999) “Metabonomics”: understanding the metabolic responses of living systems to pathophysiological stimuli via multivariate statistical analysis of biological NMR spectroscopic data. Xenobiotica 29:1181–9. doi: 10.1080/004982599238047
Nicolucci C, Rossi S, Menale C, et al (2011) Biodegradation of bisphenols with immobilized laccase or tyrosinase on polyacrylonitrile beads. Biodegradation 22:673–83. doi: 10.1007/s10532‐010‐9440‐2
Nielsen E, Østergaard G, Larsen JC (2010a) International and Federal Bodies Involved in Risk Assessment of Chemical Substances. Toxicol. Risk Assess. Chem. pp 9–45
Nielsen E, Østergaard G, Larsen JC (2010b) Hazard Assessment. Toxicol. Risk Assess. Chem. p 411
Nogueira CW, Rocha JBT (2011) Toxicology and pharmacology of selenium: Emphasis on synthetic organoselenium compounds. Arch Toxicol 85:1313–1359. doi: 10.1007/s00204‐011‐0720‐3
Oliver SG, Winson MK, Kell DB, Baganz F (1998) Systematic functional analysis of the yeast genome. Trends Biotechnol 16:373–8.
Palsson B (2009) Metabolic systems biology. FEBS Lett 583:3900–4. doi: 10.1016/j.febslet.2009.09.031
Program NT, Agency USEP (2001) National Toxicology Program ’ s Report of the National Toxicology Program ’ s Report of the Endocrine Disruptors Low‐Dose Peer Review.
Psychogios N, Hau DD, Peng J, et al (2011) The human serum metabolome. PLoS One 6:e16957. doi: 10.1371/journal.pone.0016957
R Core Team (2012) R: A Language and Environment for Statistical Computing. R Found Stat Comput. doi: 10.1007/978‐3‐540‐74686‐7
Ramirez T, Daneshian M, Kamp H, Bois F (2013) T4 Report* Metabolomics in toxicology and preclinical research. ALTEX 30:209–225.
Rigas B, Rosenfeld LE, Barwick KW, et al (1986) Amiodarone hepatotoxicity. A clinicopathologic study of five patients. Ann Intern Med 104:348–351.
Ritchie ME, Silver J, Oshlack A, et al (2007) A comparison of background correction methods for two‐colour microarrays. Bioinformatics 23:2700–7. doi: 10.1093/bioinformatics/btm412
Robertson DG, Reily MD, Baker JD (2005) Metabonomics in preclinical drug development. Expert Opin Drug Metab Toxicol 1:363–376. doi: 10.1517/17425255.1.3.363
Robertson DG, Watkins PB, Reily MD (2011) Metabolomics in toxicology: preclinical and clinical applications. Toxicol Sci 120 Suppl :S146–70. doi: 10.1093/toxsci/kfq358
Robosky LC, Robertson DG, Baker JD, et al (2002) In vivo toxicity screening programs using metabonomics. Comb Chem High Throughput Screen 5:651–662. doi: 10.

63
Rosen MB, Thibodeaux JR, Wood CR, et al (2007) Gene expression profiling in the lung and liver of PFOA‐exposed mouse fetuses. Toxicology 239:15–33. doi: 10.1016/j.tox.2007.06.095
Saito K, Maekawa K, Ishikawa M, et al (2014) Glucosylceramide and lysophosphatidylcholines as potential blood biomarkers for drug‐induced hepatic phospholipidosis. Toxicol Sci 141:377–86. doi: 10.1093/toxsci/kfu132
Sandra K, Pereira ADS, Vanhoenacker G, et al (2010) Comprehensive blood plasma lipidomics by liquid chromatography/quadrupole time‐of‐flight mass spectrometry. J Chromatogr A 1217:4087–99. doi: 10.1016/j.chroma.2010.02.039
Sangster T, Major H, Plumb R, et al (2006) A pragmatic and readily implemented quality control strategy for HPLC‐MS and GC‐MS‐based metabonomic analysis. Analyst 131:1075–8. doi: 10.1039/b604498k
Seidlová‐Wuttke D, Jarry H, Christoffel J, et al (2005) Effects of bisphenol‐A (BPA), dibutylphtalate (DBP), benzophenone‐2 (BP2), procymidone (Proc), and linurone (Lin) on fat tissue, a variety of hormones and metabolic parameters: a 3 months comparison with effects of estradiol (E2) in ovariectomized (ovx) r. Toxicology 213:13–24. doi: 10.1016/j.tox.2005.05.001
Sharpe RM, Skakkebaek NE (2003) Male reproductive disorders and the role of endocrine disruption: Advances in understanding and identification of areas for future research. Pure Appl Chem 75:2023–2038. doi: 10.1351/pac200375112023
Shulaev V (2006) Metabolomics technology and bioinformatics. Brief Bioinform 7:128–39. doi: 10.1093/bib/bbl012
Sieber M, Hoffmann D, Adler M, et al (2009) Comparative analysis of novel noninvasive renal biomarkers and metabonomic changes in a rat model of gentamicin nephrotoxicity. Toxicol Sci 109:336–349. doi: 10.1093/toxsci/kfp070
Singh S, Li SS‐L (2011) Phthalates: toxicogenomics and inferred human diseases. Genomics 97:148–57. doi: 10.1016/j.ygeno.2010.11.008
Skakkebaek NE, Jørgensen N, Main KM, et al (2006) Is human fecundity declining? Int J Androl 29:2–11. doi: 10.1111/j.1365‐2605.2005.00573.x
Skov K, Kongsbak K, Hadrup N, et al (2015) Exposure to perfluorononanoic acid combined with a low‐dose mixture of 14 human‐relevant compounds disturbs energy/lipid homeostasis in rats. Metabolomics. doi: 10.1007/s11306‐015‐0802‐y
Smedsgaard J, Nielsen J (2005) Metabolite profiling of fungi and yeast: from phenotype to metabolome by MS and informatics. J Exp Bot 56:273–86. doi: 10.1093/jxb/eri068
Smith C a, O’Maille G, Want EJ, et al (2005) METLIN: a metabolite mass spectral database. Ther Drug Monit 27:747–51.
Smyth GK (2005) limma: Linear Models for Microarray Data. Bioinforma. Comput. Biol. Solut. Using R Bioconductor. pp 397–420

64
Smyth GK (2004) Linear models and empirical bayes methods for assessing differential expression in microarray experiments. Stat Appl Genet Mol Biol 3:Article3. doi: 10.2202/1544‐6115.1027
Smyth GK, Speed T (2003) Normalization of cDNA microarray data. Methods 31:265–273. doi: 10.1016/S1046‐2023(03)00155‐5
Snyder M, Gallagher JEG (2009) Systems biology from a yeast omics perspective. FEBS Lett 583:3895–9. doi: 10.1016/j.febslet.2009.11.011
Souverain S, Rudaz S, Veuthey J‐L (2004) Protein precipitation for the analysis of a drug cocktail in plasma by LC‐ESI‐MS. J Pharm Biomed Anal 35:913–20. doi: 10.1016/j.jpba.2004.03.005
Sud M, Fahy E, Cotter D, et al (2007) LMSD: LIPID MAPS structure database. Nucleic Acids Res 35:D527–32. doi: 10.1093/nar/gkl838
Ta AJA, Shukla M, Shuklab AK, et al (1994) Hydrophilic‐interaction chromatography carbohydrates of complex. 676:191–202.
Taguchi R, Houjou T, Nakanishi H, et al (2005) Focused lipidomics by tandem mass spectrometry. J Chromatogr B Analyt Technol Biomed Life Sci 823:26–36. doi: 10.1016/j.jchromb.2005.06.005
Takatera A, Takeuchi A, Saiki K, et al (2006) Quantification of lysophosphatidylcholines and phosphatidylcholines using liquid chromatography‐tandem mass spectrometry in neonatal serum. J Chromatogr B Analyt Technol Biomed Life Sci 838:31–6. doi: 10.1016/j.jchromb.2006.03.006
Taxvig C, Olesen PT, Nellemann C (2011) Use of external metabolizing systems when testing for endocrine disruption in the T‐screen assay. Toxicol Appl Pharmacol 250:263–9. doi: 10.1016/j.taap.2010.10.029
Tokushige K, Hashimoto E, Kodama K, et al (2013) Serum metabolomic profile and potential biomarkers for severity of fibrosis in nonalcoholic fatty liver disease. J Gastroenterol 48:1392–400. doi: 10.1007/s00535‐013‐0766‐5
Trauger SA, Custodio DE, Qin C, et al (2005) Metlin ‐ a metabolite mass spectral database. Ther drug Monit 27:747–751.
Tse WKF, Yeung BHY, Wan HT, Wong CKC (2013) Early embryogenesis in zebrafish is affected by bisphenol A exposure. Biol Open 2:466–71. doi: 10.1242/bio.20134283
Tulipani S, Llorach R, Urpi‐Sarda M, Andres‐Lacueva C (2013) Comparative analysis of sample preparation methods to handle the complexity of the blood fluid metabolome: when less is more. Anal Chem 85:341–8. doi: 10.1021/ac302919t
Tyl RW (2013) Abbreviated assessment of bisphenol A toxicology literature. Semin Fetal Neonatal Med 1–8. doi: 10.1016/j.siny.2013.11.010
U. S. Environmental Protection Agency (2014) Interactive Chemical Safety for Sustainability (iCSS) Dashboard. http://actor.epa.gov/dashboard/.

65
Van Ravenzwaay B, Montoya G a, Fabian E, et al (2014) The sensitivity of metabolomics versus classical regulatory toxicology from a NOAEL perspective. Toxicol Lett 227:20–8. doi: 10.1016/j.toxlet.2014.03.004
Vanden Heuvel JP, Thompson JT, Frame SR, Gillies PJ (2006) Differential activation of nuclear receptors by perfluorinated fatty acid analogs and natural fatty acids: a comparison of human, mouse, and rat peroxisome proliferator‐activated receptor‐alpha, ‐beta, and ‐gamma, liver X receptor‐beta, and retinoid X rec. Toxicol Sci 92:476–89. doi: 10.1093/toxsci/kfl014
Vandenberg LN, Colborn T, Hayes TB, et al (2012) Hormones and endocrine‐disrupting chemicals: low‐dose effects and nonmonotonic dose responses. Endocr Rev 33:378–455. doi: 10.1210/er.2011‐1050
Villas‐Bôas SG, Højer‐Pedersen J, Åkesson M, et al (2005) Global metabolite analysis of yeast: evaluation of sample preparation methods. Yeast 1155–1169.
Villas‐Bôas SG, Roessner U, Hansen MAE, et al (2007) Metabolomics Analysis An Introduction.
Wishart DS (2010) Computational Approaches in Metabolomics. Bioformatics Methods Clin. Res. pp 283–313
Wishart DS (2008) Quantitative metabolomics using NMR. TrAC Trends Anal Chem 27:228–237. doi: 10.1016/j.trac.2007.12.001
Wishart DS, Jewison T, Guo AC, et al (2013) HMDB 3.0‐‐The Human Metabolome Database in 2013. Nucleic Acids Res 41:D801–7. doi: 10.1093/nar/gks1065
Wishart DS, Knox C, Guo AC, et al (2009) HMDB: a knowledgebase for the human metabolome. Nucleic Acids Res 37:D603–10. doi: 10.1093/nar/gkn810
Wishart DS, Lewis MJ, Morrissey J a., et al (2008) The human cerebrospinal fluid metabolome. J Chromatogr B Anal Technol Biomed Life Sci 871:164–173. doi: 10.1016/j.jchromb.2008.05.001
Wishart DS, Tzur D, Knox C, et al (2007) HMDB: the Human Metabolome Database. Nucleic Acids Res 35:D521–6. doi: 10.1093/nar/gkl923
Wisselink HW, Cipollina C, Oud B, et al (2010) Metabolome, transcriptome and metabolic flux analysis of arabinose fermentation by engineered Saccharomyces cerevisiae. Metab Eng 12:537–51. doi: 10.1016/j.ymben.2010.08.003
Wolff JC, Eckers C, Sage a B, et al (2001) Accurate mass liquid chromatography/mass spectrometry on quadrupole orthogonal acceleration time‐of‐flight mass analyzers using switching between separate sample and reference sprays. 2. Applications using the dual‐electrospray ion source. Anal Chem 73:2605–12.
Xia J, Broadhurst DI, Wilson M, Wishart DS (2013a) Translational biomarker discovery in clinical metabolomics: An introductory tutorial. Metabolomics 9:280–299. doi: 10.1007/s11306‐012‐0482‐9
Xia J, Fjell CD, Mayer ML, et al (2013b) INMEX‐‐a web‐based tool for integrative meta‐analysis of expression data. Nucleic Acids Res 41:W63–70. doi: 10.1093/nar/gkt338

66
Xia J, Mandal R, Sinelnikov I V, et al (2012) MetaboAnalyst 2.0‐‐a comprehensive server for metabolomic data analysis. Nucleic Acids Res 40:W127–33. doi: 10.1093/nar/gks374
Xia J, Psychogios N, Young N, Wishart DS (2009) MetaboAnalyst: a web server for metabolomic data analysis and interpretation. Nucleic Acids Res 37:W652–60. doi: 10.1093/nar/gkp356
Xu C, Xu G (2013) E ff ect of Bisphenol A on Rat Metabolic Pro fi ling Studied by Using Capillary Electrophoresis Time‐of‐Flight Mass Spectrometry.
Yamada a, Bemrah N, Veyrand B, et al (2014) Dietary exposure to perfluoroalkyl acids of specific French adult sub‐populations: High seafood consumers, high freshwater fish consumers and pregnant women. Sci Total Environ. doi: 10.1016/j.scitotenv.2014.01.089
Yonezawa K, Nishiumii S, Kitamoto‐Matsuda J, et al (2013) Serum and tissue metabolomics of head and neck cancer. Cancer Genomics Proteomics 10:233–8.
Zelena E, Dunn WB, Broadhurst D, et al (2009) Development of a robust and repeatable UPLC‐MS method for the long‐term metabolomic study of human serum. Anal Chem 81:1357–64. doi: 10.1021/ac8019366
Zeng J, Kuang H, Hu C, et al (2013) Effect of bisphenol A on rat metabolic profiling studied by using capillary electrophoresis time‐of‐flight mass spectrometry. Environ Sci Technol 47:7457–65. doi: 10.1021/es400490f
Zhang A, Sun H, Wang P, et al (2012a) Modern analytical techniques in metabolomics analysis. Analyst 137:293–300. doi: 10.1039/c1an15605e
Zhang A, Sun H, Wu X, Wang X (2012b) Urine metabolomics. Clin Chim Acta 414:65–69. doi: 10.1016/j.cca.2012.08.016
Zhang X, Chen L, Fei X‐C, et al (2009) Binding of PFOS to serum albumin and DNA: insight into the molecular toxicity of perfluorochemicals. BMC Mol Biol 10:16. doi: 10.1186/1471‐2199‐10‐16
Zhang Y, Deng Y, Zhao Y, Ren H (2014) Using combined bio‐omics methods to evaluate the complicated toxic effects of mixed chemical wastewater and its treated effluent. J Hazard Mater 272:52–8. doi: 10.1016/j.jhazmat.2014.02.041

67
Appendix
AppedixI:Exposurelevels
PFNA experiment (14 days)
Control (n08)
Low PFNA ± Mix (n=10)
Mid PFNA ± Mix (n=8)
High PFNA ± Mix (n=8)
Mix (n=8)
0.0125 mg/kg/day ± Mix
0.25 mg/kg/day ± Mix
5 mg/kg/day ± Mix
Mix
Mix:
CAS registry
number
Chemical name Source/use Ratio in
mixture
(weight)
Rat dose
(mg/kg
bw/day)
7380‐40‐7 bergamottin grapefruit
constituent
0.08
0.2
59870‐68‐7 glabridin liquorice
constituent
0.12 0.3
80‐05‐7 bisphenol A plastic additive 0.004 0.01
94‐26‐8 butyl paraben preservative 0.21 0.52
84‐74‐2 dibutylphtalate (DBP) plasticizer 0.02
0.06
117‐81‐7
bis(2‐ethylhexyl)phthalate (DEHP) plasticizer 0.03 0.09
36861‐47‐9 4‐methylbenzylidene camphor (4‐MBC) sun filter 0.15 0.38
5466‐77‐3 2‐Ethylhexyl‐4‐methoxycinnamate
(OMC)
sun filter 0.27 0.68
72‐55‐9 dichlorodiphenyldichloroethylene (p,p´‐
DDE)
pesticide 0.002 0.006
133855‐98‐8 epoxiconazole pesticide 0.02 0.05

68
330‐55‐2 linuron pesticide 0.002 0.004
67747‐09‐5 prochloraz pesticide 0.025 0.06
32809‐16‐8
procymidone pesticide 0.035 0.09
50471‐44‐8 vinclozolin pesticide 0.021 0.05
Bisphenol A (During pregnacy + 22 day after birth)
Low BPA
High BPA
Data not analysed by metabolomics
BPA 5
BPA 50
0.025 mg/kg/day
0.25 mg/kg/day
Data not analysed by metabolomics
5 mg/kg/day
50 mg/kg/day
Selene (14 days)
Vehicle‐BSA control (n=8)
Selenium nanoparticles (n=6)
Selenium nanoparticles (n=6)
Vehicle H2O (n=8)
Na‐selenite (n=8)
Na‐selenite (n=8)
4 g/L
0.05 mg/kg
0.5 mg/kg
0.05 mg/kg
0.5 mg/kg

69
AppendixII:Massspectrometerstats
Ion source settings
Nebulizer
Drying gas
Dry gas temp
Capillary voltage
Scan range and time
Scan range
Scan time
MSMS settings
“Auto MSMS”
Calibration
Sodium formate
Hexakisperflouretoxyphophazene
2 l/min
10 l/min
200OC
4500 V
50‐1100 m/z
2 Hz
MSMS every second scan of 3 top intensity peaks
Collision energy was based on the mass of the
compound a ramping range of 10‐30 eV for mass
100‐1000 Da
Time window (0.2‐0.4)
Evaporation from sponge in ion source
NMR setting
H‐NMR spectra were collected on a either a 500
MHz Inova (Varian Inc., Palo Alto, CA) spectrometer
using the first transient of the tnnoesypresaturation
pulse sequence. The resulting 1 H‐NMR spectra
were processed and analyzed using the Chenomx
NMR Suite Professional software package version
6.0 (Chenomx Inc., Edmonton, AB), as previously
described .

70
“Prior to spectral analysis, all FIDs were zero‐filled
to 64k data points, and a line broadening of 0.5 Hz
was applied. The methyl singlet of the buffer
constituent DSS served as an internal standard for
chemical shift referencing (set to 0 ppm) and for
quantification. All 1H NMR spectra were processed
and analyzed using the Chenomx NMR Suite
Professional software package version 4.6
(Chenomx Inc., Edmonton, AB). The Chenomx NMR
Suite software allows for qualitative and
quantitative analysis of an NMR spectrum by
“fitting” spectral signatures from an internal
database of reference spectra to the full NMR
spectrum [22]. Specifically, the spectral fitting for
each metabolite was done using the standard
Chenomx 500 MHz (pH 6–8) metabolite library, with
a set of additional compound signatures (1,5‐
anhydrosorbitol, dimethyl sulfone, 2‐
oxoisovalerate, 3‐hydroxyisobutyrate) that were
added in‐house. It has been previously shown that
this fitting procedure provides absolute
concentration accuracies of 90% or better.”
(Wishart et al 2008)

71
AppendixIII:NMRdata

72

73

74

75

76

77
Publications:
Paper I: LC‐MS analysis of the plasma metabolome – a novel sample preparation strategy
Journal of Chromatography B
Aim: Increasing metabolite information from a rat plasma sample by solid phase extraction resulting in
three sub‐fractionations of the plasma metabolites.
Results: Sub‐fractionation increased the chromatographic separation. Furthermore, using two different
solvent systems for non‐polar and polar compounds resulted in increased separation and ensured that the
phospholipids did not precipitate on the analytical column. The fractionation approach was compared with
a protein precipitation approach; the sub‐fractionation approach resulted in 4234 compared to 1792 from
the protein precipitation approach. Evaluation of the sub‐fractioning approach was performed on low dose
exposure, where difference was found between animals exposed to a low dose of chemicals and control.
Conclusion: The new method revealed 2.5 times more molecular features than the regular protein
precipitation approach. The new method made it possible to detect differences even at low dose exposure
on the metabolome.

Lp
Ka
b
a
ARAA
KMLPS
1
ssafiecigt
m
a
h1
Journal of Chromatography B, 978–979 (2015) 83–88
Contents lists available at ScienceDirect
Journal of Chromatography B
jou rn al hom ep age: www.elsev ier .com/ locate /chromb
C–MS analysis of the plasma metabolome—A novel samplereparation strategy
asper Skova,∗, Niels Hadrupb, Jørn Smedsgaarda, Henrik Frandsena
National Food Institute, Division of Food Chemistry, Technical University of Denmark, Mørkhøj Bygade 19, DK-2860 Søborg, DenmarkNational Food Institute, Division of Toxicology, Technical University of Denmark, Mørkhøj Bygade 10, DK 2860 Søborg, Denmark
r t i c l e i n f o
rticle history:eceived 31 July 2014ccepted 30 November 2014vailable online 8 December 2014
eywords:etabolomics
C–MSlasma samplesolid phase extraction
a b s t r a c t
Blood plasma is a well-known body fluid often analyzed in studies on the effects of toxic compoundsas physiological or chemical induced changes in the mammalian body are reflected in the plasmametabolome. Sample preparation prior to LC–MS based analysis of the plasma metabolome is a chal-lenge as plasma contains compounds with very different properties. Besides, proteins, which usually areprecipitated with organic solvent, phospholipids, are known to cause ion suppression in electrospraymass spectrometry.
We have compared two different sample preparation techniques prior to LC-qTOF analysis of plasmasamples: the first is protein precipitation; the second is protein precipitation followed by solid phaseextraction with sub-fractionation into three sub-samples: a phospholipid, a lipid and a polar sub-fraction.Molecular feature extraction of the data files from LC-qTOF analysis of the samples revealed 1792 molec-ular features from the protein precipitation procedure. The protein precipitation followed by solid phaseextraction procedure with three sub-samples gave a total of 4234 molecular features. This suggests that
sub-sampling into polar, lipid and phospholipid fractions enables extraction of more metabolomic infor-mation as compared to protein precipitation alone. Chromatography showed good separation of themetabolites with little retention time drift (<1 s) and a mass accuracy below 3 ppm was observed. Theperformance of the method was investigated using plasma samples from rats administered the environ-mental pollutant perfluorononanoic acid.© 2014 Elsevier B.V. All rights reserved.
. Introduction
Metabolomics is an analytical strategy based on a comprehen-ive analysis of ideally, all low molecular weight compounds in apecific biological compartment [1]. This strategy is highly valu-ble in toxicological studies. It can be used to obtain a metabolicngerprint that enables determination of changes in response toxposure to xenobiotic chemicals [2]. Specifically, metabolomicsan be used to quantitate the amount of the xenobiotic as well asts metabolites [2–4]. The latter can provide investigators with sug-estions on the nature of affected biochemical pathways and thus
he nature of toxic effects and mechanisms [2].Several analytical techniques are available to determine theetabolome. Nuclear magnetic resonance (NMR) and mass
Abbreviations: MG, monoacylglycerol; PLS-DA, partial least square discriminantnalysis; PC, phosphotidylcholine; PFNA, perfluorononanoic acid.∗ Corresponding author. Tel.: +45 35887624.
E-mail address: [email protected] (K. Skov).
ttp://dx.doi.org/10.1016/j.jchromb.2014.11.033570-0232/© 2014 Elsevier B.V. All rights reserved.
spectrometry coupled to either gas chromatography (GC–MS)or liquid chromatography (LC–MS) are the most frequent usedtechniques. Each of these techniques has its advantages and disad-vantages. NMR requires little sample preparation but is reportedto have limited sensitivity [4]. GC–MS has excellent separationcapacity and good sensitivity but requires derivatisation of thesample. LC–MS has good separation capacity and good sensitiv-ity toward most compounds. However, very polar metabolites arepoorly retained on conventional LC columns [3,5]. An added benefitof high resolution accurate mass spectrometry is that it improvesthe possibility to identify metabolites [6]. Often, the complexity ofthe metabolome as described below, will nearly always call for acombination of analytical techniques to obtain a comprehensivepicture of the metabolome [7].
Blood perfuse all organs in the body and its metabolome canprovide comprehensive information reflecting the status of the
whole bodies’ physiology. While the metabolome can readily bemeasured in urine, representing a collection of metabolites elimi-nated by the organism, analysis of the plasma metabolome, whichbetter reflects the physiology status of the organism, requires
8 togr. B
apvmctsctbuplotmacmcpibp
atoropcupt
2
2
ol2gaSw(((w
2
atftevoca
4 K. Skov et al. / J. Chroma
more laborious analytical procedure. Plasma contains a com-lex mixture of compounds ranging from very hydrophilic toery hydrophobic with a concentration range from picomolar toillimolar [7–10]. This complexity challenges the analytical pro-
edures [11]. In particular, the co-occurrence of peptides/proteinsogether with phospholipids in plasma complicates the analy-is of metabolites. Before a chromatographic analysis of plasmaonstituents proteins are usually removed by solvent precipita-ion with methanol, acetonitrile, or perchloric acid [12,13]. It haseen shown that three volumes of acetonitrile per plasma vol-me is the most efficient protein precipitating agent [13]. Afterrotein precipitation, the remaining compounds mainly comprise
ow molecular weight compounds including e.g. amino acids,rganic acids, hormones, urea and uric acids as minor constituents,ogether with phospholipids and tri-, di- and mono-glycerides as
ajor constituents [7]. Phospholipids do not only interfere with good chromatographic separation, they also ionize very effi-iently in electrospray ionization mass spectrometry, and henceay suppress signals from other analytes [14,15]. To obtain a
omprehensive metabolic picture it is an advantage to removehospholipids before a generic LC–MS analysis. For the present
nvestigation we suggest that chromatographic performance wille improved by a fractionation of the remaining polar and non-olar substances in two sub-fractions.
The objective of the present investigation was to develop a ‘fastnd easy method’ that includes a fractionation of the plasma prioro liquid chromatography–mass spectrometry (LC–MS) analysis inrder to obtain good chromatographic performances for a wideange of different compounds. The fractionation method is basedn Tulipani et al. [14] but developed further, to obtain valid data forhospholipids, non-polar and polar compounds in plasma. The effi-acy of the method for toxicological investigations was tested byse of samples from rats administered the environmental pollutanterfluorononanoic acid, currently observed in increased concentra-ions in human plasma.
. Materials and methods
.1. Chemicals
All aqueous solutions were prepared using ultrapure waterbtained from a Millipore Milli-Q Gradient A10 system (Mil-ipore, Bedford, MA). HPLC MS grade methanol, isopropanol,5% ammonium hydroxide, formic acid, Bergamottin (98%),labrindin (98%), bisphenol A (99.5%), butyl paraben (99%)nd 4-methylbenzylidene camphor (98%) were obtained fromigma–Aldrich (St. Louis, MO). LiChroSolv LC–MS grade acetonitrileas obtained from Merck (Darmstadt, Germany). Dibutylphtalate
96%), bis(2-ethylhexyl)phthalate (99%), octyl methoxycinnamate98%), dichlorodiphenyldichloroethylene (99%), epoxyconazole99%), linuron (99.7%), prochloraz (98%) and vinclozolin (99.5%)ere purchased from VWR, Bie & Berntsen, Herlev, Denmark.
.2. Plasma extraction
100 �l plasma sample (stored at −80 ◦C prior to analysis) wasdded to an Eppendorpf vial containing 300 �l ice cold (−20 ◦C) ace-onitrile with 2% formic acid. The mixture was incubated at −20 ◦Cor 20 min in order to facilitate protein precipitation. After a cen-rifugation at 10,000 × g for 7 min at 4 ◦C (Ole Dich Instrument mak-rs, Denmark), the supernatant was either transferred to an HPLC
ial (protein precipitation only procedure) and analyzed by LC–MSr transferred to an SPE cartridge (30 mg Hybrid SPE Phospholipidolumn Supelco, Sigma–Aldrich, St. Louis, MO) conditioned withcetonitrile in order to sub-fractionate the sample prior to LC–MS.978–979 (2015) 83–88
The SPE column was first eluted by the addition of 300 �l of 1%formic acid in acetonitrile, and the eluate was collected in a vial andevaporated to dryness at 50 ◦C using a gentle stream of nitrogen. Thedry residue was then extracted by adding 200 �l of heptane. Theheptane fraction was then transferred to a clean vial. The residuewas then extracted by adding 200 �l of methanol (polar fraction).The heptane fraction was evaporated at 50 ◦C using a gentle streamof nitrogen. The dry residues of the heptane fraction was dissolvedin 200 �l of 50:50 (acetonitrile:isopropanol) (lipid fraction).
The hybrid SPE column was eluted by 300 �l of 10% ammoniumhydroxide in methanol, in order to elute the phospholipids. Thephospholipid fraction was diluted with 200 �l Milli-Q water and500 �l of methanol.
The three fractions obtained from each plasma sample were: (1)a phospholipid fraction, (2) a lipid fraction and (3) a polar fraction.The phospholipid fraction and the lipid fraction were analyzed by ahydrophobic LC procedure and the polar fraction was analyzed bya hydrophilic LC procedure (described in Section 2.4). The fraction-ation lasted 8 h for 82 samples corresponding to 6 min per sample.The fractions were stored at −20 ◦C between the analyses. No degra-dation was observed by re-analysis of the sample after two weeksstorage at −20 ◦C.
2.3. Animal study
Male Wistar rats, six weeks of age were purchased and housed aspreviously described [16]. Animals were divided into eight groupswith 8–10 animals in each group. The animals were administeredthe following substances/mixtures by oral gavage:
(1) Vehicle (corn oil in a volume of 1 mL/100 g of body weight(bw)); (2) perfluorononanoic acid (PFNA) at doses of 12.5 �g/kgbw/day; (3) 12.5 �g/kg bw/day PFNA and a mixture of 14 chemicals(Mix) (the content of the mixture is described below); and (4) Mixalone.
The Mix consisted of: Bergamottin 200 �g/kg bw/day, glabridin300 �g/kg bw/day, bisphenol A 10 �g/kg bw/day, butyl paraben520 �g/kg bw/day, dibutylphtalate (DBP) 60 �g/kg bw/day,bis(2-ethylhexyl)phthalate (DEHP) 90 �g/kg bw/day,4-methylbenzylidene camphor (4-MBC) 380 �g/kg bw/day, octylmethoxycinnamate (OMC), 680 �g/kg bw/day dichlorodipheny-ldichloroethylene (DDE), 6 �g/kg bw/day, epoxiconazole 50 �g/kgbw/day, linuron 4 �g/kg bw/day, prochloraz 60 �g/kg bw/day,procymidone 90 �g/kg bw/day and vinclozolin 50 �g/kg bw/day.The total dose of the mixture was 2500 �g/kg bw/day.
After a treatment period of 14 days, the animals were anaes-thetized in CO2/O2, euthanized by decapitation and a blood samplewas collected in heparinized plastic tubes from the neck wound.Plasma was isolated as the supernatant following centrifugation at1000 × g, 4 ◦C for 10 min.
2.4. LC-qTOF MS
Liquid chromatography was conducted on a Dionex Ultimate3000 RS (Thermo Scientific, CA) with an Ascentis Express C8(100 mm × 2.11 mm, 2.7 �m) column (Supleco, St. Louis, MO). Twoother HPLC columns were tested and found not to be suitablefor the purpose: a Kinetex PFP column, 100 mm × 2.1 mm, 2.6 �m(Phenomenex, Torance, CA) and an Ascentis Express cyano propylcolumn 100 mm × 2.1 mm, 2.7 �m (Supleco, St. Louis, MO). The sol-vent system consisted of (A) 5 mM ammonium hydroxide + 0.1%formic acid in water and (B) 0.1% formic acid in acetonitrile. Two
different gradient systems were used:The hydrophobic LC procedure: the solvent composition was iso-cratic 70% B for 1 min, 75% B at 3 min, 100% B at 8 min and isocratic100% B for 2 min, followed by re-equilibration at 70% for additional

togr. B 978–979 (2015) 83–88 85
2a
faCw
h3Dtsddt5w2tHmei
2
iaplfst
2
gm((oodm
3
3
iabtp
cPcEoug
K. Skov et al. / J. Chroma
min. Column temperature was 50 ◦C. Backpressure of the columnt 75% acetonitrile was 161 bar.
The hydrophilic LC procedure: the solvent composition was 0% Bor 1 min, 5% B at 3 min followed by 100% B at 10 min, then isocratict 100% B for 2 min followed by re-equilibration at 0% B for 2 min.olumn temperature was 40 ◦C. The backpressure of the columnas at the highest (15% acetonitrile) 190 bar.
The flow was 0.3 ml/min and the injection volume for theydrophilic LC procedure and the hydrophobic LC procedure was
and 1 �l, respectively. The LC system was connected to a Brukeraltonics, maXis qTOF mass spectrometer equipped with an elec-
rospray ion source (Bruker Daltonics, Bremen, Germany). The ionource settings were as follows: nitrogen was used as nebulizer,rying and collision gas, the nebulizer pressure was two bars, therying gas flow was 10 l/min, the dry gas temperature was 200 ◦C,he capillary voltage was 4500 V. The scan range was set to be from0 to 1100 m/z in both positive and negative ionization modes,ith an acquisition rate of 2 Hz. Sodium formate dissolved in 50%
-propanol was introduced into the ion source in a 0.2–0.4 minime segment and used for internal calibration of the data files.exakis(1H,1H,2H-perfluoroethoxy)phosphazene was used as lockass calibrant. Auto MS/MS was performed on one sample from
ach group and on reference samples, if available, in order to facil-tate the identification process.
.5. Chemometric analysis
Data was analyzed with profile analysis 2.1 (Bruker Dalton-cs, Bremen, Germany) using the Find Molecular Features (FMF)lgorithm, including time alignment, quantile normalization and aareto scaling model. Data were subsequently analyzed by partial
east square discriminant analysis (PLS-DA), which is a method usedor interpretation and visualization of profiling data. PLS-DA is aupervised method and describes the highest co-variation betweenhe metabolite data and the response variable [17].
.6. Identification of compounds
Identification of the compounds, differing significantly betweenroups, was conducted by accurate mass search in the humanetabolome database (www.hmdb.ca), the Metlin database
www.metlin.scripps.edu) and in the Lipidmaps databasewww.lipidmap.org). Identification was based on comparisonf data on retention times, MS and MS/MS spectra with databtained from reference compounds or based on comparison ofata on MS and MS/MS spectra with similar data from the humanetabolome database and Lipidmaps.
. Results
.1. Method development
Plasma samples were analyzed by LC–MS after protein precip-tation (data not shown) or fractionated into a polar, a non-polarnd a phospholipid fraction using a hybrid SPE column followedy LC–MS analysis of each sub-fraction. Fig. 1 shows the flow ofhe sub-fractionation approach giving three sub-fractions: phos-holipid, lipid and polar (Fig. 1).
Three different HPLC columns were tested for separation effi-iency of the three sub-fractions of the plasma samples, a KinetexFP column (Phenomenex, Torance, CA), an Ascentis Expressyanopropyl column (Supleco, St. Louis, MO) and an Ascentis
xpress C8 column (Supelco, St. Louis, MO). Severe bleeding wasbserved from the PFP column and further analyses on this col-mn was not attempted (data not shown); the cyanopropyl columnave a satisfactory chromatography and separation of the lipid andFig. 1. Flow diagram of the SPE method. Proteins were precipitated by adding 300 �lacetonitrile with 1% formic acid followed by SPE clean-up of the supernatant in threesub-fractions.
polar fractions, but performed poorly regarding separation of phos-pholipids (data not shown). The C8 column resulted in satisfactorychromatographic resolution of all three different classes of com-pounds (Fig. 2). Examination of the data files using the molecularfeature extraction algorithm resulted in 1792 molecular featuresfrom the LC–MS analysis of the protein precipitated sample. Molec-ular feature extraction on the data files from LC–MS analyses ofpolar, lipid and phospholipid sub-samples resulted in 3172, 804and 258 molecular features, respectively. A limited number of thecompounds were observed in both the lipid and the polar fraction.The sub-fractionation thus resulted in the extraction of totally 4234molecular features compared to 1792 features using only proteinprecipitation.
The chromatogram (Fig. 2a) shows the separation of thephospholipid fraction which eluted in two groups of primar-ily phosphocholine (PC) compounds. The first group of peakseluting between 60 and 120 s were low molecular weight lyso-phosphotidylcholine containing one fatty acid chain e.g. PC (20:0)and PC (18:0) while the compounds eluting between 340 and 470 swere high molecular weight compounds containing two fatty acidchains e.g. phosphotidylcholine (20:4/16:0). The phospholipid frac-tion molecular features were identified by an accurate mass searchin HMDB, followed by MS/MS examination of the chromatographicpeak. Each of the phosphotidylcholine compounds had a character-istic 184.073 m/z fragment.
The chromatogram of the lipid fraction (Fig. 2b) contained theneutral lipids such as tri, di- and monoacylglycerols. The smallpeaks in the beginning of the chromatogram were relatively polarlipids, while the sharp peaks around 400–500 s were one chainedlipids e.g. monoacylglycerols (MGs). The broader peaks between500 and 700 s were neutral lipids with two and three chains e.g.di- and triglycerides. The lipids were identified by accurate masssearch and comparison of MSMS pattern with the in silico MS/MSpattern from Lipidmaps.
The chromatogram of the polar fraction (Fig. 2c) contained smallorganic compounds, hormones such as cortisone and hydroxylcortisone, but also monoacylglycerol (16:0) and monoacylglycerol(18:0). The peaks eluting around 300–400 s were low molecularweight compounds with masses ranging from 300 to 500 m/z e.g.corticosterone, while MG (18:0) was present at a retention timeof 630 s. MG (16:0) and MG (18:0) were identified based on exactmass and by comparing MS/MS data with data from a standard.The presence of a double bond in the acyl chain of the fatty acid
reduced the retention time by approximately 30 s as compared tothe retention time of the saturated monoacylglycerols.The repeatability of the LC–MS method was investigated bymultiple injections of a single sample on different time points on

86 K. Skov et al. / J. Chromatogr. B 978–979 (2015) 83–88
Fig. 2. Three base peak chromatograms from a sub-fractionated control plasma sample: (a) phospholipid fraction, (b) lipid fraction and (c) polar fraction. The (a) and (b)were analyzed by the hydrophobic gradient system (Section 2) while (c) was analyzed by
Table 1The differences in retention times, in peak intensity and the in mass deviation ofthe three sub-fractions after analysis of nine injections of a single sample on twodifferent days (n = 18). The values are based on three peaks eluting to different timein the chromatogram (data shown in supplementary materials).
Fraction �Time (s) �Intensity (%) �m/z (ppm)
Phospholipids <1 2.9–10.4 1.4–1.6Lipid <1 6.4–11.1 3.1–3.4
adravttTpav
sirtlfwl
Polar <1 3.4–8.3 1.0–2.4
single day as well as on different days. These chromatographyata showed a high degree of reproducibility (data not shown). Theetention time stability was within 1 s for peaks in all three fractionsnd the mass accuracy and peak intensity only exhibited minorariations as displayed in Table 1. To evaluate the repeatability ofhe SPE method the intensity of three selected peaks from each ofhe sub-fractions was determined in the control animals (n = 10).he deviations (S.D.) were 21.1%, 33.1%, and 29.5% for the phos-holipid, lipid and polar fraction respectively. These deviations willlso include the variation between the animals in addition to theariation SPE clean-up method.
The repeatability of the method was further investigated bypiking of plasma samples with 12 different reference compounds,.e. three phospholipids, three lipids and 6 polar compounds. Alleference compounds were detected in the expected fractions; thehree phospholipids in the phospholipid fraction, the three neutral
ipids in the lipid fraction and the six polar compounds in the polarraction. The capacity of the Hybrid SPE cartridges was exceededhen the sample was spiked with high concentration of phospho-ipids (0.3 mg/ml) in that case the sample size was reduced.
the hydrophilic gradient system (Section 2).
3.2. Application of the method on an animal study
To test the performance of our analytical procedure, we ana-lyzed plasma samples from an animal study designed to investigatethe effect on mammalian physiology of perfluorononanoic acid(PFNA) administered in combination with a mix of 14 chemicals(Mix) [18].
Partial least squares discriminant analysis (PLS-DA) of LC–MSdata from the polar fraction and the phospholipid fraction of theplasma sample is shown in Fig. 3. The two plots were used to illus-trate the sensitivity of the method (Fig. 3).
The PLSDA score plot (Fig. 3a) of the polar fraction showed thatanimals dosed with PFNA plus mix clustered close to animals dosedwith mix alone, however distanced from animals dosed with PFNAand controls suggesting that dosing with mix clearly affects theclustering results. Control animals and animals dosed with PFNAalone were located more scattered in the score plot. The score plot,Fig. 3b, of the phospholipid fraction also showed a tendency to clus-tering of the animals dosed with PFNA plus Mix and animals dosedwith Mix alone and separated from the clustering of control animalsand animals dosed PFNA alone.
4. Discussion
4.1. Solid phase extraction vs. protein precipitation
The first attempt on sample preparation of plasma samples was
based on a paper by Souverain et al., using protein precipitationwith an acidified organic solvent, in this case acetonitrile, followedby LC–MS [13]. Chromatographic analysis of these extracts showedpoor chromatographic separation with high signals from the
K. Skov et al. / J. Chromatogr. B
Fig. 3. PLS-DA score plots of data from the polar and the phospholipid fraction. Scorepfc
pTtcaspiewawmesopc
pstplic
cU1[wtTotiwglsr
lot of the polar fraction display a clustering of Mix and PFNA low + Mix distantrom control and PFNA low (a). The score plot of the phospholipid fraction display alustering of Mix and PFNA low + Mix separating from PFNA low and control (b).
hospholipids causing ion suppression in the mass spectrometer.his resulted in a loss of low intensity ions with similar retentionimes (data not shown). As a result of these observations, it wasoncluded that a fractionation of the samples was needed. Hence,
method based on Tulipani et al. [14] was implemented in which aolid phase extraction (SPE) column was used to remove the phos-holipids. However, as changes in the phospholipid pattern gives
mportant information on mammalian physiology the method wasxtended to include these. Therefore, the extraction/SPE procedureas adjusted. First the phospholipids were isolated. Then the elu-
te was chemically separated into two fractions by first extractingith heptane to isolate a lipid fraction and then extracting withethanol to isolate the polar compounds. As discussed by Tulipani
t al. [14] the removal of phospholipid reduces the ion suppres-ion in the mass spectrometry, but at the cost of a reduced numberf identified molecular features. However, by eluting the phos-holipids from the SPE column information from this group ofompounds was retained.
Metabolic information on the phospholipids is important inhysiological studies [7], as exemplified by Kim et al. [19] whohowed that phospholipids were affected by hepatic steatosis. Fur-hermore, phospholipids are believed to have signaling roles in thelasma [20] and inside cells. Therefore, changes in phospholipid
evels may provide information on specific mechanisms and effectsn mammals. From this perspective it was important to have theseompounds included in the analysis.
The total number of molecular features extracted from thehromatograms after the sub-fractionation approach were 4234.sing only protein precipitation as described in Souverain et al.792 molecular features were extracted from the chromatogram13]. The 4234 molecular feature obtained after sub-fractionationill include some compounds twice as these are equilibrium dis-
ributed between the heptane and the methanol extraction solvent.he fractionation approach increases the amount of informationbtained on the plasma metabolome. Furthermore, the separa-ion in three fractions yielded more chromatographic peaks andncreased the sensitivity as the ion suppression was reduced. It
as found that a C8 column was the best compromise to give a
ood chromatographic separation of all three sub-fractions: polar,ipid and phospholipid. By using a single analytical column all threeub-fractions could be analyzed in one sequence saving time andeducing cost of the analyses.978–979 (2015) 83–88 87
Although to achieve good chromatographic separation two gra-dient systems have to be used. The lipid and phospholipid fractionrequired a gradient starting at 75% organic solvent to prevent pre-cipitation on the column as these compounds are highly non-polar.On the other hand, the polar fraction contains more water solublecompounds; therefore we started the gradient as low as 0% organic.In spite of the gradient starting at 0% organic, the chromatogramsshowed only few early eluting peaks. This was most likely due topoor ionization of the polar compounds in the electrospray ioniza-tion (ESI) interphase. Generally, it would be preferable to analyzeall the metabolites using a single chromatographic system. How-ever, this is not possible with such a wide range of metabolites [21].The repeatability was evaluated using data from the control groupand the deviations (S.D.) were determined to be 21.1%, 33.1%, and29.5% for the phospholipid, lipid and polar fraction respectively.
It was found that the HPLC system was reproducible for all threesub-fractions with a retention time deviation below 1 s. Though lit-tle retention time change was observed it may still be possible toimprove the peak shape for the non-polar compounds. Choi et al.suggested that addition of 50% isopropanol to the organic solventof the HPLC system yielded sharper peaks, at least for the phos-pholipids [22]. However, this was not implemented in the currentstudy. The mass deviation was found to be between 1 and 3.4 ppmwhich is more than suitable for identification of the compoundspresent in the plasma metabolome.
4.2. Application of the method on plasma samples from ananimal study
The method was established to provide maximum informationon the plasma metabolome from animal experiments designedto study the effects of dosing with chemicals. The HPLC analysesshowed good chromatographic separation for each of the threesub-fractions opening the possibility to identify critical compo-nents based on the exact mass. Using a PLS-DA analysis it waspossible to detect differences in the metabolome even a low expo-sure levels, as shown by the clustering in the score plot, Fig. 3. ThePLS-DA plot of both the polar and phospholipid fraction showeda clustering of PFNA Mix and Mix dosed animals, distanced fromPFNA and control animals. This suggests that the change of themetabolome is primarily driven by dosing Mix rather than PFNA.The Mix was administered to the animals at a dose comparable tohigh end human exposure revealing the applicability of the analyt-ical method.
5. Conclusion
We developed a method to improve sub-fractionate plasmasamples into a phospholipid, a lipid and a polar sub-samples. Thesewere analyzed by two different LC gradient systems combinedwith high resolution mass spectrometry. This method was moretime consuming than a protein precipitation approach, but theimproved chromatographic separation and reduced ion suppres-sion compared to protein precipitation providing more data fromeach plasma sample. Furthermore, the number of molecular fea-tures detected increased from 1972 to 4234. The sub-fractionationdivided the samples into 3 different chemical classes and knowl-edge of the chemical identity of the metabolites polar, lipidsand phospholipids is an advantage in the identification of themetabolites. The method was demonstrated to exhibit repeat-able chromatographic results for each of the three fractions
with a time shift of less than 1 s and a mass deviation below3.4 ppm. Furthermore, the injection on two separate days showedsimilar peak intensity and chromatography, this shows that sep-aration and purification by the SPE column is reproducible. The
8 togr. B
uodp
A
Fa
A
i2
R
[
[
[
[[
[[
[[
[
8 K. Skov et al. / J. Chroma
sefulness of the method was demonstrated by the detection ofverall differences in the metabolome of animals administered aose comparable with human exposure of the endocrine disruptorerfluorononanoic acid.
cknowledgement
The Danish Government – The Ministry of Food, Agriculture andisheries was acknowledged for providing the grant that made thenalysis possible.
ppendix A. Supplementary data
Supplementary material related to this article can be found,n the online version, at http://dx.doi.org/10.1016/j.jchromb.014.11.033.
eferences
[1] M. Snyder, J.E.G. Gallagher, FEBS Lett. 583 (2009) 3895.
[2] D.G. Robertson, P.B. Watkins, M.D. Reily, Toxicol. Sci. 120 (Suppl.) (2011) S146.[3] V.S. Gomase, S.S. Changbhale, S.A. Patil, K.V. Kale, Curr Drug Metab. (2008) 89.[4] D.S. Wishart, TrAC Trends Anal. Chem. 27 (2008) 228.[5] S.U. Bajad, W. Lu, E.H. Kimball, J. Yuan, C. Peterson, J.D. Rabinowitz, J. Chro-matogr. A 1125 (2006) 76.
[[
[
978–979 (2015) 83–88
[6] K. Sandra, A.D.S. Pereira, G. Vanhoenacker, F. David, P. Sandra, J. Chromatogr. A1217 (2010) 4087.
[7] N. Psychogios, D.D. Hau, J. Peng, A.C. Guo, R. Mandal, S. Bouatra, I. Sinelnikov, R.Krishnamurthy, R. Eisner, B. Gautam, N. Young, J. Xia, C. Knox, E. Dong, P. Huang,Z. Hollander, T.L. Pedersen, S.R. Smith, F. Bamforth, R. Greiner, B. McManus, J.W.Newman, T. Goodfriend, D.S. Wishart, PLoS ONE 6 (2011) e16957.
[8] W.B. Dunn, N.J.C. Bailey, H.E. Johnson, Analyst 130 (2005) 606.[9] W.B. Dunn, D.I. Elis, Trends Anal. Chem. 24 (2005) 285.10] M.A. García-Sevillano, M. Contreras-Acuna, T. García-Barrera, F. Navarro, J.L.
Gómez-Ariza, Anal. Bioanal. Chem. 406 (2014) 1455.11] W. Dunn, D.I. Broadhouse, H.J. Atherton, R. Goodacre, J.L. Griffen, Chem. Soc.
Rev. 40 (2010) 387–426.12] C. Polson, P. Sarkar, B. Incledon, V. Raguvaran, R. Grant, J. Chromatogr. B: Anal.
Technol. Biomed. Life Sci. 785 (2003) 263.13] S. Souverain, S. Rudaz, J.-L. Veuthey, J. Pharm. Biomed. Anal. 35 (2004) 913.14] S. Tulipani, R. Llorach, M. Urpi-Sarda, C. Andres-Lacueva, Anal. Chem. 85 (2013)
341.15] C. Ferreiro-Vera, J. Chromatogr. A (2012) 21.16] N. Hadrup, K. Loeschner, A. Bergström, A. Wilcks, X. Gao, U. Vogel, H.L. Frandsen,
E.H. Larsen, H.R. Lam, A. Mortensen, Arch. Toxicol. 86 (2012) 543.17] T.M.D. Ebbels, R. Cavill, Prog. Nucl. Magn. Reson. Spectrosc. 55 (2009) 361.18] N. Hadrup, M. Pedersen, K. Skov, N.L. Hansen, L.O. Berthelsen, K. Kongsbak, J.
Boberg, M. Dybdahl, U. Hass, H. Frandsen, A.M. Vinggaard, Arch. Toxicol. (2015)[submitted for publication (n.d.)].
19] H.-J. Kim, J.H. Kim, S. Noh, H.J. Hur, M.J. Sung, J.-T. Hwang, J.H. Park, H.J. Yang,M.-S. Kim, D.Y. Kwon, S.H. Yoon, J. Proteome Res. 10 (2011) 722.
20] T.A. Lagace, N.D. Ridgway, Biochim. Biophys. Acta 1833 (2013) 2499.21] K. Spagou, H. Tsoukali, N. Raikos, H. Gika, I.D. Wilson, G. Theodoridis, J. Sep. Sci.
33 (2010) 716.22] J.M. Choi, T.-E. Kim, J.-Y. Cho, H.J. Lee, B.H. Jung, J. Chromatogr. B: Anal. Technol.
Biomed. Life Sci. 944 (2014) 157.

Paper II: Perfluorononanoic acid in combination with 14 chemicals exerts low-dose mixture
effects in rats
Archives of Toxicology
Aim: A toxicological study aimed at investigating whether adverse mixture effects do not occur at doses approaching high-end human exposure levels.
Result: Indication of a toxicokinetic interaction was found, as simultaneous exposure to PFNA and the Mix caused a 2.8-fold increase in plasma PFNA concentrations at Low PFNA. Corticosterone, the stress hormone of rats was increased with PFNA alone; while androstenedione, testosterone and dihydrotestosterone were significantly increased in by 0.0125 mg/kg bw/day PFNA with mix and not low PFNA alone.
Conclusion: PFNA affects the steroid hormone synthesis in rats. Corticosterone, was affected by PFNA while for androstenedione, testosterone and dihydrotestosterone the induced effect was caused by the combination with the mixture.

1 3
Arch ToxicolDOI 10.1007/s00204-015-1452-6
ORGAN TOXICITY AND MECHANISMS
Perfluorononanoic acid in combination with 14 chemicals exerts low‑dose mixture effects in rats
Niels Hadrup · Mikael Pedersen · Kasper Skov · Niels Lund Hansen · Line Olrik Berthelsen · Kristine Kongsbak · Julie Boberg · Marianne Dybdahl · Ulla Hass · Henrik Frandsen · Anne Marie Vinggaard
Received: 3 October 2014 / Accepted: 6 January 2015 © Springer-Verlag Berlin Heidelberg 2015
This combined with affected ACTH plasma concentrations and down-regulation of 11β HSD mRNA in livers indicates a disturbed pituitary-adrenal axis. In conclusion, our data suggest that mixtures of environmental chemicals at doses approaching high-end human exposure levels can cause a hormonal imbalance and disturb steroid hormones and their regulation. These effects may be non-monotonic and were observed at low doses. Whether this reflects a more general phenomenon that should be taken into consideration when predicting human mixture effects or represents a rarer phe-nomenon remains to be shown.
Keywords Mixture toxicology · Steroidogenesis · Testosterone · Corticosterone · Pituitary hormones · Perfluorononanoic acid (PFNA)
Introduction
Humans are concomitantly exposed to several chemi-cals that can exert mixture effects. At doses close to no-observed adverse effect levels or higher, chemicals usu-ally act additively in experimental studies (Kortenkamp 2014). However, we are lacking knowledge on the impor-tance of exposure to complex real-world mixtures at more relevant human exposure levels. Only few in vivo studies performed with low-human relevant exposure levels have been reported. Wade et al. investigated a mixture contain-ing 18 persistent contaminants at a dose of 1x the estimated safe level. This dose was based on the minimum risk lev-els (MRLs) or the tolerable daily intakes and was dosed orally to male rats for 70 days. At this dose, increased natural killer cell lytic activity was observed (Wade et al. 2002). Crofton et al. investigated whether deviations from additivity could be detected at low doses. They studied
Abstract Humans are simultaneously exposed to sev-eral chemicals that act jointly to induce mixture effects. At doses close to or higher than no-observed adverse effect levels, chemicals usually act additively in experimental studies. However, we are lacking knowledge on the impor-tance of exposure to complex real-world mixtures at more relevant human exposure levels. We hypothesised that adverse mixture effects occur at doses approaching high-end human exposure levels. A mixture (Mix) of 14 chemi-cals at a combined dose of 2.5 mg/kg bw/day was tested in combination with perfluorononanoic acid (PFNA) at doses of 0.0125 (Low PFNA), 0.25 (Mid PFNA) and 5 (High PFNA) mg/kg bw/day by oral administration for 14 days in juvenile male rats. Indication of a toxicokinetic interac-tion was found, as simultaneous exposure to PFNA and the Mix caused a 2.8-fold increase in plasma PFNA concentra-tions at Low PFNA. An increase in testosterone and dihy-drotestosterone plasma concentrations was observed for Low PFNA + Mix. This effect was considered non-mono-tonic, as higher doses did not cause this effect. Reduced LH plasma concentrations together with increased andro-gen concentrations indicate a disturbed pituitary-testis axis caused by the 15-chemical mixture. Low PFNA by itself increased the corticosterone plasma concentration, an effect which was normalised after simultaneous exposure to Mix.
N. Hadrup · N. L. Hansen · L. O. Berthelsen · K. Kongsbak · J. Boberg · M. Dybdahl · U. Hass · A. M. Vinggaard (*) Division of Toxicology and Risk Assessment, National Food Institute, Technical University of Denmark, Mørkhøj Bygade 19, 2860 Søborg, Denmarke-mail: [email protected]
M. Pedersen · K. Skov · H. Frandsen Division of Food Chemistry, National Food Institute, Technical University of Denmark, Søborg, Denmark

Arch Toxicol
1 3
thyroid disruptors in doses ranging from environmental background to 100x environmental background in rats for effects on serum total thyroxine. No deviation from additiv-ity was found at the lowest doses (<0.2 mg/kg bw/day), but at higher doses (>0.67 mg/kg bw/day), synergy was found (Crofton et al. 2005). Stanko et al. found an increase in prostate inflammation with 0.09 mg/kg bw of an atrazine metabolite mixture following prenatal exposure of male rats (Stanko et al. 2010). Merhi et al. exposed mice to a mixture of six pesticides at levels derived from the human acceptable daily intake levels. Changes in blood cell counts were observed (Merhi et al. 2010). Demur et al. (2013) found dietary exposure to a low atrazine, endosulfan and chlorpyrifos mixture dose (25, 30 and 50 μg/kg food cor-responding to approximately 4, 5, and 8 μg/bw/day) to decrease the red blood cell count and haemoglobin levels.
To further address exposure to human relevant mixtures of chemicals, we designed an experiment to test whether chemicals in food approaching high-end human exposure cause adverse mixture effects. We hypothesised that effects could occur via toxicokinetic metabolism effects compa-rable to those described for food–drug interactions, e.g., as has been described for grapefruit juice and Ca2+ chan-nel blockers (Bailey et al. 1989). For our investigation, we used steroid hormone metabolism as an effect measure. Steroid hormones are involved in multiple important male developmental processes and thus alterations in its plasma concentration may potentially be accompanied by adverse effects. We designed an experiment in which a single chemi-cal known to affect the steroid hormone testosterone on its own was tested at increasing doses in the presence or absence of a fixed dose of a ‘background’ chemical mixture (Mix). On basis of its human toxicological importance and on basis of its ability to increase testosterone at a dose of 1 mg/kg bw/day to rats (Feng et al. 2009), we selected the fluorosurfactant perfluorononanoic acid (PFNA) as the vari-ably dosed chemical in this investigation. We exposed the rats to a fixed background dose of 14 chemicals—12 envi-ronmental chemicals representing typical endocrine disrupt-ing chemicals and two food ingredients. For the design of this Mix, we took advantage of the fact that testosterone is metabolized in the liver by cytochrome P450 3A4 (CYP3A4 homologous to CYP3A23/3A1 in rat) and CYP2C9 (homol-ogous to CYP2C11 in rat) (Cheng and Schenkman 1983; Guengerich 1999; Kenworthy et al. 1999; Martignoni et al. 2006). CYP3A4 and CYP2C9 are inhibited by the grapefruit constituent bergamottin and the liquorice constituent glabri-din (Bailey et al. 2003; Foti and Wahlstrom 2008; Kent et al. 2002; Lim et al. 2005; Tassaneeyakul et al. 2000; Uesawa and Mohri 2006; Wen et al. 2002). These substances were included in the Mix along with twelve food contaminants (described in Table 2), each reported to exert endocrine dis-rupting effects (Christiansen et al. 2012). The doses of these
twelve contaminants were selected to reflect a high-end exposure level to the European human population. Thus, to test whether chemicals in food at human relevant doses caused adverse mixture effects, we administered PFNA at doses 0.0125 (Low PFNA), 0.25 (Mid PFNA) and 5 (High PFNA) mg/kg bw/day in the presence or absence of Mix at a total dose of 2.5 mg/kg bw/day (Table 2) to male rats for 14 days. Steroid hormone plasma concentrations, pituitary hormone levels as well as classical toxicological parameters and mechanistic markers in testis, liver, adipose tissue and kidney were investigated.
Methods
Dose selection and chemicals
We aimed at selecting a PFNA dose to cover human internal exposure of the combined exposure to perfluorinated com-pounds such as PFOA, PFOS and PFNA. Lau et al. (2007) gathered human exposure data from a large number of stud-ies. The PFOS mean plasma concentrations in single studies were 10–73 ng/mL (see Table 1 for an overview of the data in table format), for PFOA the values were 2.1–354 ng/mL (second highest value was 41 ng/mL), and for PFNA 0.8–2.2 ng/mL. This gives a possibility of a combined human exposure to these three perfluorinated compounds of 13–429 ng/mL (or 13–117 ng/mL if only the second highest PFOA value is used) (Lau et al. 2007). For comparison, the high-end exposure (95th percentile) in the American popu-lation as determined by the National Health and Nutrition Examination Survey (NHANES) is 67.6 ng/mL for PFNA, PFOA and PFOS combined (CDC 2009). The PFNA dose employed in the present investigation was chosen on basis of a study by Tatum Gibbs et al. (Tatum-Gibbs et al. 2011) in which an oral dose of 1 mg/kg bw to rats gave a serum concentration of approximately 10,000 ng/mL. From that we chose a dose of 0.0125 mg/kg bw/day for a 14-day inves-tigation (Abbreviated: Low PFNA), predicted giving rise to a PFNA plasma concentration of 125 ng/mL. For a medium- and high-dose level, we included 0.25 (Mid PFNA) and 5 (High PFNA) mg/kg bw/day.
We aimed to administer bergamottin in an amount cor-responding to the content of one grapefruit. A grapefruit contains 25 μM bergamottin (Bailey et al. 2003) corre-sponding to 1,700 μg bergamottin per grapefruit. Adjust-ing according to body surface area as described (Reagan-Shaw et al. 2008), a rat dose corresponding to a human intake of 100 mL grapefruit juice was calculated to be 0.2 mg/kg bw/day. For glabridin, an amount corresponding to an intake of 100-g liquorice candy per day was determined in the following way. The extraction of glycyrrhizic acid and glabridin from Chinese (raw) liquorice gives 2.39 mg/g

Arch Toxicol
1 3
glycyrrhizic acid and 0.92 mg/g glabridin (Tian et al. 2008). This taken together with a reported 150 mg glycyr-rhizic acid in 100 g of sweet liquorice (candy) (Sigurjons-dottir et al. 2001), suggests an amount of 58 mg glabridin in 100 g of sweet liquorice, suggesting that a 70-kg per-son takes in 0.8 mg/kg bw/day of glabridin when ingest-ing 100 g of sweet liquorice. This suggests—by a body surface area conversion (Reagan-Shaw et al. 2008)—that we should give a dose of 4 mg/kg bw/day to rats. How-ever, Furhman et al. previously reported that a glabridin dose to rats corresponding to the selected human intake was 0.3 mg/kg bw/day (Fuhrman et al. 1997) and to take a conservative approach we settled for this dose. Regard-ing the remaining chemicals in the mixture, a previously designed mixture based on exposure levels of the European human population was used (Christiansen et al. 2012; Had-rup et al. 2013). The dose reported to be a realistic ‘high-end human exposure level’ (Christiansen et al. 2012) was 0.32 mg/kg bw/day. By conversion to rat dose via body sur-face area, this yields 2 mg/kg bw/day. The chemicals and their ratio in Mix are described in Table 2. Chemicals were purchased as follows: Bergamottin, glabridin, bisphenol A, butyl paraben and 4-methylbenzylidene camphor (4-MBC) were purchased from Sigma-Aldrich, Brøndby, Denmark. Dibutylphthalate (DBP), bis(2-ethylhexyl)phthalate (DEHP), 4-MBC, 2-ethylhexyl-4-methoxycinnamate (OMC), dichlo-rodiphenyldichloroethylene (DDE), epoxiconazole, linuron, prochloraz, procymidone and vinclozolin were purchased from VWR, Bie & Berntsen, Herlev, Denmark.
Animals and pathology
Male Wistar Hannover Galas rats, 6 weeks of age with specific pathogen-free health status, were obtained from Taconic M&B (Lille Skensved, Denmark) and allowed to
acclimatise for 1 week. The animals were housed two per cage (Macrolon, Buguggiate, Italy) with light on from 7 a.m. to 7 p.m. Room temperature and relative humidity were 22 ± 1 °C and 55 ± 5 %, respectively. Rats were given ad libitum access to citric acid acidified tap water and standard diet (prod. no. 1324 Altromin, Brogården, Gentofte, Den-mark). The animals were administered test substances once a day orally by gavage for 14 days with corn oil (VWR—Bie & Berntsen, Herlev, Denmark) as vehicle. The dosing volume was 1 mL/100 g of body weight (bw). In total, 70 male rats were randomly placed into eight groups, i.e., vehi-cle control (n = 10), PFNA 0.0125 mg/kg/day (Low PFNA) (n = 10), PFNA 0.25 mg/kg/day (Mid PFNA) (n = 8), PFNA 5 mg/kg/day (High PFNA) (n = 8), Mix + PFNA 0.0125 mg/kg/day (Low PFNA + Mix) (n = 10), Mix + PFNA 0.25 mg/kg/day (Mid PFNA + Mix) (n = 8), Mix + PFNA 5 mg/kg/day (High PFNA + Mix) (n = 8), Mix (n = 8). Animals were evaluated clinically and sub-jected to necropsy in four different sets each starting 1 day after the prior. Each set comprised animals of each dosing group. For the euthanisation, the animals were anaesthe-tised in CO2/O2 and decapitated. Neck blood was collected in heparinised tubes, and plasma was isolated by centrifu-gation at 1,000×g, 4 °C for 10 min. Plasma was stored at −80 °C. To avoid bias, e.g., due to stress in animals, the sectioning of animals were randomised according to groups. Animals were given the last dose in the time span of 1 h and 15 min to 1 h and 45 min before euthanisation. Body weight and organ weights (liver, kidney, testes) were recorded, and livers were fixed and processed for histopathological exami-nation as previously described (Hadrup et al. 2012). Liver haematoxylin and eosin stained sections were evaluated by a pathologist blinded to treatment groups. Changes were described qualitatively, and in addition, selected parameters were scored in the following manner: Cell borders (score
Table 1 Comparison of reported human perfluorinated compound levels with measured levels in rats
NHANES National Health and Nutrition Examination Survey, PFC perfluorinated compound
Reported human exposure levels to PFCs (ng/mL)
NHANES (geometric means) (CDC 2009)
NHANES 95th percentile (CDC 2009)
Mean value ranges from literature reviewed in Lau et al. (2007)
PFNA in serum 1.0 3.2 0.8–2.2 (n = 6)
PFOA in serum 4.0 9.8 2.1–354 (n = 9)
PFOS in serum 20.7 54.6 10–73.2 (n = 11)
Total PFC in serum 25.7 67.6 32.8–429
Measured rat exposure levels (ng/mL) Comparison human versus rat
Measured PFNA plasma conc. in rats at low dose 396 0.9- to 15-fold human exposure to total PFCSixfold human 95th percentile NHANES exposure
Measured PFNA plasma conc. in rats at mid dose 29,950 70- to 1,200-fold human exposure to total PFC440-fold human 95th percentile NHANES exposure

Arch Toxicol
1 3
0 = not visible, score 1 = not clear, score 2 = clear) and cell size (score 1 = small/normal, score 2 = slight increase, score 3 = marked increase).
PFNA plasma concentration measurement
For each PFNA dose, plasma concentrations were meas-ured. To 20 µl plasma, 60 µl ice-cold acetonitrile was added. The sample was incubated at −20 °C for 20 min and centri-fuged at 10,000×g for 7 min. The supernatant was used for analysis. A matrix-assisted standard curve was established using PFNA and a standard plasma sample (Precinom U, Roche Diagnostics, Hvidovre, Denmark). Samples from the 0.0125 mg/kg bw/day administration group were not diluted, 0.25 mg/kg bw/day samples were diluted tenfold, and the 5 mg/kg bw/day samples were diluted 100-fold. The analysis was conducted using a high-resolution maxis qTOF instrument (Bruker Daltonics, Bremen, Germany) coupled to an Agilent 1200 (Agilent Technologies, USA) with a Supelco C8 (100 × 2.0 mm, 1.7 µm) run in nega-tive mode ionisation with a mass scan from 50 to 800 m/z. The gradient was 0 % B, 0 min—5 % B, 2 min—100 % B, 10 min—100 % B, 12 min—0 % B, 12.1 min—0 % B, 14 min. To test the repeatability of the method, the Low PFNA groups were analysed on two separate days. These measurements gave similar results. In order to investigate the metabolism of PFNA, a targeted approach was used to identify possible metabolites. The metabolites searched for were PFNA + glucuronic acid (+176 m/z value) and PFNA + glycine (+75 m/z value). The targeted approach was conducted using the Bruker Daltonics software: Target Analysis (Bruker Daltonics, Bremen, Germany).
Hormone measurements
Plasma samples were added internal standards (testosterone-d2 and methyltestosterone-d3), deproteinised with addition of acetonitrile and ultracentrifugation, and steroid hormones were extracted using a C18 end-capped solid-phase extrac-tion cartridge (500 mg, 3 ml) (Merck, Darmstadt, Germany). Impurities were removed from the cartridge with deminer-alised water followed by elution of steroid hormones from the cartridge with methanol. The extract was evaporated to dryness with nitrogen and re-suspended in 40 % acetoni-trile. Steroid hormones were separated, detected and quan-tified using the LC–MS/MS method previously described (Mortensen and Pedersen 2007). However, to accommodate more hormones, minor modifications were made. An Ascen-tis Express C8 column (2.1 × 100 mm, 2.7 µm) (Supelco) was added to the LC system (Agilent 1100). Steroids were measured with an injection volume of 10 μL in ESI+ mode with acetonitrile and water/0.2 % formic acid as the mobile phases (flow rate 0.25 mL/min, gradient method). The MS was a Quattro Ultima Triple Quadropole Instrument (Waters Corp., Milford, MA, USA). For quantification, external calibration standards were run before and after the samples at levels of 0.1, 0.5, 1.0, 2.0, 5.0 and 10 ng/mL (with 4.0 ng/mL of internal standards). The absolute recoveries of the hormones in plasma samples were estimated to be 42–94 %, based on the absolute recoveries of the internal standards in >30 experiments. The limit of quantification (LOQ) of each of the hormones in the plasma samples was estimated as the concentrations corresponding to six times signal-to-noise and was <100 pg/mL for testosterone (α- and β-isomer), progesterone, corticosterone and hydroxycortisol, <200
Table 2 Fourteen chemicals in fixed ratio mixture
CAS registry number Chemical name Source/use Ratio in mixture (weight) Rat dose (mg/kg bw/day)
7380-40-7 Bergamottin Grapefruit constituent 0.08 0.2
59870-68-7 Glabridin Liquorice constituent 0.12 0.3
80-05-7 Bisphenol A Plastic additive 0.004 0.01
94-26-8 Butyl paraben Preservative 0.21 0.52
84-74-2 Dibutylphthalate (DBP) Plasticiser 0.02 0.06
117-81-7 Bis(2-ethylhexyl)phthalate (DEHP) Plasticiser 0.03 0.09
36861-47-9 4-Methylbenzylidene camphor (4-MBC) Sun filter 0.15 0.38
5466-77-3 2-Ethylhexyl-4-methoxycinnamate (OMC) Sun filter 0.27 0.68
72-55-9 Dichlorodiphenyldichloroethylene (p,p′-DDE)
Pesticide 0.002 0.006
133855-98-8 Epoxiconazole Pesticide 0.02 0.05
330-55-2 Linuron Pesticide 0.002 0.004
67747-09-5 Prochloraz Pesticide 0.025 0.06
32809-16-8 Procymidone Pesticide 0.035 0.09
50471-44-8 Vinclozolin Pesticide 0.021 0.05
In total 14 Chemicals 1.0 2.5

Arch Toxicol
1 3
pg/mL for androstenedione and hydroxyprogesterone, and <2,000 for dihydrotestosterone and hydroxytestosterone. Pituitary hormone plasma concentration measurements were done by use of the Milliplex Map Rat Pituitary Kit
(Prod no. RPT86K, Millipore Corporation, St. Charles, MO, USA). This was done according to the protocol of the manufacturer by use of a Luminex 100 apparatus (Bio-Rad, Hercules, CA, USA).
Table 3 Primer/probe sets for mRNA measurements
Gene Prod no./sequence Tissues tested
Aldo–keto reductase family 1 member C1 (AKR1C1) Prod. No. Rn01487552_m1, Life Technologies Europe BV, Nærum, Denmark
Liver
Benzodiazepine receptor (BZRP) Forward, 5′-TGG TTC CCT TGG GTC TCT ACA CT-3′ Testes
Reverse, 5′-CAC CCC ACT GAC AAG CAT GA-3′
Probe: 5′-FAM-AAA GCC CAG CCC ATC T-MGB-3′Cytochrome P450 (CYP) 1A1 Prod. No. Rn00487218_m1, Life Technologies Europe BV,
Nærum, DenmarkLiver
CYP1A2 Prod. No. Rn00561082_m1, Life Technologies Europe BV, Nærum, Denmark
Liver
CYP2B6 Prod. No. Rn00597739_m1, Life Technologies Europe BV, Nærum, Denmark
Liver
CYP2C11 Prod. No. Rn01502203_m1, Life Technologies Europe BV, Nærum, Denmark
Liver
CYP3A23/3A1 Prod. No. Rn03062228_m1, Life Technologies Europe BV, Nærum, Denmark
Testes
CYP11A Forward 5′-ACG ACC TCC ATG ACT CTG CAA T-3′ Testes/adipose tissue
Reverse: 5′-CTT CAG CCC GCA GCA TCT-3′
Probe: 5′- FAM-CCT TTA TGA AAT GGC ACA CAA CTT GAA GGT CA-TAMRA-3′
CYP17 Forward: 5′-GCC ACG GGC GAC AGA A-3′ Testes/adipose tissue
Reverse: 5′-CCA AGC CTT TGT TGG GAA-3′
Probe: 5′-FAM-CGT CAA CCA TGG GAA TAT GTC CAC CAG A-TMARA-3′
CYP19 Forward: 5′-AGAACGGTCCGCCCTTTCT-3′ Testes/adipose tissue
Reverse: 5′-TGGATTCCACACAGACTTCTACCA-3′
Probe: 5′-FAM-AGCTCTGACGGGCCCTGGTCTTATTC-TAMRA-3′
3β-hydroxysteroid dehydrogenase (3β HSD) Prod. No. Rn01789220_m1, Life Technologies Europe BV, Nærum, Denmark
Liver
11β HSD Prod. No. Rn00567167_m1, Life Technologies Europe BV, Nærum, Denmark
Liver
17β HSD Prod. No. Rn00588942_m1, Life Technologies Europe BV, Nærum, Denmark
Testes/adipose tissue
5α reductase Prod. No. Rn00575595_m1, Life Technologies Europe BV, Nærum, Denmark
Testes/adipose tissue
18 s-ribosomal RNA Forward:, 5′-GCC GCT AGA GGT GAA ATT CTT G-3′ Liver/testes/adipose tissue
Reverse: 5′-GAA AAC ATT CTT GGC AAA TGC TT-3′
Probe: 5′-FAM-ACC GGC GCA AGA CGA ACC AGA G-TAMRA-3′
Steroidogenic acute regulatory protein (StAR) Forward, 5′-CCC TTG TTT GAA AAG GTC AAG TG-3′ Testes
Reverse, 5′-TGA AAC GGG AAT GCT GTA GCT-3′
5′-FAM-CTG ACT CCT CTA ACT CCT GTC TGC CTA CAT GGT-TAMRA-3′
UDP-glucuronosyltransferase 2B15 (UGT2B15) Prod. No. Rn00755925_m1, Life Technologies Europe BV, Nærum, Denmark
Liver
UGT2B17 Prod. No. Rn01790037_g1, Life Technologies Europe BV, Nærum, Denmark
Liver

Arch Toxicol
1 3
mRNA measurements
Organs were stored in RNAlater at −20 °C until purifi-cation by use of the RNAeasy Mini Kit (Qiagen, Hilden, Germany) and cDNA synthesis by use of the Omniscript RT kit (Life Technologies Europe BV, Nærum, Denmark). mRNA levels were next measured by quantitative (q)PCR using specific primer pairs in combination with TaqMan probes (sequences and investigated organs are specified in Table 3). Samples, primers and probes were added TaqMan Fast Universal PCR Master Mix (Life Technologies Europe BV, Nærum, Denmark) and run on a TaqMan 7900 HT qPCR machine (Applied Biosystems, Nærum, Denmark). Quantification was done by use of the comparative thresh-old cycle (Ct) method, where the Ct value is the cycle num-ber at which the fluorescence signal of the amplified target reaches a defined threshold (Schmittgen and Livak 2008). Ct data on the transcripts of interest were normalised by subtraction of the Ct value of 18 s ribosomal RNA to obtain the ΔCt value. To obtain normal distributed data, 2−ΔCt values were used for statistical analysis.
Kidney transporter protein-level measurements
Frozen whole kidneys were thawed on ice and homog-enised with a Yellowline DI25 Basic Homogeniser (Bie & Berntsen, Glostrup, Denmark) in an ice-cold buffer containing 300 mM sucrose, 25 mM imidazole, 1 mM EDTA, and 1:200 Calbiochem Protease inhibitor cocktail set II, EDTA-Free (prod. no. 539134, Calbio-chem, Darmstadt, Germany). Protein determination and Western blotting were conducted as previously described (Hadrup et al. 2007) except that the employed primary antibodies were anti-organic anion transporter 1 (OAT1) (prod. no. ABIN653184, Antibodies-online, Aachen, Germany), anti-organic anion-transporting polypeptide 1/3 (OATP1/3) (prod. no. Sc-47265, Santa Cruz Biotech-nologies, La Jolla, CA) and anti-organic anion-transport-ing polypeptide 4C1 (OATP4C1) (prod. no. Sc-136775, Santa Cruz Biotechnologies, La Jolla, CA). All antibod-ies were used at a dilution of 1: 2,000. Moreover, the employed camera was a Gel Doc 2000 (Bio-Rad, Her-cules, CA). To accommodate up to 36 samples, a total of three blots were run for each investigated PFNA dose level (0.0125 mg/kg bw/day (PFNA Low) and 0.25 mg/kg bw/day (PFNA Mid) and on each blot a standard sample with a pooled volume of eight randomly selected samples was included, and all samples on each blot were normal-ised to this sample before data analysis.
Statistics
Regarding data on mechanisms of toxicity (hormone con-centrations, mRNA data, protein-level data), only the Low and Mid PFNA doses were included in the statistical evaluation (and on the graphs). The High PFNA groups were excluded due to the severe toxicity observed on body weight and pathology. Data were analysed for normal dis-tribution by use of the D’Agostino & Pearson omnibus normality test. In case of a lack of normal distribution, data were transformed using the logarithm function and again tested for normal distribution. For normally distrib-uted data, one-way ANOVA with Dunnett’s post-test was employed to assess effects of PFNA and of PFNA + Mix, respectively. In case of lack of normality, the nonparamet-ric Kruskal–Wallis test with Dunn’s post-test (exposed groups vs. controls) was employed. To assess differences between individual data points, a t test was employed. In case of lack of normality, differences between two groups were assessed by use of the Mann–Whitney test. In case of comparison with a group in which all data were below the limit of detection, one sample t test was employed. A p value of <0.05 was considered significant. The statistical software package was Graph Pad Prism (Graph Pad Soft-ware, La Jolla, USA).
Fig. 1 Plasma concentration of PFNA in the rats. Rats were admin-istered PFNA at 0.0125, 0.25 or 5 mg/kg bw/day for 14 days in the presence or absence of a mixture of 14 chemicals (Mix) at a total dose of 2.5 mg/kg bw/day. The PFNA plasma concentration was measured in blood from all rats at the end of the experiment using qTOF. PFNA was found in all PFNA treatment groups. At 0.0125 mg/kg bw/day (Low) PFNA, the plasma level was 396 ng/mL for Low PFNA and 1,111 ng/mL for Low PFNA + Mix. At 0.25 mg/kg bw/day, the values were 29,950 and 39,880 ng/mL for Mid PFNA and Mid PFNA + Mix, respectively. For 5 mg/kg bw/day, the values were 602,000 and 541,700 ng/mL for High PFNA and High PFNA + Mix, respectively. Data are mean plus SEM. N was 8 except for control and Low PFNA + Mix where n was 10. A t test was applied with §§§p < 0.001 for Low PFNA versus Low PFNA + Mix

Arch Toxicol
1 3
Results
PFNA plasma concentration
PFNA plasma concentrations following administration of 0.0125 mg/kg bw/day were 396 ng/mL for Low PFNA and 1,111 ng/mL for Low PFNA + Mix—a difference that
was statistically significant (p = 0.0007). Following dos-age with 0.25 mg/kg bw/day, the plasma concentrations were 29,950 ng/mL (Mid PFNA) and 39,880 ng/mL for Mid PFNA + Mix. Following dosage with 5 mg/kg bw/day, the values were 602,000 ng/mL (High PFNA) and 541,700 ng/mL for High PFNA + Mix (Fig. 1). Thus, at the low PFNA dose, the Mix caused a pronounced increase
Fig. 2 At high-dose, PFNA induces toxicity as measured by body weight and pathology. Rats were administered PFNA at 0.0125, 0.25 or 5 mg/kg bw/day for 14 days in the presence or absence of a mixture of 14 chemicals (Mix) at a total dose of 2.5 mg/kg bw/day. A piece of liver was fixed in paraformaldehyde and processed into paraffin-embedded sections and stained with haematoxylin and eosin. Sections were then blinded to the observer and scored by use of microscopy. Upper image shows a section from a control rat, lower image shows a section from a rat administered 5 mg/kg bw/day
PFNA. The upper graph shows that the end body weight is increased at High PFNA ± Mix. The lower graphs show scores of cells size and cell borders. Cell size is increased by High PFNA ± Mix, and cell borders are decreased by High PFNA ± Mix. Data are mean plus or minus SEM. N was 10 except for Mid PFNA, Mix and Mid PFNA + Mix where n was 8. Data are analysed by one-way ANOVA or Kruskal–Wallis test. ***p < 0.001 by Dunnett’s ANOVA post-test for PFNA versus control; and #p < 0.05 by Dunn’s Kruskal–Wallis post-test for PFNA + Mix versus control

Arch Toxicol
1 3
in PFNA plasma levels, but this did not happen at higher PFNA doses.
Body weight, organ weights and pathology
General toxicity was observed with High PFNA with and without Mix. The end body weights were decreased in High PFNA and High PFNA + Mix groups (Fig. 2). Mac-roscopic pathological examination showed steatotic liv-ers and congestive hearts (pictures not shown) that were observed for High PFNA and High PFNA + Mix. Micro-scopically, increased size of liver cells (hypertrophy) was observed with increasing doses of PFNA, reaching statisti-cal significance in the High PFNA + Mix group (Fig. 2). Cell borders were less apparent in liver sections of rats receiving increasing doses of PFNA being statistically sig-nificant in the High PFNA group.
Hormone plasma concentrations
The corticosterone plasma concentration was increased at the Low PFNA dose level without Mix (twofold). In the presence of the Mix, corticosterone was not increased at the Low and Mid PFNA groups (Fig. 3). For androsten-edione, testosterone and dihydrotestosterone increases were found in the Low PFNA + Mix group as compared to Low Mix (Fig. 3). For androstenedione and testoster-one, a decrease was found both in the High PFNA and the High PFNA + Mix groups (data not shown). This effect was not detected for dihydrotestosterone for which many measurements were below the level of quantification (data not shown). Regarding pituitary hormones (Fig. 4), Mid PFNA + Mix decreased the plasma concentration of lutein-ising hormone (LH). The concentration of follicle stimulat-ing hormone (FSH) was decreased by Low PFNA + Mix and adrenocorticotropic hormone (ACTH) was decreased in the Mid PFNA + Mix as compared to Mid PFNA. For pro-lactin and brain-derived neurotrophic factor, PFNA showed higher concentrations as compared to PFNA + Mix at the Mid dose.
mRNA levels in testis, liver and fatty tissue
In the testes, 17β HSD was down-regulated at both Low and Mid PFNA + Mix as compared to control. This effect was not observed with PFNA alone (Fig. 5). For all other genes measured in testes, there were no significant effects at the mRNA levels of genes involved in regula-tion of steroid metabolism when considering Low PFNA and Mid PFNA with or without Mix (data not shown). At the High PFNA, where severe toxicity was found, mRNA levels of steroidogenic acute regulatory protein (StAR), benzodiazepine receptor (BZRP), CYP11A, CYP17 and
17β-hydroxysteroid dehydrogenase (17β HSD) were all found to be down-regulated by PFNA (data not shown).
In the liver, 11β HSD was down-regulated with PFNA + Mix at both Low and Mid doses. This effect was not observed for PFNA alone (Fig. 5). For all other genes, no effects were found at the Low and Mid PFNA groups. At the High PFNA groups, where severe toxicity occurred, the aldo–keto reductase family 1 member C1 (AKR1C1), UDP-glucuronosyltransferase 2B15 (UGT2B15), CYP2C11, CYP1A2 and CYP2B6 were all found to be down-regulated, whereas CYP3A23/3A1 was found to be up-regulated (data for the high-dose groups are not shown on the graphs).
In adipose tissue, CYP19 mRNA was up-regulated for Low PFNA + Mix as compared to Low PFNA (Fig. 5). At the toxic High PFNA, CYP11 was up-regulated (data not shown). There were no effects on the other steroid metabo-lism enzymes: CYP17, 17β HSD and 5α reductase (data not shown).
Kidney transporter protein levels
OAT1 was increased in whole kidney homogenates when Low PFNA was combined with Mix (Fig. 6). OATP4C1 was decreased by Low PFNA alone. This effect was nor-malised by addition of Mix (Fig. 6). At the Mid dose level, no significant effects were found. OATP1/3 was not affected at any of the investigated dose levels (data not shown).
Discussion
Relevance of the employed PFNA doses in relation to human exposure levels
The hypothesis of the current study was that adverse mix-ture effects occur at doses approaching high-end human exposure levels of food chemicals. Our aim was to reach a plasma level of PFNA covering the combined human
Fig. 3 PFNA at a dose of 0.0125 mg/kg bw/day plus Mix induces an effect on androgens. Rats were administered PFNA at 0.0125or 0.25 mg/kg bw/day for 14 days in the presence or absence of a mix-ture of 14 chemicals (Mix) at a total dose of 2.5 mg/kg bw/day. Ster-oid hormones were measured in plasma by use of LC–MS/MS. Low PFNA + Mix increased testosterone and dihydrotestosterone. A nor-malising effect was seen on corticosterone with Low PFNA + Mix. Data are mean plus or minus SEM. N was 10 except for Mid PFNA, Mix and Mid PFNA + Mix where n was 8. Data were analysed by one-way ANOVA or Kruskal–Wallis test. **p < 0.01 by Dunnett’s ANOVA post-test for PFNA versus control. §p < 0.05 and §§p < 0.01 by t test for PFNA versus PFNA + Mix. For dihydrotestosterone, a one sample t test was applied versus the detection limit of this hor-mone. §§p < 0.01
▸

Arch Toxicol
1 3

Arch Toxicol
1 3
plasma concentrations of perfluorinated compounds such as PFOA, PFOS and PFNA. According to Lau et al. (2007), human exposure means obtained from a substantial num-ber of investigations gave a combined value of these three perfluorinated compounds of 13–429 ng/mL (or 13–117 ng/mL if the second highest PFOA value is used). For com-parison, the 95th percentile obtained from the NHANES study was 67.6 ng/mL for PFOA, PFNA and PFOS com-bined (CDC 2009) which is in line with the Lau et al. data. A PFNA plasma concentration of 396 ng/mL was found in the Low PFNA group, indicating that PFNA in this study may be up to a factor of six higher than a high-end human exposure level (Table 1). However, this depends on the choice of a ‘high-end’ exposure for which a fixed, true value do not exist. In a study, not reported in the review by Lau et al., Emmett et al. found a mean of 423 ng/mL PFOA for persons not subjected to occupational exposure (median 329, n = 312) and a mean of 824 ng/mL in persons with substantial occupational exposure (median 775, n = 18) (Emmett et al. 2006). Taking this into account, the present PFNA exposure in the rats was close to a combined human PFNA, PFOA and PFOS exposure. We made the assump-tion that the applied PFNA exposure should represent
exposure to other perfluorinated congeners, although it can be argued that the difference in structures of these mol-ecules affects potency and binding specificity to different target molecules in the mammalian body. It is noted that a range of congeners different from PFNA, PFOA and PFOS exist, and these likely also contribute to the combined effects of perfluorinated compounds in humans.
Observed mixture effects and discussion on the presence of interactions
The aim of the present investigation was to test whether a relevant mixture of food chemicals at doses approaching high-end human exposure levels exerted adverse effects. The study was designed to target testosterone, and we found this steroid as well as its downstream metabolite, dihy-drotestosterone and its precursor, androstenedione, to be affected by the mixture. There were no significant effects of Low PFNA or of Mix alone, whereas androgen levels increased considerably after exposure to Low PFNA in combination with Mix; thus for testosterone, dihydrotestos-terone, and androstenedione a non-monotonic effect seemed to have occurred. Previously, additive mixture effects have
Fig. 4 Effects of dose PFNA and Mix on pituitary hormone lev-els. Rats were administered PFNA at 0.0125 or 0.25 mg/kg bw/day for 14 days in the presence or absence of a mixture of 14 chemi-cals (Mix) at a total dose of 2.5 mg/kg bw/day. Hormones were measured by use of a Milliplex Map Rat Pituitary Luminex Kit. LH was decreased by Mid PFNA + Mix. FSH was decreased by Low PFNA + Mix. For ACTH, prolactin and brain-derived neuro-
trophic factor Mid PFNA + Mix was lower than Mid PFNA alone. Data are mean plus or minus SEM. N was 8 except for control (n = 10) and Low PFNA (n = 9). Data were analysed by one-way ANOVA. #p < 0.05 by Dunnett’s ANOVA post-test for PFNA + Mix versus control. §p < 0.05 and §§p < 0.01 by t test for PFNA versus PFNA + Mix

Arch Toxicol
1 3
been found for chemicals each present at doses for which measurement techniques are not sensitive enough to detect their individual effects (Hass et al. 2007; Silva et al. 2002). Feng et al. have previously demonstrated a non-mono-tonic dose–response curve of PFNA on testosterone in rats with an increase at 1 mg/kg bw/day and a decrease at 5 mg/kg bw/day. This supports the presence of such a non-monotonic relationship although this was seen at higher-dose levels. Also Wade et al. (2002) found a non-monotonic dose–response effect on natural killer cell lytic activity following exposure to a mixture containing 18 persistent contaminants at doses ranging from 1× to 100× the estimated safe level.
Looking at the PFNA plasma concentration, a toxicoki-netic interaction was found in that the PFNA plasma con-centration was increased at Low PFNA + Mix as compared to Low PFNA. PFNA could not be detected in animals only given Mix, indicating that no background PFNA levels, e.g., from the feed were present in the animals. Thus, the 14-chemical mixture is able to increase the PFNA plasma levels at lower doses possibly by interference with ADME issues for PFNA. For corticosterone plasma levels, Low PFNA + Mix normalised an increase in corticosterone observed for Low PFNA. Also on the kidney OATP4C1 transporter, the addition of Mix to Low PFNA normalised a Low PFNA-induced decrease in the protein level. These data suggest that in addition to reported food–drug inter-actions (Bailey et al. 1989), food–environment chemical interactions may occur at the toxicokinetic level at doses approaching high-end human exposure levels. The effect of Mix on PFNA plasma levels is due to a toxicokinetic inter-action between Mix and PFNA, but whether the effect on steroid hormone levels is due to kinetic or dynamic inter-ferences is unknown. It is striking that we have detected potential non-monotonic low-dose effects. This gives food for thought concerning the extrapolation from high to low doses typically done in toxicological studies and concern-ing future human risk assessment of chemicals.
In this study, possible effects of a chemical mixture were investigated in juvenile male rats 7 weeks of age at onset. Male Wistar rats are considered sexually mature when they
Fig. 6 Effects of low-dose PFNA and Mix on protein levels of organic anion transporter 1 and organic anion-transporting poly-peptide. Rats were administered PFNA at 0.0125 mg/kg bw/day for 14 days in the presence or absence of a mixture of 14 chemicals (Mix) at a total dose of 2.5 mg/kg bw/day. Protein levels of OAT1 (organic anion transporter 1) and OATP4C1 (organic anion-trans-porting polypeptide-4C1) were measured by Western blotting. All samples were measured in a total number of three blots per protein. Only one blot is shown on the figure. A standard sample on each blot was used for normalisation to obtain a graph representing all samples (n = 9 for control, n = 8 for Mix, n = 10 for Low PFNA (0.0125 mg/kg bw/day) and n = 10 for Low PFNA + Mix). OAT1 was increased at Low PFNA + Mix as compared to Low PFNA. OATP4C1 was decreased at Low PFNA as compared to control, and this effect was normalised at Low PFNA + Mix. Data are mean plus or minus SEM. Data were not normal distributed and were therefore tested by use of the nonparametric Mann–Whitney test. ***p < 0.001 for PFNA versus con-trol. §p < 0.05 and §§p < 0.01 for PFNA versus PFNA + Mix
▸

Arch Toxicol
1 3
are around 50 days old; thus, we have investigated effects in rats just post-puberty. In our view, marked hormone changes may be considered as adverse. Increased testos-terone in males has for example been linked to increased aggression (McGinnis 2004); and androgenic anabolic ster-oid abuse has been linked to cardiac disease (Ahlgrim and Guglin 2009).
Possible mechanisms involved in the mixture effects on androgens
The possible mechanisms underlying the observed mix-ture effects could provide a deeper understanding of how such effects develop in the mammalian body. Regarding the mixture effects on androgens, mechanisms involved could be related to (a) increased production or release of steroid hormones either via hormonal factors or locally induced (b) decreased tissue deposition of hormones (c) decreased metabolism of androgens and/or (d) decreased excretion of hormones. The pituitary hormone LH is involved in the regulation of testosterone production in the testes, and LH was decreased by Mid PFNA + Mix, and this may reflect a secondary negative feedback on the pituitary caused by disturbed steroid hormone levels.
In the testes, there were no findings to explain the effects seen on androgens except that a disturbed 17β HSD mRNA regulation may be part of the explanation. In adipose tissue, CYP19 was increased at Low PFNA + Mix as compared to Low PFNA. This suggests increased conversion of testoster-one to estradiol when Mix is present. Among the chemicals in Mix, only DDE has shown a link to CYP19. Daughters of Michigan fish-eaters had increased gene expression of CYP19 in blood leucocytes that was correlated to prenatal DDE levels (Karmaus et al. 2011). The fact that CYP19 was increased in the current study indicates that a compensatory mechanism to eliminate the excess testosterone might be in play.
In the liver, CYP expression was investigated because CYP3A4 and CYP2C9 (CYP3A23/A1 and 2C11in rats) are involved in the hydroxylation of testosterone, and these enzymes are known to be inhibited by bergamottin and glabridin constituents of the Mix (Cheng and Schenkman 1983; Guengerich 1999; Kenworthy et al. 1999; Martignoni et al. 2006; Tassaneeyakul et al. 2000; Yamazaki and Shi-mada 1997). Moreover, in the ToxCast (high throughput in vitro screening project) several perfluorinated carbox-ylic acids including PFNA as well as BPA and prochloraz (constituents of the Mix) have been found in vitro to inhibit CYP2C9 (US_Environmental_Protection_Agency 2014). However, no effects on the mRNA levels of CYP3A23/1 or CYP 2C11 for Low PFNA in combination with Mix were found. Also, on the steroid glucuronidation pathway, there were no findings to explain the effects seen on androgens.
Fig. 5 mRNA levels of 17β HSD in testes, 11β HSD in liver tis-sue and CYP19 in adipose tissue. Rats were administered PFNA at 0.0125 or 0.25 mg/kg bw/day for 14 days in the presence or absence of a mixture of 14 chemicals (Mix) at a total dose of 2.5 mg/kg bw/day. mRNA levels were measured by use of qPCR. 11β and 17β HSD were decreased by Low and Mid PFNA + Mix. CYP19 was higher for Low PFNA + Mix as compared to Low PFNA. Data are mean plus or minus SEM. N was 10 except for Mid PFNA, Mix and Mid PFNA + Mix where n was 8. Data were analysed by one-way ANOVA. #p < 0.05, ##p < 0.01 and ###p < 0.001 by Dunnett’s ANOVA post-test for PFNA + Mix versus control. §p < 0.05 and §§p < 0.01 by t test for PFNA versus PFNA + Mix

Arch Toxicol
1 3
To study interaction via excretion, we investigated organic anion transporters in the kidney because these transporters have been suggested to play a role in PFNA and testosterone excretion. OAT1 as well as OATP4C1 transport organic anions from the blood into the kidney tubular cells for subsequent secretion into the pre-urine (Han et al. 2012). With Low PFNA + Mix, an increase in protein level of OAT1 was found (Fig. 6) but neither Mix nor PFNA individually exerted this effect. It has been shown that testosterone stimulates OAT1 (Cerrutti et al. 2002; Ljubojevic et al. 2004) thus the increased testoster-one level seen at Low PFNA + Mix correlates well with an increase in this transporter. This up-regulation, however, might also reflect that OAT1 could transport PFNA and that this transporter is up-regulated as a compensatory mecha-nism in order to excrete the increased amounts of PFNA. For OATP4C1, the Mix normalised the Low PFNA-induced decrease in the protein level, suggesting that the Mix pro-tects the body by allowing an increased transport of PFNA (Fig. 6). As for OAT1, OATP4C1 is increased by testos-terone (Lu et al. 1996), again suggesting the increased testosterone level to be causing the normalisation of the OATP4C1 expression. Taken together, the data on kid-ney transport do not readily explain the mixture effect on androgens at Low PFNA + Mix and may rather reflect downstream effects of the increased androgen levels.
Possible mechanisms underlying the increased PFNA concentration caused by Mix
The increase in the PFNA plasma concentration fol-lowing Low PFNA + Mix as compared to Low PFNA may be explained by (1) increased PFNA absorption, (2) decreased metabolism, (3) decreased tissue deposition, or (4) decreased excretion. We looked for metabolites of PFNA but did not find any significant metabolism, and this is in accordance with the literature (Lau et al. 2007). Regarding proposed reabsorption of perfluorinated com-pounds, the OATP1 is located on the luminal side of the tubular cells (Han et al. 2012) and has been demonstrated to have the ability to transport perfluorocarboxylates (Yang et al. 2009b). OATP1 was not found being affected by Low PFNA alone or in combination with Mix; thus, testoster-one-stimulated reabsorption of PFNA via this transporter seems not to be underlying the increased plasma concen-tration of PFNA. However, it should be noted that we did not measure two other OATs involved in perfluorocar-boxylate transport, namely OAT2 and OAT3 (Kudo et al. 2002). Whether the PFNA plasma-level effect is a cause or a consequence of (or not related to) the androgen levels is unknown. However, when we depict the effect on andro-gen levels as a function of the internal PFNA plasma levels (graph not shown), we still observe a pronounced increase
in androgen levels, indicating that there is more to the androgen effect than just affected toxicokinetics by PFNA alone.
Possible mechanisms underlying the normalisation of corticosterone
The mechanism underlying the normalisation of the corti-costerone level by the Mix is likely explained by the dimin-ished plasma ACTH observed when Mix was administered along with PFNA. Thus, a central effect on the pituitary may be evident. The enzymes responsible for inter-con-version of corticosterone to the physiologically inactive 11-dehydrocorticosterone in rats are 11β HSD (Thomson et al. 1998). We found PFNA + Mix to down-regulate this enzyme at the mRNA level. A differential regulation of this enzyme may be an explanation of the observed differential effect on corticosterone caused by PFNA with or without Mix.
Mixture-independent effects of PFNA suggest non-monotonic dose–response relationships
At Low PFNA dose, an increased corticosteroid effect as well as a diminished effect of the OATP4C1 protein level in kidney was observed (Fig. 6), suggesting that this chemi-cal exerts low-dose effects on its own. The PFNA effect on corticosterone plasma levels could involve regulation of 11β HSD. PFNA has shown a potential to activate liver X receptor α (LXRα) (US_Environmental_Protection_Agency 2014), and LXR negatively regulates expression of 11β HSD (Vogeli et al. 2013). At High PFNA, macro-scopical and microscopical pathology of the liver as well as decreased body and organ weights showed that this dose is highly toxic to the animals. From that point of view, it is not surprising that the mRNA levels of several enzymes are down-regulated as seen for testes and liver, along with the testosterone and androstenedione plasma concentration being down-regulated at the high dose. Several enzymes like StAR, BZRP and CYP11A in the testes were down-regulated and provide a suggestion for the decrease in testosterone and androstenedione at high doses. Steatosis, obscure hepatic cell borders and a decrease in testosterone have been shown for perfluorinated compounds by others previously (Fang et al. 2010; Feng et al. 2009; Yang et al. 2009a). Notably, when these toxic effects occur, CYP1A2, CYP2B6 and CYP2C11 were down-regulated by PFNA, whereas CYP3A23/3A1 corresponding to the human CYP3A4 was up-regulated suggesting that this CYP is up-regulated to increase elimination of multiple toxic metabo-lites and confirming the broad substrate specificity of this enzyme. Our findings highlight the challenge of extrapolat-ing from high-dose to low-dose effects, as is the ordinary

Arch Toxicol
1 3
practice within toxicology and suggest that lower doses should be employed as well in toxicological studies.
Conclusion
We found that a human relevant mixture of fifteen chemi-cals given to rats at doses approaching human realistic high-end exposure levels disturbed several plasma steroid and pituitary hormone levels. Androgen levels were non-monotonically increased by >100 %, and corticosterone levels were decreased by 60 %. Moreover, a toxicokinetic interaction may have occurred as the Mix caused a mark-edly increased PFNA plasma concentration. Our data sug-gests that mixture effects of chemicals may be non-mono-tonic and may occur even at doses approaching high-end human exposure levels. Further studies are warranted to determine whether this reflects a general phenomenon that should be taken into consideration when predicting human mixture toxicities.
Acknowledgments Excellent technical assistance was provided by Anne Ørngreen, Maja Danielsen, Eva Ferdinansen, Elise E. Navntoft, Eigil V. Frank, Kenneth R. Worm, Kitt Lademann, Lis Abildgaard Andersen, Birgitte Møller Plesning, Liljana Petrevska, Heidi Letting and Dorte Lykkegaard Korsbech. The Ministry of Food, Agricul-ture and Fisheries of Denmark and the Danish Veterinary and Food Administration are acknowledged for their financial support.
Conflict of interest The authors declare that there are no conflicts of interest.
References
Ahlgrim C, Guglin M (2009) Anabolics and cardiomyopathy in a bodybuilder: case report and literature review. J Cardiac Fail 15(6):496–500. doi:10.1016/j.cardfail.2008.12.014
Bailey DG, Dresser GK, Bend JR (2003) Bergamottin, lime juice, and red wine as inhibitors of cytochrome P450 3A4 activity: compari-son with grapefruit juice. Clin Pharmacol Ther 73(6):529–537. doi:10.1016/S0009-9236(03)00051-1
Bailey DG, Spence JD, Edgar B, Bayliff CD, Arnold JM (1989) Etha-nol enhances the hemodynamic effects of felodipine. Clin Invest Med 12(6):357–362
CDC (2009) Fourth national report on human exposure to environ-mental chemicals. Department of health and human services centers for disease control and prevention
Cerrutti JA, Brandoni A, Quaglia NB, Torres AM (2002) Sex differ-ences in p-aminohippuric acid transport in rat kidney: role of membrane fluidity and expression of OAT1. Mol Cell Biochem 233(1–2):175–179. doi:10.1023/A:1015563021602
Cheng KC, Schenkman JB (1983) Testosterone metabolism by cytochrome P-450 isozymes RLM3 and RLM5 and by microsomes. Metabolite identification. J Biol Chem 258(19):11738–11744
Christiansen S, Kortenkamp A, Axelstad M et al (2012) Mixtures of endocrine disrupting contaminants modelled on human high end exposures: an exploratory study in rats. Int J Androl 35(3):303–316. doi:10.1111/j.1365-2605.2011.01242.x
Crofton KM, Craft ES, Hedge JM et al (2005) Thyroid-hormone-disrupting chemicals: evidence for dose-dependent additivity or synergism. Environ Health Perspect 113(11):1549–1554
Demur C, Metais B, Canlet C et al (2013) Dietary exposure to a low dose of pesticides alone or as a mixture: the biological metabolic fingerprint and impact on hematopoiesis. Toxicology 308:74–87. doi:10.1016/j.tox.2013.03.004
Emmett EA, Shofer FS, Zhang H, Freeman D, Desai C, Shaw LM (2006) Community exposure to perfluorooctanoate: relation-ships between serum concentrations and exposure sources. J Occup Environ Med/American College of Occupational and Environmental Medicine 48(8):759–770. doi:10.1097/01.jom.0000232486.07658.74
Fang X, Feng Y, Wang J, Dai J (2010) Perfluorononanoic acid-induced apoptosis in rat spleen involves oxidative stress and the activation of caspase-independent death pathway. Toxicology 267(1–3):54–59. doi:10.1016/j.tox.2009.10.020
Feng Y, Shi Z, Fang X, Xu M, Dai J (2009) Perfluorononanoic acid induces apoptosis involving the Fas death receptor signaling pathway in rat testis. Toxicol Lett 190(2):224–230. doi:10.1016/j.toxlet.2009.07.020
Foti RS, Wahlstrom JL (2008) The role of dietary supplements in cytochrome P450-mediated drug interactions. Bol Latinoam Car-ibe 7(2):66–84
Fuhrman B, Buch S, Vaya J et al (1997) Licorice extract and its major polyphenol glabridin protect low-density lipoprotein against lipid peroxidation: in vitro and ex vivo studies in humans and in atherosclerotic apolipoprotein E-deficient mice. Am J Clin Nutr 66(2):267–275
Guengerich FP (1999) Cytochrome P-450 3A4: regulation and role in drug metabolism. Annu Rev Pharmacol Toxicol 39:1–17. doi:10.1146/annurev.pharmtox.39.1.1
Hadrup N, Loeschner K, Bergstrom A et al (2012) Subacute oral tox-icity investigation of nanoparticulate and ionic silver in rats. Arch Toxicol 86(4):543–551
Hadrup N, Petersen JS, Windfeld S et al (2007) Differential down-regulation of aquaporin-2 in rat kidney zones by peripheral noci-ceptin/orphanin FQ receptor agonism and vasopressin type-2 receptor antagonism. J Pharmacol Exp Ther 323(2):516–524
Hadrup N, Taxvig C, Pedersen M, Nellemann C, Hass U, Vinggaard AM (2013) Concentration addition, independent action and gen-eralized concentration addition models for mixture effect predic-tion of sex hormone synthesis in vitro. PLoS One 8(8):e70490. doi:10.1371/journal.pone.0070490
Han X, Nabb DL, Russell MH, Kennedy GL, Rickard RW (2012) Renal elimination of perfluorocarboxylates (PFCAs). Chem Res Toxicol 25(1):35–46. doi:10.1021/Tx200363w
Hass U, Scholze M, Christiansen S et al (2007) Combined exposure to anti-androgens exacerbates disruption of sexual differentiation in the rat. Environ Health Perspect 115(Suppl 1):122–128
Karmaus W, Osuch JR, Landgraf J, Taffe B, Mikucki D, Haan P (2011) Prenatal and concurrent exposure to halogenated organic compounds and gene expression of CYP17A1, CYP19A1, and oestrogen receptor alpha and beta genes. Occup Environ Med 68(6):430–437. doi:10.1136/oem.2009.053249
Kent UM, Aviram M, Rosenblat M, Hollenberg PF (2002) The licorice root derived isoflavan glabridin inhibits the activities of human cytochrome P450S 3A4, 2B6, and 2C9. Drug Metab Dis-pos 30(6):709–715
Kenworthy KE, Bloomer JC, Clarke SE, Houston JB (1999) CYP3A4 drug interactions: correlation of 10 in vitro probe substrates. Br J Clin Pharmacol 48(5):716–727
Kortenkamp A (2014) Low dose mixture effects of endocrine dis-rupters and their implications for regulatory thresholds in chemical risk assessment. Curr Opin Pharmacol 19C:105–111. doi:10.1016/j.coph.2014.08.006

Arch Toxicol
1 3
Kudo N, Katakura M, Sato Y, Kawashima Y (2002) Sex hormone-reg-ulated renal transport of perfluorooctanoic acid. Chem-Biol Inter-act 139(3):301–316. doi:10.1016/S0009-2797(02)00006-6
Lau C, Anitole K, Hodes C, Lai D, Pfahles-Hutchens A, Seed J (2007) Perfluoroalkyl acids: a review of monitoring and toxicological findings. Toxicol Sci 99(2):366–394. doi:10.1093/toxsci/kfm128
Lim HK, Duczak N Jr, Brougham L, Elliot M, Patel K, Chan K (2005) Automated screening with confirmation of mechanism-based inactivation of CYP3A4, CYP2C9, CYP2C19, CYP2D6, and CYP1A2 in pooled human liver microsomes. Drug Metab Dispos 33(8):1211–1219. doi:10.1124/dmd.104.003475
Ljubojevic M, Herak-Kramberger CM, Hagos Y et al (2004) Rat renal cortical OAT1 and OAT3 exhibit gender differences determined by both androgen stimulation and estrogen inhibition. Am J Phys-iol Renal 287(1):F124–F138. doi:10.1152/ajprenal.00029.2004
Lu R, Kanai N, Bao Y, Wolkoff AW, Schuster VL (1996) Regulation of renal oatp mRNA expression by testosterone. Am J Physiol Renal Fluid Electrolyte Physiol 270(2):F332–F337
Martignoni M, Groothuis GM, de Kanter R (2006) Species differences between mouse, rat, dog, monkey and human CYP-mediated drug metabolism, inhibition and induction. Expert Opin Drug Metab Toxicol 2(6):875–894. doi:10.1517/17425255.2.6.875
McGinnis MY (2004) Anabolic androgenic steroids and aggression: studies using animal models. Ann N Y Acad Sci 1036:399–415. doi:10.1196/annals.1330.024
Merhi M, Demur C, Racaud-Sultan C et al (2010) Gender-linked hae-matopoietic and metabolic disturbances induced by a pesticide mixture administered at low dose to mice. Toxicology 267(1–3):80–90. doi:10.1016/j.tox.2009.10.024
Mortensen SK, Pedersen M (2007) Confirmatory analysis of acetylge-stagens in plasma using liquid chromatography-tandem mass spectrometry. Anal Chim Acta 586(1–2):217–222
Reagan-Shaw S, Nihal M, Ahmad N (2008) Dose translation from animal to human studies revisited. FASEB J 22(3):659–661. doi:10.1096/fj.07-9574LSF
Schmittgen TD, Livak KJ (2008) Analyzing real-time PCR data by the comparative C(T) method. Nat Protoc 3(6):1101–1108
Sigurjonsdottir HA, Franzson L, Manhem K, Ragnarsson J, Sigur-dsson G, Wallerstedt S (2001) Liquorice-induced rise in blood pressure: a linear dose-response relationship. J Hum Hypertens 15(8):549–552. doi:10.1038/sj.jhh.1001215
Silva E, Rajapakse N, Kortenkamp A (2002) Something from “noth-ing”–eight weak estrogenic chemicals combined at concentra-tions below NOECs produce significant mixture effects. Environ Sci Technol 36(8):1751–1756
Stanko JP, Enoch RR, Rayner JL et al (2010) Effects of prenatal expo-sure to a low dose atrazine metabolite mixture on pubertal timing and prostate development of male Long-Evans rats. Reprod Toxi-col 30(4):540–549. doi:10.1016/j.reprotox.2010.07.006
Tassaneeyakul W, Guo LQ, Fukuda K, Ohta T, Yamazoe Y (2000) Inhibition selectivity of grapefruit juice components on human cytochromes P450. Arch Biochem Biophys 378(2):356–363. doi:10.1006/abbi.2000.1835
Tatum-Gibbs K, Wambaugh JF, Das KP et al (2011) Comparative pharmacokinetics of perfluorononanoic acid in rat and mouse. Toxicology 281(1–3):48–55. doi:10.1016/j.tox.2011.01.003
Thomson LM, Raven PW, Smith KE, Hinson JP (1998) Effects of metyrapone on hepatic cortisone-cortisol conversion in the rat. Endocr Res 24(3–4):607–611
Tian M, Yan H, Row KH (2008) Extraction of glycyrrhizic acid and glabridin from licorice. Int J Mol Sci 9(4):571–577
Uesawa Y, Mohri K (2006) The use of heat treatment to elimi-nate drug interactions due to grapefruit juice. Biol Pharm Bull 29(11):2274–2278
US_Environmental_Protection_Agency (2014) Interactive chemical safety for sustainability (iCSS) dashboard. http://actor.epa.gov/dashboard/. Accessed 20 March 2014
Vogeli I, Jung HH, Dick B et al (2013) Evidence for a role of sterol 27-hydroxylase in glucocorticoid metabolism in vivo. J Endo-crinol 219(2):119–129. doi:10.1530/JOE-13-0141
Wade MG, Foster WG, Younglai EV et al (2002) Effects of subchronic exposure to a complex mixture of persistent contaminants in male rats: systemic, immune, and revoductive effects. Toxicol Sci 67(1):131–143. doi:10.1093/toxsci/67.1.131
Wen YH, Sahi J, Urda E et al (2002) Effects of bergamottin on human and monkey drug-metabolizing enzymes in primary cultured hepatocytes. Drug Metab Dispos 30(9):977–984
Yamazaki H, Shimada T (1997) Progesterone and testosterone hydroxylation by cytochromes P450 2C19, 2C9, and 3A4 in human liver microsomes. Arch Biochem Biophys 346(1):161–169. doi:10.1006/abbi.1997.0302
Yang C, Tan YS, Harkema JR, Haslam SZ (2009a) Differential effects of peripubertal exposure to perfluorooctanoic acid on mammary gland development in C57Bl/6 and Balb/c mouse strains. Reprod Toxicol 27(3–4):299–306. doi:10.1016/j.reprotox.2008.10.003
Yang CH, Glover KP, Han X (2009b) Organic anion transporting polypeptide (Oatp) 1a1-mediated perfluorooctanoate transport and evidence for a renal reabsorption mechanism of Oatp1a1 in renal elimination of perfluorocarboxylates in rats. Toxicol Lett 190(2):163–171. doi:10.1016/j.toxlet.2009.07.011
Paper III: Exposure to perfluorononanoic acid combined with a low-dose mixture of 14 human-relevant compounds disturbs energy/lipid homeostasis in rats
Metabolomics
Aim: Increasing the information obtained from toxicological studies by profiling of the plasma metabolite composition and hepatic gene expression; focusing on low dose effects of toxic chemicals on the metabolome.
Results: The metabolomics profiling displays a decrease in the phospholipids and neutral lipids. The mixture reduced mono- and diacylglycerols in the plasma. The primary effect is driven by the mixture. The transcriptomics profiling displays effect on PPAR mainly driven by PFNA.
Conclusion: A low dose of chemicals affects the metabolome and the transcriptome. The mechanism of action can be difficult to determine though both mixture and low PFNA seemed to have effect on the lipid metabolism of the rat. The transcriptomics data suggests that PFNA have effect on the lipid metabolism by affecting PPAR.

ORIGINAL ARTICLE
Exposure to perfluorononanoic acid combined with a low-dosemixture of 14 human-relevant compounds disturbs energy/lipidhomeostasis in rats
Kasper Skov1• Kristine Kongsbak1
• Niels Hadrup1• Henrik Lauritz Frandsen1
•
Terje Svingen1• Jørn Smedsgaard1
• Karine Audouze2,3• Aron Charles Eklund2
•
Anne Marie Vinggaard1
Received: 17 November 2014 / Accepted: 30 March 2015
� Springer Science+Business Media New York 2015
Abstract Humans are constantly exposed to a significant
number of compounds and many are readily detected in
human body fluids. Worryingly, several of these compounds
are either suspected to be, or have already been shown to be
harmful to humans either individually or in combination.
However, the potential consequences of low-dose exposure
to complex mixtures remain poorly understood. We have
profiled the effects on rat blood plasma and liver homeostasis
using metabolomics and transcriptomics following 2-week
exposure to either a mixture of 14 common chemicals (Mix),
perfluorononanoic acid (PFNA) at low (0.0125 mg/kg/day)
or mid (0.25 mg/kg/day) doses, or a combination of Mix and
PFNA. In blood plasma, 63 and 64 metabolites were sig-
nificantly changed upon exposure to Mix alone or
PFNA ? Mix, respectively. Twelve of the metabolites were
identified and comprised mainly lipids, with various lipid
classes differentially affected across study groups. In the
liver, expression of 182 and 203 genes—mainly related to
energy homeostasis and lipid metabolism—were differen-
tially expressed upon exposure to PFNA alone or
PFNA ? Mix, respectively. In general, Mix alone affected
lipid metabolism evident in blood plasma, whereas effects on
lipid metabolism in the liver were mainly driven by PFNA.
This study verifies that a chemical mixture given at high-end
human exposure levels can affect lipid homeostasis and that
the combined use of metabolomics and transcriptomics can
provide complimentary information allowing for a detailed
analysis of affected signaling pathways.
Keywords Perfluorononanoic acid � Metabolomics �Transcriptomics � Lipid homeostasis � Mixture toxicology
1 Introduction
Humans, particularly those living in industrialized coun-
tries, are continuously exposed to a plethora of compounds
through foods, cosmetics, pharmaceuticals, air inhalation
and more (Monosson 2005). A large number of studies
have reported on the presence of multiple compounds in
human body fluids (Calafat et al. 2007; NHANES 2013),
clearly showing that they are taken up by the body through
various routes. Also, epidemiological studies have shown
strong associations between compound mixtures and dis-
eases, for instance in relation to human reproduction
(Krysiak-Baltyn et al. 2012; Taylor et al. 2014). Therefore,
since animal studies have shown effects of human relevant
mixtures of environmental compounds given at doses close
to No Observed Adverse Effect Levels (NOAELs) for
single compounds (Christiansen et al. 2008, 2012; Axelstad
et al. 2014), the presence of many of these chemicals si-
multaneously is of real concern to human health.
The traditional approach for toxicological testing aims
at understanding the effect(s) of a single compound on
biological systems, from cells (in vitro) to animals
Kasper Skov and Kristine Kongsbak contributed equally to the work.
Electronic supplementary material The online version of thisarticle (doi:10.1007/s11306-015-0802-y) contains supplementarymaterial, which is available to authorized users.
& Anne Marie Vinggaard
1 National Food Institute, Technical University of Denmark,
Mørkhøj Bygade 19, 2860 Søborg, Denmark
2 Center for Biological Sequence Analysis, Department of
Systems Biology, Technical University of Denmark,
2800 Kongens Lyngby, Denmark
3 Inserm UMR-S 973, Molecules Therapeutiques In Silico,
Paris Diderot University, Paris, France
123
Metabolomics
DOI 10.1007/s11306-015-0802-y

(in vivo). The compound is typically investigated at vary-
ing doses in order to obtain information on parameters such
as the NOAEL. A few studies on rats exposed to chemicals
or chemical mixtures at doses representing human expo-
sure levels have been reported (Moser et al. 2006; Chen
et al. 2014; Hadrup et al. 2015). These studies suggest that
even at low doses, certain compounds can have effects on
biological systems, for instance the plasma metabolome.
However, there still is a significant gap in knowledge re-
garding effects of low-dose chemical mixtures on either the
metabolome or transcriptome at the ‘omics’ level.
‘Omics’ technologies have provided new approaches to
evaluate the effects of toxic compounds. For instance,
fluorinated compounds have been shown to change the lipid
metabolism of both rats and zebrafish (Fang et al. 2012a;
Zhang et al. 2012) and endocrine disrupting compounds such
as bisphenol A have been shown to cause changes to the
metabolome even at doses far below the NOAEL (Chen et al.
2014). In general, changes in the transcriptome and meta-
bolome are detectable even after exposure to a low dose of
certain compounds, which suggests that these methods can
be valuable tools for understanding how the compounds af-
fect the organism where obvious phenotypes are absent
(Chen and Kim 2013). Furthermore, it has been shown that a
mixture of compounds at low doses can result in a marked
effect even when individual compounds show no detectable
effect and that this effect is marked even if they ‘only’ act
additively (Silva et al. 2002).
We wanted to investigate the effects of a mixture of com-
pounds (Mix) alone and together with increasing doses of the
perfluorocarboxylic acid, perfluorononanoic acid (PFNA), as
well as the effects of PFNA alone. The Mix was composed of
12 environmentally relevant endocrine disrupting compounds
at high-end human exposure levels (Christiansen et al. 2012)
and two food ingredients in doses corresponding to a high-end
daily intake of grapefruit and licorice. We hypothesized that
adverse effects would be observed with Mix alone or when
combined with low dose PFNA. By use of two complementary
omics methods, metabolomics and transcriptomics, we pro-
filed the effects in blood plasma and livers of exposed rats and
compared them to adverse effects observed at higher PFNA
doses. We found significant changes both to the metabolome,
as detected in plasma, and the liver transcriptome following
exposure to Mix and PFNA.
2 Materials and methods
2.1 Compounds and dosing
Compounds were selected as previously described (Hadrup
et al. 2015). Animals were dosed with a mixture of 12
compounds: bisphenol A, butylparaben, dibutyl phthalate
(DBP), bis(2-ethylhexyl)phthalate (DEHP), 4-methylben-
zylidene camphor, octyl methoxycinnamate, dichlor-
odiphenyldichloroethylene (p,p’-DDE), epoxiconazole,
linuron, prochloraz, procymidone, vinclozolin) and de-
scribed elsewhere (Christiansen et al. 2012; Hadrup et al.
2013), along with the two food components; glabridin from
licorice and bergamottin from grapefruit (Hadrup et al.
2015), both known to inhibit the activity of cytochrome
P450s (CYPs) metabolizing hormones and chemicals. The
total dose of the Mix was 2.5 mg/kg/day and the ratio of the
compounds is presented in Supplementary Table 1. The dose
of Mix was based on previously observed endocrine dis-
ruption (Christiansen et al. 2012), albeit 24-times lower
herein to reflect human exposure corrected for different body
surface areas of rat and human. In addition to Mix, animals
were exposed to three different doses of PFNA, the lowest
dose corresponding to a high-end human exposure level (Lau
et al. 2007). The two lowest doses were Low = 0.0125 mg/
kg/day and Mid = 0.25 mg/kg/day. A high dose of PFNA
(5 mg/kg/day) was part of the study as well but was excluded
from the mechanistic analyses in this paper due to the ob-
served severe toxicity (Hadrup et al. 2015) that would
hamper the interpretation of data.
2.2 Animals
The animal study has been described previously (Hadrup
et al. 2015). In brief, male Wistar Hannover Galas rats at
6 weeks of age were housed two per cage with a 12-h
light/dark cycle and ad libitum access to acidified tap water
and standard diet. The animals received vehicle (corn oil)
or test substances once daily by gavage for 14 days. Fifty-
four rats were randomly assigned into six groups (Table 1).
The last dose was administered to each animal 75–105 min
before euthanization. The rats were anaesthetized in CO2/
O2 prior to decapitation. Plasma was isolated from hep-
arinized neck blood by centrifugation at 1000g at 4 �C for
10 min and subsequently stored at -80 �C. Livers were
weighed and snap-frozen in liquid nitrogen.
2.3 Metabolomics
The procedure was as previously described (Skov et al.
2014). In brief, phospholipids were adsorbed on a
Table 1 Acronyms used for the different treatment groups and re-
spective number of animals per group
Without Mix With Mix Acronym
Control 10 8 Control/mix
0.0125 mg/kg/day 10 10 Low PFNA ± mix
0.25 mg/kg/day 8 8 Mid PFNA ± mix
K. Skov et al.
123

phospholipid SPE column (Supelco, Sigma-Aldrich). The
eluate was collected, dried and extracted using first 200 ll
heptane to isolate the lipids followed by 200 ll methanol to
extract the more polar compounds. The phospholipids were
eluted from the SPE column using 300 ll 10 % NH4OH in
methanol. The phospholipid, lipid and the polar fractions
were analyzed by an HPLC system combined with a Maxis
Quadrupol Time-of-flight mass spectrometer (Bruker Dal-
tonics, Bremen, Germany).
Data were analyzed with Profile Analysis 2.1 (Bruker
Daltonics, Bremen, Germany). Data were extracted using
the ‘‘find molecular features’’ algorithm in a mass range
from 50 to 1100 m/z value. The noise was reduced by
removing peaks that were present in \50 % of the samples
among all treatment groups and at the same time had a
peak intensity of B3000. The calculations were carried out
in R (R Core Team 2012). The data were uploaded to
MetaboAnalyst.ca (Xia et al. 2012) and analyzed with
t test, principal component analysis, and partial least
squares discriminant analysis (PLS-DA). The accurate
masses of significantly different metabolites were searched
for in databases such as the human metabolome database
(HMDB) (Wishart et al. 2009). The identities of the com-
pounds were verified by comparison of MS/MS patterns
with data from the databases HMDB, METLIN (www.
metlin.scripps.edu) (Smith et al. 2005), LIPID MAPS
(www.lipidmaps.org) (Sud et al. 2007) and MassBank
(www.massbank.jp) (Horai et al. 2010).
2.4 Statistical analysis
Initial analyses of the metabolome data were performed on
the Metaboanalyst server (Xia et al. 2012). Here, a one-way
analysis of variance (ANOVA) comparing PFNA-treated
animals to control animals and PFNA ? Mix-treated ani-
mals to control, respectively, formed the basis for initial
selection of significantly altered metabolites. All p-values
were adjusted using false discovery rate (FDR) according to
the protocol implemented in the Metaboanalyst workflow,
and 0.05 was used as cut-off for statistical significance. The
statistically significantly altered metabolites were subse-
quently analyzed and plotted using GraphPad Prism version
5.00 for Windows (GraphPad Software, San Diego, CA,
USA, www.graphpad.com). The D’Agostino and Pearson
omnibus normality test was used to test for normality of the
data. If data were normally distributed, an ANOVA was
performed using Dunnett’s multiple comparisons test to
adjust the p-values. If data were not normally distributed,
data were log-transformed and, if normally distributed after
transformation, analyzed by ANOVA. If not normally dis-
tributed, a non-parametric Kruskal–Wallis test followed by a
Dunn’s multiple comparisons test was conducted. The cri-
teria for statistical significance was p \ 0.05, p \ 0.01 and
p \ 0.001 denoted *, ** and ***, respectively. Statistical
comparisons not applicable to ANOVA tests were carried
out using an unpaired, two-tailed Student’s t test.
2.5 Transcriptomics
Total RNA from six rat livers each from vehicle control,
Low PFNA ? Mix, and Mid PFNA ± Mix groups were
separately converted into labeled cRNA and applied to the
One-Color Microarray-Based Gene Expression Analysis
(Low Input Quick Amp Labeling) version 6.5 (Agilent
Technologies, Santa Clara, CA). Labeled cRNA from each
rat was hybridized to Agilent Whole Rat Genome Oligo
Microarrays (G4122F) for 17 h at 65 �C. The hybridized
microarrays were scanned using an Agilent DNA Mi-
croarray Scanner and evaluated using the Feature Extrac-
tion software version 10.7.3.1 according to protocol
GE1_107_Sep09 (Agilent Technologies) to generate fea-
ture extraction files for further analysis. Reads were quality
controlled by the software prior to release of the data.
Arrays that did not pass quality control were removed from
the dataset. Based on the quality control reports, two of the
six microarrays from the Mid PFNA ? Mix group were
excluded from further analysis. The remaining arrays, six
from each of control, Low PFNA ? Mix, and Mid PFNA
and the remaining four from Mid PFNA ? Mix were found
to be of high quality.
Extracted data were analyzed using the limma software
package (Smyth 2004, 2005) in R (R Core Team 2012).
Data were background corrected using the ‘normexp’
method (Ritchie et al. 2007) and normalized between ar-
rays using quantile normalization (Smyth and Speed 2003)
prior to statistical analyses. Within-array replicate probes
were replaced with the average expression level. To iden-
tify treatment-specific gene effects, we fitted a linear model
for each gene and applied empirical Bayes statistics (Smyth
2004) for each relevant two-group comparison. The FDR
was controlled using the Benjamini–Hochberg method
(Benjamini and Hochberg 1995). Reported p-values for the
significantly differentially expressed genes from the tran-
scriptomics analysis were all adjusted, and p-values B 0.05
were considered statistically significant.
2.6 Pathway analysis
Transcription data were analyzed with QIAGEN’s Inge-
nuity Pathway Analysis (IPA, QIAGEN Redwood City,
www.qiagen.com/ingenuity). IPA was used to map sig-
nificantly differentially expressed gene probes to genes,
and expression values were used for prediction of the in-
volvement of the differentially expressed genes in func-
tional networks, pathways, and diseases, and for graphical
representations. Using the Fisher’s Exact Test, we analyzed
Exposure to perfluorononanoic acid combined with a low-dose mixture…
123

the overlap between the differentially expressed genes in
our dataset and genes known to be involved in disease
networks, pathways, and diseases available in the Ingenuity
Knowledgebase. p-values B 0.05 were considered statisti-
cally significant.
3 Results and discussion
3.1 Rats exposed to low/medium levels of a
14-chemical Mix, PFNA, or both displayed
no macroscopic phenotypes
Our main objective was to determine if exposure to low
doses of PFNA with or without a background exposure to a
low-dose chemical mixture (Mix) can have undesirable ef-
fects on the metabolome and transcriptome of animals
otherwise displaying little to no phenotypic abnormalities.
For this, we chose to analyze blood and liver samples from
male rats that had been exposed to various levels of che-
micals for a period of 14 days during juvenile age. This
in vivo experiment has been described previously with a
focus on low dose hormonal changes and pathological
findings at high dose level (Hadrup et al. 2015). In the initial
assessment of the animals, exposure to high levels of PFNA,
with or without Mix, indicated hepatic steatosis of the liver;
a state of retention of lipids in the liver. Animals exposed to
lower levels of PFNA ± Mix, which encompasses the dose-
groups included in this study, showed no obvious morpho-
logical phenotypes. However, significant plasma levels of
PFNA after the exposure period were measured to be 1.1
and 30 lg/ml for Low PFNA ? Mix and Mid PFNA ?
Mix, respectively. In animals exposed to Low-, and Mid
PFNA only, plasma concentrations were 0.4 and 40 lg/ml,
respectively. The former is in the range of, or up to six times
the human high-end combined exposure to PFOA, PFNA
and PFOS (67.6–824 ng/ml) (Emmett et al. 2006; Lau et al.
2007; NHANES 2013; Hadrup et al. 2015). Thus, the ad-
dition of Mix significantly increased the plasma levels of
PFNA (2.8-fold for Low PFNA), indicating altered ADME
(absorption, distribution, metabolism, excretion) properties
of PFNA when Mix is co-administered.
The dose of Mix was calculated from a high-end ex-
posure level in the European population (Christiansen et al.
2012) and corrected for body surface area of rats compared
to humans (Hadrup et al. 2015). Surprisingly, none of the
compounds in Mix, or their corresponding metabolites,
were found when extracted ion chromatograms were cre-
ated based on their accurate mass. This could be due to
rapid metabolism of the compounds or that the levels were
below the limit of detection in the LC–MS analysis. Nev-
ertheless, as clear effects of PFNA levels were observed
when co-administered with Mix, we chose to include all
the different combinations of low- to mid-range exposure
groups in our analyses aimed at discerning more subtle
molecular phenotypes.
3.2 The blood plasma metabolome of rats exposed
to low/medium levels of chemical mixtures,
including PFNA, was significantly altered
In order to establish any potential effects caused by PFNA
exposure with or without a Mix background, any effects
caused by Mix alone was analyzed first. When compared to
control animals, Mix exposure significantly affected 63 out of
a total of 882 molecular features. As shown in Fig. 1, affected
phospholipids were lysophosphatidylcholines such as (lyso-
PC)(20:4) and lyso-PC(18:2), whereas affected neutral lipids
included diacylglycerols (DG) such as DG(18:1/18:3) and
DG(18:2/16:0), all depressed in serum of exposed animals.
Plots of all significantly altered metabolites are shown in
Supplementary Figs. 1 and 2, again with most of the affected
metabolites being depressed relative to control.
Altered lipid metabolism is a common response to
xenobiotic exposure (Karami-Mohajeri and Abdollahi 2011;
Zhang et al. 2013; Androutsopoulos et al. 2013; Zhang et al.
2014). An initial stress-response to a xenobiotic insult can
increase carbohydrate metabolism to meet a changing en-
ergy requirement, subsequently met by increased lipid and
protein metabolism (Karami-Mohajeri and Abdollahi 2011).
The general decrease in plasma lipid levels observed in the
Mix-exposed rats could reflect this situation, particularly
since the exposure lasted for a prolonged period (14 days),
potentially resulting in effects such as hepatic injury. Inter-
estingly, two of our identified lysophosphatidylcholines,
lyso-PC(18:2) and lyso-PC(20:4) have both been identified
as potential blood biomarkers for drug-induced hepatic
phospholipidosis (Saito et al. 2014), and in both instances
the response is reduced levels. Then, as drug-induced
phospholipidosis has been associated with liver inflamma-
tion and fibrosis (Rigas et al. 1986; Lewis et al. 1989), it
could suggest that we are observing compromised livers in
our rats exposed to Mix, albeit not observed at the macro-
scopic level.
In animals exposed to Low PFNA only, we also ob-
served changes to the blood metabolome, albeit different to
what was observed with Mix only. Using PLS-DA of all
the three fractions, we were able to separate the various
exposure groups, with the lipid fraction depicted in Fig. 2.
There was a clear difference between Low PFNA and Mix
groups, but it was not possible to positively identify the
specific metabolites responsible for this separation.
In all 30 metabolites separated Mix-exposed animals
from animals exposed to Low PFNA (Supplementary
Fig. 1). Mix alone altered 22 of these metabolites. For 6 out
of 22 metabolites the concomitant exposure to Low PFNA
K. Skov et al.
123

enhanced the effect on the metabolites. In the animals si-
multaneously exposed to Low PFNA and Mix, we observed
a general depression of lipid concentrations in blood plasma,
primarily diacylglycerols and the free fatty acid lignoceric
acid (Fig. 3a, b). The only metabolite directly affected by
Low PFNA, but not by Mix was the steroid hormone cor-
ticosterone, which was significantly elevated compared to
control animals (Fig. 3c). PFNA-exposure has previously
been shown to elevate plasma levels of both adrenocorti-
cotropic hormone and cortisol in mice, though only at the
highest dose of 5 mg/kg/day (Fang et al. 2008). Although it
is not clear why adrenocorticotropic hormone, and subse-
quently glucocorticoids, are elevated by PFNA-exposure, it
could be an inflammatory response, as PFNA can induce
immunotoxic responses (Fang et al. 2008), and elevated
endogenous glucocorticoid levels can subsequently suppress
the innate immune response (Liberman et al. 2007). None of
the metabolites that were altered by Mix and not by Low
PFNA ? Mix were identified.
We next performed the same analyses on animals having
been exposed to Mid PFNA doses with or without Mix.
Within these groups, we identified 24 metabolites with
Fig. 1 The six most significantly different metabolites in the Mix
group compared to the control group. In total, the levels of 63
metabolites were found to be significantly different between the two
groups (t test). The depicted metabolites belong to two metabolite
classes, diacylglycerols (DG) and lyso-phosphatidylcholines (lyso-
PC)
Fig. 2 PLS-DA plot of the
heptane fraction correlating the
four groups Control (n = 10),
Low PFNA (n = 10), Low
PFNA ? Mix (n = 10) and
Mix (n = 8). The plot illustrates
that Mix accounts for a major
part of the variance in the
dataset
Exposure to perfluorononanoic acid combined with a low-dose mixture…
123

significantly changed plasma concentrations, out of which
17 were altered by Mix alone (Supplementary Fig. 2).
Three representative metabolites that were significantly
changed between groups are shown in Fig. 3d–f. As shown,
there was an increase in the plasma level of lyso-PC(20:4)
in Mid PFNA exposed animals, but not in those exposed by
Mix alone. Exposure to Mix depressed plasma levels of the
diacylated phospholipids PC(18:0/16:1), which was further
depressed by the simultaneous exposure to PFNA despite
Mid PFNA exposure alone not affecting levels of these
metabolites (Fig. 3e).
To further investigate the contribution of Mix towards the
PFNA-induced effects, we compared the significant metabo-
lites resulting from statistical analysis of Mix versus control
(t test) and PFNA ? Mix versus control (ANOVA). We ob-
served that 24 metabolites were affected by all treatments, out
of which 12 were positively identified (Supplementary
Fig. 3). These 12 metabolites comprised neutral short-chained
lipids such as monoacylglycerols and phospholipids. Mix
alone affected the diacylglycerols, whereas the PFNA ? Mix
groups affected the diacylated phospholipids. Surprisingly,
lyso-PC(20:4) and lyso-PC(18:1) were depressed by Mix
exposure, elevated by Mid PFNA exposure, but depressed
beyond Mix alone when simultaneously exposed to Mid
PFNA and Mix (Fig. 3d, f). Similarly, although not elevated
by Mid PFNA exposure, blood plasma levels of lyso-PC(18:0)
and lyso-PC(16:1) appeared to be depressed more when ex-
posed to Mid PFNA ? Mix than when exposed to Mix alone
(Fig. 3e). It is difficult to discern a putative mechanism behind
these observations, but it likely reflects the complex regula-
tory mechanisms underpinning organismal homeostasis,
highlighting the importance of employing systems approaches
when analyzing effects caused by mixtures of compounds.
However, in some ways these metabolite changes are similar
to those associated with metabolic syndrome.
Over the last decades, there has been a worldwide in-
crease in metabolic syndrome (World Health Organization
2000), carrying with it an increased risk of developing
diabetes and cardiovascular disease. Some studies have
shown decreased phospholipid levels in blood plasma of
diabetics (Wang et al. 2005; Liu et al. 2013) and an ab-
normal ratio between lyso-PC and PC levels, which may
indicate a systemic change in relation to diabetes (Altmaier
et al. 2008). PCs are involved in the biosynthesis of mul-
tiple compounds and a decrease in PC levels can reflect
increased biosynthesis of lipids such as triacylglycerols
DDG(22:5/18:3)
Control
Low PFNA
Low PFNA +
MixMix
0
20000
40000
60000
80000
100000**
Buc
ket i
nten
sity
Lignoceric acid
Control
Low PFNA
Low PFNA +
MixMix
0
10000
20000
30000
40000
50000
**
Buc
ket i
nten
sity
Corticosterone
Control
Low PFNA
Low PFNA +
MixMix
0
20000
40000
60000
80000
**
Buc
ket i
nten
sity
Lyso-PC(20:4)
Control
Mid PFNA
Mid PFNA +
MixMix
0
5000
10000
15000
20000 #
Buc
ket i
nten
sity
PC(18:0/16:1)
Control
Mid PFNA
Mid PFNA +
MixMix
0
50000
100000
150000 **B
ucke
t int
ensi
tyLyso-PC(18:1)
Control
Mid PFNA
Mid PFNA +
MixMix
0
5000
10000
15000
20000
*
Buc
ket i
nten
sity
a b c
d e f
Fig. 3 Representative metabolite changes in the Low PFNA ? Mix
group. The plotted metabolites belong to two metabolite classes; PC
(phosphatidylcholine) and DG (diacylglycerol). Metabolite levels
were analyzed statistically for each group by comparison to control
(t test). For corticosterone (c) and lyso-PC(20:4) (d), PFNA alone
caused an increased metabolite level, whereas the combination of Mix
and PFNA generally caused a decreased metabolite level (DG(22:5/
18:3 (a) and PC(18:0/16:1) (e)). For lignoceric acid (b) and lyso-
PC(18:1) (f) the effect by Mix ? PFNA is stronger than the effect of
Mix or PFNA alone. #p-value of 0.053
K. Skov et al.
123

(Lagace and Ridgway 2013). Thus, the changes we ob-
served in the metabolome in rats following exposure to
Mix alone and PFNA ? Mix were comparable to the dif-
ferences observed in patients with metabolic syndrome
(Ferrannini et al. 2013). Also, lyso-PCs have been shown to
be elevated in metabolic syndrome patients (Chen et al.
2011).We observed elevated lyso-PCs for Mid PFNA ex-
posure, but not for the other exposure groups. This could
suggest that Mix, or components therein, protects against
some of the effects caused by PFNA. However, a more
likely scenario is that Mix exposure causes systemic
changes that lead to a metabolic response in order to
maintain tissue/serum homeostasis or to a suppressed im-
mune response, which subsequently leads to differing re-
sponses to PFNA.
The effects observed on lipid homeostasis following
exposure to Mix with or without PFNA may be attributed
to the presence of glabridin, a naturally occurring iso-
flavonoid from licorice that has been shown to inhibit the
activity of CYP2C9 in the liver (Kent et al. 2002). Studies
have shown that CYP2C9 is involved in the regulation of
lipid metabolism in the body (Kent et al. 2002; Kirchheiner
et al. 2003). Furthermore, people carrying a polymorphism
in CYP2C9 have a tendency towards having lower levels of
the lipid carriers LDL and HDL (Kirchheiner et al. 2003).
A decrease in LDL and HDL may result in decreased levels
of plasma lipids, including cholesterol and cholesterol
derivatives, as these are carrying lipids in the blood stream
(Kent et al. 2002). It could also be attributed to PFNA
inhibiting the activity of CYP2C9 similarly to glabridin (U.
S. Environmental Protection Agency 2014).
3.3 The liver transcriptome of rats was affected
by exposure to chemical mixtures, including
PFNA
For global gene expression analyses, we selected to study
the livers of animals exposed to Low PFNA ? Mix and
Mid PFNA with or without Mix relative to control, as we
expected little changes in the Mix alone group. As evident
in Supplementary Table 3, we observed no statistically
significant (p B 0.05) changes in transcript levels of any
gene in livers from Low PFNA ? Mix exposed rats. Fur-
ther, few genes in these groups displayed significant fold-
change differences in transcript abundance, with only three
genes displaying more than 1.5-fold difference: Cyp4a11
1.6-fold, Cyp2b6 2.0-fold and Acot1 2.1-fold. Allowing for
an adjusted p-value B 0.1 without a fold-change cut-off
value, 31 genes could be identified as differentially ex-
pressed between the exposed and control rat livers, and are
included in Table 2, which lists differentially expressed
genes related to energy homeostasis. The remaining genes
are listed in Supplementary Table 3.
Next we analyzed the transcriptome of livers obtained
from rats exposed to Mid PFNA ± Mix. Here, only an-
notated genes contained in the IPA database were included
when compiling lists of differentially expressed genes, thus
excluding most expressed sequence tags and genes without
adequate literature-based information for robust down-
stream analysis. At the statistically significant level of
p B 0.05, 203 genes from the PFNA ? Mix group and 182
genes from the PFNA only group were annotated as dif-
ferentially expressed (Supplementary Table 2). Of these,
the majority showed an upregulation in the exposed groups
as compared to controls.
Based on functional annotation of genes dysregulated in
the PFNA ± Mix dosing groups, fatty acid metabolism
was the main biochemical function affected (Table 2). For
instance, upregulated genes such as Crot, Crat, Acox1,
Ehhadh, Hadha, Hadhb, Decr2, Eci2, Ech1, are all in-
volved in peroxisomal fatty acid b-oxidation, whereas
Cpt2, Slc25a20, Acad11, Acadl, Acadm, Acads, Acadvl are
all involved in mitochondrial b-oxidation. Genes associ-
ated with lipid transport, fatty acid activation, and per-
oxisomal transport (Apoa2, Abcd3, Cd36, Slc27a2) were
also upregulated. Amongst the downregulated genes was
Fatty acid binding protein 5 (Fabp5). Similar effects on
lipid homeostasis have been shown in other studies (Gu-
ruge et al. 2006; Rosen et al. 2007; Fang et al. 2012a, b, c).
Here, the effects on lipid metabolism seem to be mainly
driven by PFNA exposure, as the effects are comparable
between animals exposed to Mid PFNA only and Mid
PFNA ? Mix.
With regards to aerobic respiration, a different tran-
scriptional profile was observed for Mid PFNA ? Mix
compared to Mid PFNA alone (Table 2). For instance, the
citric acid cycle enzymes, aconitase 2 (Aco2), isocitrate
dehydrogenase 3 (NAD?) beta (Idh3b), and succinate-CoA
ligase (Sucla2 and Suclg1) were significantly upregulated
by Mid PFNA, but not by Mid PFNA ? Mix. Only Aco2
and Suclg1 were upregulated in both groups relative to
control. Similarly, for enzymes in the electron transport
chain (Ndufa10, Ndufab1, Ndufs3 (complex I), and Sdhb
(complex II)) only Ndufa10 was significantly upregulated
in both groups. The other enzymes were only upregulated
in the Mid PFNA group. Finally, expression of genes en-
coding enzymes involved in glucose metabolism were
mainly disrupted by Mid PFNA ? Mix, except for a few
genes such as phosphofructokinase (Pfkm) that were only
significant with Mid PFNA and carbonic anhydrase VII
(Ca7) and STEAP family member 4 (Steap4), which were
differentially expressed by both groups. Thus, the tran-
scriptional profiles of Mid PFNA ± Mix are relatively
similar with only subtle differences observed based on
z-scores and p-values. Notably, a statistical comparison
between Mid PFNA and Mid PFNA ? Mix did not yield
Exposure to perfluorononanoic acid combined with a low-dose mixture…
123

Ta
ble
2G
enes
rela
ted
toen
erg
yh
om
eost
asis
that
wer
eal
tere
db
yM
idP
FN
A?
Mix
Sy
mb
ol
En
trez
IDE
ntr
ezg
ene
nam
eL
og
2(f
old
chan
ge)
Bio
log
ical
pro
cess
Lo
wP
FN
A?
Mix
Mid
PF
NA
Mid
PF
NA
?M
ix
Aco
15
06
55
Aco
nit
ase
1,
solu
ble
0.1
20
.33
70
.54
4A
ero
bic
met
abo
lism
Aco
27
92
50
Aco
nit
ase
2,
mit
och
on
dri
al-
0.0
65
0.4
28
0.4
48
Aer
ob
icm
etab
oli
sm
Co
x1
16
90
30
0C
yto
chro
me
co
xid
ase
asse
mb
lyh
om
olo
g1
1(y
east
)0
.24
0.5
93
0.2
35
Aer
ob
icm
etab
oli
sm
Idh
3b
94
17
3Is
oci
trat
ed
ehy
dro
gen
ase
3(N
AD
?)
bet
a0
.00
30
.32
50
.24
7A
ero
bic
met
abo
lism
Nd
ufa
10
67
87
59
|31
66
32
NA
DH
deh
yd
rog
enas
e(u
biq
uin
on
e)1
alp
ha
sub
com
ple
x,
10
,4
2k
Da
0.0
42
0.3
0.2
75
Aer
ob
icm
etab
oli
sm
Nd
ufa
b1
29
34
53
NA
DH
deh
yd
rog
enas
e(u
biq
uin
on
e)1
,al
ph
a/b
eta
sub
com
ple
x,
1,
8k
Da
0.0
51
0.2
69
0.1
16
Aer
ob
icm
etab
oli
sm
Nd
ufs
32
95
92
3N
AD
Hd
ehy
dro
gen
ase
(ub
iqu
ino
ne)
Fe–
Sp
rote
in3
,3
0k
Da
(NA
DH
-co
enzy
me
Qre
du
ctas
e)
0.0
85
0.3
36
0.2
8A
ero
bic
met
abo
lism
Sd
hb
29
85
96
Su
ccin
ate
deh
yd
rog
enas
eco
mp
lex
,su
bu
nit
B,
iro
nsu
lfu
r(I
p)
0.0
43
0.2
44
0.1
7A
ero
bic
met
abo
lism
Su
cla2
36
10
71
Su
ccin
ate-
Co
Ali
gas
e,A
DP
-fo
rmin
g,
bet
asu
bu
nit
0.1
45
0.4
30
.35
7A
ero
bic
met
abo
lism
Su
clg
11
14
59
7su
ccin
ate-
Co
Ali
gas
e,al
ph
asu
bu
nit
0.0
24
0.2
75
0.2
84
Aer
ob
icm
etab
oli
sm
Aca
a15
01
07
2|2
41
57
Ace
tyl-
Co
Aac
ylt
ran
sfer
ase
10
.11
31
.00
80
.98
5L
ipid
met
abo
lism
Aca
a21
70
46
5A
cety
l-C
oA
acy
ltra
nsf
eras
e2
0.3
94
0.5
56
0.9
69
Lip
idm
etab
oli
sm
Aco
t13
14
30
4A
cyl-
Co
Ath
ioes
tera
se1
0.3
86
0.9
84
1.4
27
Lip
idm
etab
oli
sm
Aco
t12
17
05
70
Acy
l-C
oA
thio
este
rase
12
0.2
45
0.5
57
0.6
66
Lip
idm
etab
oli
sm
Aco
t21
92
27
2A
cyl-
Co
Ath
ioes
tera
se2
0.2
41
1.3
12
1.4
97
Lip
idm
etab
oli
sm
Aco
t46
81
33
7A
cyl-
Co
Ath
ioes
tera
se4
0.2
64
1.1
15
1.5
85
Lip
idm
etab
oli
sm
Aco
t72
67
59
Acy
l-C
oA
thio
este
rase
70
.01
90
.43
10
.59
3L
ipid
met
abo
lism
Ald
h1
a12
41
88
Ald
ehy
de
deh
yd
rog
enas
e1
fam
ily
,m
emb
erA
10
.37
72
.07
72
.52
3L
ipid
met
abo
lism
Cy
p2
b6
36
15
23
|24
30
0C
yto
chro
me
P4
50
,fa
mil
y2
,su
bfa
mil
yB
,p
oly
pep
tid
e6
0.9
71
2.1
22
.56
1L
ipid
met
abo
lism
Cy
p2
c19
29
39
89
Cy
toch
rom
eP
45
0,
fam
ily
2,
sub
fam
ily
C,
po
lyp
epti
de
19
0.1
28
0.6
86
0.7
56
Lip
idm
etab
oli
sm
Cy
p2
j26
52
10
Cy
toch
rom
eP
45
0,
fam
ily
2,
sub
fam
ily
J,p
oly
pep
tid
e2
0.2
37
1.0
18
1.1
87
Lip
idm
etab
oli
sm
Cy
p4
a11
50
54
9C
yto
chro
me
P4
50
,fa
mil
y4
,su
bfa
mil
yA
,p
oly
pep
tid
e1
10
.64
32
.41
92
.56
8L
ipid
met
abo
lism
Cy
p4
a14
29
84
23
|24
30
6C
yto
chro
me
P4
50
,fa
mil
y4
,su
bfa
mil
ya,
po
lyp
epti
de
14
0.3
33
1.2
01
1.3
35
Lip
idm
etab
oli
sm
Dec
r11
17
54
32
,4-D
ien
oy
lC
oA
red
uct
ase
1,
mit
och
on
dri
al0
.23
41
.36
41
.34
4L
ipid
met
abo
lism
Ep
hx
26
50
30
Ep
ox
ide
hy
dro
lase
2,
cyto
pla
smic
0.2
43
1.2
01
1.2
67
Lip
idm
etab
oli
sm
Gcd
h3
64
97
5G
luta
ryl-
Co
Ad
ehy
dro
gen
ase
0.1
75
0.5
76
0.6
38
Lip
idm
etab
oli
sm
Had
h1
13
96
5H
yd
rox
yac
yl-
Co
Ad
ehy
dro
gen
ase
0.0
56
0.4
18
0.4
Lip
idm
etab
oli
sm
Had
ha
17
06
70
Hy
dro
xy
acy
l-C
oA
deh
yd
rog
enas
e/3
-ket
oac
yl-
Co
Ath
iola
se/e
no
yl-
Co
Ah
yd
rata
se(t
rifu
nct
ion
alp
rote
in),
alp
ha
sub
un
it
0.1
44
0.6
59
0.7
46
Lip
idm
etab
oli
sm
Had
hb
17
11
55
Hy
dro
xy
acy
l-C
oA
deh
yd
rog
enas
e/3
-ket
oac
yl-
Co
Ath
iola
se/e
no
yl-
Co
Ah
yd
rata
se(t
rifu
nct
ion
alp
rote
in),
bet
asu
bu
nit
0.1
94
0.8
0.8
17
Lip
idm
etab
oli
sm
K. Skov et al.
123

Ta
ble
2co
nti
nu
ed
Sy
mb
ol
En
trez
IDE
ntr
ezg
ene
nam
eL
og
2(f
old
chan
ge)
Bio
log
ical
pro
cess
Lo
wP
FN
A?
Mix
Mid
PF
NA
Mid
PF
NA
?M
ix
Hsd
11
b1
25
11
6H
yd
rox
yst
ero
id(1
1-b
eta)
deh
yd
rog
enas
e1
-0
.26
1-
0.4
46
-1
.08
2L
ipid
met
abo
lism
Imm
t3
12
44
4In
ner
mem
bra
ne
pro
tein
,m
ito
cho
nd
rial
-0
.01
10
.34
50
.37
6L
ipid
met
abo
lism
Mly
cd8
52
39
Mal
on
yl-
Co
Ad
ecar
bo
xy
lase
0.0
93
0.3
16
0.3
25
Lip
idm
etab
oli
sm
Nca
m1
24
58
6N
eura
lce
llad
hes
ion
mo
lecu
le1
-0
.16
3-
0.0
5-
0.2
7L
ipid
met
abo
lism
Ph
gd
h5
88
35
Ph
osp
ho
gly
cera
ted
ehy
dro
gen
ase
-0
.30
8-
1.2
71
-0
.97
6L
ipid
met
abo
lism
Pli
n5
50
12
83
Per
ilip
in5
0.1
98
0.5
95
0.6
1L
ipid
met
abo
lism
Ptk
2b
50
64
6P
rote
inty
rosi
ne
kin
ase
2b
eta
0.1
75
0.6
07
0.4
7L
ipid
met
abo
lism
Sir
t43
04
53
9S
irtu
in4
0.1
62
0.2
91
0.4
61
Lip
idm
etab
oli
sm
Aca
d1
13
15
97
3A
cyl-
Co
Ad
ehy
dro
gen
ase
fam
ily
,m
emb
er1
10
.11
50
.62
0.6
56
Lip
idm
etab
oli
sm—
mit
och
on
dri
alb
-ox
idat
ion
Aca
dl
25
28
7A
cyl-
Co
Ad
ehy
dro
gen
ase,
lon
gch
ain
0.0
50
.44
20
.41
9L
ipid
met
abo
lism
—m
ito
cho
nd
rial
b-o
xid
atio
n
Aca
dm
24
15
8A
cyl-
Co
Ad
ehy
dro
gen
ase,
C-4
toC
-12
stra
igh
tch
ain
0.1
50
.47
0.4
7L
ipid
met
abo
lism
—m
ito
cho
nd
rial
b-o
xid
atio
n
Aca
ds
64
30
4A
cyl-
Co
Ad
ehy
dro
gen
ase,
C-2
toC
-3sh
ort
chai
n0
.05
60
.32
60
.41
6L
ipid
met
abo
lism
—m
ito
cho
nd
rial
b-o
xid
atio
n
Aca
dv
l2
53
63
Acy
l-C
oA
deh
yd
rog
enas
e,v
ery
lon
gch
ain
0.0
47
0.4
13
0.4
82
Lip
idm
etab
oli
sm—
mit
och
on
dri
alb
-ox
idat
ion
Cp
t22
54
13
Car
nit
ine
pal
mit
oy
ltra
nsf
eras
e2
0.1
63
0.5
65
0.7
86
Lip
idm
etab
oli
sm—
mit
och
on
dri
alb
-ox
idat
ion
Slc
25
a20
11
70
35
So
lute
carr
ier
fam
ily
25
(car
nit
ine/
acy
lcar
nit
ine
tran
slo
case
),m
emb
er2
0
0.0
98
0.6
68
0.6
92
Lip
idm
etab
oli
sm—
mit
och
on
dri
alb
-ox
idat
ion
Aco
x1
50
68
1A
cyl-
Co
Ao
xid
ase
1,
pal
mit
oy
l0
.07
40
.60
10
.74
5L
ipid
met
abo
lism
—p
rox
iso
mal
b-o
xid
atio
n
Cra
t3
11
84
9C
arn
itin
eO
-ace
tylt
ran
sfer
ase
0.3
72
1.5
51
.71
Lip
idm
etab
oli
sm—
pro
xis
om
alb
-ox
idat
ion
Cro
t8
38
42
Car
nit
ine
O-o
ctan
oy
ltra
nsf
eras
e0
.19
1.1
15
1.2
19
Lip
idm
etab
oli
sm—
pro
xis
om
alb
-ox
idat
ion
Dec
r26
44
61
2,4
-Die
no
yl
Co
Are
du
ctas
e2
,p
ero
xis
om
al0
.27
50
.83
10
.94
4L
ipid
met
abo
lism
—p
rox
iso
mal
b-o
xid
atio
n
Ech
16
45
26
En
oy
lC
oA
hy
dra
tase
1,
per
ox
iso
mal
0.4
59
1.5
03
1.8
56
Lip
idm
etab
oli
sm—
pro
xis
om
alb
-ox
idat
ion
Eci
22
91
07
5E
no
yl-
Co
Ad
elta
iso
mer
ase
20
.11
70
.57
70
.54
8L
ipid
met
abo
lism
—p
rox
iso
mal
b-o
xid
atio
n
Eh
had
h1
71
14
2E
no
yl-
Co
A,
hy
dra
tase
/3-h
yd
rox
yac
yl
Co
A
deh
yd
rog
enas
e
0.1
84
1.7
02
1.8
6L
ipid
met
abo
lism
—p
rox
iso
mal
b-o
xid
atio
n
Hsd
17
b4
79
24
4H
yd
rox
yst
ero
id(1
7-b
eta)
deh
yd
rog
enas
e4
0.1
13
0.2
95
0.2
78
Lip
idm
etab
oli
sm—
pro
xis
om
alb
-ox
idat
ion
Ap
oa2
25
64
9A
po
lip
op
rote
inA
-II
0.3
21
0.5
04
0.4
74
Lip
idm
etab
oli
sm—
tran
spo
rt
Ab
cd3
25
27
0A
TP
-bin
din
gca
sset
te,
sub
-fam
ily
D(A
LD
),m
emb
er3
0.0
93
0.7
29
0.6
85
Lip
idm
etab
oli
sm—
tran
spo
rt
Cd
36
29
18
4C
D3
6m
ole
cule
(th
rom
bo
spo
nd
inre
cep
tor)
0.1
58
1.2
76
1.8
67
Lip
idm
etab
oli
sm—
tran
spo
rt
Fab
p5
14
08
68
Lip
idb
ind
ing
pro
tein
5(p
sori
asis
-ass
oci
ated
)-
0.3
85
-1
.39
2-
1.5
08
Lip
idm
etab
oli
sm—
tran
spo
rt
Slc
27
a26
51
92
So
lute
carr
ier
fam
ily
27
(Lip
idtr
ansp
ort
er),
mem
ber
20
.21
50
.54
30
.57
Lip
idm
etab
oli
sm—
tran
spo
rt
Ad
rb3
25
64
5A
dre
no
cep
tor
bet
a3
-0
.27
9-
0.1
34
-0
.36
6G
luco
sem
etab
oli
smd
iso
rder
s
Ca1
31
02
18
Car
bo
nic
anh
yd
rase
I-
0.0
03
-0
.78
-1
.13
2G
luco
sem
etab
oli
smd
iso
rder
s
Ca4
29
24
2C
arb
on
ican
hy
dra
seIV
-0
.26
6-
0.0
09
-0
.23
6G
luco
sem
etab
oli
smd
iso
rder
s
Ca7
29
18
19
Car
bo
nic
anh
yd
rase
VII
–0
.06
0.8
17
0.6
43
Glu
cose
met
abo
lism
dis
ord
ers
Cal
cr1
16
50
6C
alci
ton
inre
cep
tor
0.2
25
0.1
14
0.3
92
Glu
cose
met
abo
lism
dis
ord
ers
Exposure to perfluorononanoic acid combined with a low-dose mixture…
123

Ta
ble
2co
nti
nu
ed
Sy
mb
ol
En
trez
IDE
ntr
ezg
ene
nam
eL
og
2(f
old
chan
ge)
Bio
log
ical
pro
cess
Lo
wP
FN
A?
Mix
Mid
PF
NA
Mid
PF
NA
?M
ix
Dn
ajc3
63
88
0D
naJ
(Hsp
40
)h
om
olo
g,
sub
fam
ily
C,
mem
ber
3-
0.1
13
-0
.27
9-
0.3
62
Glu
cose
met
abo
lism
dis
ord
ers
Fb
p2
11
45
08
Fru
cto
se-1
,6-b
isp
ho
sph
atas
e2
0.2
72
0.6
42
1.0
81
Glu
cose
met
abo
lism
dis
ord
ers
Hd
c2
44
43
His
tid
ine
dec
arb
ox
yla
se0
.26
71
.03
1.3
09
Glu
cose
met
abo
lism
dis
ord
ers
Hip
k1
36
58
95
Ho
meo
do
mai
nin
tera
ctin
gp
rote
ink
inas
e1
0.1
89
0.0
11
0.2
96
Glu
cose
met
abo
lism
dis
ord
ers
Lef
11
61
45
2L
ym
ph
oid
enh
ance
r-b
ind
ing
fact
or
10
.10
.36
0.5
73
Glu
cose
met
abo
lism
dis
ord
ers
Mg
at2
94
27
3M
ann
osy
l(a
lph
a-1
,6-)
-gly
cop
rote
inb
eta-
1,2
-N-
acet
ylg
luco
sam
iny
ltra
nsf
eras
e
-0
.13
5-
0.4
36
-0
.54
4G
luco
sem
etab
oli
smd
iso
rder
s
Pfk
m6
51
52
Ph
osp
ho
fru
cto
kin
ase,
mu
scle
-0
.38
8-
0.4
87
-0
.35
Glu
cose
met
abo
lism
dis
ord
ers
Pro
x1
30
50
66
Pro
sper
oh
om
eob
ox
1-
0.0
9-
0.1
14
-0
.33
6G
luco
sem
etab
oli
smd
iso
rder
s
Psm
c32
96
77
Pro
teas
om
e(p
roso
me,
mac
rop
ain
)2
6S
sub
un
it,
AT
Pas
e,3
0.1
02
0.2
87
0.3
26
Glu
cose
met
abo
lism
dis
ord
ers
Psm
d8
29
27
66
Pro
teas
om
e(p
roso
me,
mac
rop
ain
)2
6S
sub
un
it,
no
n-A
TP
ase,
80
.10
30
.17
90
.23
8G
luco
sem
etab
oli
smd
iso
rder
s
Ram
p1
58
96
5R
ecep
tor
(Gp
rote
in-c
ou
ple
d)
acti
vit
ym
od
ify
ing
pro
tein
1-
0.1
33
-0
.21
3-
0.2
99
Glu
cose
met
abo
lism
dis
ord
ers
Rt1
-Ba
30
96
21
Maj
or
his
toco
mp
atib
ilit
yco
mp
lex
,cl
ass
II,
DQ
alp
ha
1-
0.2
44
-0
.13
9-
0.3
02
Glu
cose
met
abo
lism
dis
ord
ers
Ste
ap4
49
99
91
ST
EA
Pfa
mil
ym
emb
er4
-0
.15
-0
.33
2-
0.4
04
Glu
cose
met
abo
lism
dis
ord
ers
Hm
gcs
22
44
50
3-h
yd
rox
y-3
-met
hy
lglu
tary
l-C
oA
syn
thas
e2
(mit
och
on
dri
al)
0.1
18
0.4
69
0.4
71
Ket
og
enes
is
Pex
11
a8
52
49
Per
ox
iso
mal
bio
gen
esis
fact
or
11
alp
ha
0.2
09
1.3
68
1.3
87
Per
ox
iso
me
bio
gen
esis
Pex
16
31
12
03
Per
ox
iso
mal
bio
gen
esis
fact
or
16
0.2
08
0.4
05
0.4
39
Per
ox
iso
me
bio
gen
esis
Pex
53
12
70
3P
ero
xis
om
alb
iog
enes
isfa
cto
r5
0.0
77
0.3
26
0.2
84
Per
ox
iso
me
bio
gen
esis
Dh
rs4
26
66
86
Deh
yd
rog
enas
e/re
du
ctas
e(S
DR
fam
ily
)m
emb
er4
0.0
05
0.3
63
0.2
94
Ret
ino
lm
etab
oli
sm
Ro
ma
nn
on
-sig
nifi
can
t,it
ali
cp
=0
.05
–0
.1,
bo
ldp\
0.0
5
K. Skov et al.
123

any differentially expressed genes, hence further studies
with larger sample sizes are required to verify some of the
subtle differences indicated by this study.
The IPA has a function to predict the activity of po-
tential upstream regulators based on differentially ex-
pressed genes. Using our dataset, we could predict an
increased activity of several transcription factors and other
central proteins in livers from exposed animals (Table 3).
Downstream of the differentially expressed genes, IPA
predicts regulatory effects such as diseases and functions
likely to be perturbed due to the changes in gene expres-
sion. As illustrated in Fig. 4, activation of the upstream
regulators PPARa, PPARc, PPARd, RXRa, PPARgc1a,
and MED1 results in altered gene expression (Table 2) that
subsequently leads to increased oxidation of lipids, in
particular fatty acids. This, in turn, protects against accu-
mulation of lipids in the liver and therefore also against
hepatic steatosis. This is consistent with our observations in
livers from rats having been exposed to Low- and Mid
PFNA doses, with no indications of lipid accumulation,
increased cell size, or compromised cell borders (Hadrup
et al. 2015). However, as exposure to high PFNA doses
causes adverse effects such as steatosis (Hadrup et al.
2015), it can be speculated that livers from at least the Mid
PFNA exposed rats could become affected over time. The
fact that hepatic steatosis was evident at the high PFNA
dose (5 mg/kg/day) and that signs of protection against
hepatic steatosis was observed at the mid PFNA dose
(0.25 mg/kg/day) illustrates the problem of extrapolating
from toxicological observations at higher doses to effects at
lower doses, which is common practice in risk assessment
of chemicals.
PPARs are known regulators of fatty acid b-oxidation
(Kanehisa and Goto 2000), and increased b-oxidation re-
sults in decreased plasma lipid concentration (Lau 2012).
Then, as perfluorinated alkyl acids are known PPAR-acti-
vators (Vanden Heuvel et al. 2006; Lau 2012; U. S. Envi-
ronmental Protection Agency 2014), effects observed in
livers from the PFNA groups could, at least in part, be
explained by this regulatory pathway. Further, the Mix
contains two phthalates, DBP and DEHP, which are both
known PPAR activators (Desvergne et al. 2009), poten-
tially adding to the effect in the PFNA ? Mix groups. In
fact, additional compounds in the Mix such as butyl-
paraben, linuron, and vinclozolin, can stimulate PPAR-
dependent transcription (U. S. Environmental Protection
Agency 2014), further adding to the overall effect. How-
ever, at the doses used in our study, the contribution of Mix
Table 3 Upstream regulators predicted to regulate effects caused by Mid-PFNA ± Mix
Upstream regulator Mid PFNA ? Mix Mid PFNA Genes
z-score p-value z-score p-value
PPARa Peroxisome proliferator-
activated receptor a5.3 2e–24 5.1 5e–28 Abcd3, Acaa1, Acaa2a, Acadl, Acadm, Acads, Acadvl,
Acat1, Acot1a, Acot2, Acox1, Adtrp, Cd36, Cpt2,
Crot, Cyp2b6, Cyp4a11, Cyp4a14, Decr1, Decr2,
Ech1, Eci2, Ehhadh, Fabp5, Gpd1, Hadh, Hadha,
Hadhb, Rt1-Baa, Hmgcs2, Mlycd, Pex11a, Plin5,
Slc25a20, Slc27a2, Vnn1, Aadacb, Apoa2b, Cfhb,
Ftcdb, H2afzb
KLF15 Kruppel-like factor 5 3.2 3e–18 3.0 5e–17 Acadl, Acadm, Acadvl, Acot1a, Acox1, Cd36, Cpt2,
Decr1, Ehhadh, Fabp5, Hadha, Hadhb, Mlycd,
Slc25a20
ACOX1 :Peroxisomal acyl-
coenzyme A oxidase 1
-2.4 5e–15 -2.474 3e–13 Abcd3, Acaa1, Acadl, Acadm, Acadvl, Acot2, Acox1,
Aig1, Cd36, Crat, Cyp4a11, Cyp4a14, Ehhadh, Rt1-
Baa, Hsd11b1a, Pex11a, Slc27a2, Tnfrsf10aa, Hspa5b
PPARc Peroxisome proliferator-
activated receptor a3.9 8e–14 3.3 1e–13 Acaa1, Acaa2a, Acadl, Acadm, Acads, Acox1, Adrb3a,
Cd36, Cpt2, Crat, Cyp4a11, Cyp4a14, Ehhadh, Fabp5,
Fbp2a, Gpd1, Hadha, Hadhb, Hmgcs2, Mlycd, Pepd,
Pex11a, Plin5, Slc25a20, Vnn1, Apoa2b, Sdc1b
EHHADH :Enoyl-coenzyme A,
hydratase/3-hydroxyacyl
coenzyme A dehydrogenase
-2.8 1e–12 -2.8 6e–13 Abcd3, Acaa1, Acot2, Acox1, Cd36, Cyp4a11,
Cyp4a14, Pex11a
HSD17B4 :Peroxisomal
multifunctional enzyme type 2
-3.0 1e–12 -2.8 4e–11 Abcd3, Acaa1, Acot2, Acox1, Cd36, Cyp4a11,
Cyp4a14, Hoxd13a, Pex11a
An arrow indicating up- or downregulation marks upstream regulators that are differentially expressed genes. Negative z-scores indicate that the
upstream regulator is inactivated, whereas positive z-scores indicate activationa DEG only present in Mid PFNA ? Mixb DEG only present in Mid PFNA
Exposure to perfluorononanoic acid combined with a low-dose mixture…
123

towards PPAR activation is likely minor since (i) we ob-
served very small differences in transcript levels between
the Mid PFNA and Mid PFNA ? Mix groups, and (ii) we
did not observe any significant changes in gene expression
in animals exposed to Low PFNA ? Mix.
A summary of the functions of the Mid PFNA ± Mix is
given in Supplementary Table 4, together with genes that
displayed highest fold-change difference in transcript
levels between Mid PFNA ? Mix and Mid PFNA alone.
As discussed, altered CYP2C9 activity might play a role in
the changed plasma lipid concentrations. However, our
data do not suggest downregulation of the rat CYP2C9
homologue, Cyp2c11. On the other hand, the HDL-con-
stituent, apolipoprotein A-II (encoded by Apoa2) is
upregulated by PFNA but not by PFNA ? Mix. The effects
observed for Mix and PFNA ? Mix might therefore be
caused by a combination of decreased CYP2C9 activity
and PPAR activation.
4 Concluding remarks
The characterization of potential toxic effects caused by
prolonged exposure to various compounds can be a chal-
lenge. When a large number of compounds are present at
the same time, as in humans, the challenge is even greater.
In an effort to better understand the complex interaction
between multiple exogenous compounds and the living
organism, we profiled the plasma metabolome and the liver
transcriptome in rats after exposure to a low dose of
bioavailable chemicals. We observed that a mixture of 14
chemicals at high-end human exposure levels (Mix), low-
to mid-range doses of PFNA, or a combination of the two,
had the potential to alter the blood plasma levels of
diacylglycerols, PCs, and cholesterol derivatives, mimick-
ing some of the features of metabolic syndrome. These
effects can also suggest an inflammatory response, but in
either case warrant further investigations. We also ob-
served more subtle changes to the liver transcriptome fol-
lowing Mid PFNA exposure irrespective of Mix,
suggesting that the hepatic effects were driven by PFNA. In
conclusion, this study demonstrates that low-dose exposure
to chemical mixtures can affect the metabolome and cause
disturbed lipid homeostasis, and that ‘omics’ approaches
are powerful tools to detect smaller changes not readily
observable at the macroscopic level.
Acknowledgments A special thanks to Mike Wilson, University of
Alberta, for assisting in conducting the R script for the metabolomics
matrix reduction. We thank Dr. Christoffer Clemmensen at Helmholtz
Zentrum Munich for helpful discussions on the manuscript. The
Ministry of Food, Agriculture and Fisheries of Denmark and the
Danish Veterinary and Food Administration are acknowledged for
their financial support.
G-protein Coupled Receptor Enzyme Nuclear Receptor Transporter Unknown Disease
Predicted RelationshipsLeads to activationLeads to inhibitionFindings inconsistent withstate of downstream moleculeEffect not predicted
Prediction Legend
UpregulatedDownregulated
More Less
Predicted activationPredicted inhibition
More Less
PPARA
PPARG PPARGC1A
MED1RXRA
PPARDthyroid hormone receptor
concentration of lipid hepatic steatosis oxidation of lipidoxidation of fatty acid
CYP2B6
HADHBCPT2ACAA1
ACAA2ECI2SLC27A2ABCD3ACADS
ACOX1EHHADH
CD36
ACADM
ACADL
HADHA
NTRK1
MLYCD
ALDH1A1
CYP4A11
PLIN5NR1I3
GPD1
ACADVL
ADRB3
PEX11A
FABP5CYP4A14
DECR1ACAT1
HADHACOT2
Transcription factors inactivated state
Phenotypical outcome
Gene expression changes
Fig. 4 Illustration of a putative hepatic signaling network, from PPAR
(and other transcriptional regulators) activation through regulation of
gene expression to ultimately dictate phenotypic outcomes. Orange
indicates predicted activation and blue indicates predicted inhibition.
Shades of red and green indicate level of increased and decreased gene
expression, respectively. The network was generated through the use of
QIAGEN’s Ingenuity Pathway Analysis (IPA, QIAGEN Redwood
City, www.qiagen.com/ingenuity) (Color figure online)
K. Skov et al.
123

Conflict of interest Kasper Skov, Kristine Kongsbak, Niels Hadrup,
Henrik Lauritz Frandsen, Terje Svingen, Jørn Smedsgaard, Karine
Audouze, Aron Charles Eklund, and Anne Marie Vinggaard declare
that they have no conflict of interest.
Compliance with ethical requirements All applicable institutional
guidelines for the care and use of animals were followed. All pro-
cedures performed in the studies involving animals were in accor-
dance with the ethical standards of the institution at which the studies
were conducted. The animal study was approved by the Danish
Animal Experiments Inspectorate. The authorization number given is
2012/561-188. The National Food Institute’s in-house Animal Wel-
fare Committee for animal care and use supervised the experiments.
References
Altmaier, E., Ramsay, S. L., Graber, A., et al. (2008). Bioinformatics
analysis of targeted metabolomics—uncovering old and new
tales of diabetic mice under medication. Endocrinology, 149,
3478–3489. doi:10.1210/en.2007-1747.
Androutsopoulos, V. P., Hernandez, A. F., Liesivuori, J., & Tsatsakis,
A. M. (2013). A mechanistic overview of health associated effects
of low levels of organochlorine and organophosphorous pesti-
cides. Toxicology, 307, 89–94. doi:10.1016/j.tox.2012.09.011.
Axelstad, M., Christiansen, S., Boberg, J., et al. (2014). Mixtures of
endocrine-disrupting contaminants induce adverse developmen-
tal effects in preweaning rats. Reproduction, 147, 489–501.
doi:10.1530/REP-13-0447.
Benjamini, Y., & Hochberg, Y. (1995). Controlling the false
discovery rate: A practical and powerful approach to multiple
testing. Journal of The Royal Statistical Society Series B, 57,
289–300. doi:10.2307/2346101.
Calafat, A. M., Wong, L.-Y., Kuklenyik, Z., et al. (2007).
Polyfluoroalkyl chemicals in the U.S. population: data from
the National Health and Nutrition Examination Survey
(NHANES) 2003-2004 and comparisons with NHANES
1999-2000. Environmental Health Perspectives, 115, 1596–
1602. doi:10.1289/ehp.10598.
Chen, S., Chu, Y., Zhao, X., et al. (2011). HPLC-MS-based
metabonomics reveals disordered lipid metabolism in patients
with metabolic syndrome. Journal of Analytical Science and
Technology, 2, A173–A178. doi:10.5355/JAST.2011.A173.
Chen, C., & Kim, S. (2013). LC-MS-based metabolomics of
xenobiotic-induced toxicities. Computational and Structural
Biotechnology Journal, 4, e201301008. doi:10.5936/csbj.201301
008.
Chen, M., Zhou, K., Chen, X., et al. (2014). Metabolomic analysis
reveals metabolic changes caused by bisphenol A in rats.
Toxicological Sciences, 138, 256–267. doi:10.1093/toxsci/kfu016.
Christiansen, S., Kortenkamp, A., Axelstad, M., et al. (2012).
Mixtures of endocrine disrupting contaminants modelled on
human high end exposures: An exploratory study in rats.
International Journal of Andrology, 35, 303–316. doi:10.1111/
j.1365-2605.2011.01242.x.
Christiansen, S., Scholze, M., Axelstad, M., et al. (2008). Combined
exposure to anti-androgens causes markedly increased frequencies
of hypospadias in the rat. International Journal of Andrology, 31,
241–248. doi:10.1111/j.1365-2605.2008.00866.x.
Core Team, R. (2012). R: A language and environment for statistical
computing. R Foundation for Statistical Computing,. doi:10.
1007/978-3-540-74686-7.
Desvergne, B., Feige, J. N., & Casals-Casas, C. (2009). PPAR-
mediated activity of phthalates: A link to the obesity epidemic?
Molecular and Cellular Endocrinology, 304, 43–48. doi:10.
1016/j.mce.2009.02.017.
Emmett, E. A., Zhang, H., Shofer, F. S., et al. (2006). Community
exposure to perfluorooctanoate: Relationships between serum
levels and certain health parameters. Journal of Occupational
and Environmental Medicine, 48, 771–779. doi:10.1097/01.jom.
0000233380.13087.37.
Fang, X., Gao, G., Xue, H., et al. (2012a). Exposure of per-
fluorononanoic acid suppresses the hepatic insulin signal path-
way and increases serum glucose in rats. Toxicology, 294,
109–115. doi:10.1016/j.tox.2012.02.008.
Fang, X., Gao, G., Xue, H., et al. (2012b). In vitro and in vivo studies
of the toxic effects of perfluorononanoic acid on rat hepatocytes
and Kupffer cells. Environmental Toxicology and Pharma-
cology, 34, 484–494. doi:10.1016/j.etap.2012.06.011.
Fang, X., Zhang, L., Feng, Y., et al. (2008). Immunotoxic effects of
perfluorononanoic acid on BALB/c mice. Toxicological
Sciences, 105, 312–321. doi:10.1093/toxsci/kfn127.
Fang, X., Zou, S., Zhao, Y., et al. (2012c). Kupffer cells suppress
perfluorononanoic acid-induced hepatic peroxisome proliferator-
activated receptor a expression by releasing cytokines. Archives
of Toxicology, 86, 1515–1525. doi:10.1007/s00204-012-0877-4.
Ferrannini, E., Natali, A., Camastra, S., et al. (2013). Early metabolic
markers of the development of dysglycemia and type 2 diabetes
and their physiological significance. Diabetes, 62, 1730–1737.
doi:10.2337/db12-0707.
Guruge, K. S., Yeung, L. W. Y., Yamanaka, N., et al. (2006). Gene
expression profiles in rat liver treated with perfluorooctanoic
acid (PFOA). Toxicological Sciences, 89, 93–107. doi:10.1093/
toxsci/kfj011.
Hadrup, N., Pedersen, M., Skov, K., et al. (2015). Perfluorononanoic
acid in combination with 14 chemicals exerts low-dose mixture
effects in rats. Archives of Toxicology,. doi:10.1007/s00204-015-
1452-6.
Hadrup, N., Taxvig, C., Pedersen, M., et al. (2013). Concentration
addition, independent action and generalized concentration
addition models for mixture effect prediction of sex hormone
synthesis in vitro. PLoS One, 8, e70490. doi:10.1371/journal.
pone.0070490.
Horai, H., Arita, M., Kanaya, S., et al. (2010). MassBank: A public
repository for sharing mass spectral data for life sciences.
Journal of Mass Spectrometry, 45, 703–714. doi:10.1002/jms.
1777.
Kanehisa, M., & Goto, S. (2000). KEGG: Kyoto encyclopedia of
genes and genomes. Nucleic Acids Research, 28, 27–30.
Karami-Mohajeri, S., & Abdollahi, M. (2011). Toxic influence of
organophosphate, carbamate, and organochlorine pesticides on
cellular metabolism of lipids, proteins, and carbohydrates: A
systematic review. Human and Experimental Toxicology, 30,
1119–1140. doi:10.1177/0960327110388959.
Kent, U. M., Aviram, M., Rosenblat, M., & Hollenberg, P. F. (2002).
The licorice root derived isoflavan glabridin inhibits the
activities of human cytochrome P450S 3A4, 2B6, and 2C9.
Drug Metabolism and Disposition, 30, 709–715.
Kirchheiner, J., Kudlicz, D., Meisel, C., et al. (2003). Influence of
CYP2C9 polymorphisms on the pharmacokinetics and choles-
terol-lowering activity of (-)-3S,5R-fluvastatin and (?)-3R,5S-
fluvastatin in healthy volunteers. Clinical Pharmacology and
Therapeutics, 74, 186–194. doi:10.1016/S0009-9236(03)00121-8.
Krysiak-Baltyn, K., Toppari, J., Skakkebaek, N. E., et al. (2012).
Association between chemical pattern in breast milk and
congenital cryptorchidism: Modelling of complex human expo-
sures. International Journal of Andrology, 35, 294–302. doi:10.
1111/j.1365-2605.2012.01268.x.
Lagace, T. A., & Ridgway, N. D. (2013). The role of phospholipids in
the biological activity and structure of the endoplasmic
Exposure to perfluorononanoic acid combined with a low-dose mixture…
123

reticulum. Biochimica et Biophysica Acta, 1833, 2499–2510.
doi:10.1016/j.bbamcr.2013.05.018.
Lau, C. (2012). Perfluorinated compounds. EXS, 101, 47–86. doi:10.
1007/978-3-7643-8340-4_3.
Lau, C., Anitole, K., Hodes, C., et al. (2007). Perfluoroalkyl acids: A
review of monitoring and toxicological findings. Toxicological
Sciences, 99, 366–394. doi:10.1093/toxsci/kfm128.
Lewis, J. H., Ranard, R. C., Caruso, A., et al. (1989). Amiodarone
hepatotoxicity: Prevalence and clinicopathologic correlations
among 104 patients. Hepatology, 9, 679–685.
Liberman, A. C., Refojo, D., Druker, J., et al. (2007). The activated
glucocorticoid receptor inhibits the transcription factor T-bet by
direct protein-protein interaction. FASEB Journal, 21, 1177–
1188. doi:10.1096/fj.06-7452com.
Liu, L., Wang, M., Yang, X., et al. (2013). Fasting serum lipid and
dehydroepiandrosterone sulfate as important metabolites for
detecting isolated post challenge diabetes: serum metabolomics
via ultra-high-performance LC-MS. Clinical Chemistry, 59,
1338–1348. doi:10.1373/clinchem.2012.200527.
Monosson, E. (2005). Chemical mixtures: Considering the evolution
of toxicology and chemical assessment. Environmental Health
Perspectives, 113, 383–390.
Moser, V. C., Simmons, J. E., & Gennings, C. (2006). Neurotoxico-
logical interactions of a five-pesticide mixture in preweanling
rats. Toxicological Sciences, 92, 235–245. doi:10.1093/toxsci/
kfj189.
NHANES (2013) Fourth National Report on Human Exposure to
Environmental Chemicals Updated Tables, March, 2013.
Rigas, B., Rosenfeld, L. E., Barwick, K. W., et al. (1986).
Amiodarone hepatotoxicity. A clinicopathologic study of five
patients. Annals of Internal Medicine, 104, 348–351.
Ritchie, M. E., Silver, J., Oshlack, A., et al. (2007). A comparison of
background correction methods for two-colour microarrays. Bioin-
formatics, 23, 2700–2707. doi:10.1093/bioinformatics/btm412.
Rosen, M. B., Thibodeaux, J. R., Wood, C. R., et al. (2007). Gene
expression profiling in the lung and liver of PFOA-exposed
mouse fetuses. Toxicology, 239, 15–33. doi:10.1016/j.tox.2007.
06.095.
Saito, K., Maekawa, K., Ishikawa, M., et al. (2014). Glucosylce-
ramide and lysophosphatidylcholines as potential blood
biomarkers for drug-induced hepatic phospholipidosis. Toxico-
logical Sciences, 141, 377–386. doi:10.1093/toxsci/kfu132.
Silva, E., Rajapakse, N., & Kortenkamp, A. (2002). Something from
‘‘nothing’’—eight weak estrogenic chemicals combined at
concentrations below NOECs produce significant mixture ef-
fects. Environmental Science and Technology, 36, 1751–1756.
Skov, K., Hadrup, N., Smedsgaard, J., & Frandsen, H. (2014). LC-MS
analysis of the plasma metabolome-A novel sample preparation
strategy. Journal of Chromatography B, 978–979C, 83–88.
doi:10.1016/j.jchromb.2014.11.033.
Smith, C. A., O’Maille, G., Want, E. J., et al. (2005). METLIN: A
metabolite mass spectral database. Therapeutic Drug Monitor-
ing, 27, 747–751.
Smyth, G. K. (2004). Linear models and empirical bayes methods for
assessing differential expression in microarray experiments.
Statistical Applications in Genetics and Molecular Biology, 3(1),
1–25. doi:10.2202/1544-6115.1027.
Smyth, G. K. (2005). Limma: Linear models for microarray data. In
Bioinformatics and computational biology solutions using R and
Bioconductor (pp. 397–420). New York: Springer.
Smyth, G. K., & Speed, T. (2003). Normalization of cDNA
microarray data. Methods, 31, 265–273. doi:10.1016/S1046-
2023(03)00155-5.
Sud, M., Fahy, E., Cotter, D., et al. (2007). LMSD: LIPID MAPS
structure database. Nucleic Acids Research, 35, D527–D532.
doi:10.1093/nar/gkl838.
Taylor, K. W., Hoffman, K., Thayer, K. A., & Daniels, J. L. (2014).
Polyfluoroalkyl chemicals and menopause among women 20-65
years of age (NHANES). Environmental Health Perspectives,
122, 145–150. doi:10.1289/ehp.1306707.
U. S. Environmental Protection Agency (2014) Interactive Chemical
Safety for Sustainability (iCSS) Dashboard. http://actor.epa.gov/
dashboard/.
Vanden Heuvel, J. P., Thompson, J. T., Frame, S. R., & Gillies, P. J.
(2006). Differential activation of nuclear receptors by perfluori-
nated fatty acid analogs and natural fatty acids: A comparison of
human, mouse, and rat peroxisome proliferator-activated recep-
tor-alpha, -beta, and -gamma, liver X receptor-beta, and retinoid
X rec. Toxicological Sciences, 92, 476–489. doi:10.1093/toxsci/
kfl014.
Wang, C., Kong, H., Guan, Y., et al. (2005). Plasma phospholipid
metabolic profiling and biomarkers of type 2 diabetes mellitus
based on high-performance liquid chromatography/electrospray
mass spectrometry and multivariate statistical analysis. Analy-
tical Chemistry, 77, 4108–4116. doi:10.1021/ac0481001.
Wishart, D. S., Knox, C., Guo, A. C., et al. (2009). HMDB: A
knowledgebase for the human metabolome. Nucleic Acids
Research, 37, D603–D610. doi:10.1093/nar/gkn810.
World Health Organization (2000) Obesity: Preventing and managing
the global epidemic. Report of a WHO consultation. World
Health Organ Tech Rep Ser 894:i–xii, 1–253.
Xia, J., Mandal, R., Sinelnikov, I. V., et al. (2012). MetaboAnalyst
2.0—A comprehensive server for metabolomic data analysis.
Nucleic Acids Research, 40, W127–W133. doi:10.1093/nar/
gks374.
Zhang, Y., Deng, Y., Zhao, Y., & Ren, H. (2014). Using combined
bio-omics methods to evaluate the complicated toxic effects of
mixed chemical wastewater and its treated effluent. Journal of
Hazardous Materials, 272, 52–58. doi:10.1016/j.jhazmat.2014.
02.041.
Zhang, W., Liu, Y., Zhang, H., & Dai, J. (2012). Proteomic analysis
of male zebrafish livers chronically exposed to per-
fluorononanoic acid. Environment International, 42, 20–30.
doi:10.1016/j.envint.2011.03.002.
Zhang, Y., Zhang, Z., Zhao, Y., et al. (2013). Identifying health
effects of exposure to trichloroacetamide using transcriptomics
and metabonomics in mice (Mus musculus). Environmental
Science and Technology, 47, 2918–2924. doi:10.1021/es3048
976.
K. Skov et al.
123
Paper IV Effect of BPA on rats and their offsprings – a metabolic profiling of low dose exposure
to BPA
Manuscript in progress
Aim: Determination of low dose effects of BPA on the plasma of mother rat and offspring.
Results: The dosing of BPA affected the mother animals and offspring differently. The metabolic change of the mother animals suggests changes of the lipid metabolism with an increase level of cholesterol and a decreased level of monoacylglycerol. The plasma of male offspring showed an increased amount of phosphotidylcholine compounds.
Conclusion: Low dose effects on the rat metabolome are observed as they are exposed to Bisphenol A. The mother animals had a difference in plasma concentration of monoacylglycerol and cholesterol. The male offsprings had an increase in plasma concentration of lyso-phosphotidylcholine concentration.

Metabolic Profiling of Rats and their Offspring Exposed to Low Doses of
Bisphenol A. Kasper Skov1, Niels Hadrup2, Sofie Christiansen2, Marta Axelstad 2, Ulla Hass2, Anne Marie Vinggaard2,
Camilla Taxvig2, Jørn Smedsgaard1, Henrik Lauritz Frandsen1
1Division for Food Chemistry, National Food institute, Technical University of Denmark, Mørkhøj Bygade 19,
DK-2630 Søborg, Denmark
2Division of Toxicology and Risk assessment, National Food institute, Technical University of Denmark,
Mørkhøj Bygade 19, DK-2630 Søborg, Denmark
Correspondence should be addressed to K Skov; Email: [email protected]

Abstract
Bisphenol A (BPA) is an industrial chemical used to manufacture polycarbonate plastics, epoxy resins and
thermal printings. BPA is detectable in consumer products, food, water and dust. Human exposure has
been confirmed by analysis of urine, blood and tissue. Metabolomics analysis was performed analyzing
plasma of rats exposed to two doses of BPA, 0.025 and 0.25 mg/kg bw/day. This concept was used to
identify low dose effects on the plasma from both dams, as well as male and female offspring.
The metabolome of the dams and offspring were analyzed by a PCA plotting. The dams and the offspring
located into two distinctive groups reflecting differences in age and route of exposure. Moreover, the male
and female offspring had similar clustering in the PCA plot. To identify difference between control and
exposed animals, PLS-DA plots of each of the three animal groups were conducted. Twenty-seven
molecular features out of 347 were found to be significantly different between controls and male offspring.
For lyso-phosphatidylcholine compounds a “dose response” trend was observed, while for the neutral lipids
and for a metabolite with the molecular weight 359.149 there were only effects at BPA-0.25. For the dams
a BPA induced increase in cholesterol in the plasma was observed.
A difference in the metabolome between male and female rats was observed. Another observeda
difference was between dams administered to BPA directly and the offspring exposed through the dams
(via placenta and milk in lactation period). The lyso-phospholipids was increased male offspring when
exposed to BPA-0.25. In conclusion, the dams showed increased levels of cholesterol and a decreased level
of monoacylglycerols while the males and the female offspring showed an effect on diacylglycerol.

Introduction
Bisphenol A (BPA) is an industrial chemical used to manufacture polycarbonate plastics, epoxy resins and
thermal printings (Boucher et al. 2014). BPA is detectable in consumer products, food, water and dust
(Alonso-Magdalena et al. 2008; Asahi et al. 2010; Boucher et al. 2014). Human exposure has been
confirmed by analysis of urine, blood and tissue (Asahi et al. 2010). The biomarkers of BPA is the compound
itself along with the major metabolite; glucuronidated BPA (Bjerregaard et al. 2007). Exposure is correlated
with diseases such as diabetes and obesity (Alonso-Magdalena et al. 2008), though no specific mechanisms
of action have yet been determined (Asahi et al. 2010; Boucher et al. 2014). Correlations between BPA
concentration and diseases such as heart failure and diabetes have been shown (Srivastava and Godara
2013). Furthermore, BPA have been shown to be transferred from mother to child in placental cord blood
(Srivastava and Godara 2013). In children chronically exposed to BPA gastrointestinal problems, reduced
immune system, toxic overload and neurological disorders have been demonstrated (Srivastava and Godara
2013). The dose of the previously described studies is above the “no observed adverse effect level”
(NOAEL) of 5 mg/kg bw per day. In the offspring that are also included in the current study both male and
female anogenital distance was significantly decreased at birth at low doses (from 0.250 mg/kg in males
and from 0.025 mg/kg in females) and above. Moreover, the incidence of nipple retention in males
appeared to increase dose relatedly and the increase was statistically significant at 50 mg/kg per day
(Christiansen et al. 2014). Multiple studies have suggested that even exposure to low doses of BPA during
development will have effect on a range of different endpoints. Studies in rodents have reported effects of
BPA at or below 50µg/kg per day on reproductive organ weights, mammary gland development and
behavior (Christiansen et al. 2014; Xu and Xu 2013). These effects of BPA emphasize the need to
understand the mechanism of action for BPA. The mechanism of action is not clarified and may involve
several differential mechanisms of actions. It is probably not limited to the classical estrogenic mechanism
(Shelby 2008) but likely also comprises several other signaling pathways (Reif et al. 2010).
In the recent years new methods have been used to analyze the effects of BPA administered at low doses.
Among these methods are the “omics” methods; transcriptomics, proteomics and metabolomics.
Metabolomics is the comprehensive analysis of all the metabolites in a given organism, normally
compounds with a molecular weight of less than 1 kDa (Brown et al. 2005; Goodacre et al. 2004; Oliver et
al. 1998). Changes in the metabolome have been found in zebrafish and rats at doses of BPA at least ten
times lower than the NOAEL value of 5 mg/kg bw/day. Grasselli et al. show difference in the transcriptome
involved in the lipid and glucose homeostasis in rat hepatoma cells (Grasselli et al. 2013). This is supported
by Chen et al. showing changes in the lipid metabolome in rats exposed to BPA (Chen et al. 2012) and

Alongo-Magdalena who has shown that BPA induces insulin producing in the Langerhans islets (Alonso-
Magdalena et al. 2008). Furthermore, Xu and Xu showed changes in the polar fraction of the metabolome
when exposing rats to a low dose of 1 µg/kg bw/day for 45 days (Xu and Xu 2013).
Well above 600 articles have been published on toxic effects of BPA; however several modes of action has
yet been established (Asahi et al. 2010; Reif et al. 2010). The aim of the present study was to investigate
the effect of perinatal low dose exposure of BPA on the metabolome of female Wistar rats and their
offspring to obtain data that may help determine a mechanism of action. Metabolomics analysis of two
doses of BPA, 0.025 and 0.25 mg/kg/day, corresponding to 200 and 20 times below the no observed
adverse effect level, was done. Analysis of the early sexual development such as anogenital distance and
nipple retention from the same study is described elsewhere (Christiansen et al. 2014). By use of
metabolomics we identified low dose effects on the plasma from both dams, as well as male and female
offspring, effects that may be a first step towards identifying a mode of action.
Materials and methods
Chemicals
BPA (purity of 99.5%, CAS no. 80-05-7) was purchased from Sigma–Aldrich. Corn oil used both as negative
control and as vehicle was purchased from Sigma–Aldrich. The corn oil was provided to the laboratory in
glass bottles. The dosing solutions were kept in glass bottles in the dark, at room temperature, and
continuously stirred during the dosing period. The levels of BPA in the solutions were verified by chemical
analysis as described in Christiansen et al. (2014).
Animals and treatment
The Animal study was carried out at the DTU National Food Institute (Mørkhøj, Denmark) facilities. Ethical
approval was given by the Danish Animal Experiments Inspectorate. The authorization number given: 2012-
15-2934-00089 C4. The experiments were overseen by the National Food Institutes in-house Animal
Welfare Committee for animal care and use.
A total of 110 time-mated nulliparous, young adult Wistar rats (HanTac:WH, SPF, Taconic Europe, Ejby,
Denmark) were supplied at gestation day (GD) 3 of pregnancy.

The animals were housed in pairs until GD 17 and alone thereafter under standard conditions in semi-
transparent polysulfone (PSU) type III cages (PSU 80-1291HOOSU Type III, Tecniplast, Buguggiate, Italy)
(15x27x43 cm) with Aspen wood chip bedding (Tapvei, Gentofte, Denmark), Enviro Dri nesting material
(Brogaarden, Lynge, Denmark) and Tapvei Arcade 17 (Aspen wood) shelters (Brogaarden). The study was
performed using three blocks (separated by 1 week), and all dose groups were equally represented in the
blocks, i.e. the 22 time-mated rats per dose group were allocated among blocks. The dams were distributed
into five dose groups (0, 0.025, 0.250, 5 or 50 mg/kg bw per day respectively). Details on study design are
described in Christiansen et al. (2014).
Samples for metabolomics
On PD (pupday) 22 the dams as well as one male and one female from 10 litters per dose group (0; 0.025;
0.25 mg/kg) were weighed and decapitated, blinded with respect to exposure groups. The dams were
dosed 1½-2 hours prior to section to take into account the toxicokinetics of the compound. Serum was
frozen for metabolomics (see Table 1 below).
Table 1 Dams and offspring analyzed by metabolomics
Dams Males females 1: Control 10 10 10 2: BPA-0.025 10 10 10 3: BPA-0.25 10 10 10
Metabolomics analysis
The applied procedure is described in (Skov et al. n.d.). The main difference to this procedure is that in this
study only 40 µl of plasma was used for the analysis. Furthermore, the extraction solvents were reduced to
100 µl. In brief, phospholipids were removed using a phospholipid SPE column (Supelco, Sigma-Aldrich).
The eluate was collected, dried and extracted by 100 µl heptane in order to remove the lipids. This was
followed by addition of 100 µl methanol in order to extract the more polar compounds. The phospholipids
were next eluted from the SPE column using 300 µl 10 % NH4OH in methanol. The phospholipid, lipid and
the polar fractions were analyzed by an HPLC system combined with a maxis qTime-of-flight mass
spectrometer (Bruker Daltonics, Bremen, Germany) (Skov et al. n.d.). All samples within each fraction were
randomized before analysis.
Data analysis

The LC data was analyzed by Profile Analysis 2.1 (Bruker Daltonics, Bremen, Germany) using the find
molecular features algorithm. The data matrix was extracted and noise was reduced by use of an R script
(R Core Team 2012). This served to remove peaks that were present in < 50% of the samples among all
treatment groups and at the same time had a peak intensity of ≤ 3000. The data from each group of
animals were then uploaded to the online software program Metaboanalyst (Metaboanalyst.ca) (Xia et al.
2009). Metabolites that were changed in their blood concentrations were identified by doing normalization
by the sum of all peaks, LOG transformation and Pareto scaling followed by ANOVA analysis in
Metaboanalyst. A P>0.05 false discovery rate correction was applied to adjust for the high number of
metabolites present in blood. These findings were used to select pseudo ions of interest that were further
analyzed statistically as described below. Accurate mass searches MSMS patterns were used to suggest
metabolites of interest. The MSMS pattern was compared with in silico data from lipidmaps or the Human
Metabolome Database (Fahy et al. 2009; Xia et al. 2009, 2012, 2013).
Statistical analysis
The D’Agostino and Pearson omnibus normally test was used to test for normality of the data. If data were
normally distributed, one-way analysis of variance (ANOVA) followed by Dunnett’s multiple comparisons
test was performed on plasma level of metabolites, and pathology data. Otherwise, data was LOG
transformed and, if normally distributed, analyzed by ANOVA. If not normally distributed a non-parametric
Kruskal-Wallis test followed by a Dunn’s multiple comparisons test was conducted. The criteria for
statistical significance was p<0.05, p<0.01 and p<0.001 leading to marking *, ** and ***, respectively.
Determination of metabolite identities
Significantly different metabolites were identified by accurate mass search on databases such as human
metabolome database (hmdb.ca) (Wishart et al. 2007), lipidmaps (lipidmaps.org) (Fahy et al. 2009),
massbank (massbank.jp) and metlin (metlin.scripts.edu) (Trauger et al. 2005). If a possible metabolite was
suggested the MSMS pattern was correlated with MSMS patterns from lipidmaps or HMDB databases. For
some of the compounds was a standard of the compound purchased and the spectra and retention time of
the standard correlated with spectra and retention time of the significantly changed metabolite.
Results
Toxicological findings
Analysis of the early sexual development in the current study showed a significantly decreased anogenital
distance at birth at low doses (from 0.250 mg/kg in males and from 0.025 mg/kg in females) and above.

Moreover, the incidence of nipple retention in males appeared to increase dose relatedly and the increase
was statistically significant at 50 mg/kg per day (Christiansen et al. 2014).
Metabolomics
A Partial Least square-discriminant analysis (PLS-DA) was conducted separately for dams, female and male
offspring (Figure 1). The dose groups were clearly separated in the PLS analyses.

Figure 1 PLS-DA plots of the methanol fraction of male offspring, female offspring and dams. As shown on the plots are the groups and QC samples located closely together. The female and male offspring seem to have the same kind of separation while the change in the metabolites of the dams seems to be a bit more separated.
The metabolome of the dams and offspring were analyzed by a PCA plot (data not shown). The dams and
the offspring located into two distinctive groups reflecting differences in age and route of exposure.

Moreover, the male and female offspring had similar clustering in the PCA plot. To identify differences
between control and exposed animals, PLS-DA plots of each of the three animal groups was conducted. The
location of the different treatment groups of male and female offspring, were similar on the PLS-DA plot.
However, the metabolites accounting for a dose dependent difference in between all groups the metabolic
change were not the same. The PLS-DA plot for the dams showed a greater change, but a closer clustering
of the exposed and control animals. The significantly changed metabolites are described below.
Changes in dams:
Figure 2 Metabolites significantly changed in the metabolome of the dams. The first three metabolites (a-c) are monoacylglycerols (MG) which are all down-regulated by BPA-0.25. MG(18:0) and MG(16:0) and their adducts account for 10 of the 29 molecular features found significantly changed between control and BPA exposed animals. Furthermore, cholesterol was found as a loss of water and as a Na adduct both were increase compared to control. F is a metabolite not identified. The criteria for statistical significance was p<0.05, p<0.01 and p<0.001 leading to marking *, ** and ***, respectively.
The one way ANOVA yielded 26 significantly changed molecular features out of 341 molecular features. It
was found that 11 molecular features accounted for monoacylglycerols (MG); MG(18:0), MG(16:0) and
MG(14:0). The overall effect of the MGs was decreased levels in the plasma when exposed to BPA-0.25.
Cholesterol was increased when rats were exposed to BPA-0.25. One metabolite found to be decreased
already at BPA-0.025. This metabolite had an m/z of 359.149. It was not possible to identify a compound
with this accurate mass on data base searches. Three of the molecular features match in identities with
docosenamide, found both in the lipid and the polar fraction and for both a significantly decreased level in
BPA-0.25; however as this metabolite is not normally present in mammalian plasma it was classified as an

impurity and the data was not further analyzed. In the phospholipid fraction no metabolites were found to
be different. The rest of the significantly changed metabolites are shown in supplemental materials
(supplemental materials)
Changes in female offspring:
Figure 3 Metabolites from the plasma of the female offspring exposed to BPA at concentrations of 0.025 and 0.25 mg/kg bw/day. The results are shown as peak area ± SEM. As shown in the graphs there were significant decreases of MG(18:0) and DG(20:4/20:5), while no significant effect ass seen on cholesterol or the two unidentified metabolites with pseudo ion monoisotopic masses of 233.138 and 359.149. The criteria for statistical significance was p<0.05, p<0.01 and p<0.001 leading to markings of *, ** and ***, respectively.
It was found that 36 out of 671 molecular features were significantly different between control and BPA
exposed animals for the female offspring. Several of these could not be identified as chromatographic
peaks; ten molecular features were discarded due to this. Two diacylglycerols (DGs) and a MG were found
to be decreased in the BPA-0.025 exposure group. Two other molecular features were found to be
increased though it was impossible to establish their identities by use of accurate mass and MSMS patterns.
Based on the increase in cholesterol from the dams, a targeted analysis using loss of water and Na adduct
of cholesterol was conducted; however the concentration was not different between control and exposed
animals.
Changes in male offspring animals:
Twenty-seven molecular features out of 347 were found to be significantly different between controls and
exposed animals (See supplemental data). Of these 27 potential metabolites the identity of seven could be

established. In figure 4 five of the six identified metabolites are depicted, see Figure 4. There were
increases in the concentrations of lyso-phosphotidylcholine (lyso-PC) and DG concentrations. For all the
lyso-PC compound a “dose response” trend was observed, while for the neutral lipids and 359.149 there
were only effects at BPA-0.25.
Figure 4 Significantly changed metabolites of male offspring exposed to BPA. The results are shown as peak area ± SEM. For the lyso-phosphotidylcholine (lyso-PC) (a-c) are increased when exposed to BPA-0.25. Furthermore was there an increase in two diacylglycerides and a compound with an accurate mass of 359.149. The criteria for statistical significance was p<0.05, p<0.01 and p<0.001 leading to markings of *, ** and ***, respectively.
Cholesterol was searched for by accurate mass searching for the sodium adduct and loss of water.
However, no difference was found in the cholesterol plasma concentration in the male offspring.
Furthermore, no effect was observed on the levels of MG(18:0) or MG(16:0) of the plasma from the male
offspring (data not shown).
Discussion
In this study we found effects on the metabolome in dams and offspring of low doses of BPA administered
prenatally. To evaluate the low dose toxic exposure metabolomics analysis was performed. The primary
effect of BPA was evaluated by analysis of the plasma of the dam exposed during pregnancy and during the

lactation period. Furthermore, the plasma of female and male offspring was analyzed to evaluate whether
an effect was seen after exposure through placenta and lactation.
The data from the dams displayed a significant change in the lipid metabolome. The small neutral lipids
MG(18:0), MG(16:0) and MG(14:0) were significantly decreased when exposed to BPA-0.25 while
cholesterol was found to be increased when exposed to BPA-0.25. This correlates with previously obtained
results by Miyawaki et al. who have shown that cholesterol is increased in animals administered BPA orally
in a concentration of 1 and 10 µg/kg bw/day (Miyawaki et al. 2007). However, this were not observed in
neither male nor female offspring indicating that a direct exposure of BPA induces other effects than the
secondary effect from the exposure via placenta and milk.
The metabolic pattern was significantly different between dams and offspring, though some of the
metabolites were similar. The dams and the female offspring both suggest a lowering in MG(18:0). The
male offspring furthermore have an increased concentration of lyso-PCs. These are involved in metabolism
as well as used as signaling compounds in the body. The specific change of neutral lipids and lyso-PC is not
fully understood in relation to their effects on health. Williams et al. (Williams et al. 2013) have shown that
the lipid concentration is decreased in fruit flies when exposed to BPA and Boucher et al. (Boucher et al.
2014) have shown that TG accumulation is increased in adipose cells when exposed to BPA. Alonso-
Magdalena et al. have proposed that administering BPA to mice increases the biosynthesis of insulin
(Alonso-Magdalena et al. 2008). The increased level of insulin would increase the glucose uptake from the
plasma thus inducing high energy state in the cell probably leading to an increase in biosynthesis of lipids.
One metabolite especially in focus in this study had a pseudo ion with accurate masse of 359.1493 ± 2
mDa. The metabolite is interesting as it was significantly decreased in the dam animals but significantly
increased in both male and female offspring. The compound was searched for by accurate mass and a
feature of Data Analysis 4.1 (Bruker Daltonics) suggested that the compound had the elemental
composition C20H22O6 but the exact identity of this compound could not be established.
The changes in the metabolomes of the dams and the offspring were not similar in the present
investigation. However, some specific compounds were both found to be changed in dams and female
offspring and dams and male offspring, respectively. It was not possible to detect one single mechanism of
action for BPA from these data although it might involve changes of the lipid metabolism. At least such
changes could be hypothesized to seriously impact the biochemistry and physiology of the body. A
disruption in the non-polar part of the metabolome could explain some of the difference for this. Although
it will be difficult to suggest a clear mechanism of primary and secondary exposure to BPA, we believe that

the data obtained from this study will support, via metabolic changes, which mechanism of actions BPA
possess.
Conclusion
The effect of BPA is measurable even at concentration levels 20 and 200 times below no-observed-adverse-
effect level. There is a difference in the metabolome between male and female rats. Furthermore, there is
difference between dams administered to BPA directly and the offspring exposed through the dams (via
placenta and milk in lactation period). One group of compounds namely the lyso-phospholipids, equally
affected both dams and offspring as all were increased in concentration when exposed to BPA-0.25. The
dam showed increased levels of cholesterol and a decreased level of monoacylglycerols while the male and
female offspring showed an effect on diacylglycerol. One unidentified metabolite with m/z of 359.149 was
of great interest as it was decreased in the dams while increased in male and female offspring. We believe
that measuring the non-polar part of the metabolome has revealed new insight in the mechanism of action
for bisphenol A, bringing us one step closer to understand how it affect animals as well as humans.

References:
Alonso-Magdalena, P., Ropero, A. B., Carrera, M. P., Cederroth, C. R., Baquié, M., Gauthier, B. R., et al. (2008). Pancreatic insulin content regulation by the estrogen receptor ER alpha. PloS one, 3(4), e2069. doi:10.1371/journal.pone.0002069
Asahi, J., Kamo, H., Baba, R., Doi, Y., Yamashita, A., Murakami, D., et al. (2010). Bisphenol A induces endoplasmic reticulum stress-associated apoptosis in mouse non-parenchymal hepatocytes. Life sciences, 87(13-14), 431–8. doi:10.1016/j.lfs.2010.08.007
Bjerregaard, P., Andersen, S. B., Pedersen, K. L., Pedersen, S. N., & Korsgaard, B. (2007). Orally administered bisphenol a in rainbow trout (Oncorhynchus mykiss): estrogenicity, metabolism, and retention. Environmental toxicology and chemistry / SETAC, 26(9), 1910–5. doi:10.1897/06-645R.1
Boucher, J. G., Boudreau, a, & Atlas, E. (2014). Bisphenol A induces differentiation of human preadipocytes in the absence of glucocorticoid and is inhibited by an estrogen-receptor antagonist. Nutrition & diabetes, 4(1), e102. doi:10.1038/nutd.2013.43
Brown, S. C., Kruppa, G., & Dasseux, J.-L. (2005). Metabolomics applications of FT-ICR mass spectrometry. Mass spectrometry reviews, 24(2), 223–31. doi:10.1002/mas.20011
Chen, M., Xu, B., Ji, W., Qiao, S., Hu, N., Hu, Y., et al. (2012). Bisphenol A alters n-6 fatty acid composition and decreases antioxidant enzyme levels in rat testes: a LC-QTOF-based metabolomics study. PloS one, 7(9), e44754. doi:10.1371/journal.pone.0044754
Christiansen, S., Axelstad, M., Boberg, J., Vinggaard, A. M., Pedersen, G. A., & Hass, U. (2014). Low-dose effects of bisphenol A on early sexual development in male and female rats. Reproduction (Cambridge, England), 147(4), 477–87. doi:10.1530/REP-13-0377
Fahy, E., Subramaniam, S., Murphy, R. C., Nishijima, M., Raetz, C. R. H., Shimizu, T., et al. (2009). Update of the LIPID MAPS comprehensive classification system for lipids. Journal of lipid research, 50 Suppl, S9–14. doi:10.1194/jlr.R800095-JLR200
Goodacre, R., Vaidyanathan, S., Dunn, W. B., Harrigan, G. G., & Kell, D. B. (2004). Metabolomics by numbers: acquiring and understanding global metabolite data. Trends in biotechnology, 22(5), 245–52. doi:10.1016/j.tibtech.2004.03.007
Grasselli, E., Cortese, K., Voci, A., Vergani, L., Fabbri, R., Barmo, C., et al. (2013). Direct effects of Bisphenol A on lipid homeostasis in rat hepatoma cells. Chemosphere, 91(8), 1123–9. doi:10.1016/j.chemosphere.2013.01.016
Miyawaki, J., Sakayama, K., Kato, H., Yamamoto, H., & Masuno, H. (2007). Perinatal and Postnatal Exposure to Bisphenol A Increases Adipose Tissue Mass and Serum Cholesterol Level in Mice. Journal of Atherosclerosis and Thrombosis, 14(5), 245–252. doi:10.5551/jat.E486
Oliver, S. G., Winson, M. K., Kell B, & Baganz, F. (1998). Erratum. Trends in Biotecnology2, 16(10), 447.

R Core Team. (2012). R: A Language and Environment for Statistical Computing. R Foundation for Statistical Computing. doi:10.1007/978-3-540-74686-7
Reif, D. M., Martin, M. T., Tan, S. W., Houck, K. A., Judson, R. S., Richard, A. M., et al. (2010). Endocrine profiling and prioritization of environmental chemicals using ToxCast data. Environmental health perspectives, 118(12), 1714–20. doi:10.1289/ehp.1002180
Shelby, M. D. (2008). NTP-CERHR monograph on the potential human reproductive and developmental effects of bisphenol A. NTP CERHR MON, (22), v, vii–ix, 1–64 passim. http://www.ncbi.nlm.nih.gov/pubmed/19407859. Accessed 30 November 2014
Skov, K., Hadrup, N., Smedsgaard, J., & Frandsen, H. L. (n.d.). Analytical strategy to investigate the effects of toxic compounds on the plasma metabolome. Submitted.
Srivastava, R., & Godara, S. (2013). Use of polycarbonate plastic products and human health. International Journal of Basic & Clinical Pharmacology, 2(1), 12. doi:10.5455/2319-2003.ijbcp20130103
Trauger, S. A., Custodio, D. E., Qin, C., O’Maille, G., Smith, C. A., Abagyan, R., et al. (2005). Metlin - a metabolite mass spectral database. Therapeutical drug monitoring, 27(6), 747–751.
Williams, M. J., Wang, Y., Klockars, A., Monica Lind, P., Fredriksson, R., & Schiöth, H. B. (2013). Exposure to Bisphenol A Affects Lipid Metabolism in Drosophila melanogaster. Basic & clinical pharmacology & toxicology, 1–7. doi:10.1111/bcpt.12170
Wishart, D. S., Tzur, D., Knox, C., Eisner, R., Guo, A. C., Young, N., et al. (2007). HMDB: the Human Metabolome Database. Nucleic acids research, 35(Database issue), D521–6. doi:10.1093/nar/gkl923
Xia, J., Fjell, C. D., Mayer, M. L., Pena, O. M., Wishart, D. S., & Hancock, R. E. W. (2013). INMEX--a web-based tool for integrative meta-analysis of expression data. Nucleic acids research, 41(Web Server issue), W63–70. doi:10.1093/nar/gkt338
Xia, J., Mandal, R., Sinelnikov, I. V, Broadhurst, D., & Wishart, D. S. (2012). MetaboAnalyst 2.0--a comprehensive server for metabolomic data analysis. Nucleic acids research, 40(Web Server issue), W127–33. doi:10.1093/nar/gks374
Xia, J., Psychogios, N., Young, N., & Wishart, D. S. (2009). MetaboAnalyst: a web server for metabolomic data analysis and interpretation. Nucleic acids research, 37(Web Server issue), W652–60. doi:10.1093/nar/gkp356
Xu, C., & Xu, G. (2013). E ff ect of Bisphenol A on Rat Metabolic Pro fi ling Studied by Using Capillary Electrophoresis Time-of-Flight Mass Spectrometry.

Paper V Metabolite profiling of urine from rats dosed with Selenium nanoparticles or Selenium ions
Manuscript in progress
Aim: In the present investigation we utilized urine samples from rats administered with selenium in two different physical formulations (as nanoparticles and as sodium selenite) to assess the usefulness of metabolite pattern determination for comparing effects on mechanism of action of different chemicals.
Results: We found that when evaluating all significantly changed metabolites, nanoparticles and sodium selenite induced similar patterns of regulation. In the urine 13 metabolites were significantly different after exposure to selenium. Moreover we estimated the potencies to be similar. This suggests that selenium nanoparticles are completely dissolved into ions in the gastrointestinal system of the rat, and exhibit a bioavailability and mechanism of action similar to that of selenium ions.
Conclusion: We found that metabolite profiling in urine can be used to compare different chemical congeners in terms of similarities and differences in toxicological mechanisms of action.

1
Comparison of biological effect profiles of chemical
congeners using metabolite pattern determination the
example of selenium nanoparticles and sodium selenite
Niels Hadrupa*$, Katrin Löschnerb, Kasper Skovb, Gitte Ravn-Harena, Erik H. Larsenb, Alicja
Mortensena, Henrik R. Lama,c, Henrik L. Frandsenb
Division of Toxicology and Risk Assessmenta and Division of Food Chemistryb. National Food
Institute, Danish Technical University. Mørkhøj Bygade 19, DK-2860, Søborg,
Denmark. cEnvironment and Toxicology, DHI, Agern Allé 5, DK-2970 Hørsholm, Denmark
*Corresponding author $Present address, Saxocon, Malmosevej 63, 2830 Virum, Denmark, email
address [email protected], Telephone: +4550290158
Key words: nanoparticle, methods, metabolite pattern determination, metabolite profiling,
metabolomics, metabonomics, pharmacology, selenium, selenite, toxicology.
Author email addresses:
Niels Hadrup : [email protected]; Katrin Löschner: [email protected]; Kasper
Skov: [email protected]; Gitte Ravn-Haren: [email protected]; Erik H.
Larsen: [email protected];
Alicja Mortensen: [email protected]; Henrik R. Lam : [email protected]; Henrik L. Frandsen:
ABSTRACT

2
Introduction: In pharmacology and toxicology, there is often a need to determine differences in the
biological effect profiles of chemical congeners. This is important in order to assess whether
alterations in the chemical composition or formulation have an impact on the biological effects of
the substance. Using metabolite pattern determination, differences in the effect profile can be
assessed by determining whether there are differences among the sets of metabolites altered by the
various congeners. Methods: We utilized urine samples from rats administered selenium in two
different physical formulations (as nanoparticles or as sodium selenite) to assess the utility of
metabolite pattern determination in comparisons of different congeners. Results: Evaluations of all
significantly changed putative metabolites showed that selenium nanoparticles and sodium selenite
induced similar patterns of regulation. Moreover, we estimated the bioavailability to be in a similar
range with a tendency to a higher bioavailability of selenite compared to selenium nanoparticles.
Discussion: metabolite pattern determination demonstrated that selenium nanoparticles exhibit an
effect profile similar to that of selenium ions. This suggests that the effects of nanoparticulate
selenium can be attributed to ions released from its surface.

3
1. Introduction
In pharmacology and toxicology, there is often a need to determine differences in the effect profiles
of chemical congeners. This is important in order to provide a picture of whether a (physico)
chemical change or alterations in formulation alters the effect of each congeners on the mammalian
body. This may be in general but when specific mechanisms are known and measured a picture of
efficacy profile versus toxicity profile as well as information on bioavailability may be assessed
specifically. Examples of such congeners are different physico-chemical states of elements (e.g.,
nanoparticles vs. ions) or different functional groups applied to principal structures in drug research.
Metabolite pattern determination draws on the concept of metabolite profiling (metabolomics) to
enable the concomitant measurements of a large number of chromatogram peaks containing
potential metabolites (Robertson, Watkins, & Reily, 2011). Using metabolite pattern determination
on a body compartment such as urine or blood plasma, differences in the biological effects can be
assessed by comparing the sets of metabolites that are altered by each congener. This provides a
combined picture of pharmaco- and toxicodynaimcs as well as –kinetics .
Selenium (Se) is an element that, in trace amounts, is essential for humans. Se is incorporated as
selenocysteine, and selenium is necessary for the synthesis and catalytic function of selenoproteins
such as peroxidases and reductases (Levander, 1982). At high doses, Se becomes toxic, exhibiting
effects such as emaciation and weight loss (Nogueira & Rocha, 2011). To provide more effective Se
dosing regimens, nanoparticle formulations have been developed. The concept is that the Se
nanoparticles provide a slow release of Se ions, thereby reducing acute toxicity. Several studies
have demonstrated a lower toxic potency of Se nanoparticles than of ionic Se, suggesting that to
some extent, Se nanoparticles remain intact in the gastrointestinal tract (Benko et al., 2012; Jia, Li,
& Chen, 2005; J. S. Zhang, Gao, Zhang, & Bao, 2001; J. Zhang, Wang, Yan, & Zhang, 2005). It
has been shown that smaller Se nanoparticles are more toxic than larger particles. This finding
suggests that the rate of release of Se ions may depend on the nanoparticle size and thus on the
surface area per unit weight (Peng, Zhang, Liu, & Taylor, 2007). Whether Se nanoparticles exhibit
unexpected effects that cannot be attributed to Se ions but rather to the physical form of the
nanoparticles themselves remains unknown. In the present investigation, we used equimolar
amounts of Se formulated in two different ways (nanoparticles vs. ions), to study the utility of
metabolite pattern determination for the differentiation between the biological effects of chemical
congeners. We used LC-MS to analyze urine samples obtained after 14 days of oral administration

4
of Se nanoparticles (19 nm in mean diameter) or sodium selenite in equimolar doses of 0.05 and 0.5
mg Se/kg bw/day. A maximal safe dose in humans is 5 µg/kg bw thus these doses reflect 10 and
100 fold that dose. The affected metabolites were determined using the MetaboAnalyst web-tool
(Xia, Psychogios, Young, & Wishart, 2009), and the curves obtained were assessed for equal effect
patterns to compare differences in biological effect profiles for the different congeners.
2. Materials and methods
2.1. Nanoparticles
Se nanoparticles with a mean diameter of 19 nm (ranging in size from 10 to 80 nm) were produced,
stored and characterized as previously described (Loeschner et al., 2014; J. S. Zhang et al., 2001).
Briefly, images to assess the size and shape of the Se nanoparticles were generated by transmission
electron microscopy (TEM) (Figure 1) using a TEM Philips CM100 instrument (FEI, Eindhoven,
The Netherlands) at 80 kV accelerating voltage (Loeschner et al., 2014).
2.2. Animal study
Urine samples were obtained from a previously reported Se bio-distribution study (Loeschner et al.,
2014). Briefly, four-week-old, specific pathogen-free (SPF) female Wistar rats were obtained from
Taconic M&B (Lille Skensved, Denmark). The rats were allowed to acclimatize for one week. The
rats were housed in pairs with a 12:12-h light/dark cycle with the lights on from 7 a.m. to 7 p.m.
The room temperature was 22 ± 1 oC, and the relative humidity was 55 % ± 5 %. The rats were
given ad libitum access to a standard diet (Prod. no.1324, Altromin International, Lage, Germany)
and citric acid acidified tap water. The animals were randomized by weight. The test substances
were administered by oral gavage in a volume of 10 mL/kg bw once a day for 14 days. The
treatment groups were as follows: 1. Vehicle-BSA (bovine serum albumin 4 g/L) control (n=8); 2.
Se nanoparticles 0.05 mg Se/kg bw/day stabilized with BSA (4 g/L) (n=6); 3. Se nanoparticles 0.5
mg Se/kg bw/day (n=6) stabilized with BSA (4 g/L); 4. Vehicle-H2O (n=8); 5. Sodium selenite

5
0.05 mg Se/kg bw/day (n=8); and 6. Sodium selenite 0.5 mg Se/kg bw/day (n=8). No BSA was
added to groups 4, 5 and 6; thus, group 4 acted as the control group for the sodium selenite groups.
Sodium selenite (Na2SeO3) was obtained from Sigma-Aldrich (Copenhagen, Denmark). On
experimental day 14, the rats were placed individually in metabolism cages for 24 hours for the
collection of urine. During the 24-hour period, the urine samples were frozen by collection on dry-
ice. Subsequently, the samples were stored at -80 °C. In the metabolism cages, the rats had access to
drinking water but not to feed. The animal study was conducted under conditions approved by the
Danish Animal Experiments Inspectorate and the in-house Animal Welfare Committee.
2.3. HPLC/MS metabolite profiling analysis
Metabolite profiling of the urine was performed as previously described (Hadrup et al., 2012). In
brief, the urine samples were precipitated with two volumes of methanol and centrifuged (10 min at
10,000 x g). The supernatants were collected and analyzed by HPLC coupled to a qTOF-MS.
Sample injection volumes were normalized to the creatinine concentration of the urine to adjust for
differences in diuresis. The metabolites were separated on an Avensis Express C8, 2.7 µm, 100 x
2.1 mm column (Supelco, Bellefonte, PA, USA, product no. 53832-U). The metabolites were next
detected by use of a Bruker microTOFq time-of-flight mass spectrometer equipped with an
electrospray ion source (Bruker Daltonics, Bremen, Germany). The samples were analyzed in both
positive and negative ionization modes. The data obtained are reported as the mass-to-charge (m/z)
ratios and HPLC retention times of the metabolites. These are given in the format of xxxx.xxx Da,
yyy.y s (seconds).
The analyses of the chromatograms were conducted using the Profile Analysis 2.1 software
package (Bruker Daltonics, Bremen, Germany). Data buckets were constructed using a time
window from 60 to 720 s with an m/z ratio range of 100 to 700 using the “find molecular feature”

6
algorithm including time alignment. The noise was reduced using R (R Core Team, 2012) by
removing peaks that were present in < 50% of the samples of each treatment groups and had peak
intensities of ≤ 3000 counts per s (cps). The raw intensity data were next transferred to the online
MetaboAnalyst server (Xia et al., 2009). The data were normalized as the sums, and Pareto-scaling
was performed. Partial least squares (PLS) discriminant analysis was performed for all datasets
collectively. ANOVA was applied to the BSA-vehicle vs. Se nanoparticle groups and separately to
the H2O vehicle vs. sodium selenite groups. Discriminatory metabolites were selected based on a
false discovery rate-adjusted p value of 0.05. The corresponding raw data for these metabolites were
then transferred to Graph Pad Prism to establish curves and test for normal distributions. Normality
was tested using the Kolmogorov Smirnov test (with Dallal-Wilkinson-Lillefor p-value). The data
(BSA vehicle vs. Se nanoparticle groups and H2O vehicle vs. selenite groups) were then evaluated
again by ANOVA or by Kruskal-Wallis depending on the presence or absence of normal
distribution. Dunnett’s and Dunn’s post tests were applied to determine the effects of single
treatment groups compared to their respective control groups. All data on the graphs are presented
as the mean, and the error bars represent SEM. A false discovery rate-corrected p-value of less than
0.05 was considered significant.
The metabolites were subjected to identification to provide a level of certainty that
chromatographic peaks represented metabolites and to provide a picture of the nature of the effects
induced by the selenium congeners. For the identification of metabolites, The Human Metabolome
Database (Wishart et al., 2013) was searched using the accurate masses of the metabolites. The
presence of adducts or fragments (e.g., plus Na+ or minus H2O) at identical HPLC retention times
was taken into account.

7
3. Results
The three-dimensional graphical presentation of the results of the PLS analyses provides a picture
of the overall differences among the treatment groups (Fig. 2). In the positive mode, there were
clear differences in the spatial locations of all groups, reflecting dose-response effects as indicated
by the position of the 0.05 mg Se group between the vehicle and the 0.5 mg Se groups. There was a
clear vehicle-induced difference in the spacing of samples in the PLS analyses as indicated by the
different position of the BSA-vehicle samples compared to the H2O-vehicle samples (Fig. 2). In the
negative mode, the picture was similar to that seen for the positive mode, although less clear (Fig.
2).
Concomitant analyses of all groups using the MetaboAnalyst online tool indicated statistically
significant changes in eight peaks in the negative mode and 11 in the positive mode (Tables 1 and
2). Some of these were adducts of others (see Tables 1 and 2), and after accounting for these, six
metabolites were significantly changed in the negative mode and seven in the positive mode (Figure
3). Several metabolites showed dose-response relationships as suggested by the graphs. However,
application of the post-test identified statistically significant effects only for the 0.5 mg Se/kg
bw/day groups. Overall, the Se nanoparticles and sodium selenite induced similar patterns of
regulation. Exceptions were metabolites 316.1229 Da, 233.9 s in negative mode and 367.2448 Da,
236.8 s in positive mode (see Tables 1 and 2 for the possible identities of these metabolites). The
levels of the effects (intensity counts) likewise seemed similar, although the number of enhanced
metabolites in the urine of the sodium selenite-administered animals was larger than in the Se
nanoparticle-administered animals. The exact mass of discriminatory metabolites (± 5 mDa) was
used as a search parameter in The Human Metabolome Database (Wishart et al., 2013). The
putative identities of the metabolites are presented in Tables 1 and 2.

8
4. Discussion
The purpose of this investigation was to evaluate the utility of metabolite pattern determination in
the comparison of chemical congeners with respect to similarities in the biological effect profiles.
For this study, we utilized urine from rats administered two chemical forms of Se, specifically
elemental Se nanoparticles or sodium selenite. The PLS analyses indicated effects of both
formulations at the low (0.05) and the higher (0.5 mg/kg bw/day) Se doses (Figure 2). Among the
13 metabolites found to be significantly changed, 11 displayed similar patterns of metabolite
regulation for both Se formulations (Figure 3). Assuming that urine reflects the excreted end
products of a high proportion of the body’s metabolic processes, there is a strong indication of
similar biological effects of the two different formulations. However, to providing details on
whether these similarities were due to equal (toxicological) mechanisms of action it would be
necessary to know if the altered metabolites reflected the toxicological mechanisms of selenium. It
has previously been shown that selenium induces liver and bone toxicities (HASEGAWA, ZHANG
2005, ISHIKAWA, TURAN 2000, YAMAGUCHI 2000). But information on differences in
metabolite patterns are lacking.
The putative identification of the metabolites was attempted by searching The Human Metabolome
Database using the exact mass of the ions. However, more than one candidate identity was often
possible for each single metabolite. This was due to similar elemental composition; e.g., for one ion,
we found 12 different possible isoforms of diacylglycerol with exactly the same molecular mass.

9
This hampered the determination of specific mechanisms of action for Se. However, overall, there
were changes in fatty acids and amino acids, suggesting that there is a general response on
metabolism following the administration of Se in the doses employed.
Thus the metabolite differences could not be tied directly to a mechanism of action of selenium.
However, such information may very well be the case for other chemical congeners e.g. when a
leading pharmaceutical structure has already been profiled for its mechanism of action. And when
this is the case a difference in some metabolites (e.g. those associated with adverse effects of the
leading structure) but not others (e.g. those associated with the wanted pharmaceutical effect) can
provide picture on advantages and disadavantages of inducing a certain chemical change or
formulation change to a leading structure.
Rather than giving us a specific knowledge on equal mechanisms of action of the similarity of the
two selenium formulations give an indication of a similar general response in terms of a
combination of such effects in the body as mechanism of action both on the intended target,
different metabolism pathways, different distribution, differences in excretion. We suggest that the
data could be used to estimate the biovaialbility of the two Se formulations to be in a similar range,
with a tendency to a bioavailability of selenite compared to Se nanoparticles. This tendency is given
by eight metabolites for which there was a significant effect of sodium selenite but only a non-
significant tendency for Se nanoparticles (Fig. 3). This finding could be due to a high degree of
dissolution of the Se nanoparticles into ions, probably occurring in the gastro-intestinal tract.
Others have found that for some toxicity endpoints, selenite was more potent than Se nanoparticles
in mice and rats (Benko et al., 2012; Jia et al., 2005; J. S. Zhang et al., 2001; J. Zhang et al., 2005).
However, in spite of this tendency, our previous finding that the high doses of both forms of Se
were equally available for incorporation into selenoprotein P supports the hypothesis that the
bioavailability was in a similar range (Loeschner et al., 2014). Moreover, Kojouri and co-workers

10
found similar effects of Se nanoparticles and sodium selenite on iron, transferrin and on neutrophils
in sheep (Kojouri, Jahanabadi, Shakibaie, Ahadi, & Shahverdi, 2012; Kojouri, Sadeghian, Mohebbi,
& Mokhber Dezfouli, 2012).
Pattern recognition approaches in chemometrics and metabolite profiling have been described
and employed previously by others (el-Deredy, 1997; Robertson et al., 2011; Robertson, 2005).
These approaches have, for example, been used to identify specific metabolite patterns for specific
toxicities without knowing the identity of the specific metabolites (Anthony, Rose, Nicholson, &
Lindon, 1995; Holmes et al., 1994, 1998; Lenz, Bright, Knight, Wilson, & Major, 2004). However,
there are arguments against this approach. As reviewed by Robertson (Robertson et al., 2011;
Robertson, 2005), for example, effects from the primary toxicity of a compound and concomitant
indirect toxicities may overlay and obscure the picture of specific organ toxicities. In addition, the
metabolite profile may reflect a minor toxicological target, and therefore, concomitantly activated
major targets may be missed. Robertson noted that it could therefore be advisable to focus on
determining the exact identities of metabolites, to establish biomarkers that are understood in terms
of whether they reflect either effects or mechanisms (Robertson et al., 2011). However, in the use
proposed here, metabolite patterns are highly useful for assessing differences in biological effects
between different chemical congeners, even in the absence of confirmed identification of the
metabolites. Other potential uses are the determination of differences between a novel substance
and a known standard or the determination of whether impurities have biological effects. For these
applications, different treatment groups are tested simultaneously to minimize the influence of
environmental factors such as different stress levels between different animal facilities or
differences in feed batches, etc., on the results of the study.
In conclusion, we used a metabolite pattern determination approach to compare the biological
effect profiles of Se nanoparticles and sodium selenite. Based on our findings of similar patterns of

11
metabolites in the urine, we conclude that it is highly likely that the two formulations of Se have
similar biological effects. Moreover, comparisons of the intensities of the effects indicated that the
formulations exhibited similar bioavailability. This suggests that the effects of nanoparticulate Se
can be attributed to ions released from its surface. We propose that determination of metabolite
patterns is a promising approach in pharmacological and toxicological studies in which different
chemical congeners are compared to determine differences in their effect profiles, including
differences in their mechanisms of action, metabolism and bioavailability.

12
Figures
Figure 1.
Figure 1. TEM micrograph of the administered Se nanoparticles

13
Figure 2.
Fig 2A
Fig 2B:

14
Figure 2. PLS analyses of urine from rats administered Se nanoparticles or sodium selenite. SeNP
designates Se nanoparticles, and NaSe designates sodium selenite. The components designate
principal components 1-3 of the PLS analyses.

15
Figure 3.
A) Negative mode:
217.1071 Da, 211.5 s
BSA-veh
icle
SeNP 0
.05
SeNP 0
.5
H2O-v
ehic
le
NaSe
0.05
NaSe
0.5
0
5000
10000
15000
20000
25000
§§
§§
Inte
nsi
ty (
cou
nts
/s)
199.0972 Da, 223.7 s
BSA-veh
icle
SeNP 0
.05
SeNP 0
.5
O-veh
icle
2HNaS
e 0.
05
NaSe
0.5
0
20000
40000
60000
80000
100000
§ §
Inte
nsi
ty (
cou
nts
/s)
316.1229 Da, 233.9 s
BSA-veh
icle
SeNP 0
.05
SeNP 0
.5
H2O-v
ehic
le
NaSe
0.05
NaSe
0.5
0
2000
4000
6000
8000§
Inte
nsi
ty (
cou
nts
/s)
204.0657 Da, 197.9
BSA-veh
icle
SeNP 0
.05
SeNP 0
.5
H2O-v
ehic
le
NaSe
0.05
NaSe
0.5
0
2000
4000
6000
8000
10000
§
Inte
nsi
ty (
cou
nts
/s)
201.1129 Da, 233.1 s
BSA-veh
icle
SeNP 0
.05
SeNP 0
.5
H2O-v
ehic
le
NaSe
0.05
NaSe
0.5
0
20000
40000
60000§§§
Inte
nsi
ty (
cou
nts
/s)
243.1234 Da, 214.1 s
BSA-veh
icle
SeNP 0
.05
SeNP 0
.5
H2O-v
ehic
le
NaSe
0.05
NaSe
0.5
0
5000
10000
15000
20000§§
Inte
nsi
ty (
cou
nts
/s)

16
B) Positive mode
175.0796 Da, 153.9 s
BSA-veh
icle
SeNP 0
.05
SeNP 0
.5
H2O-v
ehic
le
NaSe
0.05
NaSe
0.5
0
5000
10000
15000
§
Inte
nsi
ty (
cou
nts
/s)
172.0960 Da, 167.3 s
BSA-veh
icle
SeNP 0
.05
SeNP 0
.5
H2O-v
ehic
le
NaSe
0.05
NaSe
0.5
0
10000
20000
30000 **
***
Inte
nsi
ty (
cou
nts
/s)
367.2448 Da, 236.8 s
BSA-veh
icle
SeNP 0
.05
SeNP 0
.5
H2O-v
ehic
le
NaSe
0.05
NaSe
0.5
0
20000
40000
60000
80000
§
Inte
nsi
ty (
cou
nts
/s)
376.1124 Da, 128.7 s
BSA-veh
icle
SeNP 0
.05
SeNP 0
.5
H2O-v
ehic
le
NaSe
0.05
NaSe
0.5
0
5000
10000
15000
20000§§§
Inte
nsi
ty (
cou
nts
/s)
131.0506 Da, 207.3 s
BSA-veh
icle
SeNP 0
.05
SeNP 0
.5
H2O-v
ehic
le
NaSe
0.05
NaSe
0.5
0
10000
20000
30000
40000
***
Inte
nsi
ty (
cou
nts
/s)
213.1424 Da, 212.0 s
BSA-veh
icle
SeNP 0
.05
SeNP 0
.5
H2O-v
ehic
le
NaSe
0.05
NaSe
0.5
0
2000
4000
6000§§
Inte
nsi
ty (
cou
nts
/s)
137.0958 Da, 222.7 s
BSA-veh
icle
SeNP 0
.05
SeNP 0
.5
H2O-v
ehic
le
NaSe
0.05
NaSe
0.5
0
5000
10000
15000
20000
25000
* ***
Inte
nsi
ty (
cou
nts
/s)

17
Figure 3. Bar graphs of individual metabolites determined by LC-MS in A) negative ion mode or
B) positive ion mode and indicated by their accurate masses. SeNP designates Se nanoparticles, and
NaSe designates sodium selenite. The data are the mean values, and the bars indicate SEM. The
data were statistically tested as BSA-vehicle vs. Se nanoparticles at 0.05 and 0.5 mg Se/kg bw/day
and as H2O-vehicle vs. sodium selenite at 0.05 and 0.5 mg Se/kg bw/day. The tests were one-way
ANOVA with Dunnett’s post-test for normally distributed data (* designates p <0.05, **p<0.01 and
***p<0.001), or with Kruskal-Wallis with Dunn’s post-test for data that were not normally
distributed (§ designates p <0.05, §§p<0.01 and §§§p<0.001).

18
Table 1. Possible identities of metabolites measured in negative mode
Metabolite m/z (Da) HMDB m/z (Da) m/z error (Da) Ret. Time (s) Possible identity
217.1071 217.1082 0.0011 211.5 2-Hydroxydecanedioic acid / 3-Hydroxydecanedioic acid [M-H]
199.0972 199.0976 0.0004 223.7 cis-4-Decenedioic acid / cis-5-Decenedioic acid [M-H]
316.1229 316.1303 0.0074 233.9 Tryptophyl-Hydroxyproline / Hydroxyprolyl-Tryptophan [M-H]
204.0657 204.0666 0.0009 197.9 Cinnamoylglycine / Indolelactic acid / 3-Indolehydracrylic acid / 5-
Methoxyindoleacetate [M-H]
201.1129 201.1132 0.0003 233.1 Sebacic acid / Heptylmalonic acid / 3-Methylazelaic acid [M-H]
160.0757 161.0688 0.0141 197.9 Possible fragment of 204.0657 [M-CH2O2]
181.0873 n/a n/a 223.7 cis-4-Decenedioic acid / cis-5-Decenedioic acid [M-H2O]
243.1234 243.1167 0.0067 214.1 Isoleucyl-Methionine / Methionyl-Isoleucine [M-H20-H]
Legend: Potential metabolites identified by comparing m/z ratios of metabolites with m/z ratios obtained from the human metabolome (HMDB) database. Ret. Time: Retention time.

19
Table 2. Possible identities of metabolites measured in positive mode
Metabolite (m/z) HMDB MW (m/z) Error (m/z) Ret. Time (s) Possible identity
175.0796 175.0713 0.0083 153.9 N-Acetylasparagine / Formiminoglutamic acid [M+H]+
192.1042 192.0979 0.0063 153.9 N-Acetylasparagine / Formiminoglutamic acid [+NH4+]
172.0960 n/a n/a 167.3 No candidates
137.0958 137.0921 0.0037 222.7 L-Threonine / L-Allothreonine [M+NH4+]
201.1098 201.1121 0.0023 219.3 cis-4-Decenedioic acid / cis-5-Decenedioic acid [M+H]+
203.1268 203.1277 0.0009 233.8 Sebacic acid / Heptylmalonic acid / 3-Methylazelaic acid [M+H]+
367.2448 367.2426 0.0022 236.8 12 different diacylglycerols [M+Na]+
165.0912 n/a n/a 222.1 No candidates but fits with 137.0958 plus CO [M+H]+
376.1124 n/a n/a 128.7 s No candidates
131.0506 131.0503 0.0002 207.3 N-a-Acetyl-L-arginine [M+2Na]
131.0514 0.0008 Glutamyl-Asparagine / Asparaginyl-Glutamate [+2H]
213.1424 213.1485 0.006 212.0 Six different bile acids [M+H]+
Legend: Potential metabolites identified by comparing m/z ratios of metabolites with m/z ratios obtained from the human metabolome (HMDB) database. Ret. Time: Retention time.

20
Funding Sources
Author contributions
An equal contribution to the original idea and study design, by Niels Hadrup, Katrin Loeschner,
Erik Huusfeldt Larsen, Alicja Mortensen, Henrik Rye Lam and Henrik L. Frandsen. The
experimental contribution was made by Niels Hadrup, Katrin Loeschner and Henrik L.
Frandsen..Data analysis was conducted by Niels Hadrup, Kasper Skov and Henrik L. Frandsen. All
authors contributed to the data interpretation and writing of the manuscript. The authors declare no
competing financial interest.
Acknowledgements
Anne Ørngreen, Maja Danielsen, Eva Ferdinansen, Elise E. Navntoft, Eigil V. Frank, Kenneth R.
Worm, Sarah G. Simonsen, Annette Landin, Karen Roswall, Ulla Baroudy, Vibeke Kjær, and
Nehad Moradian provided excellent technical assistance.
The Danish Food Industry Agency funded this research through the Nano-Test Project.
References
Anthony, M. L., Rose, V. S., Nicholson, J. K., & Lindon, J. C. (1995). Classification of Toxin-Induced Changes in H-1-Nmr Spectra of Urine Using an Artificial Neural-Network. Journal of Pharmaceutical and Biomedical Analysis, 13(3), 205–211. http://doi.org/Doi 10.1016/0731-7085(95)01278-S
Benko, I., Nagy, G., Tanczos, B., Ungvari, E., Sztrik, A., Eszenyi, P., … Banfalvi, G. (2012). Subacute toxicity of nano-selenium compared to other selenium species in mice. Environ Toxicol Chem, 31(12), 2812–2820. http://doi.org/10.1002/etc.1995

21
el-Deredy, W. (1997). Pattern recognition approaches in biomedical and clinical magnetic resonance spectroscopy: a review. NMR in Biomedicine, 10(3), 99–124. Retrieved from http://www.ncbi.nlm.nih.gov/pubmed/9408920
Hadrup, N., Lam, H. R., Loeschner, K., Mortensen, A., Larsen, E. H., & Frandsen, H. (2012). Nanoparticulate silver increases uric acid and allantoin excretion in rats, as identified by metabolomics. Journal of Applied Toxicology, 32(11), 929–933. http://doi.org/10.1002/jat.2779
Holmes, E., Foxall, P. J. D., Nicholson, J. K., Neild, G. H., Brown, S. M., Beddell, C. R., … Neidig, P. (1994). Automatic Data Reduction and Pattern-Recognition Methods for Analysis of H-1 Nuclear-Magnetic-Resonance Spectra of Human Urine from Normal and Pathological States. Analytical Biochemistry, 220(2), 284–296. http://doi.org/DOI 10.1006/abio.1994.1339
Holmes, E., Nicholls, A. W., Lindon, J. C., Ramos, S., Spraul, M., Neidig, P., … Nicholson, J. K. (1998). Development of a model for classification of toxin-induced lesions using H-1 NMR spectroscopy of urine combined with pattern recognition. NMR in Biomedicine, 11(4-5), 235–244. http://doi.org/Doi 10.1002/(Sici)1099-1492(199806/08)11:4/5<235::Aid-Nbm507>3.0.Co;2-V
Jia, X., Li, N., & Chen, J. (2005). A subchronic toxicity study of elemental Nano-Se in Sprague-Dawley rats. Life Sciences, 76(17), 1989–2003. http://doi.org/10.1016/j.lfs.2004.09.026
Kojouri, G. A., Jahanabadi, S., Shakibaie, M., Ahadi, A. M., & Shahverdi, A. R. (2012). Effect of selenium supplementation with sodium selenite and selenium nanoparticles on iron homeostasis and transferrin gene expression in sheep: a preliminary study. Research in Veterinary Science, 93(1), 275–278. http://doi.org/10.1016/j.rvsc.2011.07.029
Kojouri, G. A., Sadeghian, S., Mohebbi, A., & Mokhber Dezfouli, M. R. (2012). The effects of oral consumption of selenium nanoparticles on chemotactic and respiratory burst activities of neutrophils in comparison with sodium selenite in sheep. Biological Trace Element Research, 146(2), 160–166. http://doi.org/10.1007/s12011-011-9241-4
Lenz, E. M., Bright, J., Knight, R., Wilson, I. D., & Major, H. (2004). Cyclosporin A-induced changes in endogenous meta-bolites in rat urine: a metabonomic investigation using high field H-1 NMR spectroscopy, HPLC-TOF/MS and chemometrics. Journal of Pharmaceutical and Biomedical Analysis, 35(3), 599–608. http://doi.org/DOI 10.1016/j.jpba.2004.02.013
Levander, O. A. (1982). Clinical Consequences of Low Selenium Intake and Its Relationship to Vitamin-E. Annals of the New York Academy of Sciences, 393(Sep), 70–82. http://doi.org/DOI 10.1111/j.1749-6632.1982.tb31233.x
Loeschner, K., Hadrup, N., Hansen, M., Pereira, S. a, Gammelgaard, B., Møller, L. H., … Larsen, E. H. (2014). Absorption, distribution, metabolism and excretion of selenium following oral administration of elemental selenium nanoparticles or selenite in rats. Metallomics : Integrated Biometal Science, 6(2), 330–7. Retrieved from http://www.ncbi.nlm.nih.gov/pubmed/24413471

22
Nogueira, C. W., & Rocha, J. B. (2011). Toxicology and pharmacology of selenium: emphasis on synthetic organoselenium compounds. Archives of Toxicology, 85(11), 1313–1359. http://doi.org/10.1007/s00204-011-0720-3
Peng, D., Zhang, J., Liu, Q., & Taylor, E. W. (2007). Size effect of elemental selenium nanoparticles (Nano-Se) at supranutritional levels on selenium accumulation and glutathione S-transferase activity. Journal of Inorganic Biochemistry, 101(10), 1457–1463. http://doi.org/10.1016/j.jinorgbio.2007.06.021
R Core Team. (2012). R: A Language and Environment for Statistical Computing. R Foundation for Statistical Computing. http://doi.org/10.1007/978-3-540-74686-7
Robertson, D. G. (2005). Metabonomics in toxicology: a review. Toxicological Sciences, 85(2), 809–822. http://doi.org/10.1093/toxsci/kfi102
Robertson, D. G., Watkins, P. B., & Reily, M. D. (2011). Metabolomics in toxicology: preclinical and clinical applications. Toxicological Sciences, 120 Suppl , S146–70. http://doi.org/10.1093/toxsci/kfq358
Wishart, D. S., Jewison, T., Guo, A. C., Wilson, M., Knox, C., Liu, Y. F., … Scalbert, A. (2013). HMDB 3.0-The Human Metabolome Database in 2013. Nucleic Acids Research, 41(D1), D801–D807. http://doi.org/Doi 10.1093/Nar/Gks1065
Xia, J. G., Psychogios, N., Young, N., & Wishart, D. S. (2009). MetaboAnalyst: a web server for metabolomic data analysis and interpretation. Nucleic Acids Research, 37, W652–W660. http://doi.org/Doi 10.1093/Nar/Gkp356
Zhang, J. S., Gao, X. Y., Zhang, L. D., & Bao, Y. P. (2001). Biological effects of a nano red elemental selenium. Biofactors, 15(1), 27–38. Retrieved from http://www.ncbi.nlm.nih.gov/pubmed/11673642
Zhang, J., Wang, H., Yan, X., & Zhang, L. (2005). Comparison of short-term toxicity between Nano-Se and selenite in mice. Life Sciences, 76(10), 1099–1109. http://doi.org/10.1016/j.lfs.2004.08.015

National Food InstituteTechnical University of DenmarkMørkhøj Bygade 19DK - 2860 Søborg
Tel. 35 88 70 00Fax 35 88 70 01
www.food.dtu.dk
ISBN: 978-87-93109-35-3