Embed Size (px)
Citation preview

Research www.AJOG.org
OBSTETRICS
Metabolomic analysis for first-trimesterDown syndrome predictionRay O. Bahado-Singh, MD, MBA; Ranjit Akolekar, MD; Rupasri Mandal, PhD; Edison Dong, BSc;Jianguo Xia, PhD; Michael Kruger, MS; David S. Wishart, PhD; Kypros Nicolaides, MD
OBJECTIVE: The objective of the study was to perform first-trimestermaternal serum metabolomic analysis and compare the results in ane-uploid vs Down syndrome (DS) pregnancies.
STUDY DESIGN: This was a case-control study of pregnancies be-tween 11�0 and 13�6 weeks. There were 30 DS cases and 60 con-trols in which first-trimester maternal serum was analyzed. Nuclearmagnetic resonance-based metabolomic analysis was performed forDS prediction.
RESULTS: Concentrations of 11 metabolites were significantly different
in the serum of DS pregnancies. The combination of 3-hydroxyisovaler-2013;208:371.e1-8.
rq1
pnc
recently been reportedSee related editorial, page 339
ate, 3-hydroxybuterate, and maternal age had a 51.9% sensitivity at1.9% false-positive rate for DS detection. One multimarker algorithmhad 70% sensitivity at 1.7% false-positive rate. Novel markers such as3-hydroxybutyrate, involved in brain growth and myelination, and 2-hydroxybutyrate, involved in the defense against oxidative stress, werefound to be abnormal.
CONCLUSION: The study reports novel metabolomic markers for thefirst-trimester prediction of fetal DS. Metabolomics provided insightsinto the cellular dysfunction in DS.
Key words: Down syndrome screening, metabolomics
Cite this article as: Bahado-Singh RO, Akolekar R, Mandal R, et al. Metabolomic analysis for first-trimester Down syndrome prediction. Am J Obstet Gynecol
Metabolites are low-molecular-weightorganic and inorganic chemicals
that are the substrates, intermediates, andbyproducts of enzyme-mediated bio-
From the Department of Obstetrics andGynecology, Oakland University –WilliamBeaumont School of Medicine, Royal Oak, MI(Dr Bahado-Singh); the Department ofObstetrics and Gynecology, Wayne StateUniversity School of Medicine, Detroit, MI (MrKruger); Harris Birthright Research Centre forFetal Medicine, King’s College Hospital,London, England, UK (Drs Akolekar andNicolaides); and the Departments of BiologicalSciences (Drs Mandal, Dong, and Wishart) andComputing Sciences (Drs Xia and Wishart),University of Alberta, Edmonton, AB, Canada.
Received June 29, 2012; revised Nov. 7, 2012;accepted Dec. 27, 2012.
This study was supported in part by a grantfrom the Fetal Medicine Foundation, charitynumber 1037116.
The authors report no conflict of interest.
Reprints not available from the authors.
0002-9378/free© 2013 Mosby, Inc. All rights reserved.http://dx.doi.org/10.1016/j.ajog.2012.12.035
For Editors’ Commentary,see Contents
chemical reactions in the cell.1 The mole-cules include but are not limited to carbo-hydrates, amino acids, peptides, nucleicacids, organic acids, vitamins, lipids, andother biological species.2 Metabolomicsefers to the systematic identification anduantification of these small (less than500 Da) molecules.Advances in the development of analytic
latforms such as nuclear magnetic reso-ance (NMR) and high-performance liquidhromatography–mass spectrometry3 and
instatisticalprogramsforanalysisof thelargevolume of data generated in metabolomicstudies4 have fueled the rapidly growing in-terest in this field.
Metabolites form the building blocksof genes, ribonucleic acid transcripts,and proteins. For these and other rea-sons, metabolomics is thought to havethe potential to provide more funda-mental and global information thangenomics, proteomics, and transcrip-tomics and to more precisely reflect thephenotype of the cell. The human serummetabolome has now been extensivelycharacterized. A total of 4229 confirmedand highly probable compounds have
.5
MAY 2013 Americ
One practical application of metabo-lomics has been in the development ofbiomarkers for disparate and complexdisorders such as schizophrenia,6 men-ingitis,7 and colon cancer.8 To date, therehas been only very limited use ofmetabolomics in obstetrics.
Routine screening for Down syn-drome (DS) in pregnancy has been thestandard of clinical care in the UnitedStates9 and other developed countries.10
The identification of new biomarkers forDS screening continues to be an area ofintense research interest.11
The purpose of this study was to deter-mine whether metabolomic markers inmaternal blood can distinguish DS fromnormal pregnancies during the first tri-mester. We also performed a preliminaryevaluation of the diagnostic accuracy ofsome of these markers.
MATERIALS AND METHODSThis was a case-control study drawn froma large prospective study to identify poten-tial biomarkers of pregnancy complica-tions in women attending for their routinefirst hospital visit in pregnancy at King’sCollege Hospital (London, UK) fromMarch 2003 to February 2009. In this visit,
which is held at 11�0-13�6 weeks of gesta-an Journal of Obstetrics & Gynecology 371.e1
csrtcstfcene
ttbCltUbrfodaNt
toaTt
mi
catcewsvp
pNtmbNhsoMwrocu(stildn
cps
lcvaotPiotamtfvtpab
dgclfstoacspdrrvscfp
Obs
Research Obstetrics www.AJOG.org
tion, all women have combined screeningfor aneuploidies.12 Maternal demographicharacteristics, ultrasononographic mea-urements, and biochemical results wereecorded in a computer database. Karyo-ype results and details on pregnancy out-omes were added into the database asoon as they became available. All cases ofrisomy 21 had a fetal karyotype confirmedollowing a chorionic villus sampling. Theontrols were selected from women deliv-ring live-born neonates at full term with aormal karyotype or a normal phenotypicxamination.
Written informed consent was ob-ained from the women agreeing to par-icipate in the study, which was approvedy the King’s College Hospital Ethicsommittee. Maternal venous blood col-
ected in plain BD vacutainer tubes (Bec-on Dickinson UK Limited, Oxfordshire,K) was processed within 15 minutes oflood collection and centrifuged at 3000pm for 10 minutes to separate serumrom packed cells. The maternal serumbtained after centrifugation was thenivided into 0.5 mL aliquots and storedt – 80°C until subsequent analysis.one of the samples were previously
hawed and refrozen.An aliquot of their serum were used for
he measurement of free �-human chori-nic gonadotropin (hCG) and pregnancyssociated plasma protein A (PAPP-A).he serum samples were transported to
TABLE 1Demographic and other characteris
Parameter Dow
Number of cases 30...................................................................................................................
Maternal age (y), mean (SD) 37....................................................................................................................
Racial origin, n (%)..........................................................................................................
White 27..........................................................................................................
Black 2..........................................................................................................
Asian 1..........................................................................................................
Mixed 0...................................................................................................................
Nullipara, n (%) 8...................................................................................................................
Weight (kg), mean (SD) 66....................................................................................................................
Medical disorder present 6...................................................................................................................
Crown-rump length (mm), mean (SD) 67....................................................................................................................
Bahado-Singh. Metabolomics and Down syndrome. Am J
he laboratory (Edmonton, Canada) for a
371.e2 American Journal of Obstetrics & Gynecolo
etabolomic testing by air courier on dryce and maintained in a frozen state.
The case-control study populationonsisted of 30 cases with fetal trisomy 21nd 60 euploid controls. Each case of fetalrisomy 21 was randomly chosen from ar-hival specimens and was matched with 2uploid controls with blood collectedithin 1 week of each other. None of the
amples in thecase-control studywerepre-iously thawed and refrozen or used in anyilot study.NMR spectroscopy was the analytic
latform used for metabolomic analysis.MR is very quantitative but is not a par-
icularly sensitive approach for metabolo-ics. Typically only 35-45 compounds can
e identified or selected from a serumMR spectrum on routine analysis.5 Weave previously described in detail theample preparation, spectroscopic meth-ds, and statistical analyses used.13 A 500Hz Varian Inova NMR spectrometeras used to collect the spectra of all se-
um samples. Overall, 40 serum metab-lites were identified, quantified, andompared in each DS and normal casesing the NMR Chenomx NMR Suite 7.1Edmonton, Canada), a commercialoftware package for spectral identifica-ion and quantification of metabolites. Its from this set of 40 detectable metabo-ites that the DS metabolite signature wasetermined. Standard statistical tech-iques recommended for metabolomic
s of the study population
syndrome Euploid control P value
60 —..................................................................................................................
.9) 30.5 (7.1) � .01..................................................................................................................
.012..................................................................................................................
33 (55.9)..................................................................................................................
) 19 (32.2)..................................................................................................................
) 4 (6.8)..................................................................................................................
3 (5.1)..................................................................................................................
7) 25 (42.4) .11..................................................................................................................
4.9) 67.0 (15.0) .83..................................................................................................................
5 (8.5) .11..................................................................................................................
.4) 64.8 (8.7) .19..................................................................................................................
tet Gynecol 2013.
nalysis including normalization, prin- v
gy MAY 2013
ipal component analysis (PCA), andartial least squares discriminant analy-is (PLS-DA) were used.14,15
Data normalization is important to re-duce systematic bias or technical varia-tion and to improve statistical robust-ness. This was accomplished using lognormalization. PCA is a multivariatetechnique16 that identifies the uncorre-ated variables or metabolites (principalomponents) that account for the largestariance or difference between the studynd control groups. The metabolites arerdered based on their contribution tohe variance between the 2 groups. In theCA plot, the first principal component
s represented on the X-axis and the sec-nd most important on the Y-axis (withhe third principal component on the Z-xis in a 3-dimensional plot). The mini-um number of principal components
hat when combined together accountsor the highest percentage of the totalariance between groups is sought. Clus-ering of the data points on the PCA plotrovides visual evidence that the studynd control groups can be discriminatedy measuring the principal components.PLS-DA was used to further enhance the
iscrimination between study and controlroups. With PLS-DA analysis, the principalomponents are rotated to find the metabo-ites most responsible for separating casesrom controls14 PLS-DA therefore improveseparation between the groups. PLS-DA isypically performed after separation is dem-nstrated on PCA. There is a risk in PLS-DAnalysis of observing separation betweenontrols and study group that might not betatistically significant.Tominimize this risk,ermutation testing is performed with ran-om relabeling of the metabolomic data anderunningofthePLS-DAanalysis.After2000epetitions of the relabeling process, the Palues of the probability that the observedeparation might be due to chance were cal-ulated.PCAandPLS-DAanalyseswereper-ormed with a MetaboAnalyst computerrogram.17
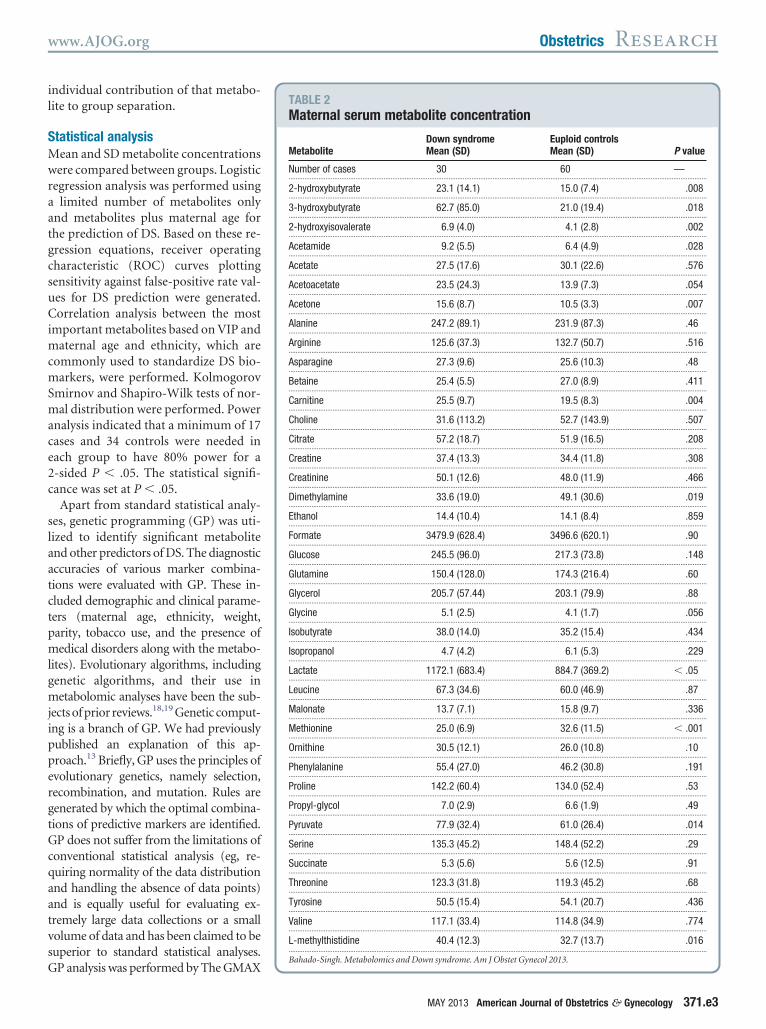
A variable importance in projection(VIP) plot was also constructed. This is agraph of the relative contributions of in-dividual metabolites to the variance be-tween the 2 groups.4 The higher the VIP
tic
n
.........
2 (3.........
.........
(90).........
(6.7.........
(3.3.........
(0).........
(26..........
3 (1.........
(20).........
2 (7.........
alue (X- and Y-axis), the greater is the
ipp
www.AJOG.org Obstetrics Research
individual contribution of that metabo-lite to group separation.
Statistical analysisMean and SD metabolite concentrationswere compared between groups. Logisticregression analysis was performed usinga limited number of metabolites onlyand metabolites plus maternal age forthe prediction of DS. Based on these re-gression equations, receiver operatingcharacteristic (ROC) curves plottingsensitivity against false-positive rate val-ues for DS prediction were generated.Correlation analysis between the mostimportant metabolites based on VIP andmaternal age and ethnicity, which arecommonly used to standardize DS bio-markers, were performed. KolmogorovSmirnov and Shapiro-Wilk tests of nor-mal distribution were performed. Poweranalysis indicated that a minimum of 17cases and 34 controls were needed ineach group to have 80% power for a2-sided P � .05. The statistical signifi-cance was set at P � .05.
Apart from standard statistical analy-ses, genetic programming (GP) was uti-lized to identify significant metaboliteand other predictors of DS. The diagnosticaccuracies of various marker combina-tions were evaluated with GP. These in-cluded demographic and clinical parame-ters (maternal age, ethnicity, weight,parity, tobacco use, and the presence ofmedical disorders along with the metabo-lites). Evolutionary algorithms, includinggenetic algorithms, and their use inmetabolomic analyses have been the sub-jects of prior reviews.18,19 Genetic comput-ng is a branch of GP. We had previouslyublished an explanation of this ap-roach.13 Briefly, GP uses the principles of
evolutionary genetics, namely selection,recombination, and mutation. Rules aregenerated by which the optimal combina-tions of predictive markers are identified.GP does not suffer from the limitations ofconventional statistical analysis (eg, re-quiring normality of the data distributionand handling the absence of data points)and is equally useful for evaluating ex-tremely large data collections or a smallvolume of data and has been claimed to besuperior to standard statistical analyses.
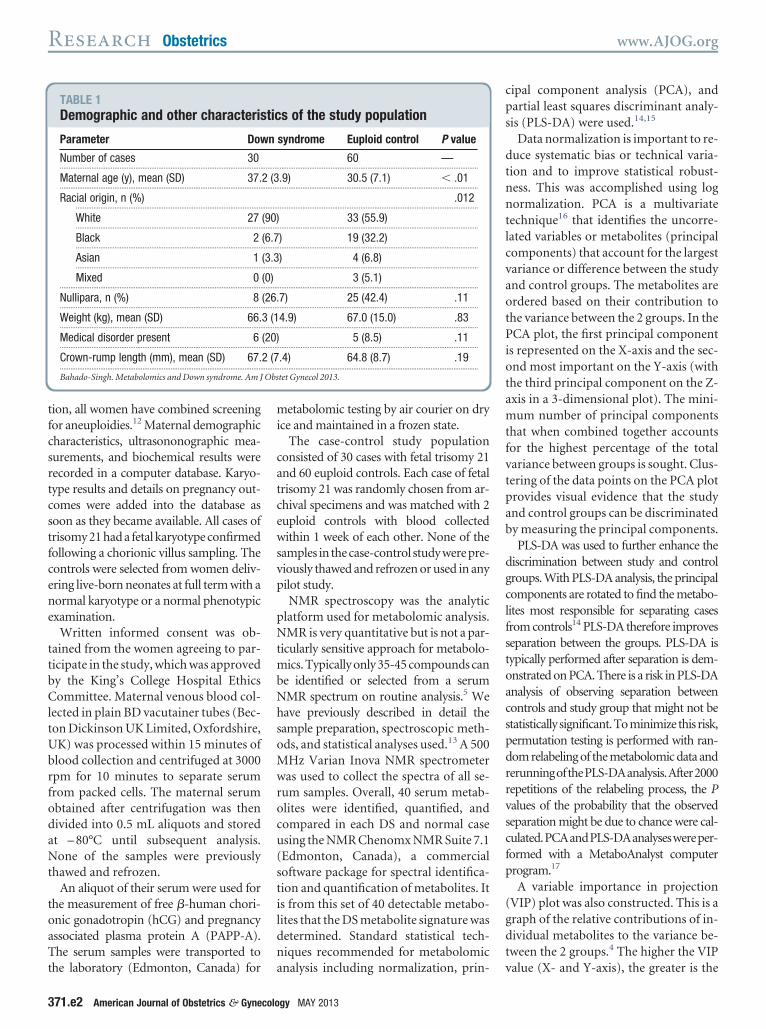
GP analysis was performed by The GMAXTABLE 2Maternal serum metabolite concentration
MetaboliteDown syndromeMean (SD)
Euploid controlsMean (SD) P value
Number of cases 30 60 —..............................................................................................................................................................................................................................................
2-hydroxybutyrate 23.1 (14.1) 15.0 (7.4) .008..............................................................................................................................................................................................................................................
3-hydroxybutyrate 62.7 (85.0) 21.0 (19.4) .018..............................................................................................................................................................................................................................................
2-hydroxyisovalerate 6.9 (4.0) 4.1 (2.8) .002..............................................................................................................................................................................................................................................
Acetamide 9.2 (5.5) 6.4 (4.9) .028..............................................................................................................................................................................................................................................
Acetate 27.5 (17.6) 30.1 (22.6) .576..............................................................................................................................................................................................................................................
Acetoacetate 23.5 (24.3) 13.9 (7.3) .054..............................................................................................................................................................................................................................................
Acetone 15.6 (8.7) 10.5 (3.3) .007..............................................................................................................................................................................................................................................
Alanine 247.2 (89.1) 231.9 (87.3) .46..............................................................................................................................................................................................................................................
Arginine 125.6 (37.3) 132.7 (50.7) .516..............................................................................................................................................................................................................................................
Asparagine 27.3 (9.6) 25.6 (10.3) .48..............................................................................................................................................................................................................................................
Betaine 25.4 (5.5) 27.0 (8.9) .411..............................................................................................................................................................................................................................................
Carnitine 25.5 (9.7) 19.5 (8.3) .004..............................................................................................................................................................................................................................................
Choline 31.6 (113.2) 52.7 (143.9) .507..............................................................................................................................................................................................................................................
Citrate 57.2 (18.7) 51.9 (16.5) .208..............................................................................................................................................................................................................................................
Creatine 37.4 (13.3) 34.4 (11.8) .308..............................................................................................................................................................................................................................................
Creatinine 50.1 (12.6) 48.0 (11.9) .466..............................................................................................................................................................................................................................................
Dimethylamine 33.6 (19.0) 49.1 (30.6) .019..............................................................................................................................................................................................................................................
Ethanol 14.4 (10.4) 14.1 (8.4) .859..............................................................................................................................................................................................................................................
Formate 3479.9 (628.4) 3496.6 (620.1) .90..............................................................................................................................................................................................................................................
Glucose 245.5 (96.0) 217.3 (73.8) .148..............................................................................................................................................................................................................................................
Glutamine 150.4 (128.0) 174.3 (216.4) .60..............................................................................................................................................................................................................................................
Glycerol 205.7 (57.44) 203.1 (79.9) .88..............................................................................................................................................................................................................................................
Glycine 5.1 (2.5) 4.1 (1.7) .056..............................................................................................................................................................................................................................................
Isobutyrate 38.0 (14.0) 35.2 (15.4) .434..............................................................................................................................................................................................................................................
Isopropanol 4.7 (4.2) 6.1 (5.3) .229..............................................................................................................................................................................................................................................
Lactate 1172.1 (683.4) 884.7 (369.2) � .05..............................................................................................................................................................................................................................................
Leucine 67.3 (34.6) 60.0 (46.9) .87..............................................................................................................................................................................................................................................
Malonate 13.7 (7.1) 15.8 (9.7) .336..............................................................................................................................................................................................................................................
Methionine 25.0 (6.9) 32.6 (11.5) � .001..............................................................................................................................................................................................................................................
Ornithine 30.5 (12.1) 26.0 (10.8) .10..............................................................................................................................................................................................................................................
Phenylalanine 55.4 (27.0) 46.2 (30.8) .191..............................................................................................................................................................................................................................................
Proline 142.2 (60.4) 134.0 (52.4) .53..............................................................................................................................................................................................................................................
Propyl-glycol 7.0 (2.9) 6.6 (1.9) .49..............................................................................................................................................................................................................................................
Pyruvate 77.9 (32.4) 61.0 (26.4) .014..............................................................................................................................................................................................................................................
Serine 135.3 (45.2) 148.4 (52.2) .29..............................................................................................................................................................................................................................................
Succinate 5.3 (5.6) 5.6 (12.5) .91..............................................................................................................................................................................................................................................
Threonine 123.3 (31.8) 119.3 (45.2) .68..............................................................................................................................................................................................................................................
Tyrosine 50.5 (15.4) 54.1 (20.7) .436..............................................................................................................................................................................................................................................
Valine 117.1 (33.4) 114.8 (34.9) .774..............................................................................................................................................................................................................................................
L-methylthistidine 40.4 (12.3) 32.7 (13.7) .016..............................................................................................................................................................................................................................................
Bahado-Singh. Metabolomics and Down syndrome. Am J Obstet Gynecol 2013.
MAY 2013 American Journal of Obstetrics & Gynecology 371.e3

ltm
.eodfiro
tad1tmmtpb
Research Obstetrics www.AJOG.org
computer program, version 11.9.23 (www.Thegmax.com).
RESULTSResults were obtained for 30 DS casesand 60 controls. The demographic andclinical characteristics of DS cases and
FIGURE 1PCA plot: DS vs normal
A, Two-dimensional score plot. B, Three-dimensDS, Down syndrome; PCA, principal component analysis.
Bahado-Singh. Metabolomics and Down syndrome. Am J Ob
controls are shown in Table 1. As ex- c
371.e4 American Journal of Obstetrics & Gynecolo
pected, DS mothers were significantlyolder than control mothers. In addition,there were racial differences between the2 groups. In Table 2, the serum metabo-ite concentrations are compared be-ween cases and controls. A total of 11
etabolites had significantly different
al score plot.
Gynecol 2013.
oncentrations between the DS and nor-
gy MAY 2013
mal groups, whereas the differences wereof borderline significance in the case of 2metabolites. Figure 1, A and B, show 2-and 3-dimensional PCA plots. The con-tributions of the principal componentsto the variance between DS and normalgroups are shown on the X- and Y- axeson the 2-dimensional PCA plot (and Z-axis in the case of the 3-dimensionalplot). There is visual evidence of separa-tion between the 2 groups. The corre-sponding PLS-DA plots are shown inFigure 2, A and B.
Figure 3 is a VIP plot that indicatesthat 3-hydroxybutyrate, 3-hydroxy-isovalerate, and 2-hydroxybutyrate arethe most discriminating metabolites. Onthe right of the VIP plot is a heat map. Inthe trisomy 21 column, red indicates thatthe concentration of the particular me-tabolite was increased in the DS groupcompared with normal, whereas greenindicates reduced metabolite concentra-tion. As shown in Figure 3, a total of 2000permutations were performed and theseparation observed between the groupswas highly statistically significant (P �0025). Using standard regression mod-ls based on a limited number of metab-lites only as shown in Table 3, 48.1% DSetection rate was achieved at a 3.1%
alse-positive rate. Furthermore, a spec-ficity rate of 100% (0% false-positiveate) and a detection rate of 40.7% wasbserved with this particular algorithm.The screening performance when me-
abolites were combined with maternalge is also shown in Table 3. A 51.9%etection rate was achieved with just a.9% false-positive rate. The areas underhe ROC curves for the 2 approaches,
etabolites alone and metabolites plusaternal age, are shown in Table 4. In
he normal group, maternal age ap-eared to correlate with the 2-hydroxy-utyrate concentrations (r � 0.335, P �
.13). Neither 2-hydroxybutyrate nor3-hydroxyisovalerate concentrations ap-peared to significantly correlate withmaternal age in the normal group. Therewas no significant correlation betweenany of the 3 metabolite concentrationsand age in the DS group.
Direct comparisons between the eup-loid white (n � 33) and black (n � 19)
ion
stet
serum specimens did not show a signifi-

www.AJOG.org Obstetrics Research
cant difference in the concentrations ofany of the 40 metabolites (t test forequality of means, all P � .05). Similarly,there were no differences in the fre-quency of smoking, another potentialconfounder, between whites and blacks(6.1% and 5.3% respectively, P � 1.00).
Gestational age did not appear to corre-late significantly with metabolite levels.
GP was also used to develop 2 algo-rithms that were based on metabolitesonly (Table 5). Models using both theminimum (parsimonious) and an ex-panded number of metabolites wereevaluated. In Table 6, expanded screen-ing models combining metabolite, crown-rump length (CRL) measurements, andmaternal demographic characteristicswere similarly evaluated based on GP.Statistically significant diagnostic accu-racy for the detection of DS was achievedusing different biomarker combinationsincluding the metabolite-only predic-tion. Maternal race did not appear to sig-nificantly contribute to DS prediction inthe GP models (Table 6). Repeat analysisafter removal of 6 outlier specimens withunusually high concentrations of mostmetabolites resulted in alteration of theorder of the most significant discrimi-nating metabolites in the VIP plot (notshown). Among the 3 most discriminat-ing metabolites, succinate replaced 2-hy-droxybutyrate as the third most impor-tant metabolite in the VIP analysis. Theorder of some of the less discriminatingmetabolites was also slightly changed.
COMMENTIn a study using NMR-based metabolo-mics, we found significant changes in anumber of metabolites in the maternalserum during the first trimester of preg-nancies complicated with a DS fetus.Using logistic regression analysis, the de-tection rate of DS was 48.1% at a false-positive rate of less than 2%. In additionto conventional statistical analyses, mul-tivariate statistical and graphic ap-proaches designed to interpret metabo-lomic data (such as PCA and PLS-DAanalysis) confirmed significant variancebetween DS and normal cases. Furtheranalysis was performed using GP, which
is thought to have advantages over stan-dard statistical analysis (www.TheGmax.com). Based on GP using either a limitedor parsimonious algorithm or an ex-panded panel of biomarkers, metabolitesby themselves, or combined with othermarkers, were found to be significant pre-dictors of first trimester DS cases.
The finding of a profound alternationof the maternal serum metabolome inthe first trimester of DS pregnancies isnot surprising. The disturbance in tro-phoblast function leading to changes in
FIGURE 2PLS-DA plot: DS vs normal
A, Two-dimensional score plot. B, Three-dimensDS, Down syndrome; PLS-DA, partial least squares discriminant a
Bahado-Singh. Metabolomics and Down syndrome. Am J Ob
the maternal serum concentrations of
MAY 2013 Americ
glycoproteins such as hCG and PAPP-Ain addition to non–trophoblast-relatedbiochemical markers is well known.20
Combined ultrasound and biochemicalscreening forms the basis of current first-trimester DS screening protocols.11,21
An advantage of metabolomics isthat it is hypothesis generating. Thus,its deployment is not limited by alack of prior understanding of diseasepathogenesis. Rather, metabolomicdata can help to develop an under-
al score plot.sis.
Gynecol 2013.
ionnaly
stet
standing of disease mechanisms,
an Journal of Obstetrics & Gynecology 371.e5
tioscc
s2ubval
bbikDni
cwio
Research Obstetrics www.AJOG.org
whereas this is not previously knownor well understood.
Based on VIP analysis, 3-hydroxybu-tyrate, 3-hydroxyisovalerate and 2-hy-dropoxybutyrate appeared to be themost discriminating metabolites for dis-tinguishing DS cases from normal con-trols. We searched the Human Metabo-lomics Database (www.hmdb.com) toreview the function of these metabolitesin normal and/or disease states and to seewhat plausible role they might play in theDS pathology. 3-hydroxybutyrate is a ke-
FIGURE 3VIP plot
Asterisk indicates 2000 permutations performedVIP, variable importance in projection.
Bahado-Singh. Metabolomics and Down syndrome. Am J Ob
TABLE 3First-trimester Down syndrome pre
Models Se
Metabolites onlya 48...................................................................................................................
Metabolites and maternal ageb 51...................................................................................................................a 3-hydorxybuterate and 3-hydroxyisovalerate; b 3-hydroxybu
Bahado-Singh. Metabolomics and Down syndrome. Am J Obs
371.e6 American Journal of Obstetrics & Gynecolo
tone body, similar to acetoacetate andacetone. It is an indispensable source ofenergy for extrahepatic tissues such asthe brain. It is an important substrate forthe synthesis of phospholipids and sph-ingolipids that are required for braingrowth and myelination. 3-hydroxybu-yrate and other ketone bodies are utilizedn cerebroside synthesis during the periodf active myelination in the brain. Braintudies from 17 weeks to childhood haveonfirmed delayed myelination in DSompared with normal controls.22 In gen-
� .0025).
Gynecol 2013.
tion: logistic regression
tivity, % False-positive rate, %
3.1..................................................................................................................
1.9..................................................................................................................
, 3-hydroxyisovalerate, and maternal age.
tet Gynecol 2013.
gy MAY 2013
eral, decreased myelination is associatedwith mental retardation.
The compound 3-hydroxyisovalerate isa metabolite that is usually excreted inurine. Multiple enzyme deficiencies in-cluding carboxylase and biotinidase defi-ciencies result in elevated 3- hydroxy-isovalerate levels. This compound is itself awidely used biomarker for biotinidase de-ficiency. In addition, prolonged anticon-vulsant use such as phenytoin can be asso-ciated with elevation of 3-hydroxybtyrate.Biotin (vitamin B7) deficiency results fromfailure of biotin release (a biotinidase func-tion) from dietary proteins and can resultin hypotonia, learning disability, seizuredisorders, and brain atrophy,23 all of whichare features of DS.
Finally,we lookedat2-hydroxybutryate.It is an organic acid that is elevated in statesof oxidative stress. During oxidative stressthere is a limited supply of L-cysteine, thesubstrate for glutathione (antioxidant)synthesis. Under these circumstances, ho-mocysteine, which is converted to methio-nine in the remethylation pathway duringfolate metabolism, gets diverted to thetranssulfuration pathway for the synthesisof cystathionine. Cystathionine is thenconverted to cysteine by the enzyme cysta-thione �-synthase (CBS) and used for theynthesis of the antioxidant glutathione.-hydroxybutyrate is released as a byprod-ct in the cleavage of cystathionine. Meta-olic disorders affecting neonatal brain de-elopment such as lactic acidosis are oftenssociated with elevated 2-hydroxybytrateevels (www.hmdb.ca).
The association between 2-hydroxy-utyrate, oxidative stress, and single car-on metabolism is particularly interest-
ng in the context of what is currentlynown about brain dysfunction in DS.S is known to be accompanied by ab-ormalities of several enzymes involved
n folate and 1 carbon metabolism.24
CBS is overexpressed in the brains of DSpatients.25 Indeed, the CBS gene is lo-ated at 21q 22.3 (gene database:ww.ncbi.nlm.nih.gov). Oxidative stress
s thought to be 1 of the most likely causesf neurotoxicity in DS.26
Morphological abnormalities in thebrains of DS individuals generally be-come identifiable after fetal life. Obvious
(P
stet
dic
nsi
.1.........
.9.........
tyrate
morphological changes, however, ap-
trtcnliDf
asfm
Obs
Obs
Obs
www.AJOG.org Obstetrics Research
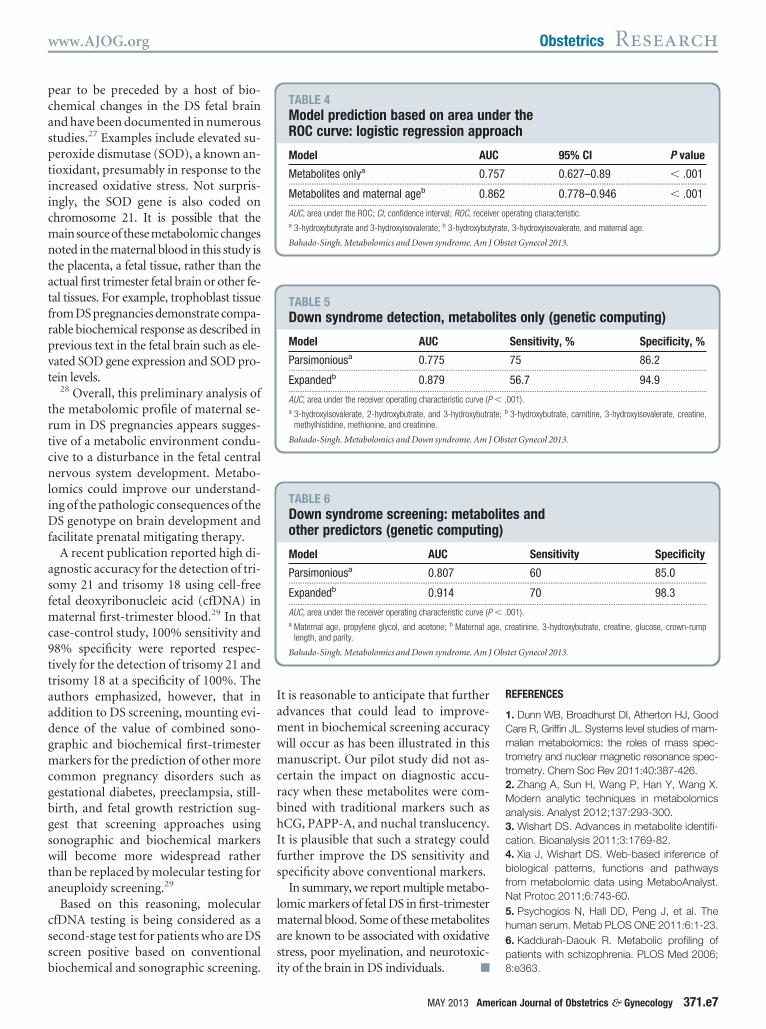
pear to be preceded by a host of bio-chemical changes in the DS fetal brainand have been documented in numerousstudies.27 Examples include elevated su-peroxide dismutase (SOD), a known an-tioxidant, presumably in response to theincreased oxidative stress. Not surpris-ingly, the SOD gene is also coded onchromosome 21. It is possible that themain source of these metabolomic changesnoted in the maternal blood in this study isthe placenta, a fetal tissue, rather than theactual first trimester fetal brain or other fe-tal tissues. For example, trophoblast tissuefrom DS pregnancies demonstrate compa-rable biochemical response as described inprevious text in the fetal brain such as ele-vated SOD gene expression and SOD pro-tein levels.
28 Overall, this preliminary analysis ofhe metabolomic profile of maternal se-um in DS pregnancies appears sugges-ive of a metabolic environment condu-ive to a disturbance in the fetal centralervous system development. Metabo-
omics could improve our understand-ng of the pathologic consequences of the
S genotype on brain development andacilitate prenatal mitigating therapy.
A recent publication reported high di-gnostic accuracy for the detection of tri-omy 21 and trisomy 18 using cell-freeetal deoxyribonucleic acid (cfDNA) in
aternal first-trimester blood.29 In thatcase-control study, 100% sensitivity and98% specificity were reported respec-tively for the detection of trisomy 21 andtrisomy 18 at a specificity of 100%. Theauthors emphasized, however, that inaddition to DS screening, mounting evi-dence of the value of combined sono-graphic and biochemical first-trimestermarkers for the prediction of other morecommon pregnancy disorders such asgestational diabetes, preeclampsia, still-birth, and fetal growth restriction sug-gest that screening approaches usingsonographic and biochemical markerswill become more widespread ratherthan be replaced by molecular testing foraneuploidy screening.29
Based on this reasoning, molecularcfDNA testing is being considered as asecond-stage test for patients who are DSscreen positive based on conventional
biochemical and sonographic screening.It is reasonable to anticipate that furtheradvances that could lead to improve-ment in biochemical screening accuracywill occur as has been illustrated in thismanuscript. Our pilot study did not as-certain the impact on diagnostic accu-racy when these metabolites were com-bined with traditional markers such ashCG, PAPP-A, and nuchal translucency.It is plausible that such a strategy couldfurther improve the DS sensitivity andspecificity above conventional markers.
In summary, we report multiple metabo-lomic markers of fetal DS in first-trimestermaternal blood. Some of these metabolitesare known to be associated with oxidativestress, poor myelination, and neurotoxic-
TABLE 4Model prediction based on area unROC curve: logistic regression app
Model AU
Metabolites onlya 0.7...................................................................................................................
Metabolites and maternal ageb 0.8...................................................................................................................
AUC, area under the ROC; CI, confidence interval; ROC, receiva 3-hydroxybutyrate and 3-hydroxyisovalerate; b 3-hydroxybut
Bahado-Singh. Metabolomics and Down syndrome. Am J
TABLE 5Down syndrome detection, metabo
Model AUC
Parsimoniousa 0.775...................................................................................................................
Expandedb 0.879...................................................................................................................
AUC, area under the receiver operating characteristic curve (Pa 3-hydroxyisovalerate, 2-hydroxybutrate, and 3-hydroxybutra
methylhistidine, methionine, and creatinine.
Bahado-Singh. Metabolomics and Down syndrome. Am J
TABLE 6Down syndrome screening: metaboother predictors (genetic computin
Model AUC
Parsimoniousa 0.807...................................................................................................................
Expandedb 0.914...................................................................................................................
AUC, area under the receiver operating characteristic curve (Pa Maternal age, propylene glycol, and acetone; b Maternal a
length, and parity.
Bahado-Singh. Metabolomics and Down syndrome. Am J
ity of the brain in DS individuals. f
MAY 2013 Americ
REFERENCES
1. Dunn WB, Broadhurst DI, Atherton HJ, GoodCare R, Griffin JL. Systems level studies of mam-malian metabolomics: the roles of mass spec-trometry and nuclear magnetic resonance spec-trometry. Chem Soc Rev 2011:40:387-426.2. Zhang A, Sun H, Wang P, Han Y, Wang X.Modern analytic techniques in metabolomicsanalysis. Analyst 2012;137:293-300.3. Wishart DS. Advances in metabolite identifi-cation. Bioanalysis 2011;3:1769-82.4. Xia J, Wishart DS. Web-based inference ofbiological patterns, functions and pathwaysfrom metabolomic data using MetaboAnalyst.Nat Protoc 2011;6:743-60.5. Psychogios N, Hall DD, Peng J, et al. Thehuman serum. Metab PLOS ONE 2011:6:1-23.6. Kaddurah-Daouk R. Metabolic profiling ofpatients with schizophrenia. PLOS Med 2006;
r thech
95% CI P value
0.627–0.89 � .001..................................................................................................................
0.778–0.946 � .001..................................................................................................................
perating characteristic.
, 3-hydroxyisovalerate, and maternal age.
tet Gynecol 2013.
s only (genetic computing)
Sensitivity, % Specificity, %
75 86.2..................................................................................................................
56.7 94.9..................................................................................................................
001).
3-hydroxybutrate, carnitine, 3-hydroxyisovalerate, creatine,
tet Gynecol 2013.
es and
Sensitivity Specificity
60 85.0..................................................................................................................
70 98.3..................................................................................................................
001).
reatinine, 3-hydroxybutrate, creatine, glucose, crown-rump
tet Gynecol 2013.
deroa
C
57.........
62.........
er o
yrate
lite
.........
.........
� .
te; b
litg)
.........
.........
� .
ge, c
8:e363.
an Journal of Obstetrics & Gynecology 371.e7

Research Obstetrics www.AJOG.org
7. Subramanian A, Gupta S, Saxena S, et al.Proton MR/CSF analysis and a new software aspredictors for the differentiation of meningitis inchildren. NMR Biomed 2005;18:213-25.8. Denkert C, Buelczies J, Weichert W, et al.Metabolite profiling of human colon carc-inoma— deregulation of TCA cycle and aminoacid turnover. Mol Cancer 2008;7:1-15.9. American Congress of Obstetricians and Gy-necologists. ACOG practice bulletin no. 77:screening for fetal chromosomal abnormalities.Obstet Gynecol 2007;109:217-27.10. National Collaborating Centre for Women’sand Children’s Health. Antenatal care: routinecare for the healthy pregnant woman. Clinicalguideline. Commissioned by the National Insti-tute for Clinical Excellence. London, UK: RoyalCollege of Obstetrics and Gynaecology Press;2008. p. 218–27.11. Nicolaides KH. Screening for fetal aneup-loidies at 11 to 13 weeks. Prenat Diagn 2011;31:7-15.12. Kagan KO, Wright D, Baker A, Sahota D,Nicolaides KH. Screening for trisomy 21 by ma-ternal age, fetal nuchal translucency thickness,free beta-human chorionic gonadotropin, andpregnancy associated plasma protein-A. Ultra-sound Obstet Gynecol 2008;31:618-24.13. Bahado-Singh RO, Akolekar R, Mandal R,et al. Metabolomics and first trimester predic-tion of early-onset preeclampsia. J Matern Fetal
Neonatal Med 2012;25:1840-7.371.e8 American Journal of Obstetrics & Gynecolo
14. Wishart DS. Computational approaches tometabolomics methods. Mol Biol 2010;593:283-313.15. Bijlsma S, Bobeldijk I, Verheij ER, et al.Large-scale human metabolomics studies: astrategy for data (pre-) processing and valida-tion. Analytic Chem 2006;78:567-74.16. Hotellin H. Analysis of a complex of statisti-cal variables into principal components. J EducPsychol 1933;24:417-41.17. Xia J, Psychogios N, Young N, Wishart DS.MetaboAnalyst: a web server from metabolo-mic data analysis and interpretation. NucleicAcids Res 2009;37:W652-60.18. Whitley D. An overview of evolutionary algo-rithms: practical issues and common pitfalls. In-form Software Technol 2001;43:817-31.19. Goodcare R. Making sense of themetabolome using evolutionary computation:seeing the wood with the trees. J Exp Botany2005;56:245-54.20. Bahado-Singh RO, Sutton-Riley J. Bio-chemical screening for congenital defects.Obstet Gynecol Clin North Am 2004;31:857-72.21. Snijders RJ, Noble P, Seibre N, Souka A,Nicolaides KH; Fetal Medicine Foundation FirstTrimester Screening Group. UK multicenterproject on assessment of risk of trisomy 21 bymaternal age and fetal nuchal-translucencythickness at 10-14 weeks of gestation. Lancet
1998;352:343-6.gy MAY 2013
22. Abraham H, Vincze A., Veszpremi B, et al.Impaired myelination of human hippocampalformation in Down syndrome. Int J Dev Neuro-science 2012;30:147-58.23. Wolf B. The neurology of biotinidase defi-ciency. Mol Genet Metab 2011;104:27-47.24. Lockstone HE, Harris LW, Swatton JE,Wayland MT, Holland AJ, Bahn S. Gene ex-pression profiling in adult Down syndromebrain. Genomics 2007;90:647-60.25. Ichinohe A, Kanaumi T, Takashima S,Enokido Y, Nagai Y, Kimura H. Cystathioninebeta-synthase is enriched in the brains ofDown’s patients. Biochem Biophys Res Com-mun 2005;338;1547-50.26. Busciglio J, Yanker B. Apoptosis and in-creased generation of active oxygen species inDown syndrome neurons in vitro. Nature1995;378: 776-9.27. Engidawork E, Lubec G J. Molecularchanges in fetal Down syndrome brain. Neuro-chem 2003;84:895-904.28. Pidoux G, Guibourdenche J, Frendo JL, etal. Impact of trisomy 21 on human trophoblastbehaviour and hormonal function. Placenta2004;25(Suppl A):S79-84.29. Ashoor G, Syngelaki A, Wagner M, Birdir C,Nicolaides KH. Chromosome-selective se-quencing of maternal plasma cell-free DNAfor first-trimester detection of trisomy 21 andtrisomy 18. Am J Obstet Gynecol 2012;206:
322.e1-5.


![Proteomic and Metabolomic Characterization of Human ...diseasebiophysics.seas.harvard.edu/wp-content/... · metabolomic[9,10] analysis of the individual compartments of a microfluidic](https://img.dokumen.tips/doc/110x75/6034f7cd36b07b58d426adf3/proteomic-and-metabolomic-characterization-of-human-metabolomic910-analysis.jpg)


![Systems Metabolomic Lecture[1]](https://img.dokumen.tips/doc/110x75/546af5e0b4af9f486b8b45b1/systems-metabolomic-lecture1.jpg)