Embed Size (px)
Citation preview

DOI: 10.1126/science.1218595, 1040 (2012);336 Science
et al.Mohit JainCell ProliferationMetabolite Profiling Identifies a Key Role for Glycine in Rapid Cancer
This copy is for your personal, non-commercial use only.
clicking here.colleagues, clients, or customers by , you can order high-quality copies for yourIf you wish to distribute this article to others
here.following the guidelines
can be obtained byPermission to republish or repurpose articles or portions of articles
): May 24, 2012 www.sciencemag.org (this information is current as of
The following resources related to this article are available online at
http://www.sciencemag.org/content/336/6084/1040.full.htmlversion of this article at:
including high-resolution figures, can be found in the onlineUpdated information and services,
http://www.sciencemag.org/content/suppl/2012/05/23/336.6084.1040.DC1.html can be found at: Supporting Online Material
http://www.sciencemag.org/content/336/6084/1040.full.html#relatedfound at:
can berelated to this article A list of selected additional articles on the Science Web sites
http://www.sciencemag.org/content/336/6084/1040.full.html#ref-list-1, 17 of which can be accessed free:cites 42 articlesThis article
http://www.sciencemag.org/content/336/6084/1040.full.html#related-urls1 articles hosted by HighWire Press; see:cited by This article has been
http://www.sciencemag.org/cgi/collection/medicineMedicine, Diseases
subject collections:This article appears in the following
registered trademark of AAAS. is aScience2012 by the American Association for the Advancement of Science; all rights reserved. The title
CopyrightAmerican Association for the Advancement of Science, 1200 New York Avenue NW, Washington, DC 20005. (print ISSN 0036-8075; online ISSN 1095-9203) is published weekly, except the last week in December, by theScience
on
May
24,
201
2w
ww
.sci
ence
mag
.org
Dow
nloa
ded
from

conformation of guide RNAs in a manner that isnot seen for guide DNAs in bacteria. Moreover,the tryptophan-binding sites in the PIWI domainform a likely interaction surface for additionalRNA-induced silencing complex components forwhich no known homologs exist in the prokary-otic kingdom. The structures presented here ex-tend studies of the prokaryotic into understandingArgonaute in humans. Bridging this gap is anessential step toward leveraging structural infor-mation for design and delivery strategies for si-lencing human disease factors using RNAi.
References and Notes1. J. Liu et al., Science 305, 1437 (2004).2. G. Meister et al., Mol. Cell 15, 185 (2004).3. I. Behm-Ansmant et al., Genes Dev. 20, 1885 (2006).4. J. E. Braun, E. Huntzinger, M. Fauser, E. Izaurralde,
Mol. Cell 44, 120 (2011).5. M. R. Fabian et al., Nat. Struct. Mol. Biol. 18, 1211
(2011).6. J. J. Song, S. K. Smith, G. J. Hannon, L. Joshua-Tor,
Science 305, 1434 (2004).7. Y. Wang et al., Nature 456, 921 (2008).8. Y. Wang et al., Nature 461, 754 (2009).
9. Y. Wang, G. Sheng, S. Juranek, T. Tuschl, D. J. Patel,Nature 456, 209 (2008).
10. Y. R. Yuan et al., Mol. Cell 19, 405 (2005).11. J. B. Ma et al., Nature 434, 666 (2005).12. J. B. Ma, K. Ye, D. J. Patel, Nature 429, 318 (2004).13. A. Lingel, B. Simon, E. Izaurralde, M. Sattler, Nature
426, 465 (2003).14. J. J. Song et al., Nat. Struct. Biol. 10, 1026 (2003).15. K. S. Yan et al., Nature 426, 468 (2003).16. A. Boland, F. Tritschler, S. Heimstädt, E. Izaurralde,
O. Weichenrieder, EMBO Rep. 11, 522 (2010).17. A. Boland, E. Huntzinger, S. Schmidt, E. Izaurralde,
O. Weichenrieder, Proc. Natl. Acad. Sci. U.S.A. 108,10466 (2011).
18. F. Frank, N. Sonenberg, B. Nagar, Nature 465, 818(2010).
19. Y. L. Chiu, T. M. Rana, RNA 9, 1034 (2003).20. G. F. Deleavey et al., Nucleic Acids Res. 38, 4547
(2010).21. D. P. Bartel, Cell 116, 281 (2004).22. B. P. Lewis, C. B. Burge, D. P. Bartel, Cell 120, 15
(2005).23. D. P. Bartel, Cell 136, 215 (2009).24. S. L. Lian et al., RNA 15, 804 (2009).25. A. Eulalio, S. Helms, C. Fritzsch, M. Fauser, E. Izaurralde,
RNA 15, 1067 (2009).26. M. El-Shami et al., Genes Dev. 21, 2539 (2007).27. N. Bies-Etheve et al., EMBO Rep. 10, 649 (2009).
28. D. Baillat, R. Shiekhattar, Mol. Cell. Biol. 29, 4144(2009).
29. S. Till et al., Nat. Struct. Mol. Biol. 14, 897 (2007).
Acknowledgments: We thank the laboratories of D. Stout,E. O. Saphire, and I. Wilson for sharing synchrotron timeand for helpful discussions. Crystallization screens werecarried out at the Joint Center for Structural Genomics,supported by the National Institute of General MedicalSciences (NIGMS) Protein Structure Initiative (U54 GM074898).Diffraction data were collected on beamlines 24-ID-E at theAdvanced Photon Source and 11-1 at the Stanford SynchrotronRadiation Lightsource. This work was supported by NIGMS grantR01 GM086701 to I.J.M. I.J.M. is a Pew Scholar in theBiomedical Sciences. Coordinates of Ago2 and Ago2 boundto tryptophan have been deposited in the Protein Data Bank(4EI1 and 4EI3).
Supplementary Materialswww.sciencemag.org/cgi/content/full/science.1221551/DC1Materials and MethodsFigs. S1 to S15Tables S1 and S2References (30–38)
6 March 2012; accepted 17 April 2012Published online 26 April 2012;10.1126/science.1221551
Metabolite Profiling Identifies a KeyRole for Glycine in Rapid CancerCell ProliferationMohit Jain,1,2,3,4* Roland Nilsson,1,2,3,5* Sonia Sharma,6 Nikhil Madhusudhan,1,2,3
Toshimori Kitami,1,2,3 Amanda L. Souza,1 Ran Kafri,2 Marc W. Kirschner,2
Clary B. Clish,1 Vamsi K. Mootha1,2,3†
Metabolic reprogramming has been proposed to be a hallmark of cancer, yet a systematiccharacterization of the metabolic pathways active in transformed cells is currently lacking. Usingmass spectrometry, we measured the consumption and release (CORE) profiles of 219 metabolitesfrom media across the NCI-60 cancer cell lines, and integrated these data with a preexisting atlasof gene expression. This analysis identified glycine consumption and expression of themitochondrial glycine biosynthetic pathway as strongly correlated with rates of proliferation acrosscancer cells. Antagonizing glycine uptake and its mitochondrial biosynthesis preferentiallyimpaired rapidly proliferating cells. Moreover, higher expression of this pathway was associatedwith greater mortality in breast cancer patients. Increased reliance on glycine may represent ametabolic vulnerability for selectively targeting rapid cancer cell proliferation.
Malignant transformation results frommutations that alter cellular physiol-ogy to confer a proliferative advan-
tage (1, 2). Despite the genetic heterogeneity andcomplexity of cancer (3), transformed cells ex-
hibit a limited number of proposed commonhallmarks, including metabolic reprogramming,which manifests as altered nutrient uptake anduse (2, 4). Although metabolic reprogramming isthought to be essential for rapid cancer cellproliferation, a systematic characterization of themetabolic pathways active in transformed cellsis lacking, and the contribution of these path-ways in promoting rapid cancer cell prolifera-tion remains unclear (4). Existing studies ofcancer metabolism have examined relativelyfew cell lines, and have largely focused on themeasurement of intracellular metabolite pools(5)—from which it is difficult to infer metabolicpathway activity—or have relied on isotope trac-ing to estimate metabolic flux through a limitednumber of reactions (6).
To systematically characterize cancer cell me-tabolism, we used liquid chromatography–tandemmass spectrometry (LC-MS/MS) to create cel-lular consumption and release (CORE) profilesof 219 metabolites (table S1) spanning themajor pathways of intermediary metabolism,in the NCI-60 panel, a collection of 60 well-characterized primary human cancer cell linesestablished from nine common tumor types (7).CORE profiling builds on metabolic footprint-ing or exometabolomics (8, 9), and provides asystematic and quantitative assessment of cellularmetabolic activity by relating metabolite concen-trations in spent medium from cultured cells tometabolite concentrations in baseline medium,resulting in a time-averaged CORE profile foreach metabolite on a per-cell basis over a periodof exponential growth (Fig. 1). Using COREprofiling, we identified 140 metabolites that wereeither present in fresh medium or released by atleast one cancer cell line, of which 111 metabo-lites demonstrated appreciable variation acrossthe 60 cell lines, with excellent reproducibilitybetween biological replicates (Fig. 2). Aboutone-third of the 111 metabolites were consumedby all cell lines, whereas most of the remainingtwo-thirds of metabolites were consistentlyreleased into the medium; only a handful ofmetabolites exhibited consumption in certain celllines and release by others (Fig. 2). A larger, fullyannotated version of Fig. 2 is provided in fig. S1.
This CORE atlas of cancer metabolism (Fig.2 and fig. S1) can be used to explore metabolicphenotypes of cancer cells and to discover re-lationships between metabolites. For example,ornithine was released from leukemia cells, andadenosine and inosine were released from mel-anoma cells (fig. S2), reflecting metabolic ac-tivities that may be unique to these cancers.Unsupervised cluster analysis of metabolite
1Broad Institute, Cambridge, MA 02142, USA. 2Department ofSystems Biology, Harvard Medical School, Boston, MA 02115,USA. 3Center for Human Genetic Research and Department ofMolecular Biology, Massachusetts General Hospital, Boston, MA02114,USA. 4Division of CardiovascularMedicine,Department ofMedicine, Brigham and Women’s Hospital, Boston, MA 02115,USA. 5Unit of Computational Medicine, Department of Medicine,Karolinska Institutet, 17176 Stockholm, Sweden. 6La Jolla In-stitute for Allergy & Immunology, La Jolla, CA 92037, USA.
*These authors contributed equally to this work.†To whom correspondence should be addressed. E-mail:[email protected]
25 MAY 2012 VOL 336 SCIENCE www.sciencemag.org1040
REPORTS
on
May
24,
201
2w
ww
.sci
ence
mag
.org
Dow
nloa
ded
from

CORE data identified leukemia cells as a distinctgroup but did not more generally distinguish be-tween tumor cell lines according to tissue oforigin (fig. S3). Functionally related metabolitesdemonstrated similar patterns of consumptionand release across the 60 cell lines. For example,major nutrients including glucose, essential ami-no acids, and choline formed a single cluster, asdid metabolites representing glycolysis, the citricacid cycle, nucleotides, and polyamines (Fig. 2and fig. S1). Consumption of major nutrients alsocorrelated with release of their by-products; forexample, glucose consumption correlated to lac-tate release (Fig. 1B), consistent with the well-documented Warburg effect in transformed cells(4). A similar pattern of nutrient consumption andby-product release was also observed with othernutrients. Glutamine consumption, quantitativelythe greatest among amino acids, was closely mir-rored by glutamate release (Fig. 1B). An analysisof all monitored metabolites revealed that totalmeasured carbon consumption was also closelycorrelated with total measured carbon release(Fig. 1B), which suggests that transformed cellsshare a common metabolic phenotype: incom-plete catabolism of major nutrients followed byrelease of by-products.
We next sought to determine whether any me-tabolite CORE profiles were associated with can-cer cell proliferation. Previously reported doublingtimes across the 60 cancer cell lines ranged from17.0 to 79.5 hours and were highly reproducible(10) (fig. S4). From the 111 metabolite COREprofiles, two metabolites—phosphocholine andglycine—were significantly correlated (Bonferroni-corrected P < 0.01) with proliferation rate acrossthe 60 cell lines (Fig. 3A). Phosphocholine, whichwas released from all cells, correlated with con-sumption of the essential nutrient choline (fig.S5) and has been reported to accumulate intransformed cells as a substrate for phospholipidbiosynthesis (11). In contrast, the relation betweenglycine consumption and proliferation rate was un-anticipated, because glycine is a non-essential ami-no acid that can be endogenously synthesized.Glycine exhibited an unusual COREprofile, beingconsumed by rapidly proliferating cells andreleased by slowly proliferating cells (Fig. 3B),which suggests that glycine demand may exceedendogenous synthesis capacity in rapidly prolifer-ating cancer cells, whereas in slowly proliferatingcells, glycine synthesis may exceed demand. In-creasing glycine consumption with faster prolifer-ation rate was observed across all 60 cell lines(Fig. 3B) and was even more pronounced withinspecific tumor types, including ovarian, colon, andmelanoma cells (Fig. 3B and fig. S6), but was notevident in nonadherent leukemia cells (fig. S6).
To determine whether glycine consumption isspecific to transformed cells or a general featureof rapid proliferation, we measured glycine con-sumption in cultured primary human mammaryepithelial cells (HMECs), human bronchialepithelial (HBE) cells, human umbilical vein en-dothelial cells (HUVECs), and human activated
CD4+ T lymphocytes. These nontransformed cellshad doubling times between 8 and 18 hours, com-parable to the most rapidly dividing cancercells, yet each of these cell types released ratherthan consumed glycine (HMECs, 3.5 T 0.8fmol cell–1 hour–1; HBE cells, 17.5 T 3.2 fmolcell–1 hour–1; HUVECs, 8.4 T 1.4 fmol cell–1 hour–1;lymphocytes, 1.9 T 0.3 fmol cell–1 hour–1). Thus,glycine consumption appears to be a feature spe-cific to rapidly proliferating transformed cells.
To complement the metabolite CORE anal-ysis, we next examined the gene expression of1425 metabolic enzymes (12) in a previouslygenerated microarray data set across these 60 celllines (13). This independent analysis revealedthat glycine biosynthesis enzymes are more high-ly expressed in rapidly proliferating cancer celllines (Fig. 3C). Intracellular glycine synthesisis compartmentalized between the cytosol andmitochondria (14), providing two separate enzy-matic pathways (Fig. 3D). The mitochondrialglycine synthesis pathway consists of the glycine-synthesizing enzyme serine hydroxymethyltrans-ferase 2 (SHMT2), a target of the oncogenec-Myc (15), as well as MTHFD2 and MTHFD1L,which regenerate the cofactor tetrahydrofolate(THF) for the SHMT2 reaction (Fig. 3D). Themitochondrial pathway exhibited significant cor-relationwith proliferation, whereas the correspondingcytosolic enzymes did not (Fig. 3C), which sug-gests a key role for mitochondria in supportingrapid cancer cell proliferation. To assess the rel-ative contributions of glycine consumption andendogenous synthesis to intracellular glycine pools,we used tracer analysis with (13C)glycine in rap-
idly dividing LOX IMVI cells. Assuming a sim-ple steady-state model (13), we estimate fromlabeling of intracellular glycine and serine pools(Fig. 3E) that about one-third of intracellularglycine originates from extracellular consump-tion, whereas the remainder is synthesized en-dogenously. Thus, both metabolite CORE profilingand gene expression analysis independently iden-tify glycinemetabolism as closely related to rapidproliferation in cancer cells.
To directly evaluate the contribution ofglycine metabolism to rapid cancer cell prolifer-ation, we used a combination of genetic silencingand nutrient deprivation. We stably silenced ex-pression of the glycine-synthesizing enzymeSHMT2in slowly proliferating A498 cells and in rapidlyproliferating LOX IMVI cells (Fig. 3B) with fourdistinct short hairpin RNA (shRNA) sequences(fig. S7A). Chinese hamster ovary cell strainsmutant in SHMT2 were previously shown to beauxotrophic for glycine (16). Silencing of SHMT2in the absence of extracellular glycine halted theproliferation of LOX IMVI cells (Fig. 3F) andwasrescued by the addition of glycine to the medi-um; this indicates that glycine itself, rather thanone-carbon units derived from the SHMT2 re-action (Fig. 3D), is critical to proliferation inthese cells (Fig. 3F). Supplementation of medi-um with sarcosine, a glycine-related metabolite(17), or formate, a source of cellular one-carbonunits (18), failed to rescue LOX IMVI cells (fig.S7B). In contrast, slowly proliferating A498cells (Fig. 3F) were not impaired by SHMT2depletion and extracellular glycine deprivation,indicating that other means of glycine synthe-
B
A
Lac
tate
rel
ease
Glu
tam
ate
rele
ase
Glucose uptake(fmol cell-1 hour -1)
Measured carbon uptake(pmol cell-1 hour -1)
Mea
sure
d ca
rbon
rel
ease
Glutamine uptake(fmol cell-1 hour -1)
400 800
1:1 1:1 1:1
400
800
1200
100 200 300
20
40
60
80
1
1
2
2
3
3
4
4
5 6 7
(fm
ol c
ell-1
hou
r-1 )
(fm
ol c
ell-1
hou
r-1 )
(pm
ol c
ell-1
hou
r-1
)
Fig. 1. CORE profiling. (A) For determining metabolite CORE (consumption and release) profiles, mediumsamples taken before (fresh) and after (spent) 4 to 5 days of cell culture are subjected to metaboliteprofiling by LC-MS/MS. For each metabolite X, the CORE value is calculated as the difference in molarabundance normalized to the area A under the growth curve. (B) Glucose consumption versus lactaterelease, glutamine consumption versus glutamate release, and total measured carbon consumption versustotal measured carbon release across the 60 cell lines. Gray lines indicate the 1:1 molar ratio (carbonconsumed/carbon released) for each metabolite pair; joined data points represent biological replicates.
www.sciencemag.org SCIENCE VOL 336 25 MAY 2012 1041
REPORTS
on
May
24,
201
2w
ww
.sci
ence
mag
.org
Dow
nloa
ded
from

sis can satisfy the requirements in these cells.Withdrawal of extracellular glycine alone alsoreduced the proliferation of LOX IMVI cells butnot A498 cells (fig. S8), although this effect wasmore subtle. Collectively, our data suggest thatmitochondrial production of glycine is criticalspecifically in rapidly proliferating cancer cells.To determine whether this reliance on glycinefor rapid proliferation extends to other cancercells, we tested silencing of SHMT2 (fig. S7C)and extracellular glycine deprivation in 10 ad-ditional primary cancer cell lines from the NCI-60panel (Fig. 3G). Rapidly proliferating cancercells exhibited slower proliferation with antago-nism of glycine metabolism and were rescuedwith addition of extracellular glycine, whereasslowly proliferating cells were less sensitive tothese perturbations (Fig. 3G), even when as-sessed at later time points to allow for a com-parable number of cellular divisions relative torapidly proliferating cells (fig. S9).
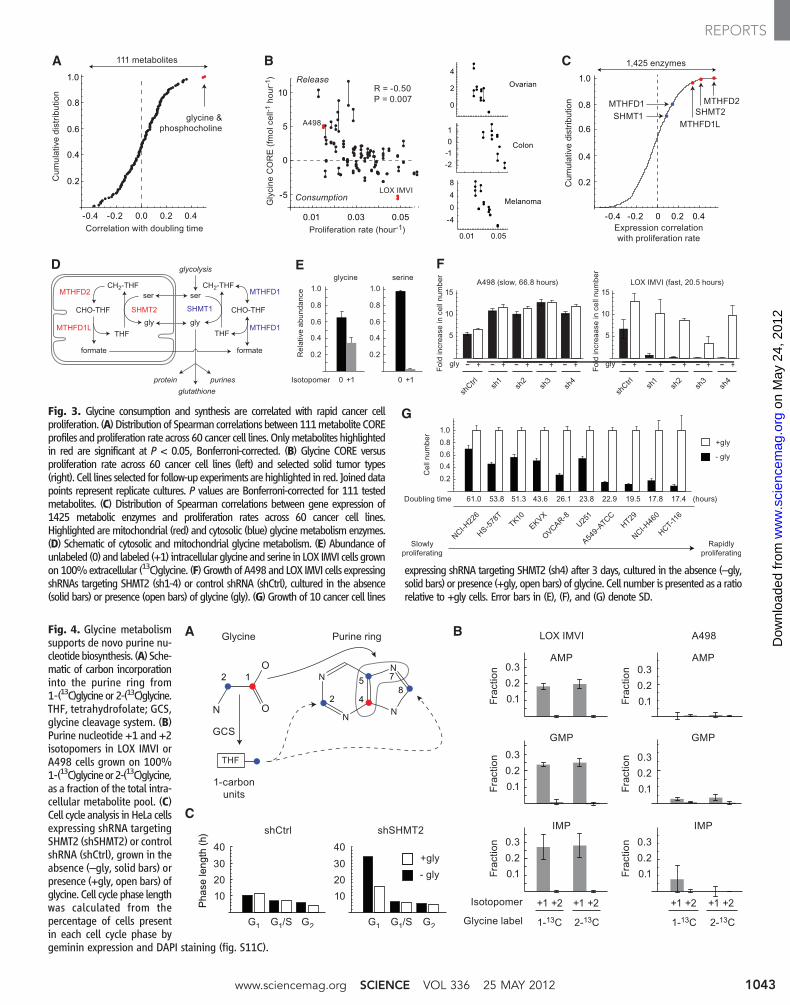
We next sought to explore the potentialmechanisms by which glycine metabolism con-tributes to rapid cancer cell proliferation. Meta-bolic tracing with (13C)glycine revealed thatconsumed glycine was incorporated into purinenucleotides in rapidly proliferating LOX IMVIcells, but less so in slowly proliferating A498cells (Fig. 4, A and B), which suggests that con-sumed glycine in part supports de novo purinesynthesis in these cells. We also noted the in-corporation of labeled glycine into cellularglutathione (fig. S10A). Analysis of previouslyperformed large-scale chemosensitivity profilingacross the 60 cancer cell lines (7) revealed thatsensitivity to an inhibitor of glutathione synthe-sis, buthionine sulfoximine (19), was unrelated toproliferation rate (fig. S10B), whereas sensitivityto inhibitors of de novo purine biosynthesis—mycophenolate, tiazofurin, and alanosine (20)—was highly correlatedwith proliferation rate acrossthe cell lines (fig. S10C). The use of glycine forde novo purine biosynthesis can occur by twomechanisms: direct incorporation into the pu-rine backbone, or further oxidation by the glycinecleavage system (GCS) to yield one-carbon unitsfor nucleotide synthesis and cellular methyla-tion reactions (Fig. 4A). Because only carbon 2of glycine is converted into one-carbon units bythe GCS (Fig. 4A), we cultured LOX cells in1-(13C)glycine or 2-(13C)glycine to differentiatebetween these two mechanisms (21). Consumed2-(13C)glycine did not give rise to doubly labeledpurines (Fig. 4B), which indicates that the incor-poration of consumed glycine into purine nucleo-tides does not involve oxidation by the GCS.
To better characterize the impact of glycinedeprivation on cell cycle progression, we per-formed cell cycle analysis in HeLa cancer cellsexpressing a geminin–green fluorescent proteinreporter and stained with DAPI (4´,6-diamidino-2-phenylindole). Silencing of SHMT2 (fig. S11A)and deprivation of extracellular glycine slowedproliferation in HeLa cells (fig. S11B), similar toother fast-proliferating cancer cells (Fig. 3G), and
resulted in prolongation of the G1 phase of thecell cycle (Fig. 4C and fig. S11C), whereasprotein synthesis remained relatively intact (fig.S11D), consistent with a defect in nucleotidebiosynthesis (20). Collectively, these results sug-
gest that consumed glycine is used in part for denovo purine nucleotide biosynthesis in rapidlyproliferating cells, and that antagonism of glycinemetabolism results in prolongation of the G1
phase, thus slowing proliferation.
Fig. 2. CORE profilingacross the NCI-60 cell lines.Hierarchical clustering ofCORE profiles for 111 me-tabolites across 60 cancercell lines in duplicate cul-tures, are shown; blue col-or indicates consumption,white indicates no change,and red color indicates re-lease. Gray highlights in-dicate functionally relatedmetabolites. In three rows,metabolites that cannot bedistinguished are separatedby slashes. Glycerol_1 andglycerol_2 represent inde-pendentLC-MS/MSmeasures.
25 MAY 2012 VOL 336 SCIENCE www.sciencemag.org1042
REPORTS
on
May
24,
201
2w
ww
.sci
ence
mag
.org
Dow
nloa
ded
from
A B C
D E F
G
Proliferation rate (hour-1)
Gly
cine
CO
RE
(fm
ol c
ell-1
hou
r-1 )
Fig. 3. Glycine consumption and synthesis are correlated with rapid cancer cellproliferation. (A) Distributionof Spearmancorrelations between111metabolite COREprofiles andproliferation rate across 60 cancer cell lines. Onlymetabolites highlightedin red are significant at P < 0.05, Bonferroni-corrected. (B) Glycine CORE versusproliferation rate across 60 cancer cell lines (left) and selected solid tumor types(right). Cell lines selected for follow-up experiments arehighlighted in red. Joineddatapoints represent replicate cultures. P values are Bonferroni-corrected for 111 testedmetabolites. (C) Distribution of Spearman correlations between gene expression of1425 metabolic enzymes and proliferation rates across 60 cancer cell lines.Highlighted aremitochondrial (red) and cytosolic (blue) glycinemetabolism enzymes.(D) Schematic of cytosolic and mitochondrial glycine metabolism. (E) Abundance ofunlabeled (0) and labeled (+1) intracellular glycine and serine in LOX IMVI cells grownon100%extracellular (13C)glycine. (F) Growth of A498and LOX IMVI cells expressingshRNAs targeting SHMT2 (sh1-4) or control shRNA (shCtrl), cultured in the absence(solid bars) or presence (open bars) of glycine (gly). (G) Growth of 10 cancer cell lines
expressing shRNA targeting SHMT2 (sh4) after 3 days, cultured in the absence (–gly,solid bars) or presence (+gly, openbars) of glycine. Cell number is presented as a ratiorelative to +gly cells. Error bars in (E), (F), and (G) denote SD.
Fig. 4. Glycine metabolismsupports de novo purine nu-cleotidebiosynthesis. (A) Sche-matic of carbon incorporationinto the purine ring from1-(13C)glycine or 2‑(13C)glycine.THF, tetrahydrofolate; GCS,glycine cleavage system. (B)Purine nucleotide +1 and +2isotopomers in LOX IMVI orA498 cells grown on 100%1-(13C)glycineor2-(13C)glycine,as a fraction of the total intra-cellular metabolite pool. (C)Cell cycle analysis in HeLa cellsexpressing shRNA targetingSHMT2 (shSHMT2) or controlshRNA (shCtrl), grown in theabsence (–gly, solid bars) orpresence (+gly, open bars) ofglycine. Cell cycle phase lengthwas calculated from thepercentage of cells presentin each cell cycle phase bygeminin expression and DAPI staining (fig. S11C).
www.sciencemag.org SCIENCE VOL 336 25 MAY 2012 1043
REPORTS
on
May
24,
201
2w
ww
.sci
ence
mag
.org
Dow
nloa
ded
from
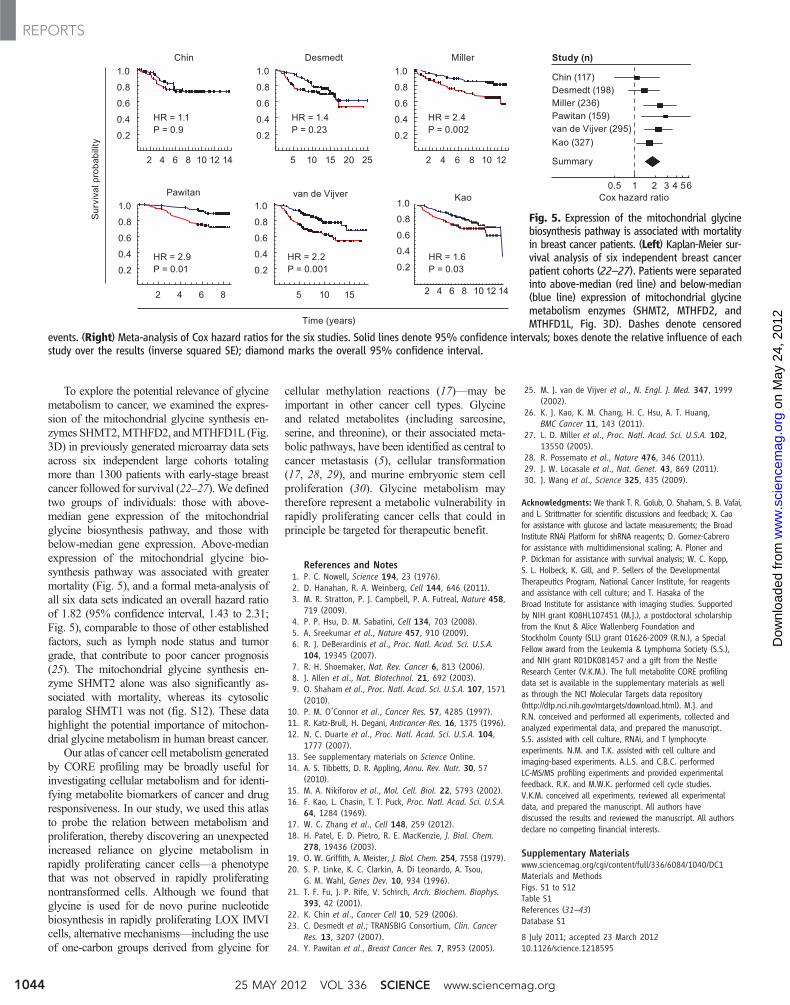
To explore the potential relevance of glycinemetabolism to cancer, we examined the expres-sion of the mitochondrial glycine synthesis en-zymes SHMT2,MTHFD2, andMTHFD1L (Fig.3D) in previously generated microarray data setsacross six independent large cohorts totalingmore than 1300 patients with early-stage breastcancer followed for survival (22–27). We definedtwo groups of individuals: those with above-median gene expression of the mitochondrialglycine biosynthesis pathway, and those withbelow-median gene expression. Above-medianexpression of the mitochondrial glycine bio-synthesis pathway was associated with greatermortality (Fig. 5), and a formal meta-analysis ofall six data sets indicated an overall hazard ratioof 1.82 (95% confidence interval, 1.43 to 2.31;Fig. 5), comparable to those of other establishedfactors, such as lymph node status and tumorgrade, that contribute to poor cancer prognosis(25). The mitochondrial glycine synthesis en-zyme SHMT2 alone was also significantly as-sociated with mortality, whereas its cytosolicparalog SHMT1 was not (fig. S12). These datahighlight the potential importance of mitochon-drial glycine metabolism in human breast cancer.
Our atlas of cancer cell metabolism generatedby CORE profiling may be broadly useful forinvestigating cellular metabolism and for identi-fying metabolite biomarkers of cancer and drugresponsiveness. In our study, we used this atlasto probe the relation between metabolism andproliferation, thereby discovering an unexpectedincreased reliance on glycine metabolism inrapidly proliferating cancer cells—a phenotypethat was not observed in rapidly proliferatingnontransformed cells. Although we found thatglycine is used for de novo purine nucleotidebiosynthesis in rapidly proliferating LOX IMVIcells, alternative mechanisms—including the useof one-carbon groups derived from glycine for
cellular methylation reactions (17)—may beimportant in other cancer cell types. Glycineand related metabolites (including sarcosine,serine, and threonine), or their associated meta-bolic pathways, have been identified as central tocancer metastasis (5), cellular transformation(17, 28, 29), and murine embryonic stem cellproliferation (30). Glycine metabolism maytherefore represent a metabolic vulnerability inrapidly proliferating cancer cells that could inprinciple be targeted for therapeutic benefit.
References and Notes1. P. C. Nowell, Science 194, 23 (1976).2. D. Hanahan, R. A. Weinberg, Cell 144, 646 (2011).3. M. R. Stratton, P. J. Campbell, P. A. Futreal, Nature 458,
719 (2009).4. P. P. Hsu, D. M. Sabatini, Cell 134, 703 (2008).5. A. Sreekumar et al., Nature 457, 910 (2009).6. R. J. DeBerardinis et al., Proc. Natl. Acad. Sci. U.S.A.
104, 19345 (2007).7. R. H. Shoemaker, Nat. Rev. Cancer 6, 813 (2006).8. J. Allen et al., Nat. Biotechnol. 21, 692 (2003).9. O. Shaham et al., Proc. Natl. Acad. Sci. U.S.A. 107, 1571
(2010).10. P. M. O’Connor et al., Cancer Res. 57, 4285 (1997).11. R. Katz-Brull, H. Degani, Anticancer Res. 16, 1375 (1996).12. N. C. Duarte et al., Proc. Natl. Acad. Sci. U.S.A. 104,
1777 (2007).13. See supplementary materials on Science Online.14. A. S. Tibbetts, D. R. Appling, Annu. Rev. Nutr. 30, 57
(2010).15. M. A. Nikiforov et al., Mol. Cell. Biol. 22, 5793 (2002).16. F. Kao, L. Chasin, T. T. Puck, Proc. Natl. Acad. Sci. U.S.A.
64, 1284 (1969).17. W. C. Zhang et al., Cell 148, 259 (2012).18. H. Patel, E. D. Pietro, R. E. MacKenzie, J. Biol. Chem.
278, 19436 (2003).19. O. W. Griffith, A. Meister, J. Biol. Chem. 254, 7558 (1979).20. S. P. Linke, K. C. Clarkin, A. Di Leonardo, A. Tsou,
G. M. Wahl, Genes Dev. 10, 934 (1996).21. T. F. Fu, J. P. Rife, V. Schirch, Arch. Biochem. Biophys.
393, 42 (2001).22. K. Chin et al., Cancer Cell 10, 529 (2006).23. C. Desmedt et al.; TRANSBIG Consortium, Clin. Cancer
Res. 13, 3207 (2007).24. Y. Pawitan et al., Breast Cancer Res. 7, R953 (2005).
25. M. J. van de Vijver et al., N. Engl. J. Med. 347, 1999(2002).
26. K. J. Kao, K. M. Chang, H. C. Hsu, A. T. Huang,BMC Cancer 11, 143 (2011).
27. L. D. Miller et al., Proc. Natl. Acad. Sci. U.S.A. 102,13550 (2005).
28. R. Possemato et al., Nature 476, 346 (2011).29. J. W. Locasale et al., Nat. Genet. 43, 869 (2011).30. J. Wang et al., Science 325, 435 (2009).
Acknowledgments: We thank T. R. Golub, O. Shaham, S. B. Vafai,and L. Strittmatter for scientific discussions and feedback; X. Caofor assistance with glucose and lactate measurements; the BroadInstitute RNAi Platform for shRNA reagents; D. Gomez-Cabrerofor assistance with multidimensional scaling; A. Ploner andP. Dickman for assistance with survival analysis; W. C. Kopp,S. L. Holbeck, K. Gill, and P. Sellers of the DevelopmentalTherapeutics Program, National Cancer Institute, for reagentsand assistance with cell culture; and T. Hasaka of theBroad Institute for assistance with imaging studies. Supportedby NIH grant K08HL107451 (M.J.), a postdoctoral scholarshipfrom the Knut & Alice Wallenberg Foundation andStockholm County (SLL) grant 01626-2009 (R.N.), a SpecialFellow award from the Leukemia & Lymphoma Society (S.S.),and NIH grant R01DK081457 and a gift from the NestleResearch Center (V.K.M.). The full metabolite CORE profilingdata set is available in the supplementary materials as wellas through the NCI Molecular Targets data repository(http://dtp.nci.nih.gov/mtargets/download.html). M.J. andR.N. conceived and performed all experiments, collected andanalyzed experimental data, and prepared the manuscript.S.S. assisted with cell culture, RNAi, and T lymphocyteexperiments. N.M. and T.K. assisted with cell culture andimaging-based experiments. A.L.S. and C.B.C. performedLC-MS/MS profiling experiments and provided experimentalfeedback. R.K. and M.W.K. performed cell cycle studies.V.K.M. conceived all experiments, reviewed all experimentaldata, and prepared the manuscript. All authors havediscussed the results and reviewed the manuscript. All authorsdeclare no competing financial interests.
Supplementary Materialswww.sciencemag.org/cgi/content/full/336/6084/1040/DC1Materials and MethodsFigs. S1 to S12Table S1References (31–43)Database S1
8 July 2011; accepted 23 March 201210.1126/science.1218595
Fig. 5. Expression of the mitochondrial glycinebiosynthesis pathway is associated with mortalityin breast cancer patients. (Left) Kaplan-Meier sur-vival analysis of six independent breast cancerpatient cohorts (22–27). Patients were separatedinto above-median (red line) and below-median(blue line) expression of mitochondrial glycinemetabolism enzymes (SHMT2, MTHFD2, andMTHFD1L, Fig. 3D). Dashes denote censored
events. (Right) Meta-analysis of Cox hazard ratios for the six studies. Solid lines denote 95% confidence intervals; boxes denote the relative influence of eachstudy over the results (inverse squared SE); diamond marks the overall 95% confidence interval.
25 MAY 2012 VOL 336 SCIENCE www.sciencemag.org1044
REPORTS
on
May
24,
201
2w
ww
.sci
ence
mag
.org
Dow
nloa
ded
from


![SOYBEAN [GLYCINE MAX (L.) MERRILL] EMBRYOGENIC …parrottlab.uga.edu/parrottlab/Publications/Samoylovetal1998a.pdf · 22.6 and 4.5.2 !!M 2,4-D. Proliferation of cultures in FN medium](https://img.dokumen.tips/doc/110x75/5fbd2e44d821a84902074022/soybean-glycine-max-l-merrill-embryogenic-226-and-452-m-24-d-proliferation.jpg)