Embed Size (px)
Citation preview


MESSAGE FROM THE MINISTER
Budget 2015 is taking a measured approach to dealing with the fiscal realities facing Newfoundland and Labrador. The Provincial Government recognizes that the decline in oil prices has placed a great strain on our revenues and we need to adjust our course to meet this new reality head-on.
Newfoundland and Labrador has seen significant economic growth over the past 10 years. We have come a very long way and we have a great story of progress to build upon. We will continue to protect the progress we have made and lay the groundwork that will allow us to continue to grow.
We are doing that through reducing expenditures in a manner that is responsible and in a way that ensures we maintain the stability of our economy. This approach is helping us create a path that will lead Newfoundland and Labrador to a great future that harnesses our economic prospects.
Through Budget 2015, we will continue to invest in infrastructure, we will continue to invest in health and in education. We are mapping out the actions needed to return this province to surplus, while at the same time continuing to make prudent investments in key areas.
The situation we find ourselves in now is a temporary one – caused by a global downturn in oil. We are managing our way through, but prudent fiscal management demands gradual change to avoid harming the province’s economic system. Newfoundland and Labrador will make a full recovery from the fiscal challenges now being faced.
The Honourable Ross WisemanMinister of FinancePresident of Treasury BoardTrinity North, MHA

- 1-
HIGHLIGHTS
The Government of Newfoundland and Labrador is taking a fair, measured approach to protecting the significant progress Newfoundland and Labrador has made over the last decade.
Through Budget 2015, the Provincial Government is allocating a total of approximately $8.1 billion in expenditures.
The deficit for 2014-15, projected at mid-year to be $916.1 million, is now revised to $924.1 million - a result of declining oil prices globally. The budgeted deficit for 2015-16 is $1.093 billion.
Budget 2015 outlines a Five-Year Fiscal Recovery Plan to return the province to surplus in 2020-21. This will be achieved through a series of measures, including an attrition management plan, necessary expenditure reductions and revenue generation through increased taxes and fees.
As a result of the revised projections due to deteriorating revenue, strategic investments in Nalcor and infrastructure spending and the expressed interest of Newfoundlanders and Labradorians to maintain strong public services, the Provincial Government will borrow $2 billion this year.
Budget 2015 includes nearly $3 billion for the health and well-being of families, $1.4 billion for K-12 and post-secondary education, and more than $660 million for infrastructure projects that will support economic activity and job creation.
Newfoundland and Labrador will maintain a competitive overall tax regime with the lowest personal income tax rates in Atlantic Canada and the third lowest top marginal rate in Canada, behind Alberta and Saskatchewan.
After 10 years of significant growth, economic conditions in Newfoundland and Labrador have weakened but are expected to rebound by 2019.
The tremendous potential of Newfoundland and Labrador’s offshore oil resources also bodes well for the economic future of the province.
Where the Money Comes From 2015-16 Revenue by Source ($000)
Where the Money Goes 2015-16 Expenses by Sector ($000)
Projected Surplus/(Deficit) ($ Millions)

- 2-
Consolidated Surplus / (Deficit), ($Millions)
2014-15Forecast
2015-16Budget
2016-17 Target
2017-18 Target
2018-19 Target
2019-20 Target
2020-21 Target
Gross Revenue 6,965 6,976 7,480 7,836 8,245 8,501 8,627
Program Expenses 7,082 7,181 7,418 7,328 7,423 7,493 7,538Debt Servicing Expenses 807 888 951 997 1,018 1,005 1,002
Surplus / (Deficit) (924) (1,093) (889) (490) (195) 3 87
Fiscal Targets
Fiscal Year Ending
March 31st
Indicators: Fiscal Targets:1. Return to Surplus by 2020-21
Net Debt ($M)
GDP1 ($M)
2. Deficit as a % of GDP
Not to Exceed 3%
3. Net Debt as a % of GDP
Not to Exceed 40%
4. Debt Expense as a % of Revenue
Not to Exceed 13%
5. Cumulative Net New Borrowings ($B)
Not to Exceed $5B
2016f 11,528 32,921 3.3% 35.0% 12.7% 1.922017f 12,488 34,611 2.6% 36.1% 12.7% 3.202018f 13,049 35,045 1.4% 37.2% 12.7% 4.232019f 13,233 35,971 0.5% 36.8% 12.3% 4.562020f 13,137 38,313 0.0% 34.3% 11.8% 4.452021f 13,104 41,342 - 31.7% 11.6% 4.13 1 Nominal GDP ($million) as at December 31st of the previous calendar year.
The five-year budget outlook shows moderate growth in gross expenses combined with gradual recovery of the resource-based revenues, to achieve a target of a bal-anced budget and return to surplus in 2020-21.
The plan’s underlying assumptions and performance targets reflect advice gathered from reports from the Auditor General and bond rating agencies, discussions with various economists and pre-budget consultations.
Further savings will be achieved through attrition, improved cost management, operational improvements, and transforming public service delivery through strategic partnering and technological advances.
FISCAL PERFORMANCE TARGETS
Debt expenses as a % of gross revenue will not exceed 13%
Net debt as a % of nominal GDP will not exceed 40%
Annual deficit will not exceed 3% of nominal GDP Return to surplus by 2020-21 New borrowings not to exceed $5 billion
WAY FORWARD: A FIVE-YEAR PLAN FOR FISCAL RECOVERY
- 3-
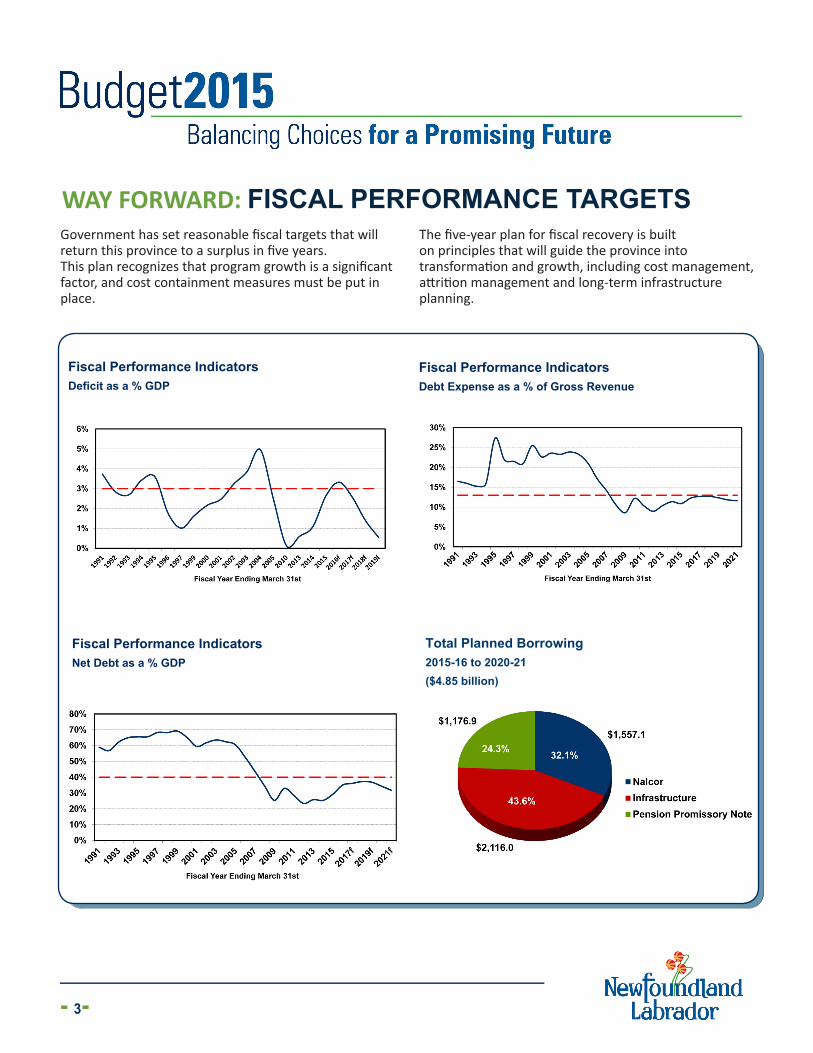
Fiscal Performance Indicators Net Debt as a % GDP
Total Planned Borrowing 2015-16 to 2020-21 ($4.85 billion)
Fiscal Performance Indicators Deficit as a % GDP
Fiscal Performance IndicatorsDebt Expense as a % of Gross Revenue
WAY FORWARD: FISCAL PERFORMANCE TARGETSGovernment has set reasonable fiscal targets that will return this province to a surplus in five years. This plan recognizes that program growth is a significant factor, and cost containment measures must be put in place.
The five-year plan for fiscal recovery is built on principles that will guide the province into transformation and growth, including cost management, attrition management and long-term infrastructure planning.

- 4-
The Provincial Government continues to invest significantly in infrastructure – Budget 2015 includes a $660 million infrastructure program that will create long-term prosperity for this province, create strong communities and support a strong economy. Over the past more than 10 years, including Budget 2015 investments, this government has allocated over $6 billion dollars in infrastructure, including new and renovated schools, new healthcare facilities, upgraded road infrastructure and new and enhanced municipal infrastructure.
Total Infrastructure Spending by Sector 2004-05 to 2015-16F
Total Infrastructure Spending by Year2004-05 to 2015-16F ($ Millions)
SOLID INVESTMENTS IN INFRASTRUCTURE
K-12 MULTI-YEAR INFRASTRUCTURE PLAN
The Provincial Government is moving forward with a multi-year education infrastructure plan that will prepare, in a proactive way, for projected growth.
- 5-
PENSION REFORM
Government has taken a leadership role in finding a solution to the liability associated with pension benefits that would have severely impacted the province’s net debt.
Over the past year, government has worked with public sector unions to formalize agreements that protect the defined benefit plans for approximately 97% of the plan members, including retirees.
Work will continue to address the remaining
unfunded pension liability in 2015-16.
BUDGET 2015 TAX ADJUSTMENTS
To facilitate a return to surplus in 2020-21, a number of new revenue initiatives will be implemented in Budget 2015. Some of these initiatives include:
Personal Income Tax rates will be made more progressive with the introduction of a fourth rate of 14.3% for taxable income of $125,001 to $175,000 and a fifth rate of 15.3% for taxable income over $175,000, effective July 1, 2015.
The Harmonized Sales Tax (HST) will increase from 13% to 15% effective January 1, 2016. To minimize the impact of the rate increase on low income individuals and families, the HST credit will be enhanced to offset the additional amount of HST paid. Government will increase the value
of the credit to $300 annually per adult and $60 for spouse. There will also be an increase in the income threshold from $15,000 to $30,000, meaning that the number of eligible families will increase from approximately 58,000 to 127,000.
The Residential Energy Rebate program, introduced in 2011 to help residents offset the rising price of fuel used to heat their homes, will be ending effective July 1, 2015.
The Financial Corporations Capital Tax rate will increase from 4% to 5% effective April 1, 2015.
These initiatives will result in increased revenue of approximately $122 million in 2015-16, annualizing to approximately $254 million in future years.
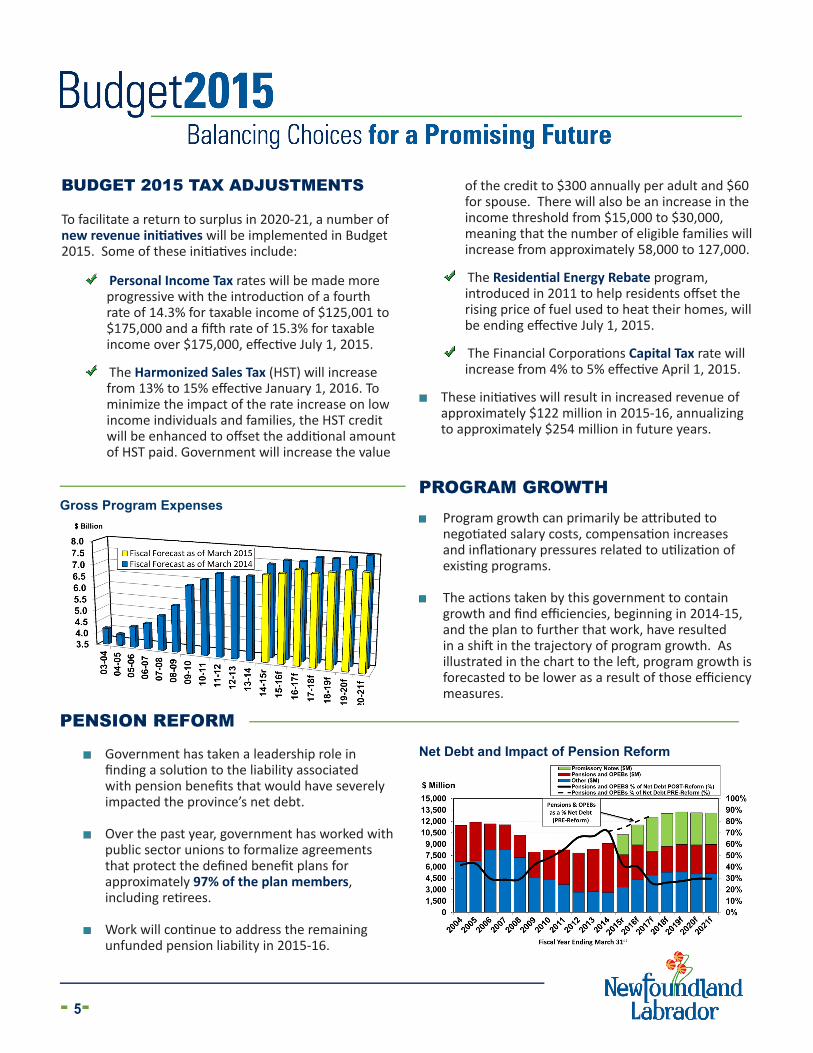
Net Debt and Impact of Pension Reform
PROGRAM GROWTH Program growth can primarily be attributed to
negotiated salary costs, compensation increases and inflationary pressures related to utilization of existing programs.
The actions taken by this government to contain growth and find efficiencies, beginning in 2014-15, and the plan to further that work, have resulted in a shift in the trajectory of program growth. As illustrated in the chart to the left, program growth is forecasted to be lower as a result of those efficiency measures.
Gross Program Expenses
- 6-
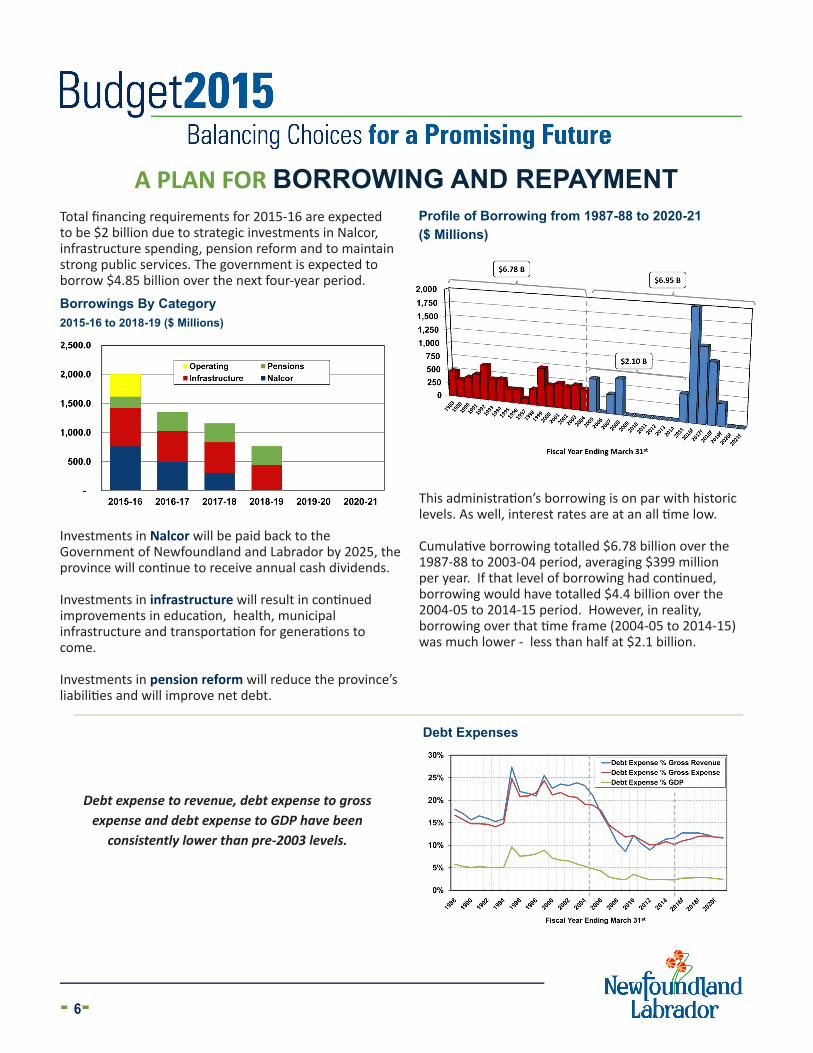
Total financing requirements for 2015-16 are expected to be $2 billion due to strategic investments in Nalcor, infrastructure spending, pension reform and to maintain strong public services. The government is expected to borrow $4.85 billion over the next four-year period.
Investments in Nalcor will be paid back to the Government of Newfoundland and Labrador by 2025, the province will continue to receive annual cash dividends.
Investments in infrastructure will result in continued improvements in education, health, municipal infrastructure and transportation for generations to come.
Investments in pension reform will reduce the province’s liabilities and will improve net debt.
Borrowings By Category2015-16 to 2018-19 ($ Millions)
A PLAN FOR BORROWING AND REPAYMENT
Debt Expenses
Profile of Borrowing from 1987-88 to 2020-21($ Millions)
This administration’s borrowing is on par with historic levels. As well, interest rates are at an all time low.
Cumulative borrowing totalled $6.78 billion over the 1987-88 to 2003-04 period, averaging $399 million per year. If that level of borrowing had continued, borrowing would have totalled $4.4 billion over the 2004-05 to 2014-15 period. However, in reality, borrowing over that time frame (2004-05 to 2014-15) was much lower - less than half at $2.1 billion.
Debt expense to revenue, debt expense to gross expense and debt expense to GDP have been
consistently lower than pre-2003 levels.
- 7-
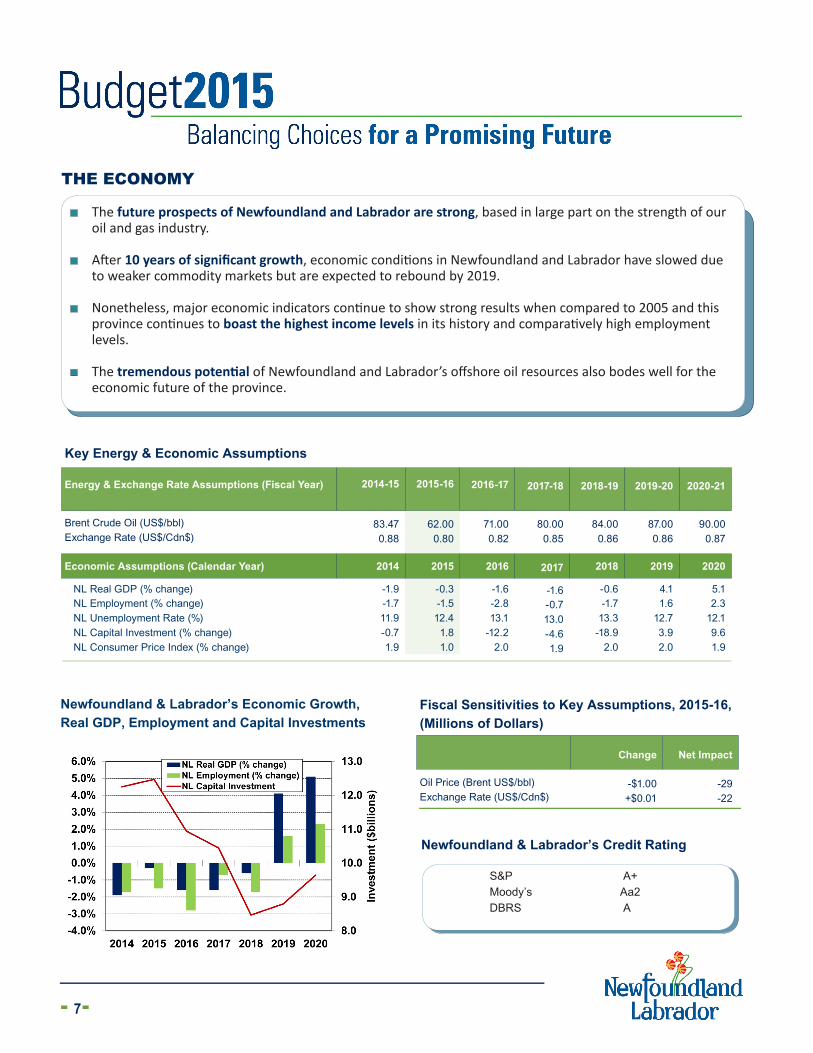
Newfoundland & Labrador’s Economic Growth, Real GDP, Employment and Capital Investments
THE ECONOMY
Key Energy & Economic Assumptions
Energy & Exchange Rate Assumptions (Fiscal Year) 2014-15 2015-16 2016-17 2017-18 2018-19 2019-20 2020-21
Brent Crude Oil (US$/bbl)Exchange Rate (US$/Cdn$)
83.470.88
62.000.80
71.000.82
80.000.85
84.000.86
87.000.86
90.000.87
Economic Assumptions (Calendar Year) 2014 2015 2016 2017 2018 2019 2020
NL Real GDP (% change) -1.9 -0.3 -1.6 -1.6 -0.6 4.1 5.1NL Employment (% change)NL Unemployment Rate (%)NL Capital Investment (% change)NL Consumer Price Index (% change)
-1.711.9-0.71.9
-1.512.4
1.81.0
-2.813.1
-12.22.0
-0.713.0-4.61.9
-1.713.3
-18.92.0
1.612.73.92.0
2.312.19.61.9
The future prospects of Newfoundland and Labrador are strong, based in large part on the strength of our oil and gas industry.
After 10 years of significant growth, economic conditions in Newfoundland and Labrador have slowed due to weaker commodity markets but are expected to rebound by 2019.
Nonetheless, major economic indicators continue to show strong results when compared to 2005 and this province continues to boast the highest income levels in its history and comparatively high employment levels.
The tremendous potential of Newfoundland and Labrador’s offshore oil resources also bodes well for the economic future of the province.
Fiscal Sensitivities to Key Assumptions, 2015-16, (Millions of Dollars)
Change Net Impact
Oil Price (Brent US$/bbl)Exchange Rate (US$/Cdn$)
-$1.00+$0.01
-29 -22
Newfoundland & Labrador’s Credit Rating
S&P A+Moody’s Aa2DBRS A

- 8-
NALCOR ENERGY EQUITY INVESTMENTS AND PAYBACK
FUTURE PROSPECTSThe economic landscape of Newfoundland and Labrador has changed significantly since 2003. Huge strides have resulted in higher employment levels, household incomes, retail sales and capital investments.
Oil and gas remains the province’s largest industry in terms of its contribution to the province’s GDP. Seismic data shows tremendous untapped oil reserve potential. The first offshore call for bids under the new exploration licensing system is due to close in the fall of 2015. Many expect heightened interest and results.
It is through the work of the province’s own energy company that this province is taking a lead role in the development of our energy resources. Nalcor is a large business enterprise and is structured to compete and partner with other large national and global businesses. It maintains a large base of energy assets and is commercially focused to meet its shareholders expectations.
To be clear, Nalcor will bring long-term revenue to the province. In 2015-16 the government will put an equity investment of $760 million into Nalcor, primarily for the Muskrat Falls project. The equity interests that Newfoundland and Labrador currently has in oil and gas projects, and the stakes in future projects, will significantly increase returns. Based on current projections, Nalcor’s oil and gas business will be completely self-sufficient, having only produced 16% of its known reserves, by 2017.
Government’s last equity injection in Nalcor will be in 2017-18. Over a total investment period of 10 years, the Provincial Government will have invested $3.1 billion in Nalcor. Every penny of that money will be returned to the province by 2025-26. From that time on, the dividends continue to increase for Newfoundlanders and Labradorians.

- 9-
Newfoundland and Labrador accounts for the vast majority of Canada’s offshore oil and gas activity, producing 80% of the nation’s offshore petroleum and one-third of its light crude. The world needs new supplies of oil and this province is perfectly positioned to develop new oil resources. Newfoundland and Labrador has sedimentary basins that exceed the size of the offshore basins of either the UK or Norway including the Barents Sea.
As illustrated below, the whole area of the North Sea would fit into a portion of this province’s offshore; the area from the Northern Orphan basin to the Salar/Bonnition basin. Recently, Nalcor announced the discovery of three new offshore basins in the slope and deepwater regions of the Labrador Sea. Globally, due to the exploration maturity of many regions abroad, there are few areas of the world where new basin discoveries are still occurring.
This province, through Nalcor, continues to expand and find new resources offshore. Eighty thousand kilometres of new modern broadband seismic data has recently been acquired over land that is available for licensing. Newfoundland and Labrador is also host to more than one million square kilometres of offshore acreage – comparable to the Gulf of Mexico. The potential prospects in Newfoundland and Labrador are tremendous.
Size comparison to US Gulf of Mexico (US-BOEMRE).
Total Offshore Sedimentary Basins Area (km2)