Embed Size (px)
Citation preview

NASA/CR-2011-216304
MesoNAM Verification Phase II Leela R. Watson ENSCO, Inc., Cocoa Beach, Florida NASA Applied Meteorology Unit, Kennedy Space Center, Florida
September 2011

NASA STI Program ... in Profile
Since its founding, NASA has been dedicated to the advancement of aeronautics and space science. The NASA scientific and technical information (STI) program plays a key part in helping NASA maintain this important role. The NASA STI program operates under the auspices of the Agency Chief Information Officer. It collects, organizes, provides for archiving, and disseminates NASA’s STI. The NASA STI program provides access to the NASA Aeronautics and Space Database and its public interface, the NASA Technical Report Server, thus providing one of the largest collections of aeronautical and space science STI in the world. Results are published in both non-NASA channels and by NASA in the NASA STI Report Series, which includes the following report types: TECHNICAL PUBLICATION. Reports of
completed research or a major significant phase of research that present the results of NASA Programs and include extensive data or theoretical analysis. Includes compilations of significant scientific and technical data and information deemed to be of continuing reference value. NASA counterpart of peer-reviewed formal professional papers but has less stringent limitations on manuscript length and extent of graphic presentations.
TECHNICAL MEMORANDUM. Scientific
and technical findings that are preliminary or of specialized interest, e.g., quick release reports, working papers, and bibliographies that contain minimal annotation. Does not contain extensive analysis.
CONTRACTOR REPORT. Scientific and
technical findings by NASA-sponsored contractors and grantees.
CONFERENCE PUBLICATION. Collected papers from scientific and technical conferences, symposia, seminars, or other meetings sponsored or co-sponsored by NASA.
SPECIAL PUBLICATION. Scientific,
technical, or historical information from NASA programs, projects, and missions, often concerned with subjects having substantial public interest.
TECHNICAL TRANSLATION. English-
language translations of foreign scientific and technical material pertinent to NASA’s mission.
Specialized services also include organizing and publishing research results, distributing specialized research announcements and feeds, providing help desk and personal search support, and enabling data exchange services. For more information about the NASA STI program, see the following: Access the NASA STI program home page
at http://www.sti.nasa.gov E-mail your question via the Internet to
[email protected] Fax your question to the NASA STI Help
Desk at 443-757-5802 Phone the NASA STI Help Desk at
443-757-5802 Write to:
NASA STI Help Desk NASA Center for AeroSpace Information 7115 Standard Drive Hanover, MD 21076-1320

NASA/CR-2011-216304
MesoNAM Verification Phase II Leela R. Watson ENSCO, Inc., Cocoa Beach, Florida NASA Applied Meteorology Unit, Kennedy Space Center, Florida National Aeronautics and Space Administration Kennedy Space Center Kennedy Space Center, FL 32899-0001
September 2011

Acknowledgements
The author thanks Mr. Randy Nyman of ACTA, Inc. for providing archived MesoNAM forecast files and Dr. William Bauman for providing his guidance on this task.
Available from:
NASA Center for AeroSpace Information 7115 Standard Drive
Hanover, MD 21076-1320 443-757-5802
This report is also available in electronic form at
http://science.ksc.nasa.gov/amu/

1
Executive Summary
The 45th Weather Squadron (45 WS) Launch Weather Officers (LWOs) use the 12-km resolution North American Mesoscale (NAM) model (MesoNAM) text and graphical product forecasts extensively to support launch weather operations. In Phase I of this task (Bauman 2010), the AMU measured the actual performance of the model at Kennedy Space Center (KSC) and Cape Canaveral Air Force Station (CCAFS) objectively by conducting a detailed statistical analysis of model output compared to observed values. The objective analysis compared the MesoNAM forecast winds, temperature (T), and dew point (Td), as well as the changes in these parameters over time, to the observed values from the sensors in the KSC/CCAFS wind tower network. In this phase of the task, the AMU modified the current tool by adding an additional 15 months of model output to the database and recalculating the verification statistics.
The AMU updated the period of record (POR) with data from February 2010-April 2011, bringing the final POR for Phase I and II from September 2006-April 2011. The KSC/CCAFS wind tower data and MesoNAM forecast products were processed using S-PLUS and Microsoft Excel Visual Basic for Applications scripts to prepare them for the objective statistical analysis. The AMU then calculated the following statistics to verify the performance of the model:
Bias (mean difference),
Standard deviation of Bias,
Root Mean Square Error, and
Hypothesis test for Bias = 0.
The results of the statistical analysis of model performance were similar to the results found in Phase I. Results from both phases of the study indicated that the accuracy decreased as the forecast progressed, there was a diurnal signal in T with a cool bias during the late night and a warm bias during the afternoon, and there was a diurnal signal in Td with a low bias during the afternoon and a high bias during the late night.
The AMU updated the previously developed Graphical User Interface (GUI) to include the new statistics calculated after adding data from February 2010-April 2011 to the POR. The tool retained the same structure as in Phase I and can be run using different web browsers. It allows the LWO to easily and efficiently navigate among the charts and spreadsheet files containing the model performance statistics.
The objective statistics provide the forecasters knowledge of the model’s strengths and weaknesses and the GUI allows quick access to the data which will result in improved forecasts for operations.

2
Table of Contents
Executive Summary ...................................................................................................................................... 1
List of Figures ............................................................................................................................................... 3
List of Tables ................................................................................................................................................ 4
1. Introduction ............................................................................................................................................ 5
2. Data and Methodology ........................................................................................................................... 6
2.1 Tower Observations ...................................................................................................................... 6 2.2 MesoNAM Forecast Products ...................................................................................................... 7 2.3 Data Manipulation ........................................................................................................................ 7
3. Verification Statistics ............................................................................................................................. 8
3.1 Statistics ........................................................................................................................................ 8 3.2 Difference Calculations ................................................................................................................ 8 3.3 Mean Monthly Model Bias ........................................................................................................... 8 3.4 Standard Deviation of Mean Monthly Bias .................................................................................. 8 3.5 Root Mean Square Error ............................................................................................................... 9 3.6 Hypothesis Zero Test .................................................................................................................... 9
4. Model Performance .............................................................................................................................. 10
4.1 Reduction of Noise ..................................................................................................................... 10 4.2 Accuracy and Diurnal Signal ...................................................................................................... 11
5. Graphical User Interface Update .......................................................................................................... 13
6. Summary and Conclusions ................................................................................................................... 15
7. Future Work ......................................................................................................................................... 15
References ................................................................................................................................................... 16
3
List of Figures
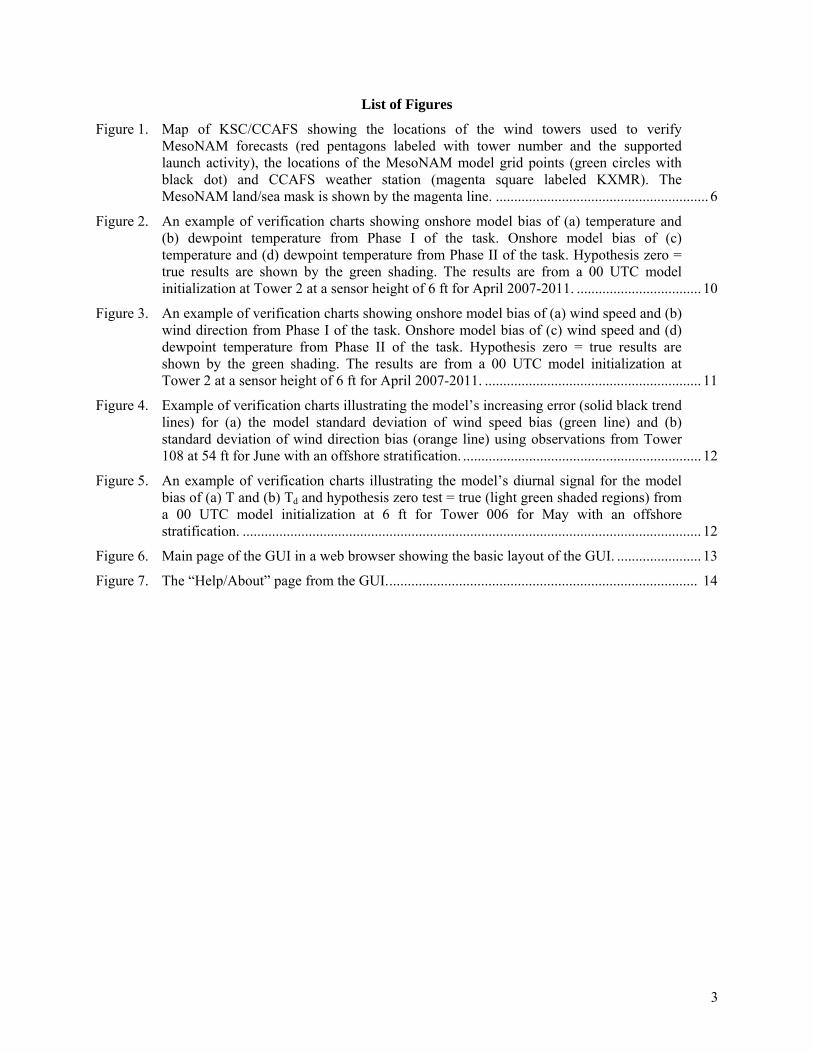
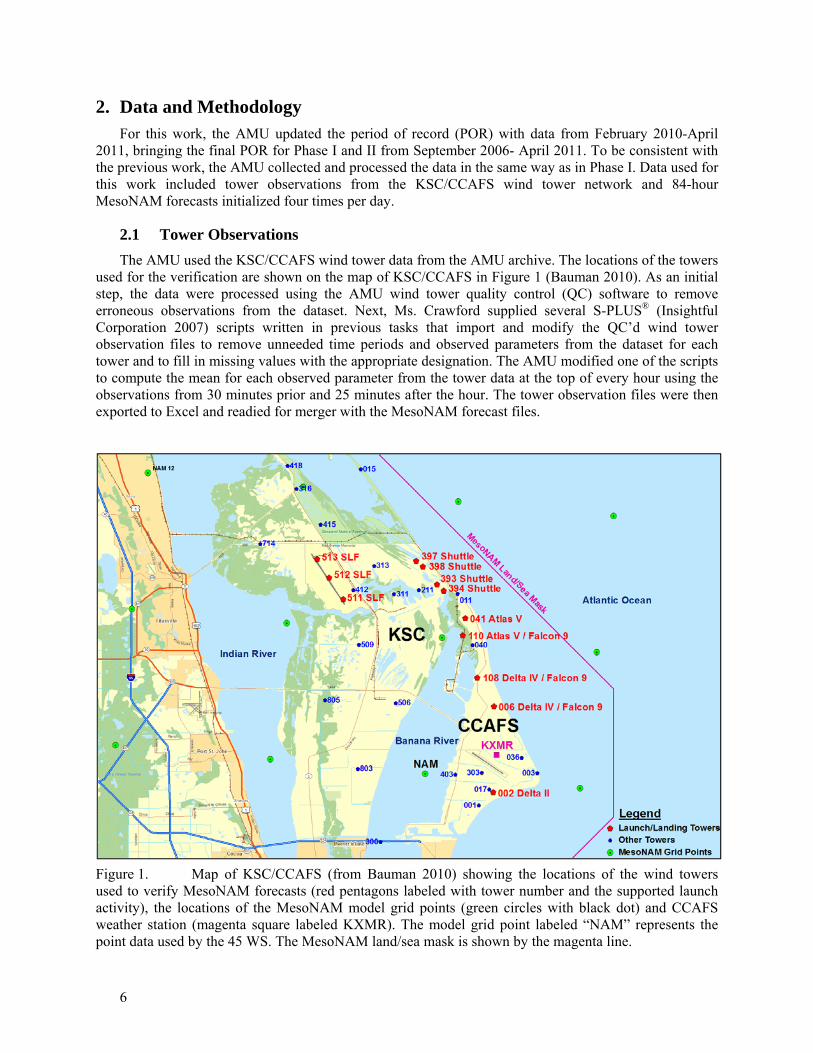
Figure 1. Map of KSC/CCAFS showing the locations of the wind towers used to verify MesoNAM forecasts (red pentagons labeled with tower number and the supported launch activity), the locations of the MesoNAM model grid points (green circles with black dot) and CCAFS weather station (magenta square labeled KXMR). The MesoNAM land/sea mask is shown by the magenta line. .......................................................... 6
Figure 2. An example of verification charts showing onshore model bias of (a) temperature and (b) dewpoint temperature from Phase I of the task. Onshore model bias of (c) temperature and (d) dewpoint temperature from Phase II of the task. Hypothesis zero = true results are shown by the green shading. The results are from a 00 UTC model initialization at Tower 2 at a sensor height of 6 ft for April 2007-2011. .................................. 10
Figure 3. An example of verification charts showing onshore model bias of (a) wind speed and (b) wind direction from Phase I of the task. Onshore model bias of (c) wind speed and (d) dewpoint temperature from Phase II of the task. Hypothesis zero = true results are shown by the green shading. The results are from a 00 UTC model initialization at Tower 2 at a sensor height of 6 ft for April 2007-2011. ........................................................... 11
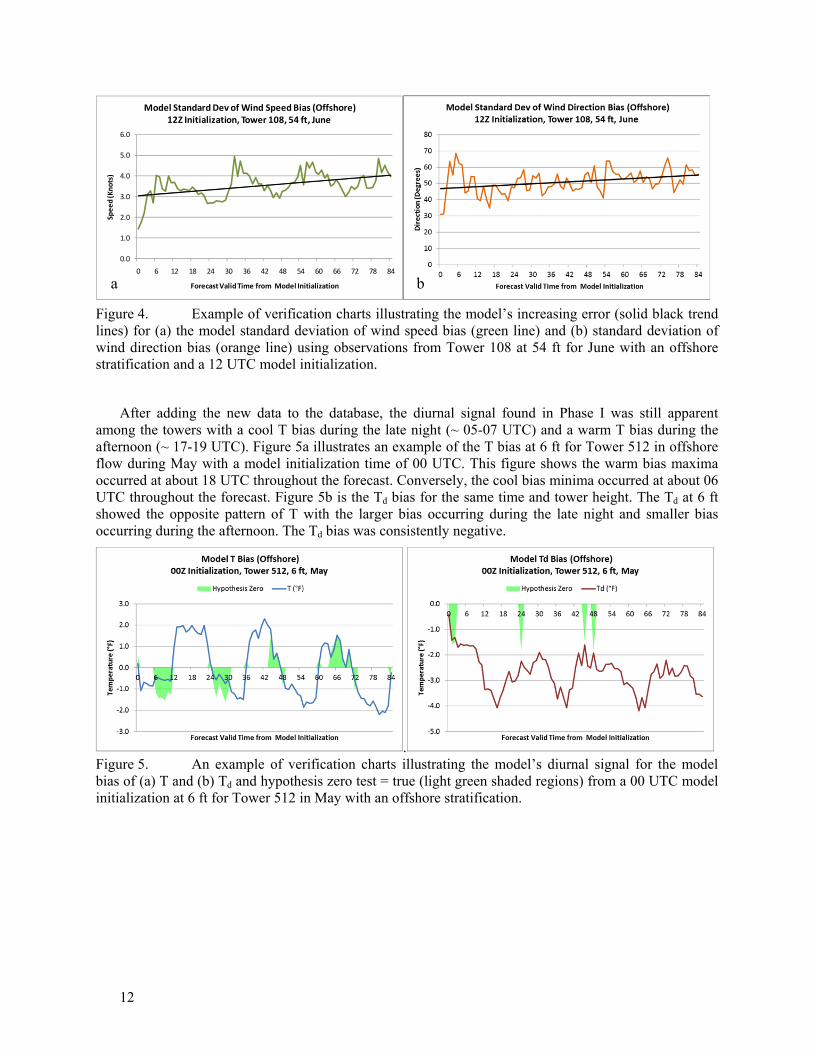
Figure 4. Example of verification charts illustrating the model’s increasing error (solid black trend lines) for (a) the model standard deviation of wind speed bias (green line) and (b) standard deviation of wind direction bias (orange line) using observations from Tower 108 at 54 ft for June with an offshore stratification. ................................................................. 12
Figure 5. An example of verification charts illustrating the model’s diurnal signal for the model bias of (a) T and (b) Td and hypothesis zero test = true (light green shaded regions) from a 00 UTC model initialization at 6 ft for Tower 006 for May with an offshore stratification. ............................................................................................................................. 12
Figure 6. Main page of the GUI in a web browser showing the basic layout of the GUI. ....................... 13
Figure 7. The “Help/About” page from the GUI. .................................................................................... 14

4
List of Tables
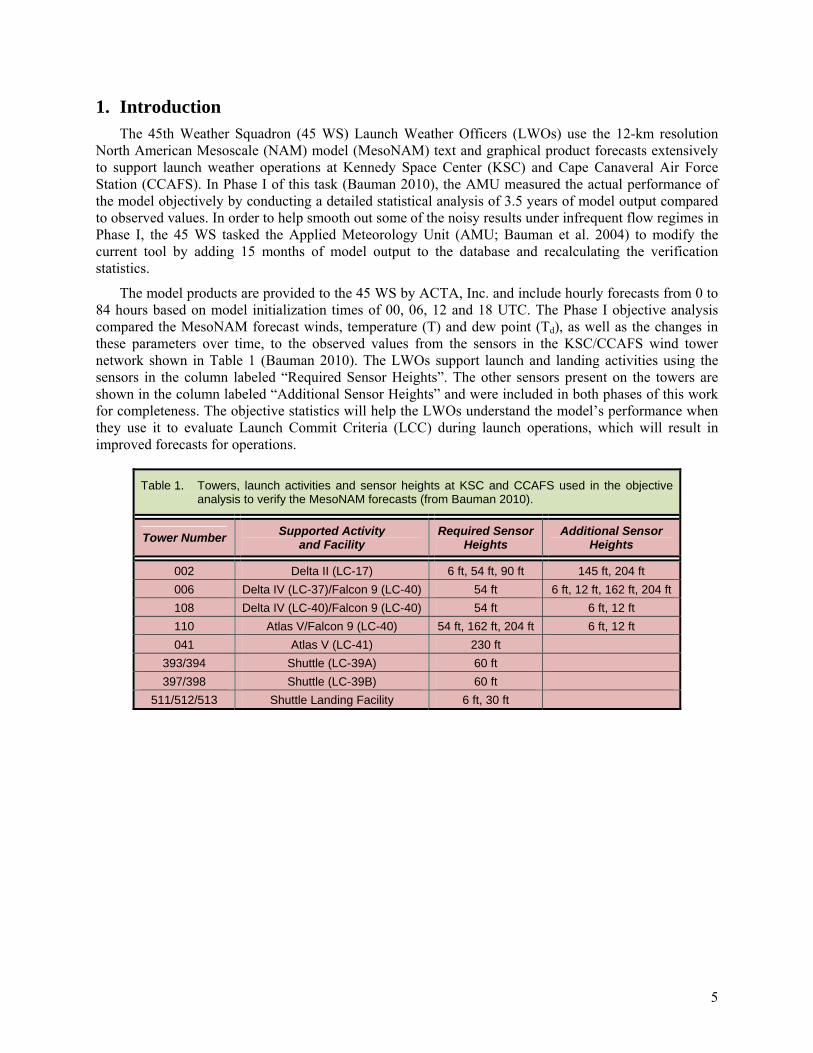
Table 1. Towers, launch activities and sensor heights at KSC and CCAFS used in the objective analysis to verify the MesoNAM forecasts. ................................................................................. 5
5
1. Introduction The 45th Weather Squadron (45 WS) Launch Weather Officers (LWOs) use the 12-km resolution
North American Mesoscale (NAM) model (MesoNAM) text and graphical product forecasts extensively to support launch weather operations at Kennedy Space Center (KSC) and Cape Canaveral Air Force Station (CCAFS). In Phase I of this task (Bauman 2010), the AMU measured the actual performance of the model objectively by conducting a detailed statistical analysis of 3.5 years of model output compared to observed values. In order to help smooth out some of the noisy results under infrequent flow regimes in Phase I, the 45 WS tasked the Applied Meteorology Unit (AMU; Bauman et al. 2004) to modify the current tool by adding 15 months of model output to the database and recalculating the verification statistics.
The model products are provided to the 45 WS by ACTA, Inc. and include hourly forecasts from 0 to 84 hours based on model initialization times of 00, 06, 12 and 18 UTC. The Phase I objective analysis compared the MesoNAM forecast winds, temperature (T) and dew point (Td), as well as the changes in these parameters over time, to the observed values from the sensors in the KSC/CCAFS wind tower network shown in Table 1 (Bauman 2010). The LWOs support launch and landing activities using the sensors in the column labeled “Required Sensor Heights”. The other sensors present on the towers are shown in the column labeled “Additional Sensor Heights” and were included in both phases of this work for completeness. The objective statistics will help the LWOs understand the model’s performance when they use it to evaluate Launch Commit Criteria (LCC) during launch operations, which will result in improved forecasts for operations.
Table 1. Towers, launch activities and sensor heights at KSC and CCAFS used in the objective analysis to verify the MesoNAM forecasts (from Bauman 2010).
Tower Number Supported Activity
and Facility Required Sensor
Heights Additional Sensor
Heights
002 Delta II (LC-17) 6 ft, 54 ft, 90 ft 145 ft, 204 ft
006 Delta IV (LC-37)/Falcon 9 (LC-40) 54 ft 6 ft, 12 ft, 162 ft, 204 ft
108 Delta IV (LC-40)/Falcon 9 (LC-40) 54 ft 6 ft, 12 ft
110 Atlas V/Falcon 9 (LC-40) 54 ft, 162 ft, 204 ft 6 ft, 12 ft
041 Atlas V (LC-41) 230 ft
393/394 Shuttle (LC-39A) 60 ft
397/398 Shuttle (LC-39B) 60 ft
511/512/513 Shuttle Landing Facility 6 ft, 30 ft
6
2. Data and Methodology For this work, the AMU updated the period of record (POR) with data from February 2010-April
2011, bringing the final POR for Phase I and II from September 2006- April 2011. To be consistent with the previous work, the AMU collected and processed the data in the same way as in Phase I. Data used for this work included tower observations from the KSC/CCAFS wind tower network and 84-hour MesoNAM forecasts initialized four times per day.
2.1 Tower Observations
The AMU used the KSC/CCAFS wind tower data from the AMU archive. The locations of the towers used for the verification are shown on the map of KSC/CCAFS in Figure 1 (Bauman 2010). As an initial step, the data were processed using the AMU wind tower quality control (QC) software to remove erroneous observations from the dataset. Next, Ms. Crawford supplied several S-PLUS® (Insightful Corporation 2007) scripts written in previous tasks that import and modify the QC’d wind tower observation files to remove unneeded time periods and observed parameters from the dataset for each tower and to fill in missing values with the appropriate designation. The AMU modified one of the scripts to compute the mean for each observed parameter from the tower data at the top of every hour using the observations from 30 minutes prior and 25 minutes after the hour. The tower observation files were then exported to Excel and readied for merger with the MesoNAM forecast files.
Figure 1. Map of KSC/CCAFS (from Bauman 2010) showing the locations of the wind towers used to verify MesoNAM forecasts (red pentagons labeled with tower number and the supported launch activity), the locations of the MesoNAM model grid points (green circles with black dot) and CCAFS weather station (magenta square labeled KXMR). The model grid point labeled “NAM” represents the point data used by the 45 WS. The MesoNAM land/sea mask is shown by the magenta line.
7
2.2 MesoNAM Forecast Products
The AMU requested and obtained the archived MesoNAM forecasts from ACTA, Inc. Each MesoNAM file contained an 84-hour forecast initialized at 00, 06, 12 or 18 UTC. The data were valid at a single grid point closest to the CCAFS weather station. This model grid point, which represents the point data used by the 45 WS, is located 3.1 NM southwest of KXMR over the Banana River. It is shown in Figure 1 as a green circle with a black dot labeled "NAM" (Bauman 2010). The CCAFS weather station is identified in Figure 1 by the magenta square labeled KXMR. This model point is not the closest one to the launch pads and weather toers used in launch operations and was presumably chosen to be closest to the KXMR RAOB.
The AMU used the aforementioned scripts to import the MesoNAM data into S-PLUS, fill in missing values with the appropriate designation, and convert the temperature data from Celsius to Fahrenheit. The data were then exported to Excel to be merged with the tower observations. An inventory of the MesoNAM files in Phase II (February 2010-April 2011) revealed 10 missing model runs out of a possible 1816 runs for the 454 days. This brought the total for the entire POR to 138 missing model runs out of a possible 6812 runs for the 1703 days. Some days were missing less than four model runs while others were missing all four model runs. The result was a total of 1670 days containing at least one model run.
2.3 Data Manipulation
The reader is referred to the Section 3 of the final report for Phase I of this task (Bauman 2010), which outlines the file formats of the raw tower and MesoNAM data and subsequent manipulation of the data required to compute the statistics. The goal was to combine the observed and forecast data into Excel files to compute the statistics and provide the results in a familiar format to the LWOs.
During Phase II, the AMU modified previously written Microsoft Excel Visual Basic for Applications (VBA) scripts that process and reformat the MesoNAM forecasts and wind tower data, including separating the data into the onshore and offshore components, and prepare them for the objective statistical analysis. The reader is referred to Section 4 of Bauman (2010), which details the splitting of the data into the onshore and offshore components for each tower based on the number and location of the sensors in relation to the coastline. The processing of the data remained the same, and the modifications were simply made to further automate the reformatting process.
After the statistics were computed for the new data from Phase II of the task, the AMU merged all data from Phase I with the new bias data. The merged Excel worksheets contained bias, standard deviation of bias, root mean square error, and hypothesis zero tests of the MesoNAM verification statistics for each sensor on every tower for the 1703 days with at least one model run.

8
3. Verification Statistics The AMU calculated the verification statistics for both phases of the task once the files were properly
formatted and stratified. The objective statistical analysis was the same as in Phase I of the task and included the mean monthly bias, the standard deviation of the mean monthly bias and the root mean square error (RMSE). Finally, the hypothesis zero test was applied to the mean monthly bias statistics.
3.1 Statistics
The following statistics were computed to verify the performance of the model against the observations:
Bias (mean difference),
Standard deviation of Bias,
Root Mean Square Error (RMSE), and
Hypothesis test for Bias = 0.
3.2 Difference Calculations The model bias was calculated for each model forecast against every observation, which represented
the difference between the MesoNAM forecast parameters and the tower observation parameters. This difference was calculated by subtracting the observed parameter from the model forecast for each hour of every day in the POR stratified by tower, sensor height and onshore/offshore flow as shown by the equation below.
DifMesoNAM = Model Forecast – Tower Observation
3.3 Mean Monthly Model Bias The mean monthly model bias statistics were calculated using the hourly model bias, or the
differences between the model forecast parameters and tower observation parameters for each hour of every day in the POR stratified by tower, sensor height, and onshore/offshore flow. They were computed using the following equation (Bauman 2010):
1
where:
n = number of available model forecasts in any given stratification,
f = MesoNAM forecast of T, Td, wind speed or wind direction, and
o = observed T, Td, wind speed or wind direction from each tower/sensor height.
3.4 Standard Deviation of Mean Monthly Bias The model standard deviation of mean monthly bias statistics was calculated using the following
equation (Bauman 2010):
∑
where:

9
n = number of available model forecasts in any given stratification,
x = model bias of each forecast,
= mean monthly bias in any given stratification.
3.5 Root Mean Square Error The model root mean square error (RMSE) was calculated using the following equations (Bauman
2010):
√
1
where:
n = number of available model forecasts in any given stratification,
f = MesoNAM forecast of T, Td, wind speed or wind direction, and
o = observed T, Td, wind speed or wind direction from each tower/sensor height.
3.6 Hypothesis Zero Test Hypothesis testing uses statistics to determine the probability that a given hypothesis is true. During
Phase I of this task, the AMU worked with the 45 WS to establish the best way to compute statistics that determine if the model bias of any of the parameters assessed throughout the model forecast period was not statistically significantly different from zero. The 45 WS recommended the test statistic for this data set would be to divide the mean bias of a given parameter by its mean standard deviation divided by the square root of the number of observations within a given stratification (onshore or offshore), as shown by (Bauman 2010):
√
where
Mean Bias as defined in Section 3.3,
Mean STDEV as defined in Section3.4, and
n = number of observations.
If the result was ≥ -1.96 or ≤ 1.96 for a data point, then the bias at that point was not statistically significantly different from zero and the model forecast for that point was considered to have no error (Bauman 2010). Further explanation and examples of the Hypothesis Zero Test can be found in Section 4.6 of Bauman (2010).
10
4. Model Performance The goal of this phase of the work was to smooth out some of the noisy results under infrequent flow
regimes in Phase I, while the overall goal of the task was provide the LWOs with a tool to evaluate model performance compared to observations at the tower(s) used to support a specific launch vehicle (Bauman 2010). The results from Phase II were similar to the Phase I.
4.1 Reduction of Noise
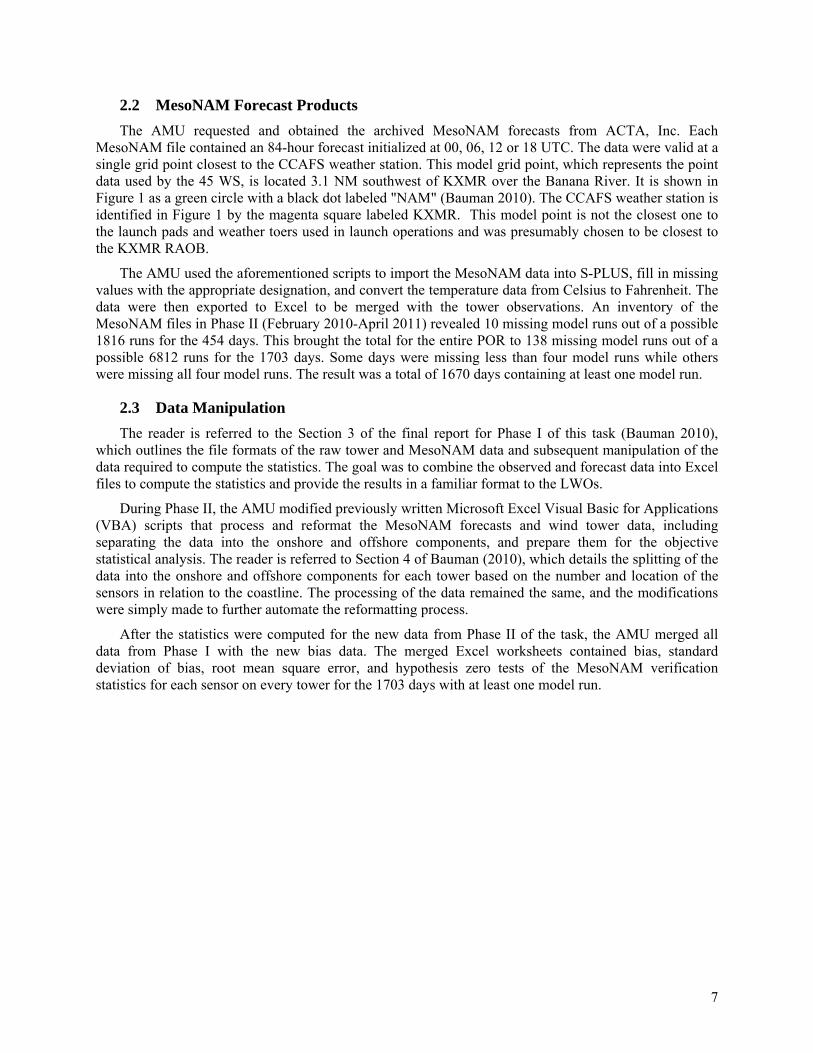
Overall, there was minimal reduction of noise in the Phase II results. Figure 2a-b and Figure 2c-d show results from Phases I and II for T bias and Td bias, respectively, for Tower 2 at 6 ft in April offshore flow, and a model initialization time of 00 UTC. There was a decrease in the range of model bias values from Phase I to Phase II. The model T bias decreased from a range of ~-2.5-2°F to -1-2°F, while the model Td bias decreased from ~-5-0°F to -3-0°F. This example is representative of results that exhibited some of the largest decreases in T and Td bias. Most Phase II results were similar to the Phase I results.
Figure 2. An example of verification charts showing model bias of (a) T and (b) Td from Phase I and of (c) T and (d) Td from Phase II. The green shading shows where the hypothesis zero test = true. The results are from a 00 UTC model initialization at Tower 2 at a sensor height of 6 ft for April 2007-2011 with an offshore stratification.
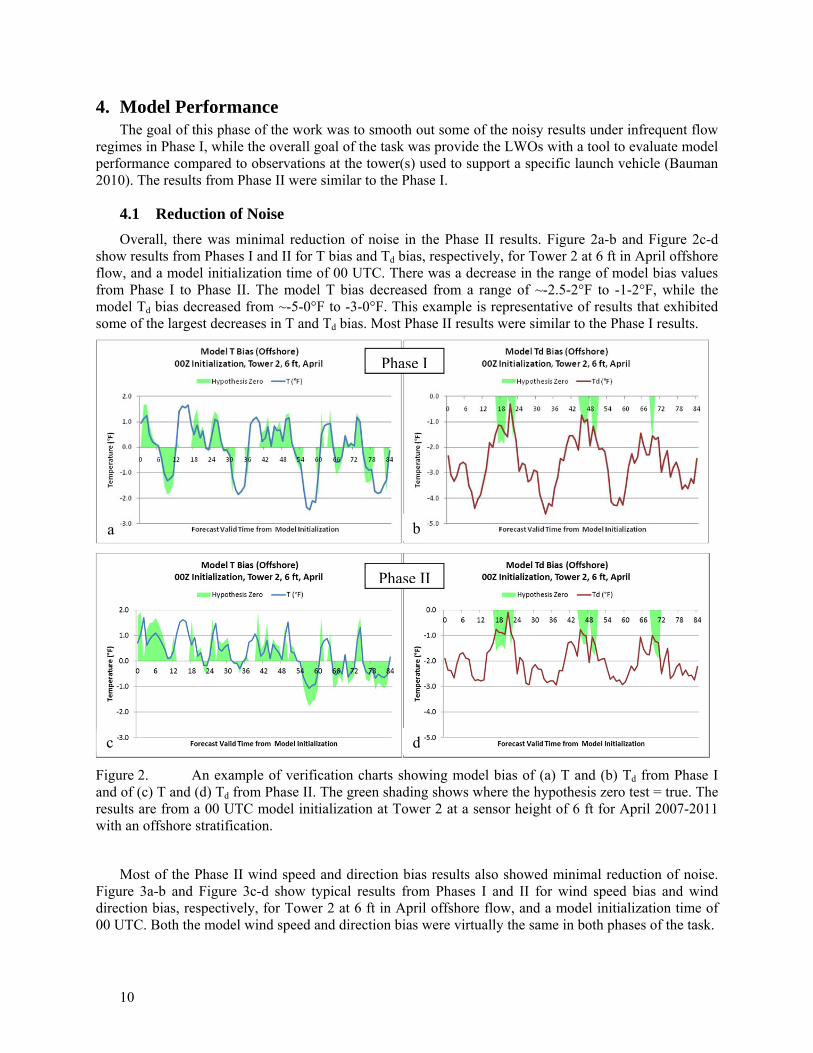
Most of the Phase II wind speed and direction bias results also showed minimal reduction of noise. Figure 3a-b and Figure 3c-d show typical results from Phases I and II for wind speed bias and wind direction bias, respectively, for Tower 2 at 6 ft in April offshore flow, and a model initialization time of 00 UTC. Both the model wind speed and direction bias were virtually the same in both phases of the task.
Phase I
Phase II
a b
c d
11
Figure 3. An example of verification charts showing model bias of (a) wind speed and (b) wind direction from Phase I and of (c) wind speed and (d) wind direction from Phase II. The green shading shows where the hypothesis zero test = true. The results are from a 00 UTC model initialization at Tower 2 at a sensor height of 6 ft for April 2007-2011 with an onshore stratification.
4.2 Accuracy and Diurnal Signal
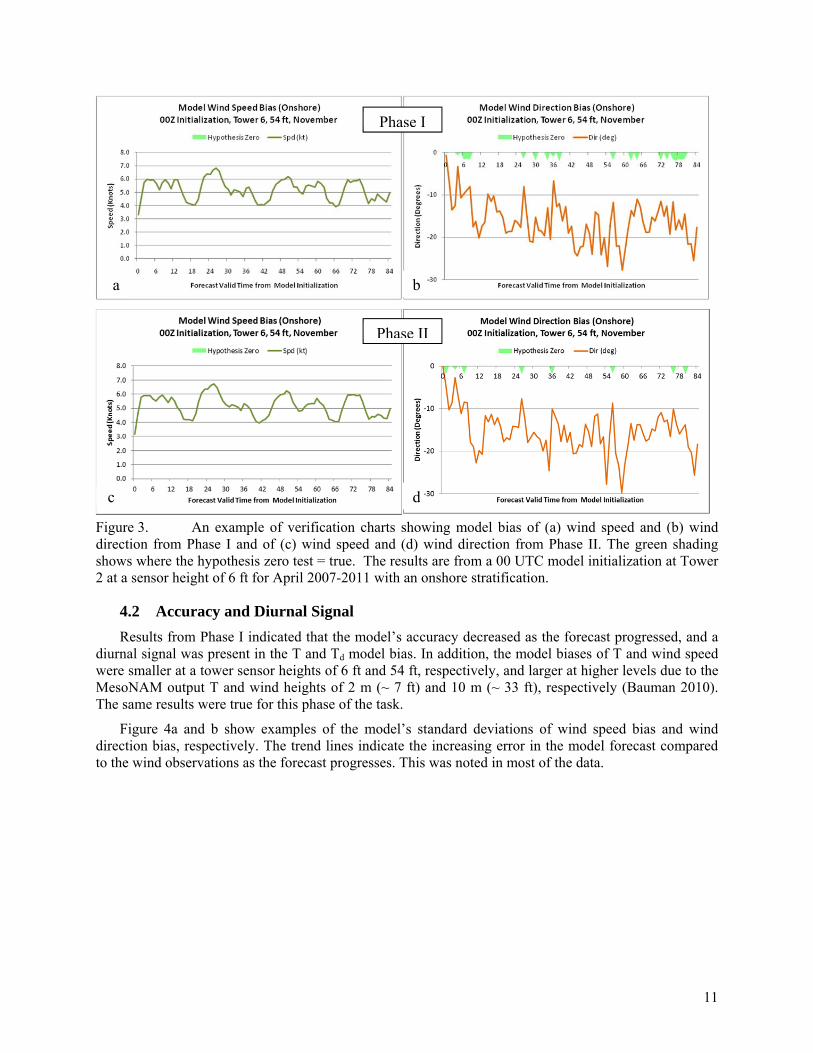
Results from Phase I indicated that the model’s accuracy decreased as the forecast progressed, and a diurnal signal was present in the T and Td model bias. In addition, the model biases of T and wind speed were smaller at a tower sensor heights of 6 ft and 54 ft, respectively, and larger at higher levels due to the MesoNAM output T and wind heights of 2 m (~ 7 ft) and 10 m (~ 33 ft), respectively (Bauman 2010). The same results were true for this phase of the task.
Figure 4a and b show examples of the model’s standard deviations of wind speed bias and wind direction bias, respectively. The trend lines indicate the increasing error in the model forecast compared to the wind observations as the forecast progresses. This was noted in most of the data.
a
d
b
c
Phase I
Phase II
12
Figure 4. Example of verification charts illustrating the model’s increasing error (solid black trend lines) for (a) the model standard deviation of wind speed bias (green line) and (b) standard deviation of wind direction bias (orange line) using observations from Tower 108 at 54 ft for June with an offshore stratification and a 12 UTC model initialization.
After adding the new data to the database, the diurnal signal found in Phase I was still apparent among the towers with a cool T bias during the late night (~ 05-07 UTC) and a warm T bias during the afternoon (~ 17-19 UTC). Figure 5a illustrates an example of the T bias at 6 ft for Tower 512 in offshore flow during May with a model initialization time of 00 UTC. This figure shows the warm bias maxima occurred at about 18 UTC throughout the forecast. Conversely, the cool bias minima occurred at about 06 UTC throughout the forecast. Figure 5b is the Td bias for the same time and tower height. The Td at 6 ft showed the opposite pattern of T with the larger bias occurring during the late night and smaller bias occurring during the afternoon. The Td bias was consistently negative.
. Figure 5. An example of verification charts illustrating the model’s diurnal signal for the model bias of (a) T and (b) Td and hypothesis zero test = true (light green shaded regions) from a 00 UTC model initialization at 6 ft for Tower 512 in May with an offshore stratification.
0.0
1.0
2.0
3.0
4.0
5.0
6.0
0 6 12 18 24 30 36 42 48 54 60 66 72 78 84
Speed (Knots)
Forecast Valid Time from Model Initialization
Model Standard Dev of Wind Speed Bias (Offshore)12Z Initialization, Tower 108, 54 ft, June
a b
13
5. Graphical User Interface Update The AMU updated the previously developed MesoNAM Verification Tool using a Hyper-Text
Markup Language (HTML) GUI with the statistics calculated after adding the new15 months to the POR. The tool can be used in most popular web browsers with computers running different operating systems such as Microsoft Windows and Linux.
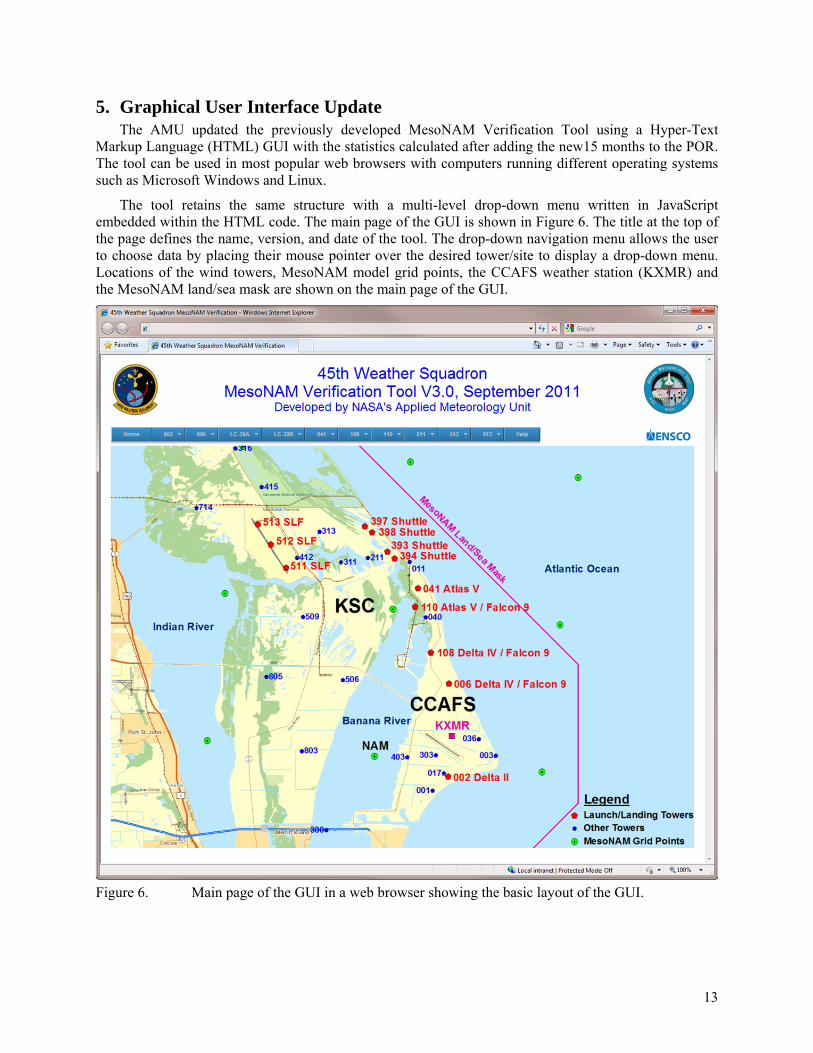
The tool retains the same structure with a multi-level drop-down menu written in JavaScript embedded within the HTML code. The main page of the GUI is shown in Figure 6. The title at the top of the page defines the name, version, and date of the tool. The drop-down navigation menu allows the user to choose data by placing their mouse pointer over the desired tower/site to display a drop-down menu. Locations of the wind towers, MesoNAM model grid points, the CCAFS weather station (KXMR) and the MesoNAM land/sea mask are shown on the main page of the GUI.
Figure 6. Main page of the GUI in a web browser showing the basic layout of the GUI.
14
The updated GUI contains the charts showing the model bias, standard deviation of bias, and RMSE of T, Td, wind speed and wind direction for all towers, heights, months, initialization time, and stratifications for the entire POR (September 2006-April 2011). There is a link to the corresponding updated Excel workbook file that produced the charts on each web page in the tool. This feature allows the user to view the spreadsheets from which the charts were derived. The reader is referred to Bauman (2010) for a complete description of the MesoNAM GUI.
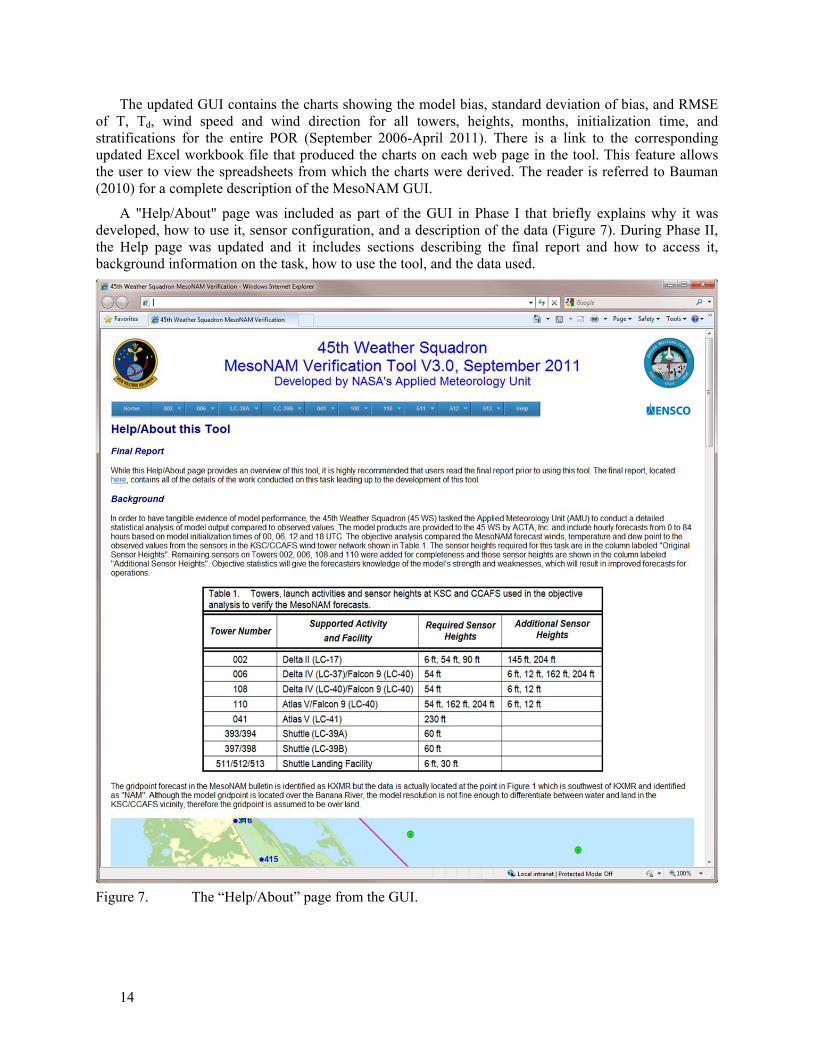
A "Help/About" page was included as part of the GUI in Phase I that briefly explains why it was developed, how to use it, sensor configuration, and a description of the data (Figure 7). During Phase II, the Help page was updated and it includes sections describing the final report and how to access it, background information on the task, how to use the tool, and the data used.
Figure 7. The “Help/About” page from the GUI.

15
6. Summary and Conclusions The AMU performed Phase II of a study that conducted an objective analysis of the MesoNAM
forecasts compared to observed values from sensors at specified KSC/CCAFS wind towers by calculating the following statistics to verify the performance of the model:
Bias (mean difference),
Standard deviation of Bias,
Root Mean Square Error (RMSE), and
Hypothesis test for Bias = 0.
The AMU added 15 months to the POR, resulting in the final POR for Phase I and II of September 2006-April 2011. The analysis compared the MesoNAM forecast wind speed, wind direction, T, and Td to the observed values from the sensors on the wind towers. The data were stratified by tower number, sensor height, month, initialization time, and onshore/offshore wind direction. The model’s performance statistics were then calculated.
The results of the statistical analysis of model performance did not change from the results found in Phase I. Results from both phases of the study indicated that the accuracy decreased as the forecast progressed, there was a diurnal signal in T with a cool bias during the late night and a warm bias during the afternoon, and there was a diurnal signal in Td with a low bias during the afternoon and a high bias during the late night.
The AMU updated the previously developed GUI to include data from February 2010-April 2011. The tool retained the same structure with a multi-level drop-down menu written in JavaScript embedded within the HTML code. It allows the LWO to easily and efficiently navigate among the charts and spreadsheet files containing the model performance statistics.
7. Future Work The goal of this work was to verify the performance of the MesoNAM forecasts that are routinely
used by the LWOs to support launch weather operations. While that goal was met, there are a couple of tasks that the AMU could complete as an extension of this study. First, the NAM model grid point that is currently used by the LWOs could be replaced with the grid point to the north. The northern grid point is slightly closer to and more representative of the launch pads and weather towers used in operations. In addition, model output that more closely matches the vertical height of each tower sensor could be used to improve the accuracy of the forecast data.

16
References
Bauman, W. H., W. P. Roeder, R. A. Lafosse, D. W. Sharp, and F. J. Merceret, 2004: The Applied Meteorology Unit – Operational Contributions to Spaceport Canaveral. Preprints, 11th Conference on Aviation, Range, and Aerospace Meteorology, Amer. Meteor. Soc., Hyannis, MA, 4-8 October 2004, 24 pp.
Bauman, W. H., 2010: Verify MesoNAM Performance. NASA Contractor Report CR-2010-216-287, Kennedy Space Center, FL, 31 pp. [Available from ENSCO, Inc., 1980 N. Atlantic Ave., Suite 830, Cocoa Beach, FL, 32931 and online at http://science.ksc.nasa.gov/amu/final-reports/mesoNAM-verify.pdf.]
Insightful Corporation, 2007: S-PLUS® 8 for Windows® User’s Guide, Insightful Corp., Seattle, WA, 584 pp.

17
List of Acronyms
45 WS 45th Weather Squadron
AMU Applied Meteorology Unit
CCAFS Cape Canaveral Air Force Station
GUI Graphical User Interface
HTML Hyper-Text Markup Language
KSC Kennedy Space Center
KXMR CCAFS rawinsonde 4-letter identifier
LWO Launch Weather Officer
MesoNAM 12-km resolution NAM
NAM North American Mesoscale
NM Nautical Mile
POR Period of Record
QC Quality Control
RMSE Root Mean Square Error

18
NOTICE
Mention of a copyrighted, trademarked or proprietary product, service, or document does not constitute endorsement thereof by the author, ENSCO Inc., the AMU, the National Aeronautics and Space Administration, or the United States Government. Any such mention is solely for the purpose of fully informing the reader of the resources used to conduct the work reported herein.