Embed Size (px)
DESCRIPTION
Can Formal–Informal Collaborations Improve Science Literacy in Urban Middle Schools? The Impact of Urban Advantage. Meryle Weinstein, Emilyn Ruble Whitesell and Amy Ellen Schwartz New York University Improving Education through Accountability and Evaluation: - PowerPoint PPT Presentation
Citation preview

Meryle Weinstein, Emilyn Ruble Whitesell and Amy Ellen SchwartzNew York University
Improving Education through Accountability and Evaluation: Lessons from Around the World
Rome, ItalyOctober 3, 2012
Can Formal–Informal Collaborations Improve Science Literacy in Urban
Middle Schools? The Impact of Urban Advantage
Meryle WeinsteinEmilyn RubleAmy Ellen Schwartz

What is Urban Advantage?Collaboration between New York City Department of
Education and 8 New York City informal science education institutionsLed by American Museum of Natural History
Provides professional development to middle school science teachers and opportunities to students to engage in authentic science practiceWorkshops for science teachers and school administratorsScience materials/equipment for schools, teachers, &
studentsVouchers for class field trips, family field trips and visits
Launched in 2004-05 with 31 schools and in 2011-12 had 137
Funded by NY City Council and DOE


Why Urban Advantage?Increased calls for collaboration between
formal and informal institutions, particularly around science
Growing aversion to science among students, particularly by the time they reach middle school
Middle school is time to grab students attention – “gateway” for high school science courses
Strong science instruction has been found to impact science persistence in high school

Our goal is to determine if the Urban Advantage program is effective.Does Urban Advantage lead to increased
student achievement? UA students outperform non-UA students
on 8th grade Intermediate Level Science Test
Modest impactMagnitude increases over timeStudents who attend UA schools are more
likely to take and pass a Science Regents in 8th or 9th grade than students at non-UA schools

We make use of a rich longitudinal student level database.
Student-Level DataNYCDOE Administrative Data, 2004-05 – 2009-
10Socio-demographic characteristics, educational
needs, and test scores

Raw performance data suggests UA is effective
Student Weighted Mean Achievement, 8th Grade Intermediate Level Science (ILS) Test – Percent Proficient

Differences between UA and non-UA schools prior to joining UA are largely insignificant.
2004 2006 2008
UA Non-UA UA Non-UA UA Non-UAN of Schools 31 289 43 366 7 227
Total Enrollment 1079 851 611 586 738 667(434) (468) (426) (425) (647) (373)
% Black 41.84 36.47 37.65 38.95 33.89 38.52(28.1) (28.1) (29.3) (28.9) (34.0) (29.3)
% Hispanic 35.10 39.91 42.21 40.45 35.56 41.18(22.9) (25.4) (27.5) (26.0) (23.2) (26.4)
% Asian/Other 13.26 9.67 7.16 8.77 12.56 9.14(19.6) (12.1) (12.0) (13.3) (14.5) (14.1)
% White 9.82 13.96 12.53 11.18 17.78 10.71(18.2) (19.6) (22.1) (18.0) (19.1) (18.0)
% ELL 10.26 10.60 10.79 10.80 9.67 11.23(7.8) (10.6) (9.9) (11.1) (4.2) (11.7)
% Free Lunch 75.37 71.10 63.30 69.90 55.89 66.30(21.8) (23.5) (23.1) (23.3) (31.5) (25.8)
% Prof. ELA 33.17 39.42 36.11 40.14 58.41 48.75(16.6) (20.5) (20.4) (21.3) (18.9) (21.6)
% Prof. Math 38.10 43.63 36.34 43.08 73.27 62.42(17.4) (20.6) (23.2) (22.2) (18.7) (23.5)
% Prof. Science 38.23 45.03 36.61 39.52 47.57 50.16(20.9) (24.8) (23.0) (24.0) (27.7) (22.7)
Standard deviations are in parenthesesBold indicates differences are statistically significant at .05 level or less% Proficient is the percent scoring in levels 3 or 4

Basic Model
Yijt = β1ijt + β2PreUA ijt β3PostUA ijt + β4STijt +θj + εijt
Y = individual student outcome PreUA = indicator variable for whether school joined UA in next year PostUA = indicator variable for whether school has joined UA ST = vector of student characteristics θ = school fixed effect = random error term

OLS Regression with School Fixed Effects, 2004 to 2010Science Math ELA
Model 1 Model 2 Model 2 Model 2β/se β/se β/se β/se
Yr Prior UA 0.002 0.011 0.011 -0.001(0.018) (0.021) (0.024) (0.017)
UA in Any Year 0.041*(0.016)
Yr Ent. UA 0.044 0.036 0.026(0.024) (0.027) (0.021)
Yr Post UA 0.056* 0.014 0.022(0.028) (0.031) (0.023)
Black -0.397*** -0.397*** -0.408*** -0.375***(0.017) (0.017) (0.022) (0.023)
Hispanic -0.226*** -0.226*** -0.270*** -0.275***(0.015) (0.015) (0.020) (0.021)
Asian 0.162*** 0.162*** 0.407*** 0.064**(0.019) (0.019) (0.027) (0.022)
Female -0.072*** -0.072*** 0.027*** 0.194***(0.005) (0.005) (0.004) (0.004)
School FE YES YES YES YESR-Square 0.35 0.35 0.33 0.32N 401270 401270 425820 409572
* p<0.05, ** p<0.01, *** p<0.001Year, LEP, and Special Education dummies not shownRobust clustered standard errors in parentheses

Robustness ChecksControlled for prior achievement
Magnitudes are smaller but still significant when controlling for prior math or reading scoresLagged Math Scores, Post UA Yrs β=.037, p < .10Lagged Reading Scores, Post UA Yrs β=.045, p < .10
Caveat: Sample size decreases by 50,000No statistically significant findings for
percent proficient
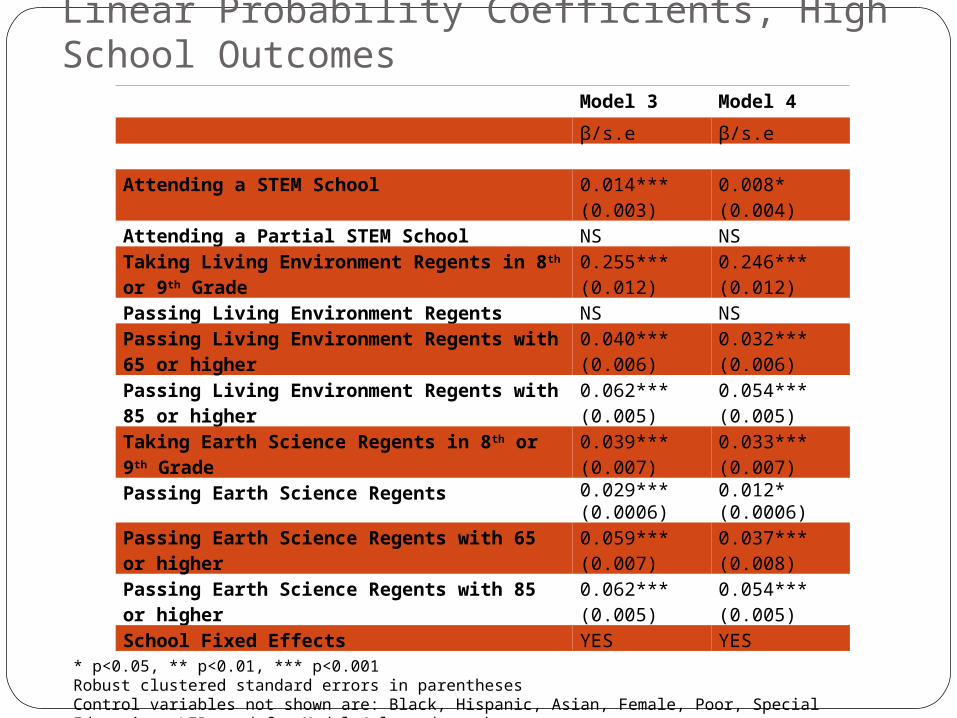
Linear Probability Coefficients, High School Outcomes
Model 3 Model 4 β/s.e β/s.e Attending a STEM School 0.014***
(0.003)0.008*(0.004)
Attending a Partial STEM School NS NSTaking Living Environment Regents in 8th or 9th Grade
0.255***(0.012)
0.246***(0.012)
Passing Living Environment Regents NS NSPassing Living Environment Regents with 65 or higher
0.040***(0.006)
0.032***(0.006)
Passing Living Environment Regents with 85 or higher
0.062***(0.005)
0.054***(0.005)
Taking Earth Science Regents in 8th or 9th Grade
0.039***(0.007)
0.033***(0.007)
Passing Earth Science Regents 0.029***(0.0006)
0.012*(0.0006)
Passing Earth Science Regents with 65 or higher
0.059***(0.007)
0.037***(0.008)
Passing Earth Science Regents with 85 or higher
0.062***(0.005)
0.054***(0.005)
School Fixed Effects YES YES* p<0.05, ** p<0.01, *** p<0.001Robust clustered standard errors in parenthesesControl variables not shown are: Black, Hispanic, Asian, Female, Poor, Special Education, LEP, and for Model 4 lagged_zmath.

ConclusionsStudent performance increases with the
implementation of UA and the magnitude of the difference increases over time.
Little change on ELA or math for 8th grade students, suggesting the effect is not merely reflecting coincident overall school improvement
UA also contributes to post-8th grade outcomes. Biggest impact is on the likelihood of taking the Living Environment Regents in 8th or 9th grade.

Policy ImplicationsFirst estimates of the impact of a science
program on academic achievement Inquiry as a method to approach science
instruction is not emphasized in schools but more common in informal science institutions
Benefits of collaboration between formal and informal science institutions
Importance of strong partnerships between these institutions and between the institutions and the school district in which they work
Need for improved data linking teachers and students
Future research: Inside the black box

http://steinhardt.nyu.edu/iesp