Embed Size (px)
Citation preview
MERLIN - Works Like Magic!
MERLIN
Home
Tutorial
Download
Register
Reference
FAQ
MERLIN
Welcome!
MERLIN uses sparse trees to represent gene flow in pedigrees and is one of the fastest pedigree analysis packages around (Abecasis et al, 2002). Comments and suggestions are welcome, please e-mail [email protected].
Thanks to the Wizard of Draws for the cool cartoon!
University of Michigan | School of Public Health | Gonçalo Abecasis
http://www.sph.umich.edu/csg/abecasis/Merlin/ [3/5/2003 11:48:45 AM]
MERLIN Tutorial
Tutorial
Home
Tutorial
Input Files
Linkage
Error Detection
Simulation
Haplotyping
IBD Estimation
Regression
MERLIN Tutorial
These pages provide a guided tour through the main features and quirks of MERLIN. The section on input file formats is recommended for all users. The other sections will depend on the focus of your research. Merlin can be used for linkage analysis, ibd and kinship estimation, haplotyping, error detection and simulation.
Enjoy!
University of Michigan | School of Public Health | Gonçalo Abecasis | Merlin
http://www.sph.umich.edu/csg/abecasis/Merlin/tour/ [3/5/2003 11:48:46 AM]
MERLIN Download
MERLIN
Home
Tutorial
Download
Register
Reference
FAQ
MERLIN Download
The current version of MERLIN is 0.9.8. If you use MERLIN please e-mail [email protected] or fill out the registration form.
Source Distribution
This version is recommended for Unix users with access to the GNU C++ compiler. To install Merlin, unpack the archive below, type make and follow instructions. Have fun!
merlin-0.9.8.tar.gz
Example Files
This archive includes example input files only. These files are used in the MERLIN tutorial.
merlin-examples.tar.gz
Precompiled Binaries
If you do not have access to a C++ compiler, one of the following precompiled versions may work on your system:
Linux-merlin.tar.gz For GNU/LINUX systems
SunOS-merlin.tar.gz For Sun Workstations
Windows-merlin.tar.gz For Windows Workstations
SunOS-merlin.tar.gz For MacOS X Workstations [compiled by M. Barmada]
Archive of Sources for Older Versions
Old releases of merlin are archived below. It is highly recommended that you download the most recent version, instead of these. For a list of changes check out the ChangeLog file in the most recent distribution.
merlin-0.9.3.tar.gz
merlin-0.9.2.tar.gz
merlin-0.8.8.tar.gz
merlin-0.8.7a.tar.gz
merlin-0.8.7.tar.gz
merlin-0.8.6.tar.gz
merlin-0.8.5.tar.gz
University of Michigan | School of Public Health | Gonçalo Abecasis
http://www.sph.umich.edu/csg/abecasis/Merlin/download/ [3/5/2003 11:50:07 AM]

MERLIN Registration Form
MERLIN
Home
Tutorial
Download
Register
Reference
FAQ
MERLIN - Registration Form
Please take a few minutes to fill out the following registration form. It will enable us to keep you informed of updates and bug-fixes and help gauge the level of interest in the project.
If this form doesn't work for you, please e-mail Goncalo Abecasis ([email protected]) directly.
User Information
Title
Name
Position
Institution
Product Information
Version
Comments - Comments and suggestions are always welcome! In particular, we would like to know which features of MERLIN you like the best and which new feature you might like to see.
http://www.sph.umich.edu/csg/abecasis/Merlin/register.html (1 of 2) [3/5/2003 11:50:08 AM]

MERLIN Registration Form
University of Michigan | School of Public Health | Gonçalo Abecasis
http://www.sph.umich.edu/csg/abecasis/Merlin/register.html (2 of 2) [3/5/2003 11:50:08 AM]
MERLIN Quick Reference
MERLIN
Home
Tutorial
Download
Register
Reference
FAQ
MERLIN - Reference Sheet
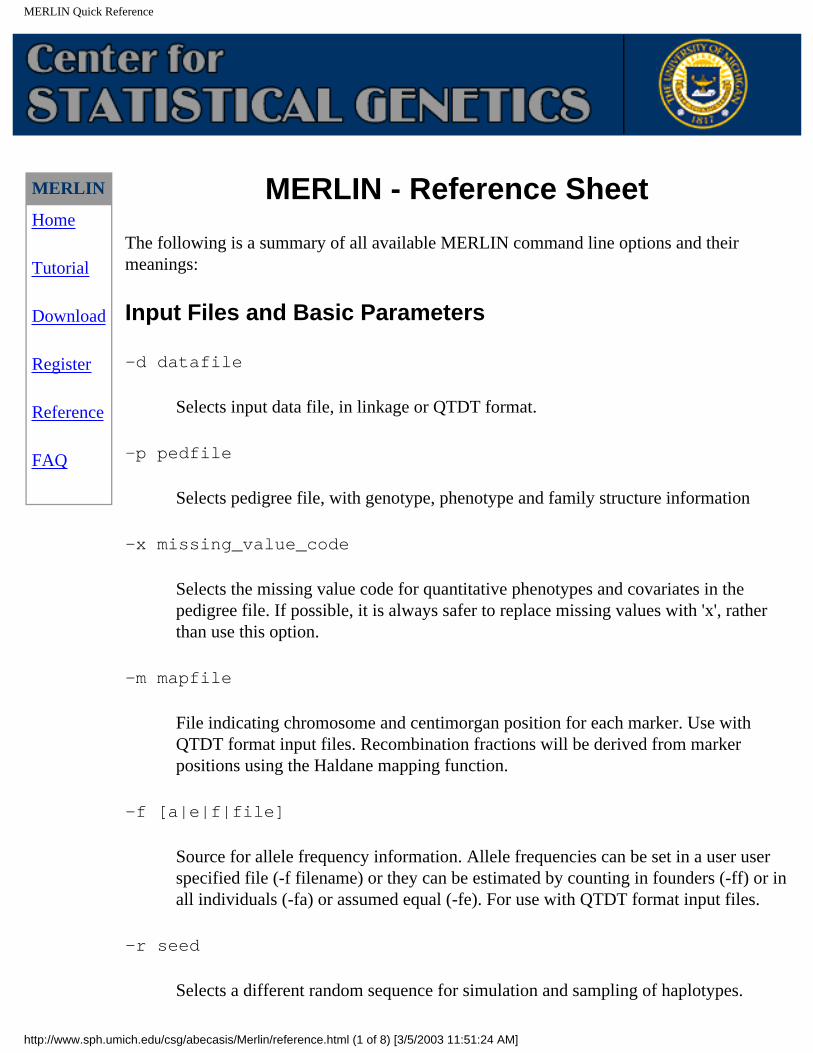
The following is a summary of all available MERLIN command line options and their meanings:
Input Files and Basic Parameters
-d datafile
Selects input data file, in linkage or QTDT format.
-p pedfile
Selects pedigree file, with genotype, phenotype and family structure information
-x missing_value_code
Selects the missing value code for quantitative phenotypes and covariates in the pedigree file. If possible, it is always safer to replace missing values with 'x', rather than use this option.
-m mapfile
File indicating chromosome and centimorgan position for each marker. Use with QTDT format input files. Recombination fractions will be derived from marker positions using the Haldane mapping function.
-f [a|e|f|file]
Source for allele frequency information. Allele frequencies can be set in a user user specified file (-f filename) or they can be estimated by counting in founders (-ff) or in all individuals (-fa) or assumed equal (-fe). For use with QTDT format input files.
-r seed
Selects a different random sequence for simulation and sampling of haplotypes.
http://www.sph.umich.edu/csg/abecasis/Merlin/reference.html (1 of 8) [3/5/2003 11:51:24 AM]
MERLIN Quick Reference
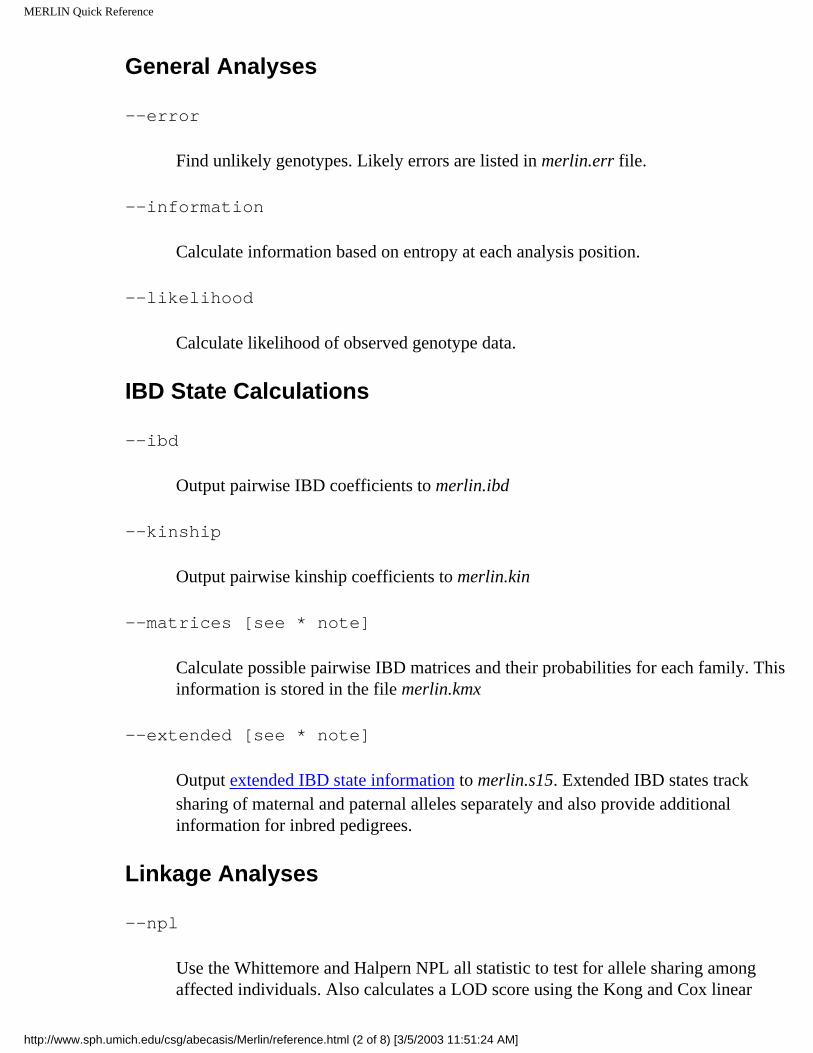
General Analyses
--error
Find unlikely genotypes. Likely errors are listed in merlin.err file.
--information
Calculate information based on entropy at each analysis position.
--likelihood
Calculate likelihood of observed genotype data.
IBD State Calculations
--ibd
Output pairwise IBD coefficients to merlin.ibd
--kinship
Output pairwise kinship coefficients to merlin.kin
--matrices [see * note]
Calculate possible pairwise IBD matrices and their probabilities for each family. This information is stored in the file merlin.kmx
--extended [see * note]
Output extended IBD state information to merlin.s15. Extended IBD states track sharing of maternal and paternal alleles separately and also provide additional information for inbred pedigrees.
Linkage Analyses
--npl
Use the Whittemore and Halpern NPL all statistic to test for allele sharing among affected individuals. Also calculates a LOD score using the Kong and Cox linear
http://www.sph.umich.edu/csg/abecasis/Merlin/reference.html (2 of 8) [3/5/2003 11:51:24 AM]
MERLIN Quick Reference
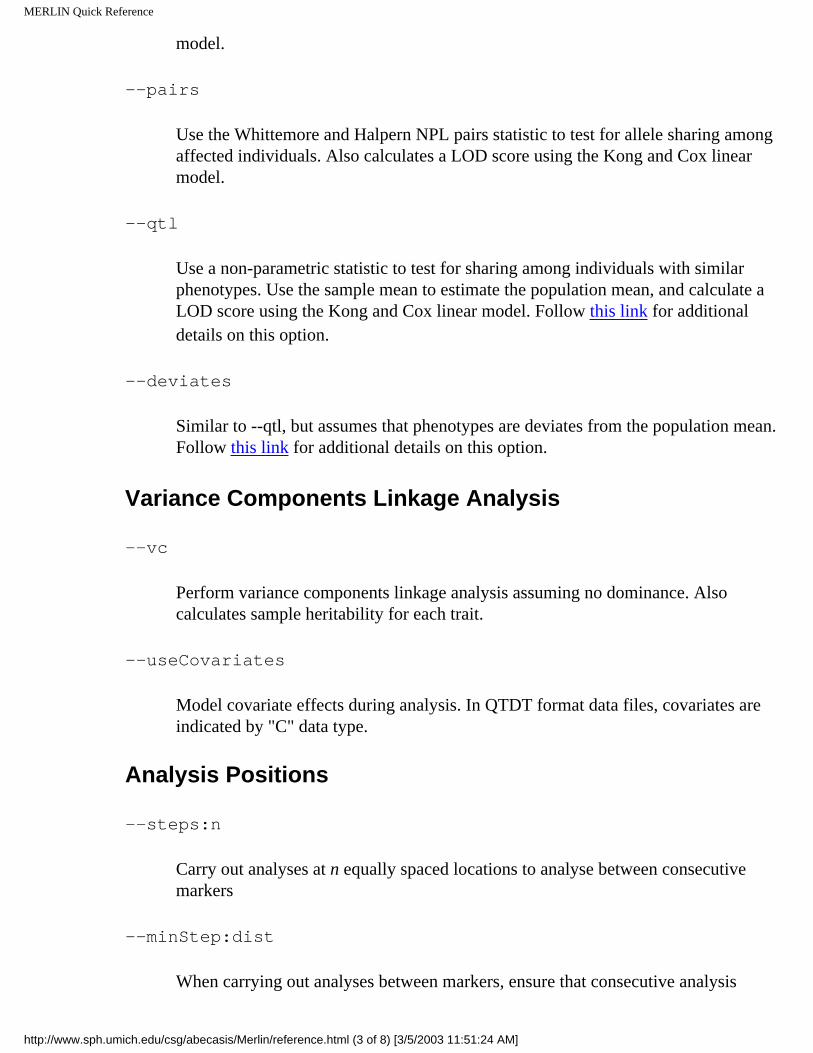
model.
--pairs
Use the Whittemore and Halpern NPL pairs statistic to test for allele sharing among affected individuals. Also calculates a LOD score using the Kong and Cox linear model.
--qtl
Use a non-parametric statistic to test for sharing among individuals with similar phenotypes. Use the sample mean to estimate the population mean, and calculate a LOD score using the Kong and Cox linear model. Follow this link for additional details on this option.
--deviates
Similar to --qtl, but assumes that phenotypes are deviates from the population mean. Follow this link for additional details on this option.
Variance Components Linkage Analysis
--vc
Perform variance components linkage analysis assuming no dominance. Also calculates sample heritability for each trait.
--useCovariates
Model covariate effects during analysis. In QTDT format data files, covariates are indicated by "C" data type.
Analysis Positions
--steps:n
Carry out analyses at n equally spaced locations to analyse between consecutive markers
--minStep:dist
When carrying out analyses between markers, ensure that consecutive analysis
http://www.sph.umich.edu/csg/abecasis/Merlin/reference.html (3 of 8) [3/5/2003 11:51:24 AM]
MERLIN Quick Reference
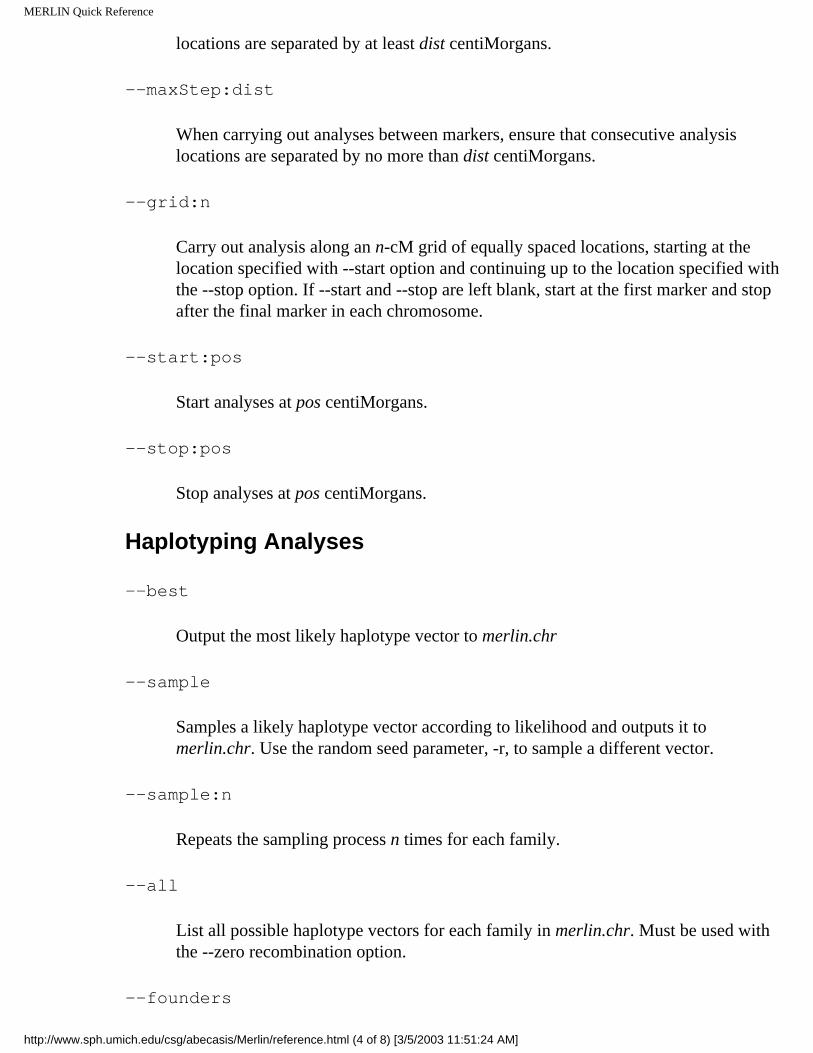
locations are separated by at least dist centiMorgans.
--maxStep:dist
When carrying out analyses between markers, ensure that consecutive analysis locations are separated by no more than dist centiMorgans.
--grid:n
Carry out analysis along an n-cM grid of equally spaced locations, starting at the location specified with --start option and continuing up to the location specified with the --stop option. If --start and --stop are left blank, start at the first marker and stop after the final marker in each chromosome.
--start:pos
Start analyses at pos centiMorgans.
--stop:pos
Stop analyses at pos centiMorgans.
Haplotyping Analyses
--best
Output the most likely haplotype vector to merlin.chr
--sample
Samples a likely haplotype vector according to likelihood and outputs it to merlin.chr. Use the random seed parameter, -r, to sample a different vector.
--sample:n
Repeats the sampling process n times for each family.
--all
List all possible haplotype vectors for each family in merlin.chr. Must be used with the --zero recombination option.
--founders
http://www.sph.umich.edu/csg/abecasis/Merlin/reference.html (4 of 8) [3/5/2003 11:51:24 AM]
MERLIN Quick Reference
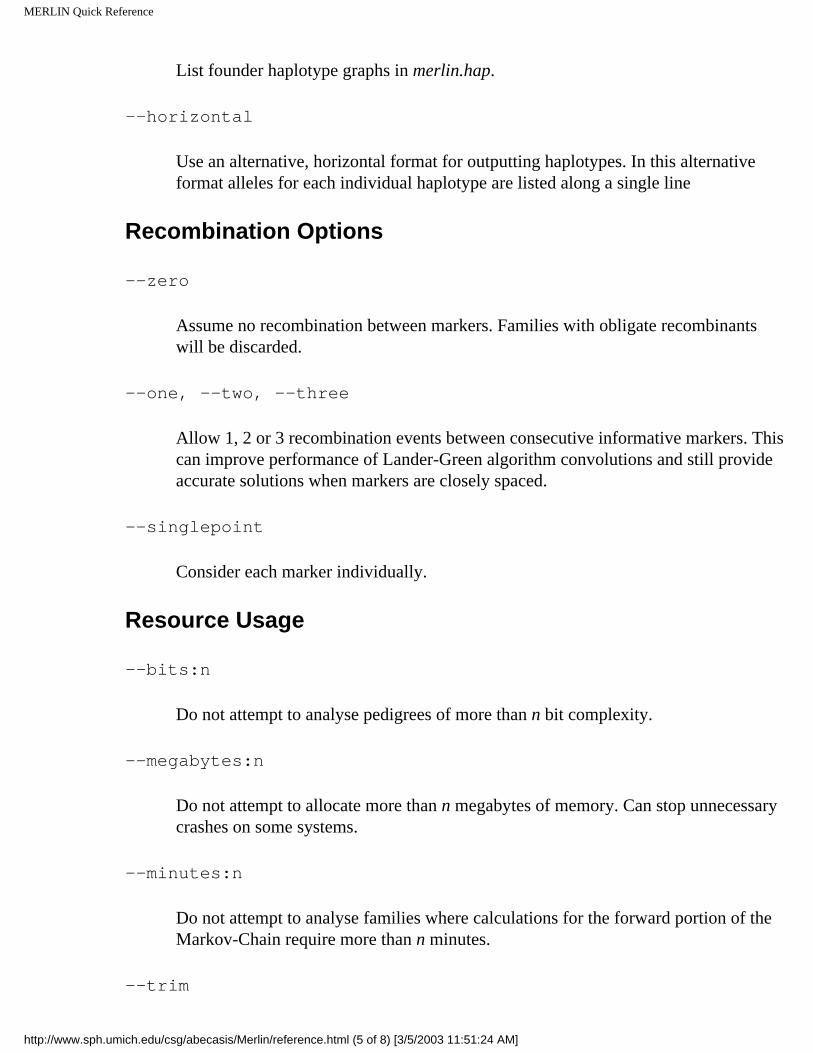
List founder haplotype graphs in merlin.hap.
--horizontal
Use an alternative, horizontal format for outputting haplotypes. In this alternative format alleles for each individual haplotype are listed along a single line
Recombination Options
--zero
Assume no recombination between markers. Families with obligate recombinants will be discarded.
--one, --two, --three
Allow 1, 2 or 3 recombination events between consecutive informative markers. This can improve performance of Lander-Green algorithm convolutions and still provide accurate solutions when markers are closely spaced.
--singlepoint
Consider each marker individually.
Resource Usage
--bits:n
Do not attempt to analyse pedigrees of more than n bit complexity.
--megabytes:n
Do not attempt to allocate more than n megabytes of memory. Can stop unnecessary crashes on some systems.
--minutes:n
Do not attempt to analyse families where calculations for the forward portion of the Markov-Chain require more than n minutes.
--trim
http://www.sph.umich.edu/csg/abecasis/Merlin/reference.html (5 of 8) [3/5/2003 11:51:24 AM]
MERLIN Quick Reference
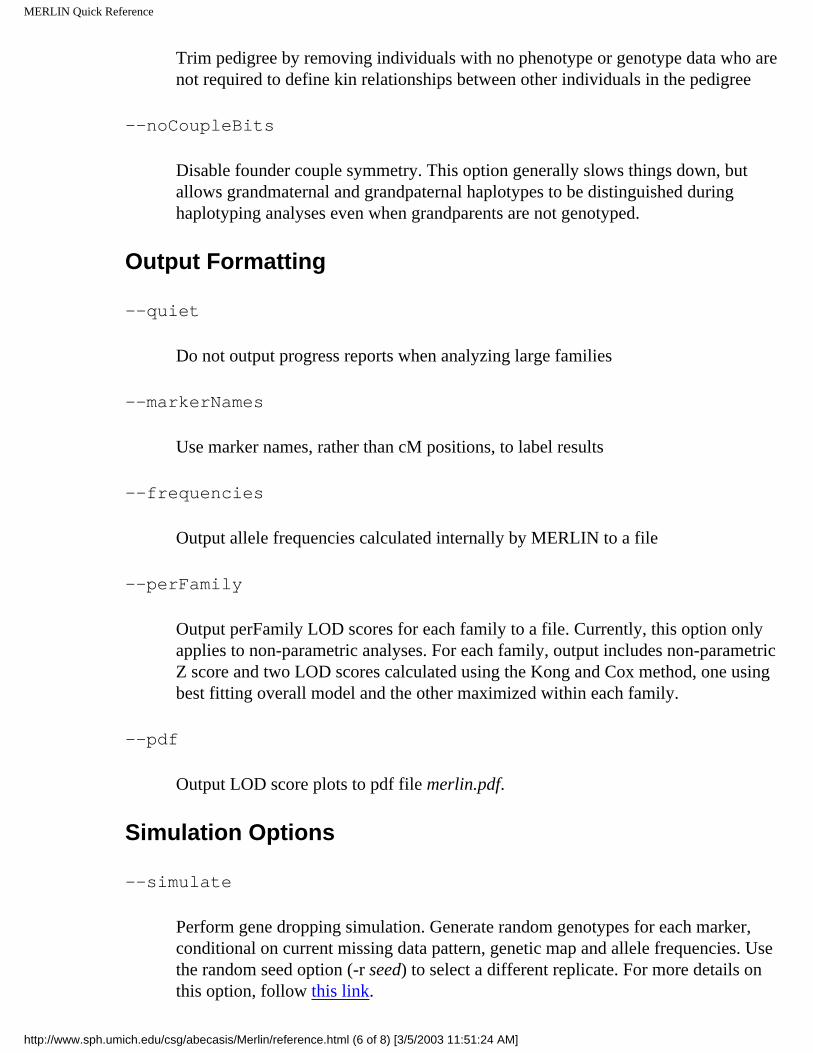
Trim pedigree by removing individuals with no phenotype or genotype data who are not required to define kin relationships between other individuals in the pedigree
--noCoupleBits
Disable founder couple symmetry. This option generally slows things down, but allows grandmaternal and grandpaternal haplotypes to be distinguished during haplotyping analyses even when grandparents are not genotyped.
Output Formatting
--quiet
Do not output progress reports when analyzing large families
--markerNames
Use marker names, rather than cM positions, to label results
--frequencies
Output allele frequencies calculated internally by MERLIN to a file
--perFamily
Output perFamily LOD scores for each family to a file. Currently, this option only applies to non-parametric analyses. For each family, output includes non-parametric Z score and two LOD scores calculated using the Kong and Cox method, one using best fitting overall model and the other maximized within each family.
Output LOD score plots to pdf file merlin.pdf.
Simulation Options
--simulate
Perform gene dropping simulation. Generate random genotypes for each marker, conditional on current missing data pattern, genetic map and allele frequencies. Use the random seed option (-r seed) to select a different replicate. For more details on this option, follow this link.
http://www.sph.umich.edu/csg/abecasis/Merlin/reference.html (6 of 8) [3/5/2003 11:51:24 AM]
MERLIN Quick Reference
--save
Save simulated pedigree and corresponding data, map and allele frequency files as merlin-replicate.ped, merlin-replicate.dat, merlin-replicate.map and merlin-replicate.freq, respectively.
Miscellaneous options
--simwalk2
Perform a smart linkage analysis in conjuction with Simwalk2. MERLIN tackles the small pedigrees, Simwalk2 does the larger ones, you get one answer. This option requires Mega2 version 2.3 or later and MERLIN version 0.9.2 or later. Please see the Mega2 Manual for more detailed information.
--swap
Use swap file to reduce memory usage.
Options marked * are currently available on a trial basis. They probably require careful validation, but they may still be useful.
MINX: Chromosome X Analyses
MINX (MERLIN in X) is an X-specific version of Merlin. It is available in distributions of MERLIN version 0.9.1 and later. There is currently no manuscript describing MINX performance and algorithms in detail. Although I believe MINX results to be correct, the methods are unpublished and I would advise using with care.
MINX implements X-chromosome specific versions of the functions provided by the standard Merlin implementation. Males are hemizogous and carry only one X chromosome. MINX assumes that males are scored as homozygous in the input pedigree file.
MERLIN-REGRESS: Pedigree Wide Regression Analysis
Sham et al. (Am J Hum Genet 71:238-253)
MERLIN-REGRESS implements an extension of the Haseman-Elston quantitative trait linkage analysis procedure that extracts linkage information from trait squared-sums and differences from all non-inbred relative pairs. For a detailed analytical description of this approach, please see the manuscript by Sham et al. (2000).
http://www.sph.umich.edu/csg/abecasis/Merlin/reference.html (7 of 8) [3/5/2003 11:51:24 AM]
MERLIN Quick Reference
This regression approach provides a powerful quantitative trait linkage test even in selected samples, but requires specification of the trait mean, variance and covariances between different relative pairs. The present implementation derives covariances between different types of relative pairs from their kinship coefficients and an estimate of the trait heritability.
Most of the MERLIN-REGRESS options are described above. The following are MERLIN-REGRESS specific options:
--mean:x
Mean for the trait under investigation in an (unselected) population. Misspecifying this parameter will generally result in decreased power.
--variance:x
Variance for the trait under investigation in an (unselected) population. Misspecifying this parameter will generally result in decreased power.
--heritability:x
Heritability for the trait under investigation in an (unselected) population. Underestimating the trait heritability can result in inflated error rates, so it is prudent to avoid setting this value too low.
--rankFamilies
Rank families according to their expected informativeness. This information can help focus genotyping efforts.
-t modelsFile
Specifies the name of a file listing alternative models for analysis. This should be a space delimited file where each line indicates a trait name, mean, variance and heritability. An example is available in the tutorial. When this table exists, the --mean, --variance and --heritability command line options are ignored.
University of Michigan | School of Public Health | Gonçalo Abecasis
http://www.sph.umich.edu/csg/abecasis/Merlin/reference.html (8 of 8) [3/5/2003 11:51:24 AM]
MERLIN Frequently Asked Questions
MERLIN
Home
Tutorial
Download
Register
Reference
FAQ
MERLIN - Frequently Asked Questions
1. How do I reference MERLIN?
To reference MERLIN, please cite: Abecasis GR, Cherny SS, Cookson WO and Cardon LR (2002). Merlin-rapid analysis of dense genetic maps using sparse gene flow trees. Nat Genet 30:97-101.
2. Why should I register my copy of MERLIN?
Well, all software programs are buggy... and MERLIN is probably no exception. If we find something wrong, we need your e-mail address to let you know. This information is also used to gauge the level of interest in the project and helps decide whether to invest time making MERLIN even better or, perhaps, go back to the lab and do some real work.
3. Do I need a license to use MERLIN?
MERLIN is available free for both commercial and non-commercial use, no license is required. However, note that no redistribution of the MERLIN source code or binaries is allowed. If you do use MERLIN, please register.
4. What is the meaning of a negative non-parametric LOD score?
A positive non-parametric LOD score indicates excess allele sharing among affected individuals (for discrete traits) or individuals with similar phenotypes (for quantitative traits). A negative non-parametric LOD score indicates less than expected allele sharing among these groups of individuals. Under the null, the average LOD score should be zero and an excess of negative LODs suggests that the data contain genotyping errors and/or misspecified relationships.
5. Can I send MERLIN output to a file?
To direct MERLIN output to a file, you can either redirect output to a file, with the ">" redirect operator, e.g.:
prompt> merlin -d datfile -p pedfile -m mapfile > outfile
Or, in standard Unix systems, pipe MERLIN output through tee:
prompt> merlin -d datfile -p pedfile -m mapfile | tee outfile
http://www.sph.umich.edu/csg/abecasis/Merlin/FAQ.html (1 of 3) [3/5/2003 11:51:25 AM]
MERLIN Frequently Asked Questions
To get output both to the screen and a file. When redirecting output, the --quietoption is recommended!
6. What are the different quantitative trait analysis options?
MERLIN supports three different types of analysis for quantitative traits:
❍ Variance components analyses (--vc option), can incorporate user-specified covariates (--useCovariate option), and are designed for unselected, normally distributed traits. For other phenotypes, their interpretation usually requires simulation.
❍ Pedigree wide regression analysis (implemented in MERLIN-REGRESS) is suitable for traits that are approximately normally distributed in the population, even after selection. This method requires specification of the trait mean, variance and heritability in the population. In large samples, the central limit theorem ensures good control of type I error even for non-normal samples.
❍ Non-parametric analyses (--qtl and --deviates options) look for excess sharing among individuals in the same tail of the trait distribution. These analyses make no assumptions about the trait distribution and are the most widely applicable, but have low power for normally distributed traits. Within each family, more extreme individuals are given greater weight. A more detailed description of these two statistics is available.
7. What causes the message "SKIPPED: Requires impossible recombination pattern
This message appears when the pedigree likelihood becomes zero. The most likely causes are that a recombination event was observed between two markers separated by a recombination fraction of zero or that, when an approximate solution is requested, the number of recombinants between consecutive markers in a pedigree exceeds the user specified limit.
8. How does the --simulate option work?
This options generates random marker data through gene dropping simulations. Details are provided in the Merlin reference.
9. Can MERLIN carry out chromosome X analyses?
To carry out chromosome X analysis you should run MINX (MERLIN in X), a separate executable which is included with MERLIN version 0.9.1 and above. Presently, MINX is unpublished but believed to be correct. Use with care.
10. Is there a way to get the --perFamily results in merlin.lod organized by family, rather than by location?
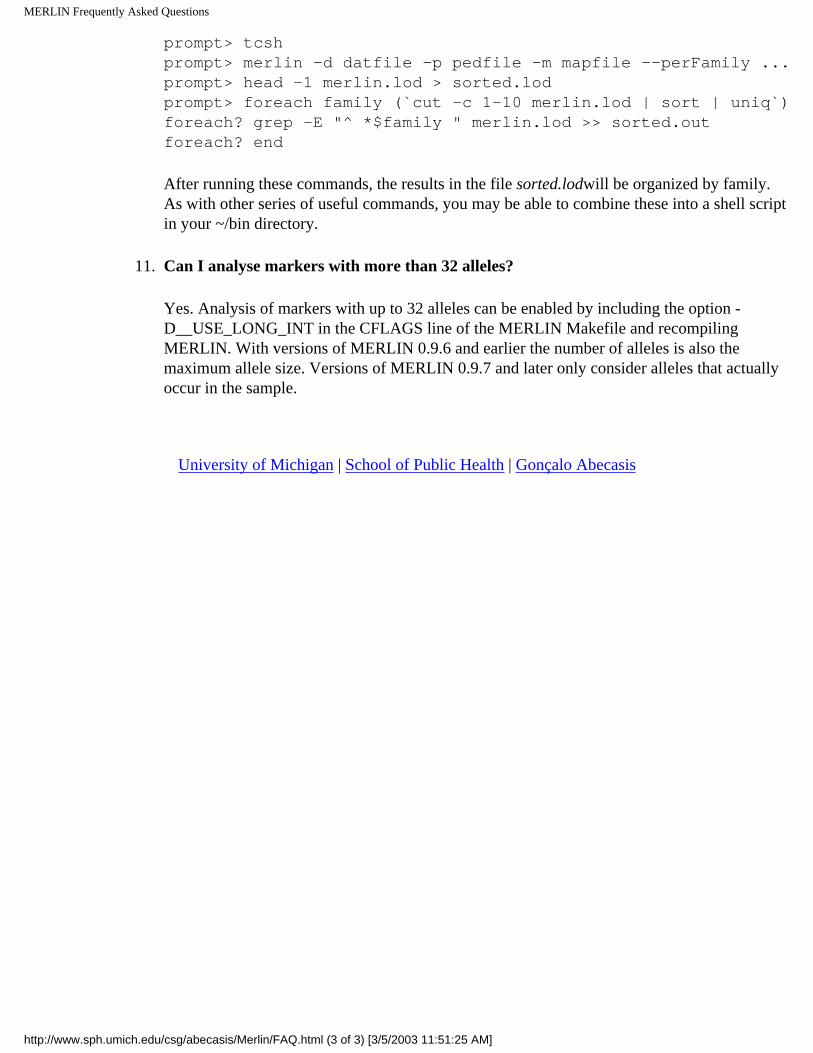
If you are running tcsh, and have the standard UNIX utilities cut, sort, head, uniq and grep installed in your system (these utilities are present in nearly all systems), you can try the following series of commands:
http://www.sph.umich.edu/csg/abecasis/Merlin/FAQ.html (2 of 3) [3/5/2003 11:51:25 AM]
MERLIN Frequently Asked Questions
prompt> tcsh prompt> merlin -d datfile -p pedfile -m mapfile --perFamily ... prompt> head -1 merlin.lod > sorted.lod prompt> foreach family (`cut -c 1-10 merlin.lod | sort | uniq`) foreach? grep -E "^ *$family " merlin.lod >> sorted.out foreach? end
After running these commands, the results in the file sorted.lodwill be organized by family. As with other series of useful commands, you may be able to combine these into a shell script in your ~/bin directory.
11. Can I analyse markers with more than 32 alleles?
Yes. Analysis of markers with up to 32 alleles can be enabled by including the option -D__USE_LONG_INT in the CFLAGS line of the MERLIN Makefile and recompiling MERLIN. With versions of MERLIN 0.9.6 and earlier the number of alleles is also the maximum allele size. Versions of MERLIN 0.9.7 and later only consider alleles that actually occur in the sample.
University of Michigan | School of Public Health | Gonçalo Abecasis
http://www.sph.umich.edu/csg/abecasis/Merlin/FAQ.html (3 of 3) [3/5/2003 11:51:25 AM]
MERLIN Tutorial -- Input File Formats
Tutorial
Home
Tutorial
Input Files
Linkage
Error Detection
Simulation
Haplotyping
IBD Estimation
Regression
MERLIN Input Files
MERLIN performs common pedigree analyses. Input files describe relationships between individuals in your dataset, store marker genotypes, disease status and quantitative traits and provide information on marker locations and allele frequencies.
MERLIN supports input files in either QTDT or LINKAGE format. Although the two formats are very similar, in the discussion below we will focus on QTDT format.
Describing Relationships Between Individuals
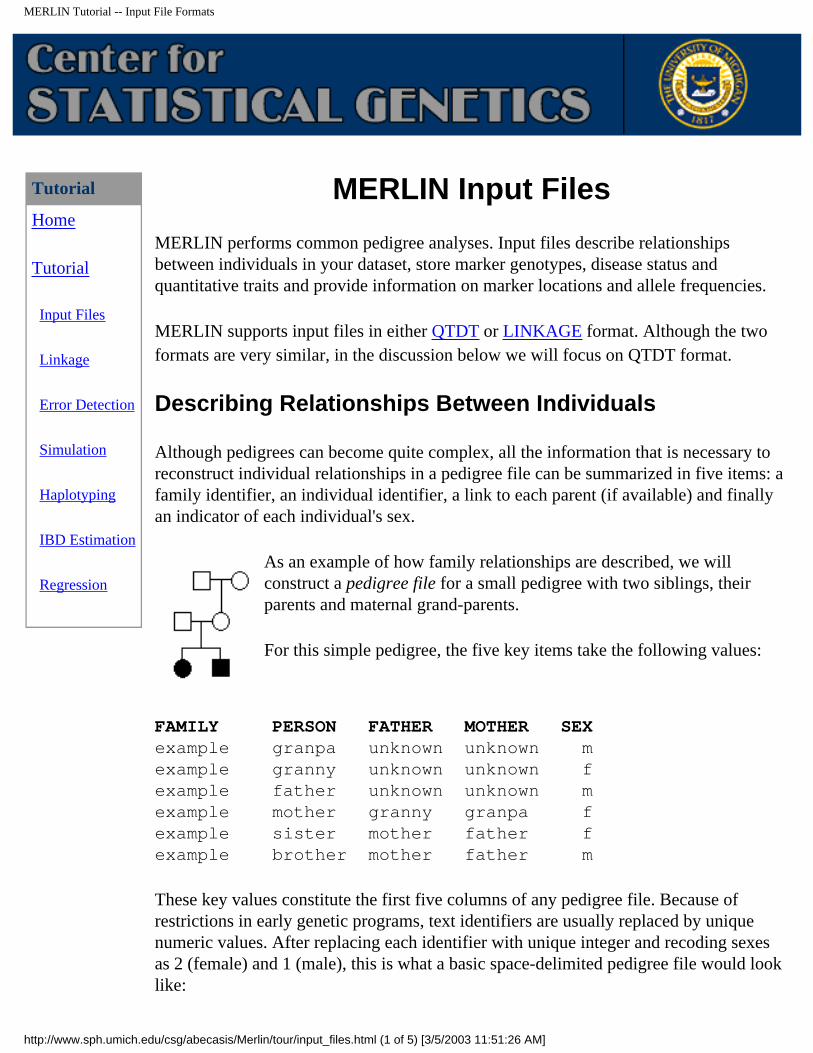
Although pedigrees can become quite complex, all the information that is necessary to reconstruct individual relationships in a pedigree file can be summarized in five items: a family identifier, an individual identifier, a link to each parent (if available) and finally an indicator of each individual's sex.
As an example of how family relationships are described, we will construct a pedigree file for a small pedigree with two siblings, their parents and maternal grand-parents.
For this simple pedigree, the five key items take the following values:
FAMILY PERSON FATHER MOTHER SEXexample granpa unknown unknown mexample granny unknown unknown fexample father unknown unknown mexample mother granny granpa fexample sister mother father fexample brother mother father m
These key values constitute the first five columns of any pedigree file. Because of restrictions in early genetic programs, text identifiers are usually replaced by unique numeric values. After replacing each identifier with unique integer and recoding sexes as 2 (female) and 1 (male), this is what a basic space-delimited pedigree file would look like:
http://www.sph.umich.edu/csg/abecasis/Merlin/tour/input_files.html (1 of 5) [3/5/2003 11:51:26 AM]

MERLIN Tutorial -- Input File Formats
<contents of basic.ped>1 1 0 0 11 2 0 0 21 3 0 0 11 4 1 2 21 5 3 4 21 6 3 4 1<end of basic.ped>
A pedigree file can include multiple families. Each family can have a unique structure, independent of other families in the dataset.
Describing Phenotypes and Genotypes
Usually the five standard columns are followed by various types of genetic data, including phenotypes for discrete and quantitative traits and marker genotypes.
Disease status is usually encoded in a single column as
U or 1 for unaffecteds, A or 2 for affecteds, and X or 0 for missing phenotypes.
Quantitative traits are encoded as numeric values with X denoting missing values (it is also possible to use a peculiar numeric value to flag missing phenotypes, but the procedure is prone to error and not recommended).
Marker genotypes are encoded as two consecutive integers, one for each allele, optionally separated by a "/". To denote missing alleles, either a 0 or an X can be used. The following are all valid genotype entries 1/1 (homozygote for allele 1), 0/0 (missing genotype), and 3 4 (heterozygote for alleles 3 and 4). For the X chromosome, males should be encoded as if they had two identical alleles.
This is what the previous pedigree file might look like after adding a column for disease status, measurements for a quantitative trait and genotypes for two markers:
<contents of basic2.ped>1 1 0 0 1 1 x 3 3 x x1 2 0 0 2 1 x 4 4 x x1 3 0 0 1 1 x 1 2 x x1 4 1 2 2 1 x 4 3 x x1 5 3 4 2 2 1.234 1 3 2 21 6 3 4 1 2 4.321 2 4 2 2
http://www.sph.umich.edu/csg/abecasis/Merlin/tour/input_files.html (2 of 5) [3/5/2003 11:51:26 AM]
MERLIN Tutorial -- Input File Formats
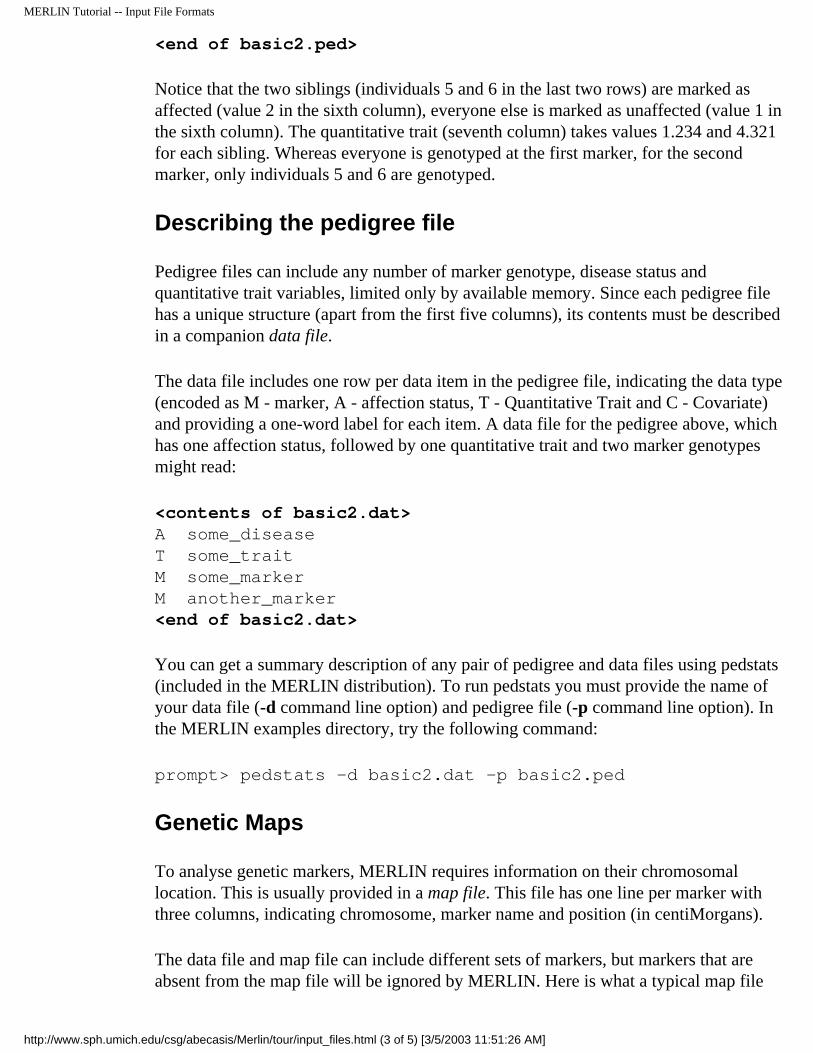
<end of basic2.ped>
Notice that the two siblings (individuals 5 and 6 in the last two rows) are marked as affected (value 2 in the sixth column), everyone else is marked as unaffected (value 1 in the sixth column). The quantitative trait (seventh column) takes values 1.234 and 4.321 for each sibling. Whereas everyone is genotyped at the first marker, for the second marker, only individuals 5 and 6 are genotyped.
Describing the pedigree file
Pedigree files can include any number of marker genotype, disease status and quantitative trait variables, limited only by available memory. Since each pedigree file has a unique structure (apart from the first five columns), its contents must be described in a companion data file.
The data file includes one row per data item in the pedigree file, indicating the data type (encoded as M - marker, A - affection status, T - Quantitative Trait and C - Covariate) and providing a one-word label for each item. A data file for the pedigree above, which has one affection status, followed by one quantitative trait and two marker genotypes might read:
<contents of basic2.dat>A some_diseaseT some_traitM some_markerM another_marker<end of basic2.dat>
You can get a summary description of any pair of pedigree and data files using pedstats (included in the MERLIN distribution). To run pedstats you must provide the name of your data file (-d command line option) and pedigree file (-p command line option). In the MERLIN examples directory, try the following command:
prompt> pedstats -d basic2.dat -p basic2.ped
Genetic Maps
To analyse genetic markers, MERLIN requires information on their chromosomal location. This is usually provided in a map file. This file has one line per marker with three columns, indicating chromosome, marker name and position (in centiMorgans).
The data file and map file can include different sets of markers, but markers that are absent from the map file will be ignored by MERLIN. Here is what a typical map file
http://www.sph.umich.edu/csg/abecasis/Merlin/tour/input_files.html (3 of 5) [3/5/2003 11:51:26 AM]

MERLIN Tutorial -- Input File Formats
looks like:
<contents of basic2.map>CHROMOSOME MARKER LOCATION24 some_marker 123.424 another_marker 136.2<end of basic2.map>
Using separate data and map files makes for a very simple file structure and allows MERLIN to analyse multiple chromosomes in a single run.
Allele Frequency Files
LINKAGE format data files specify the number of alleles at each locus and their frequencies. When using QTDT format input files, MERLIN estimates allele frequencies by counting alleles across all individuals. If this is inappropriate for the analysis at hand you can request equal allele frequencies or estimates derived by counting among founders only (-fe and -ff command-line options, respectively) or provide a custom allele frequency file (-f filename option).
A custom allele frequency file indicates allele frequencies for all marker alleles at each marker. For each marker, a single header line naming the marker is followed by a list of allele frequencies, which can take multiple lines.
Each header line is labelled M and includes the marker name. This header is followed by a list of allele frequencies. There are two alternative formats for lines in the allele frequency list:
Classic formatLines in the allele frequency list are labelled F and list frequencies for all alleles consecutively, starting with allele 1. This format is convenient for markers with a small number of alleles.
Extended formatLines in the allele frequency list are labelled A and consist of a numeric allele label followed by an allele frequency. Alleles that are not specifically listed are assumed to have frequency zero.
Classic Allele Frequency Format
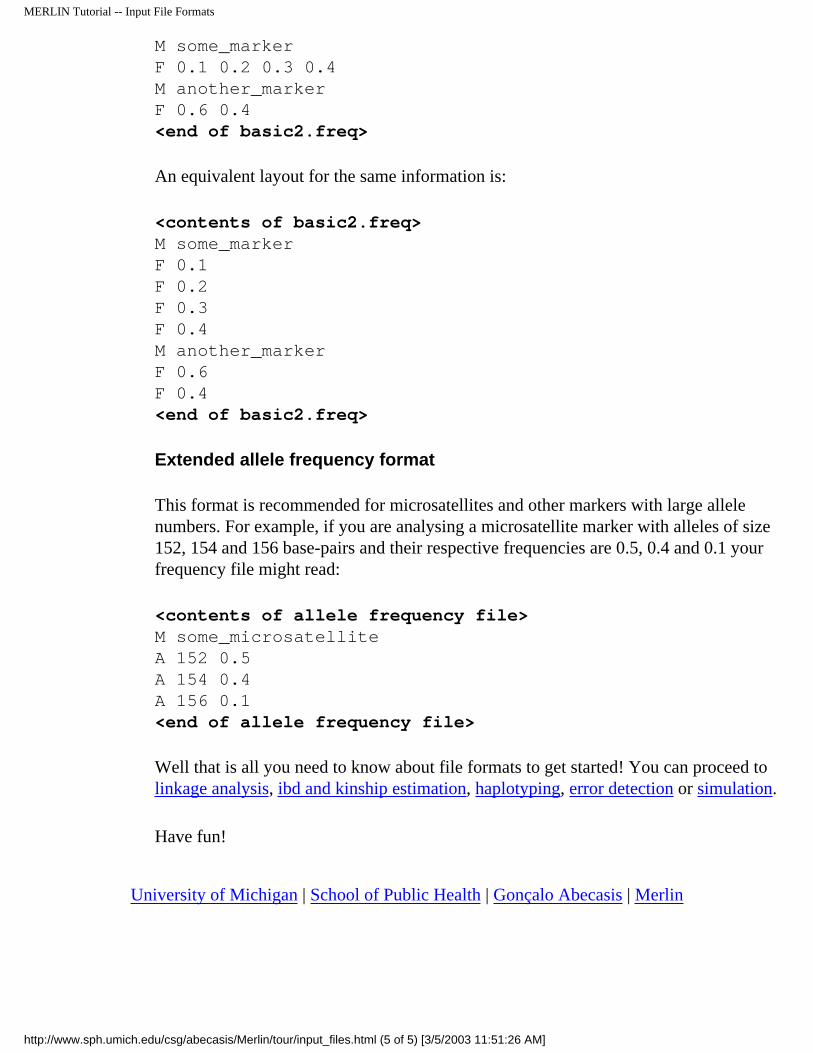
For example, if some_marker has four alleles with frequencies 0.1, 0.2, 0.3 and 0.4 respectively and another_marker has two alleles with frequencies 0.6 and 0.4 this is what the file might look like:
<contents of basic2.freq>
http://www.sph.umich.edu/csg/abecasis/Merlin/tour/input_files.html (4 of 5) [3/5/2003 11:51:26 AM]
MERLIN Tutorial -- Input File Formats
M some_markerF 0.1 0.2 0.3 0.4M another_markerF 0.6 0.4<end of basic2.freq>
An equivalent layout for the same information is:
<contents of basic2.freq>M some_markerF 0.1F 0.2F 0.3F 0.4M another_markerF 0.6 F 0.4<end of basic2.freq>
Extended allele frequency format
This format is recommended for microsatellites and other markers with large allele numbers. For example, if you are analysing a microsatellite marker with alleles of size 152, 154 and 156 base-pairs and their respective frequencies are 0.5, 0.4 and 0.1 your frequency file might read:
<contents of allele frequency file>M some_microsatelliteA 152 0.5A 154 0.4A 156 0.1<end of allele frequency file>
Well that is all you need to know about file formats to get started! You can proceed to linkage analysis, ibd and kinship estimation, haplotyping, error detection or simulation.
Have fun!
University of Michigan | School of Public Health | Gonçalo Abecasis | Merlin
http://www.sph.umich.edu/csg/abecasis/Merlin/tour/input_files.html (5 of 5) [3/5/2003 11:51:26 AM]
MERLIN Tutorial - Linkage Analysis
Tutorial
Home
Tutorial
Input Files
Linkage
Error Detection
Simulation
Haplotyping
IBD Estimation
Regression
MERLIN Tutorial -- Linkage Analysis
Linkage analysis tests for co-segregation of a chromosomal region and a trait of interest. In this section, we will walk through a basic non-parametric and variance components linkage analysis using MERLIN.
For this example, we will use a simulated data set that you will find in the examples subdirectory of the MERLIN distribution or in the download page.
The dataset consists of a simulated 5-cM scan of chromosome 24 in 200 affected sib-pair families and is organized into 3 files, a data file (asp.dat), a pedigree file (asp.ped) and a map file (asp.map). An overview of MERLIN input files is available elsewhere.
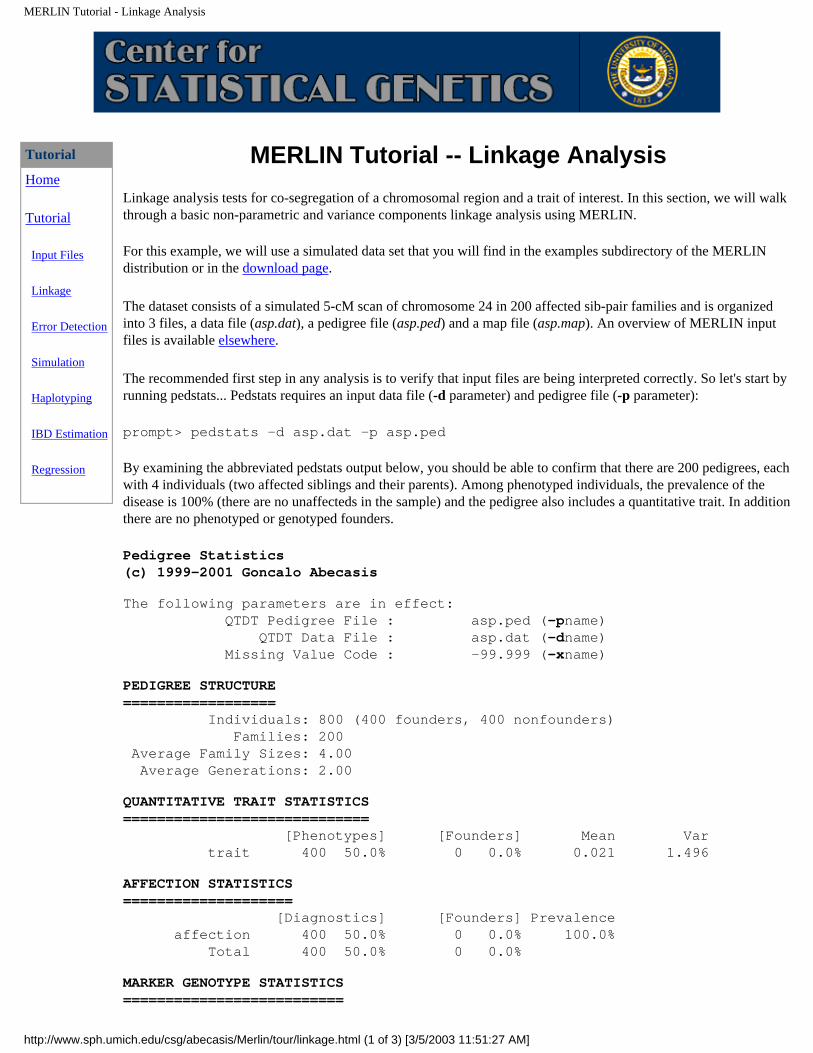
The recommended first step in any analysis is to verify that input files are being interpreted correctly. So let's start by running pedstats... Pedstats requires an input data file (-d parameter) and pedigree file (-p parameter):
prompt> pedstats -d asp.dat -p asp.ped
By examining the abbreviated pedstats output below, you should be able to confirm that there are 200 pedigrees, each with 4 individuals (two affected siblings and their parents). Among phenotyped individuals, the prevalence of the disease is 100% (there are no unaffecteds in the sample) and the pedigree also includes a quantitative trait. In addition there are no phenotyped or genotyped founders.
Pedigree Statistics(c) 1999-2001 Goncalo Abecasis
The following parameters are in effect: QTDT Pedigree File : asp.ped (-pname) QTDT Data File : asp.dat (-dname) Missing Value Code : -99.999 (-xname)
PEDIGREE STRUCTURE================== Individuals: 800 (400 founders, 400 nonfounders) Families: 200 Average Family Sizes: 4.00 Average Generations: 2.00
QUANTITATIVE TRAIT STATISTICS============================= [Phenotypes] [Founders] Mean Var trait 400 50.0% 0 0.0% 0.021 1.496
AFFECTION STATISTICS==================== [Diagnostics] [Founders] Prevalence affection 400 50.0% 0 0.0% 100.0% Total 400 50.0% 0 0.0%
MARKER GENOTYPE STATISTICS==========================
http://www.sph.umich.edu/csg/abecasis/Merlin/tour/linkage.html (1 of 3) [3/5/2003 11:51:27 AM]
MERLIN Tutorial - Linkage Analysis
[Genotypes] [Founders] Hetero MRK1 400 50.0% 0 0.0% 72.8% MRK2 400 50.0% 0 0.0% 73.2% (...statistics for other markers would appear here...) Total 8000 50.0% 0 0.0% 74.1%
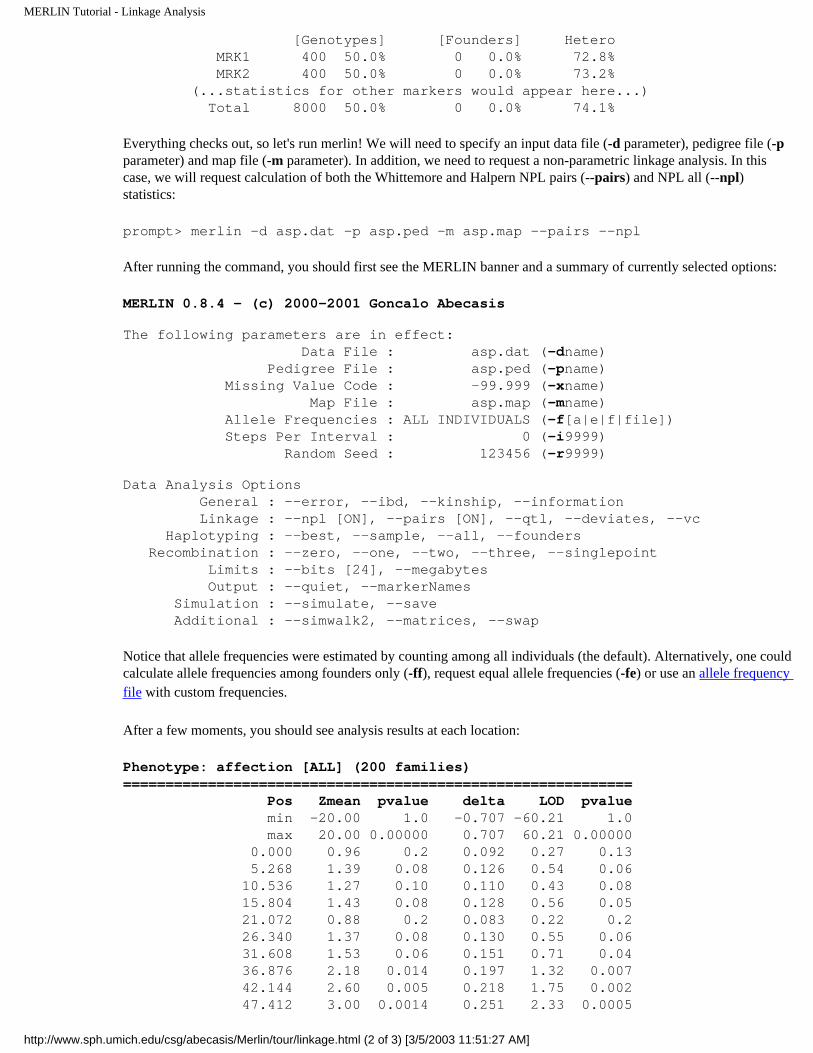
Everything checks out, so let's run merlin! We will need to specify an input data file (-d parameter), pedigree file (-p parameter) and map file (-m parameter). In addition, we need to request a non-parametric linkage analysis. In this case, we will request calculation of both the Whittemore and Halpern NPL pairs (--pairs) and NPL all (--npl) statistics:
prompt> merlin -d asp.dat -p asp.ped -m asp.map --pairs --npl
After running the command, you should first see the MERLIN banner and a summary of currently selected options:
MERLIN 0.8.4 - (c) 2000-2001 Goncalo Abecasis
The following parameters are in effect: Data File : asp.dat (-dname) Pedigree File : asp.ped (-pname) Missing Value Code : -99.999 (-xname) Map File : asp.map (-mname) Allele Frequencies : ALL INDIVIDUALS (-f[a|e|f|file]) Steps Per Interval : 0 (-i9999) Random Seed : 123456 (-r9999)
Data Analysis Options General : --error, --ibd, --kinship, --information Linkage : --npl [ON], --pairs [ON], --qtl, --deviates, --vc Haplotyping : --best, --sample, --all, --founders Recombination : --zero, --one, --two, --three, --singlepoint Limits : --bits [24], --megabytes Output : --quiet, --markerNames Simulation : --simulate, --save Additional : --simwalk2, --matrices, --swap
Notice that allele frequencies were estimated by counting among all individuals (the default). Alternatively, one could calculate allele frequencies among founders only (-ff), request equal allele frequencies (-fe) or use an allele frequency file with custom frequencies.
After a few moments, you should see analysis results at each location:
Phenotype: affection [ALL] (200 families)============================================================ Pos Zmean pvalue delta LOD pvalue min -20.00 1.0 -0.707 -60.21 1.0 max 20.00 0.00000 0.707 60.21 0.00000 0.000 0.96 0.2 0.092 0.27 0.13 5.268 1.39 0.08 0.126 0.54 0.06 10.536 1.27 0.10 0.110 0.43 0.08 15.804 1.43 0.08 0.128 0.56 0.05 21.072 0.88 0.2 0.083 0.22 0.2 26.340 1.37 0.08 0.130 0.55 0.06 31.608 1.53 0.06 0.151 0.71 0.04 36.876 2.18 0.014 0.197 1.32 0.007 42.144 2.60 0.005 0.218 1.75 0.002 47.412 3.00 0.0014 0.251 2.33 0.0005
http://www.sph.umich.edu/csg/abecasis/Merlin/tour/linkage.html (2 of 3) [3/5/2003 11:51:27 AM]
MERLIN Tutorial - Linkage Analysis
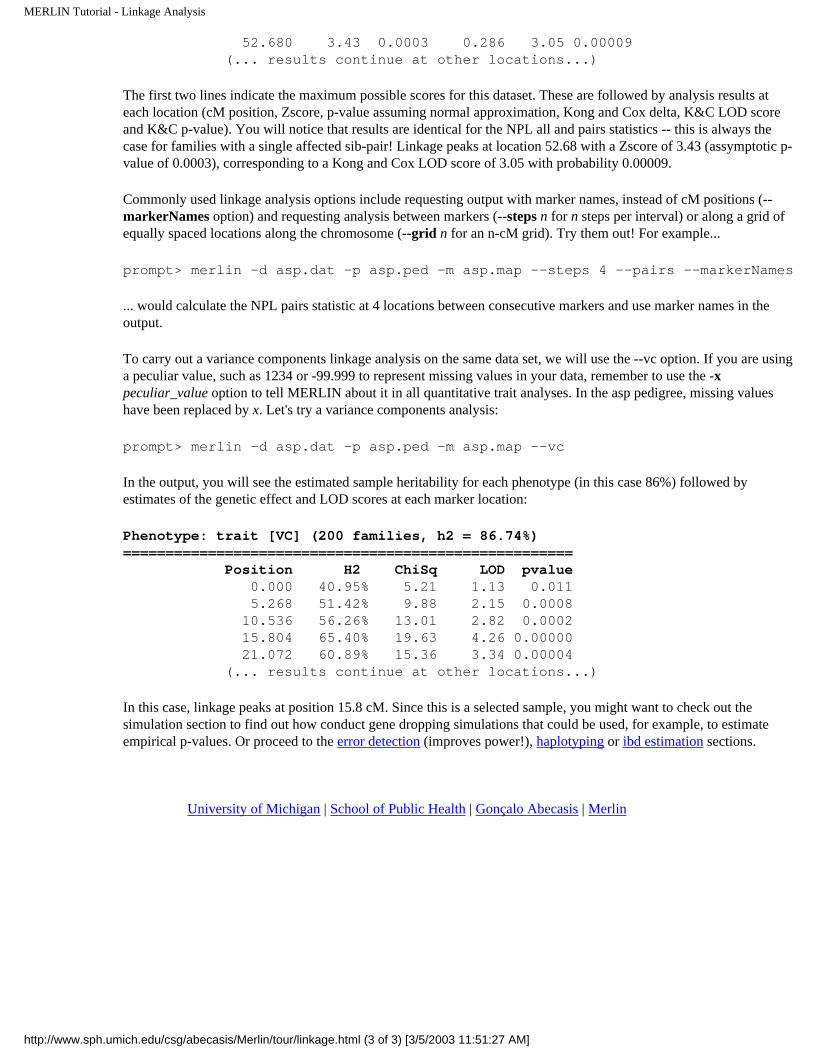
52.680 3.43 0.0003 0.286 3.05 0.00009 (... results continue at other locations...)
The first two lines indicate the maximum possible scores for this dataset. These are followed by analysis results at each location (cM position, Zscore, p-value assuming normal approximation, Kong and Cox delta, K&C LOD score and K&C p-value). You will notice that results are identical for the NPL all and pairs statistics -- this is always the case for families with a single affected sib-pair! Linkage peaks at location 52.68 with a Zscore of 3.43 (assymptotic p-value of 0.0003), corresponding to a Kong and Cox LOD score of 3.05 with probability 0.00009.
Commonly used linkage analysis options include requesting output with marker names, instead of cM positions (--markerNames option) and requesting analysis between markers (--steps n for n steps per interval) or along a grid of equally spaced locations along the chromosome (--grid n for an n-cM grid). Try them out! For example...
prompt> merlin -d asp.dat -p asp.ped -m asp.map --steps 4 --pairs --markerNames
... would calculate the NPL pairs statistic at 4 locations between consecutive markers and use marker names in the output.
To carry out a variance components linkage analysis on the same data set, we will use the --vc option. If you are using a peculiar value, such as 1234 or -99.999 to represent missing values in your data, remember to use the -x peculiar_value option to tell MERLIN about it in all quantitative trait analyses. In the asp pedigree, missing values have been replaced by x. Let's try a variance components analysis:
prompt> merlin -d asp.dat -p asp.ped -m asp.map --vc
In the output, you will see the estimated sample heritability for each phenotype (in this case 86%) followed by estimates of the genetic effect and LOD scores at each marker location:
Phenotype: trait [VC] (200 families, h2 = 86.74%)===================================================== Position H2 ChiSq LOD pvalue 0.000 40.95% 5.21 1.13 0.011 5.268 51.42% 9.88 2.15 0.0008 10.536 56.26% 13.01 2.82 0.0002 15.804 65.40% 19.63 4.26 0.00000 21.072 60.89% 15.36 3.34 0.00004 (... results continue at other locations...)
In this case, linkage peaks at position 15.8 cM. Since this is a selected sample, you might want to check out the simulation section to find out how conduct gene dropping simulations that could be used, for example, to estimate empirical p-values. Or proceed to the error detection (improves power!), haplotyping or ibd estimation sections.
University of Michigan | School of Public Health | Gonçalo Abecasis | Merlin
http://www.sph.umich.edu/csg/abecasis/Merlin/tour/linkage.html (3 of 3) [3/5/2003 11:51:27 AM]

MERLIN Tutorial - Error detection
Tutorial
Home
Tutorial
Input Files
Linkage
Error Detection
Simulation
Haplotyping
IBD Estimation
Regression
MERLIN Tutorial -- Error detection
Genotyping errors can lead to misleading inferences about gene flow in pedigrees and greatly reduce the effectiveness of pedigree analysis. In this section, we will use MERLIN to conduct a sensitivity analysis of the likelihood and identify problem genotypes.
You can find the simulated data set for this section in the examples subdirectory of the MERLIN distribution or in the download page.
The dataset consists of a simulated 5-cM scan of chromosome 24 in 200 affected sib-pair families and is organized into 3 files, a data file (error.dat), a pedigree file (error.ped) and a map file (error.map). An overview of MERLIN input files is available elsewhere.
How does error detection work?
Before conducting the error detection analysis, we will review the basic principles behind it. Consider the simple pedigree to the left, with two siblings genotyped at several markers. Since their genotypes are identical at all markers, it seems quite likely that they share the stretch of chromosome under investigation.
Now, consider what happens if we change the genotype for a single marker (indicated by the red circle)... This marker now contradicts information provided by all others, indicating that perhaps one of the parents carried two nearly identical copies of the chromosome or two recombination events occurred.
In the first example, inference about inheritance is relatively consistent at all markers, while in the second example inference about inheritance is strongly influenced by the single genotype. Intuitively, the first outcome seems much more plausible.
MERLIN finds genotypes that provide information about gene flow in a pedigree that contradicts information provided by other available data. MERLIN considers all available data simultaneously (not just pairs of individuals) so that error detection improves in accuracy in larger pedigrees. Genotypes flagged by MERLIN are likely to be errors and are certainly worth
http://www.sph.umich.edu/csg/abecasis/Merlin/tour/error.html (1 of 3) [3/5/2003 11:51:32 AM]
MERLIN Tutorial - Error detection
checking!
Error detection using MERLIN
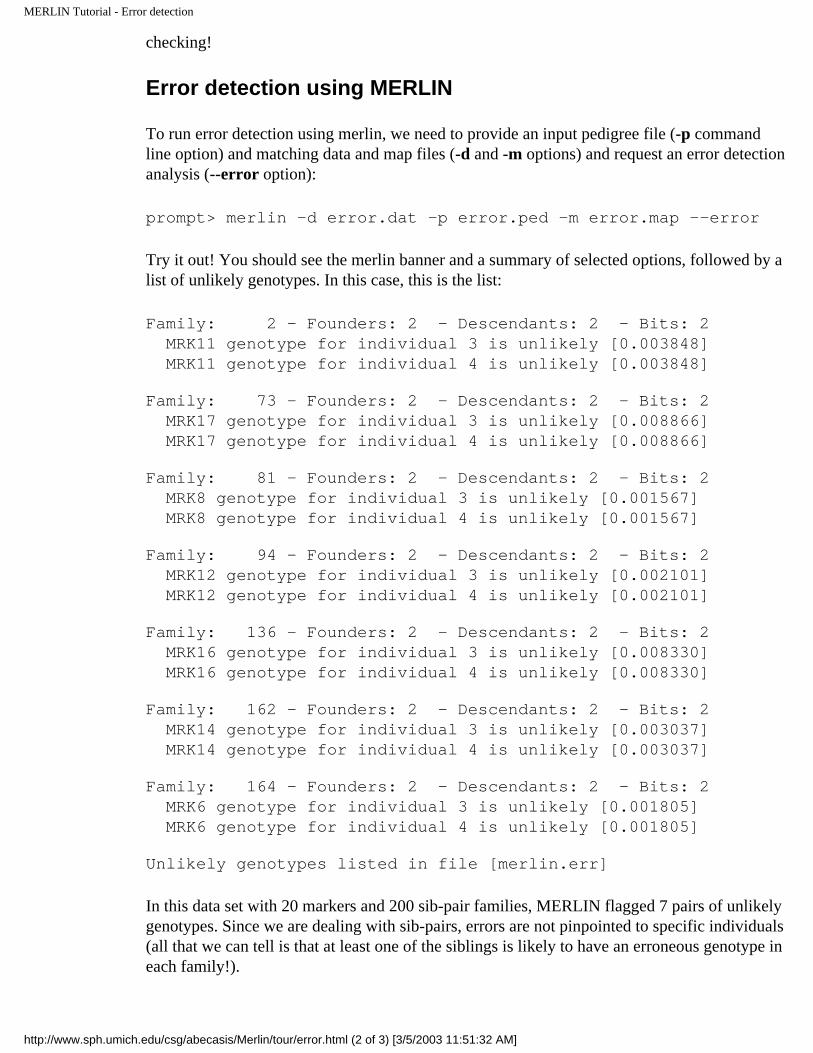
To run error detection using merlin, we need to provide an input pedigree file (-p command line option) and matching data and map files (-d and -m options) and request an error detection analysis (--error option):
prompt> merlin -d error.dat -p error.ped -m error.map --error
Try it out! You should see the merlin banner and a summary of selected options, followed by a list of unlikely genotypes. In this case, this is the list:
Family: 2 - Founders: 2 - Descendants: 2 - Bits: 2 MRK11 genotype for individual 3 is unlikely [0.003848] MRK11 genotype for individual 4 is unlikely [0.003848]
Family: 73 - Founders: 2 - Descendants: 2 - Bits: 2 MRK17 genotype for individual 3 is unlikely [0.008866] MRK17 genotype for individual 4 is unlikely [0.008866]
Family: 81 - Founders: 2 - Descendants: 2 - Bits: 2 MRK8 genotype for individual 3 is unlikely [0.001567] MRK8 genotype for individual 4 is unlikely [0.001567]
Family: 94 - Founders: 2 - Descendants: 2 - Bits: 2 MRK12 genotype for individual 3 is unlikely [0.002101] MRK12 genotype for individual 4 is unlikely [0.002101]
Family: 136 - Founders: 2 - Descendants: 2 - Bits: 2 MRK16 genotype for individual 3 is unlikely [0.008330] MRK16 genotype for individual 4 is unlikely [0.008330]
Family: 162 - Founders: 2 - Descendants: 2 - Bits: 2 MRK14 genotype for individual 3 is unlikely [0.003037] MRK14 genotype for individual 4 is unlikely [0.003037]
Family: 164 - Founders: 2 - Descendants: 2 - Bits: 2 MRK6 genotype for individual 3 is unlikely [0.001805] MRK6 genotype for individual 4 is unlikely [0.001805]
Unlikely genotypes listed in file [merlin.err]
In this data set with 20 markers and 200 sib-pair families, MERLIN flagged 7 pairs of unlikely genotypes. Since we are dealing with sib-pairs, errors are not pinpointed to specific individuals (all that we can tell is that at least one of the siblings is likely to have an erroneous genotype in each family!).
http://www.sph.umich.edu/csg/abecasis/Merlin/tour/error.html (2 of 3) [3/5/2003 11:51:32 AM]

MERLIN Tutorial - Error detection
In a real-life setting it would be worthwhile re-checking genotype assays for these individuals. In this case, we will simply run pedwipe to erase genotypes that are flagged as problematic. Run:
prompt> pedwipe -d error.dat -p error.ped
Pedwipe retrieves a list of unlikely genotypes from the merlin.err file and removes them from the data. A new set of data and pedigree files is created, named wiped.dat and wiped.ped. You can get a feel for the impact of these 7 problematic genotypes on linkage analysis by running a non-parametric linkage analysis before and after their removal:
prompt> merlin -d error.dat -p error.ped -m error.map --npl (...excerpt of results before removing problematic genotypes...)Phenotype: affection [ALL] (200 families)============================================================ Pos Zmean pvalue delta LOD pvalue 42.144 2.16 0.02 0.186 1.24 0.008 47.412 2.39 0.008 0.204 1.51 0.004 52.680 2.57 0.005 0.214 1.69 0.003 57.948 1.72 0.04 0.145 0.76 0.03 63.216 1.19 0.12 0.106 0.39 0.09 prompt> merlin -d wiped.dat -p wiped.ped -m error.map --npl (...excerpt of results after removing problematic genotypes...)Phenotype: affection [ALL] (200 families)============================================================ Pos Zmean pvalue delta LOD pvalue 42.144 2.24 0.012 0.191 1.32 0.007 47.412 2.48 0.007 0.209 1.60 0.003 52.680 2.87 0.002 0.237 2.10 0.0009 57.948 2.10 0.02 0.175 1.13 0.011 63.216 1.47 0.07 0.127 0.57 0.05
The seven problematic genotypes (out of 8,000 total genotypes), cause a 0.4 change in the Kong and Cox allele sharing LOD score! To learn about estimating false positive rates for error detection and linkage analysis you should proceed to the simulation section. Alternatively, you may want to learn more about linkage analysis, haplotyping or ibd estimation.
University of Michigan | School of Public Health | Gonçalo Abecasis | Merlin
http://www.sph.umich.edu/csg/abecasis/Merlin/tour/error.html (3 of 3) [3/5/2003 11:51:32 AM]
MERLIN Tutorial - Simulation
Tutorial
Home
Tutorial
Input Files
Linkage
Error Detection
Simulation
Haplotyping
IBD Estimation
Regression
MERLIN Tutorial -- Simulation
When interpreting results for pedigree analysis, it is extremely helpful to know how often a similar result might arise by chance. For example, in a linkage analysis it may be helpful to know how many peaks of similar height are expected conditional on the set of phenotypes being analysed and the available marker map. When investigating suspicious genotypes, it is important to characterize the false-positive rate for error detection procedures.
MERLIN has the ability to perform gene dropping simulations which replace input data with simulated chromosomes conditional on family structure and actual marker spacings and allele frequencies, as well as missing data patterns. The procedure for generating simulated data is described in the reference section.
For this example, we will use a data set from the examples subdirectory of the MERLIN distribution as input. You can also find the example data in the download page.
Estimating false positive rates for error detection
In the error detection tutorial, we identified 7 pairs of unlikely genotypes in a 20 marker, 5-cM scan, of 200 sib-pairs, corresponding to 8,000 total genotypes. The data is organized into three files, a pedigree file summarizing genotypes and relationships (error.ped), a data file describing the contents of the pedigree (error.dat) and map file providing marker locations (error.map).
To review a descriptive summary of the dataset, you could run pedstats:
prompt> pedstats -d error.dat -p error.ped
To review the original set of unlikely genotypes, you could use Merlin's automated error analysis:
prompt> merlin -d error.dat -m error.map -p error.ped --error
To estimate false positive rates, we will request that MERLIN analyse a simulated data set with identical allele frequencies and marker spacing by using the --simulate command line option. Try it out!
prompt> merlin -d error.dat -m error.map -p error.ped --error --simulate
You should first see the MERLIN start-up screen and summary of selected options. Note that the options --error and --simulate are selected. Note also that the current random seed is 123456. This seed indicates which simulated replicate will be used, and selecting a different seed produces an alternative simulated data set.
MERLIN 0.8.4 - (c) 2000-2001 Goncalo Abecasis
The following parameters are in effect: Data File : error.dat (-dname) Pedigree File : error.ped (-pname) Missing Value Code : -99.999 (-xname) Map File : asp.map (-mname)
http://www.sph.umich.edu/csg/abecasis/Merlin/tour/simulation.html (1 of 2) [3/5/2003 11:51:32 AM]

MERLIN Tutorial - Simulation
Allele Frequencies : ALL INDIVIDUALS (-f[a|e|f|file]) Steps Per Interval : 0 (-i9999) Random Seed : 123456 (-r9999)
Data Analysis Options General : --error [ON], --ibd, --kinship, --information Linkage : --npl, --pairs, --qtl, --deviates, --vc Haplotyping : --best, --sample, --all, --founders Recombination : --zero, --one, --two, --three, --singlepoint Limits : --bits [24], --megabytes Output : --quiet, --markerNames Simulation : --simulate [ON], --save Additional : --simwalk2, --matrices, --swap
This start-up screen should be followed by an error detection analysis for the replicate, which should indicate a single pair of unlikely genotypes:
Family: 38 - Founders: 2 - Descendants: 2 - Bits: 2 MRK6 genotype for individual 3 is unlikely [0.021855] MRK6 genotype for individual 4 is unlikely [0.021855]
So MERLIN flags a single pair of unlikely genotypes in this particular replicate... Is this typical of other replicates? One way to check is to repeat the above procedure with a different random seed. To do this, you will need to set the -r command line. The following command repeats the previous analysis but selects replicate 123:
prompt> merlin -d error.dat -m error.map -p error.ped --error --simul -r 123
In this manner, it is straight-forward to repeat any MERLIN analysis for simulated chromosomes and estimate false-positive rates for error detection or linkage analysis (note that MERLIN does not change input phenotypes and disease status when conducting simulations).
Now that you have seen how to generate simulated replicates, you could proceed to haplotype analysis or ibd estimation. If you haven't already done so, you could try the linkage or error detection tutorials.
University of Michigan | School of Public Health | Gonçalo Abecasis | Merlin
http://www.sph.umich.edu/csg/abecasis/Merlin/tour/simulation.html (2 of 2) [3/5/2003 11:51:32 AM]

MERLIN Tutorial - Haplotyping
Tutorial
Home
Tutorial
Input Files
Linkage
Error Detection
Simulation
Haplotyping
IBD Estimation
Regression
MERLIN Tutorial -- Haplotyping
Information about gene flow in a pedigree can be used to reconstruct likely haplotypes for families and individuals. In this section we will walk through some simple examples of how Merlin represents estimated haplotypes.
The sample input files used are in the examples subdirectory of the MERLIN distribution and are also available in the download page.
The first data set we will consider consists of very simple families, each with two parents and a single offspring genotyped for three SNP markers. The data is organized into three files: a pedigree file (haplo.ped), a data file (haplo.dat) and a map file (haplo.map).
Merlin has three haplotype estimation modes. It can either provide haplotypes corresponding to the most likely pattern of gene flow (--best command line option), sample gene flow patterns according to their likelihood (--sample) or provide all non-recombinant haplotypes (--zero --all). For this example, we will use the first option:
prompt> merlin -d haplo.dat -p haplo.ped -m haplo.map --best
Estimated haplotypes are in the merlin.chr output file. We will now examine this file in detail. For the first family, father and child are heterozygous at all markers, whereas the mother is homozygous for allele '1' at all loci.
<-- contents of merlin.chr output file -->
The first line names the family. In a trio family noinformation on recombination is available, and this familyis labelled uninformative.FAMILY 1 [Uninformative]
The next header line names individuals. Founders are labelledF and non-founders are followed by their parents' names in brackets. 1 (F) 2 (F) 3 (2,1)
The next lines provide haplotype pairs for each individual.Pairs are separated by a : if there is no information on recombination,by a | if they do not recombine, or a /, \, + if they recombinein the maternal, paternal or both chromosomes, respectively. 2 : 1 1 : 1 1 : 2 2 : 1 1 : 1 1 : 2 2 : 1 1 : 1 1 : 2
Output for the next family is similar, but you will notice that one chromosome carries an unknown allele
http://www.sph.umich.edu/csg/abecasis/Merlin/tour/haplotyping.html (1 of 2) [3/5/2003 11:51:33 AM]

MERLIN Tutorial - Haplotyping
which does not appear in any genotyped individuals. This is labelled by a ? (question mark).
FAMILY 2 [Uninformative]
1 (F) 2 (F) 3 (2,1) 2 : 2 1 : 1 1 : 2 2 : 1 1 : 1 1 : 2 2 : ? 1 : 1 1 : 2
The next family presents a trickier challenge! Although all individuals are genotyped, phase is uncertain for the third marker. Either the father transmits a "2-2-2" chromosome to the child and the mother a "1-1-1" chromosome, or the father transmits a "2-2-1" chromosome and the mother transmits a "1-1-2" chromosome.
Sets of related outcomes for a single marker are labelled with a unique letter by Merlin and two alternative haplotype choices. For each marker, selecting either the first allele in the set for all chromosomes, or else the second allele, defines haplotypes compatible with the same gene flow pattern. This is what the output looks like:
FAMILY 3 [Uninformative]
1 (F) 2 (F) 3 (2,1) 2 : 2 1 : 1 1 : 2 2 : 1 1 : 1 1 : 2 2,1A : A1,2 1,2A : A2,1 1,2A : A2,1
Now that you know how to read Merlin haplotype output, you could look at more complex examples (try to haplotype the data set gene.dat, gene.ped and gene.map) or proceed to other sections of the tutorial. Available topics include linkage analysis, error detection, ibd estimation and simulation.
University of Michigan | School of Public Health | Gonçalo Abecasis | Merlin
http://www.sph.umich.edu/csg/abecasis/Merlin/tour/haplotyping.html (2 of 2) [3/5/2003 11:51:33 AM]

MERLIN Tutorial - IBD and Kinship estimation
Tutorial
Home
Tutorial
Input Files
Linkage
Error Detection
Simulation
Haplotyping
IBD Estimation
Regression
MERLIN Tutorial -- IBD and Kinship estimation
Since there a finite number of alleles at most genetic loci, individuals may exhibit the same genotype at a particular locus but, nevertheless, carry distinct chromosomes. Information on allele frequencies and neighbouring markers can be used to estimate the probability that any two individuals actually inherited the same chromosome from founders in the pedigree.
MERLIN can estimate the number of alleles shared identical-by-descent among relatives in a pedigree, and summarize this information either as probabilities that a given pair will share 0, 1 or 2 alleles IBD or as the kinship coefficient between each pair at a particular locus.
Some programs require IBD estimates as input for their analysis. For example, QTDT tests for association using all phenotypes from related individuals and requires IBD matrices to distinguish between linkage and association.
For this example, we will use a simulated data set in that you will find in the examples subdirectory of the MERLIN distribution or in the download page.
The data set includes 50 families, each with 4 siblings, genotyped for 3 SNP markers and is also used in the QTDT tutorial. We will use MERLIN to estimate IBD for this data set in a format that is ready for use by QTDT.
You should already be familiar with input file formats. The data consists of a pedigree file (sibs.ped), which specifies individual relationships, genotypes and phenotypes. In addition, a map file (sibs.map) provides marker locations and a data file (sibs.dat) describes the data set.
As usual, it is always a good idea to check contents of input files by running pedstats:
prompt> pedstats -d sibs.dat -p sibs.ped
To calculate pairwise IBD matrices, we will use the --ibd command line option. Since MERLIN labels all results with chromosomal positions by default, we will also use the --markerNames option to request that output include the marker names which are required by QTDT. So, the command:
prompt> merlin -d sibs.dat -p sibs.ped -m sibs.map --markerNames --ibd
Will estimate IBD coefficients for all relative pairs and produce a merlin.ibd file ready for use by QTDT. Each line in merlin.ibd begins with a family identifier followed by identifiers for two individuals. This is followed by marker names and probabilities for sharing 0, 1 and 2 alleles IBD.
Commonly used options when estimating IBD coefficients include --singlepoint (which considers each marker independently) and --steps n (which requests analysis at n positions between markers) or the --grid k (which requests analysis every k cM along the chromosome).
http://www.sph.umich.edu/csg/abecasis/Merlin/tour/ibd.html (1 of 2) [3/5/2003 11:52:49 AM]

MERLIN Tutorial - IBD and Kinship estimation
Congratulations! You have reached the end of the Merlin tutorial. You may wish to review previous sections on input file formats, linkage analysis, error detection, simulation or haplotyping.
University of Michigan | School of Public Health | Gonçalo Abecasis | Merlin
http://www.sph.umich.edu/csg/abecasis/Merlin/tour/ibd.html (2 of 2) [3/5/2003 11:52:49 AM]
MERLIN Tutorial - QTL Regression Analysis
Tutorial
Home
Tutorial
Input Files
Linkage
Error Detection
Simulation
Haplotyping
IBD Estimation
Regression
MERLIN Tutorial -- QTL Regression Analysis
Quantitative trait linkage analyses examine whether a chromosomal region is responsible for some of the variation in a trait of interest. Here, we will describe how fast quantitative trait regression analyses can be carried out using MERLIN.
Data for this exercise
For this example, we will use a simulated data set that you will find in the examples subdirectory of the MERLIN distribution or in the download page.
The dataset consists of a simulated 5-cM scan of chromosome 24 in 200 sib-pair families and is organized into 3 files, a data file (asp.dat), a pedigree file (asp.ped) and a map file (asp.map). A quantitative trait has been scored for each offspring.
The recommended first step in any analysis is to verify that input files are being interpreted correctly. So let's start by running pedstats... Pedstats requires an input data file (-d parameter) and pedigree file (-p parameter):
prompt> pedstats -d asp.dat -p asp.ped
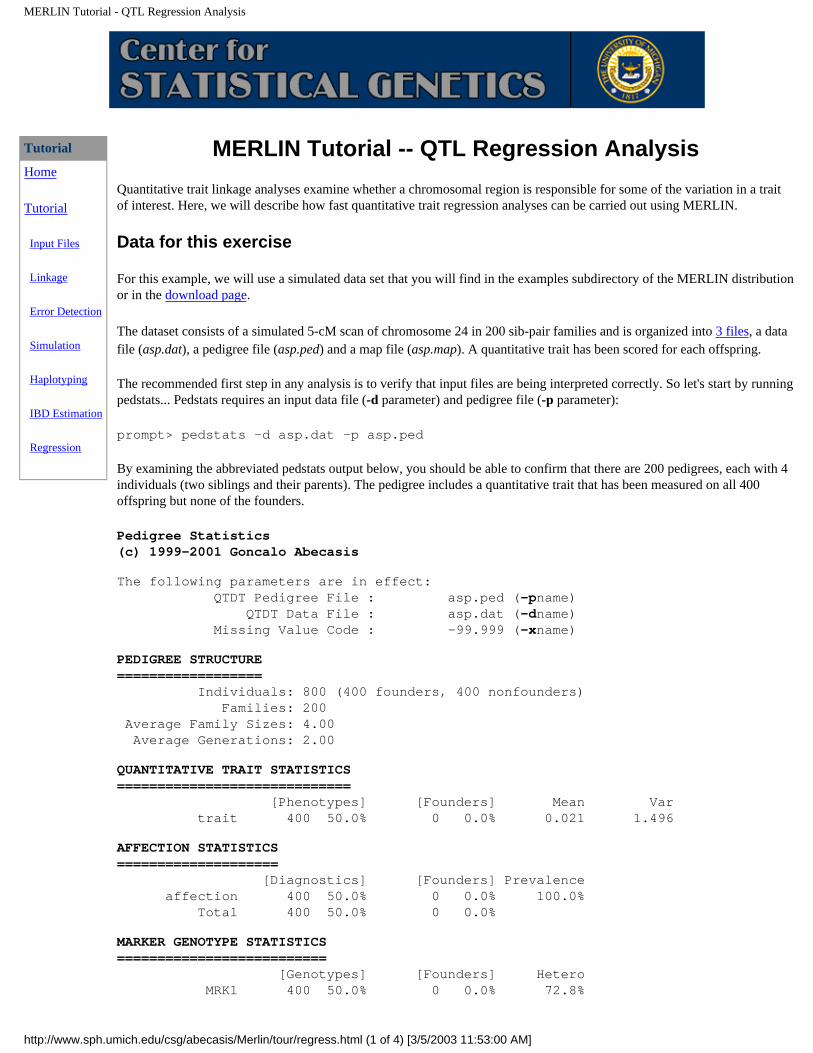
By examining the abbreviated pedstats output below, you should be able to confirm that there are 200 pedigrees, each with 4 individuals (two siblings and their parents). The pedigree includes a quantitative trait that has been measured on all 400 offspring but none of the founders.
Pedigree Statistics(c) 1999-2001 Goncalo Abecasis
The following parameters are in effect: QTDT Pedigree File : asp.ped (-pname) QTDT Data File : asp.dat (-dname) Missing Value Code : -99.999 (-xname)
PEDIGREE STRUCTURE================== Individuals: 800 (400 founders, 400 nonfounders) Families: 200 Average Family Sizes: 4.00 Average Generations: 2.00
QUANTITATIVE TRAIT STATISTICS============================= [Phenotypes] [Founders] Mean Var trait 400 50.0% 0 0.0% 0.021 1.496
AFFECTION STATISTICS==================== [Diagnostics] [Founders] Prevalence affection 400 50.0% 0 0.0% 100.0% Total 400 50.0% 0 0.0%
MARKER GENOTYPE STATISTICS========================== [Genotypes] [Founders] Hetero MRK1 400 50.0% 0 0.0% 72.8%
http://www.sph.umich.edu/csg/abecasis/Merlin/tour/regress.html (1 of 4) [3/5/2003 11:53:00 AM]
MERLIN Tutorial - QTL Regression Analysis
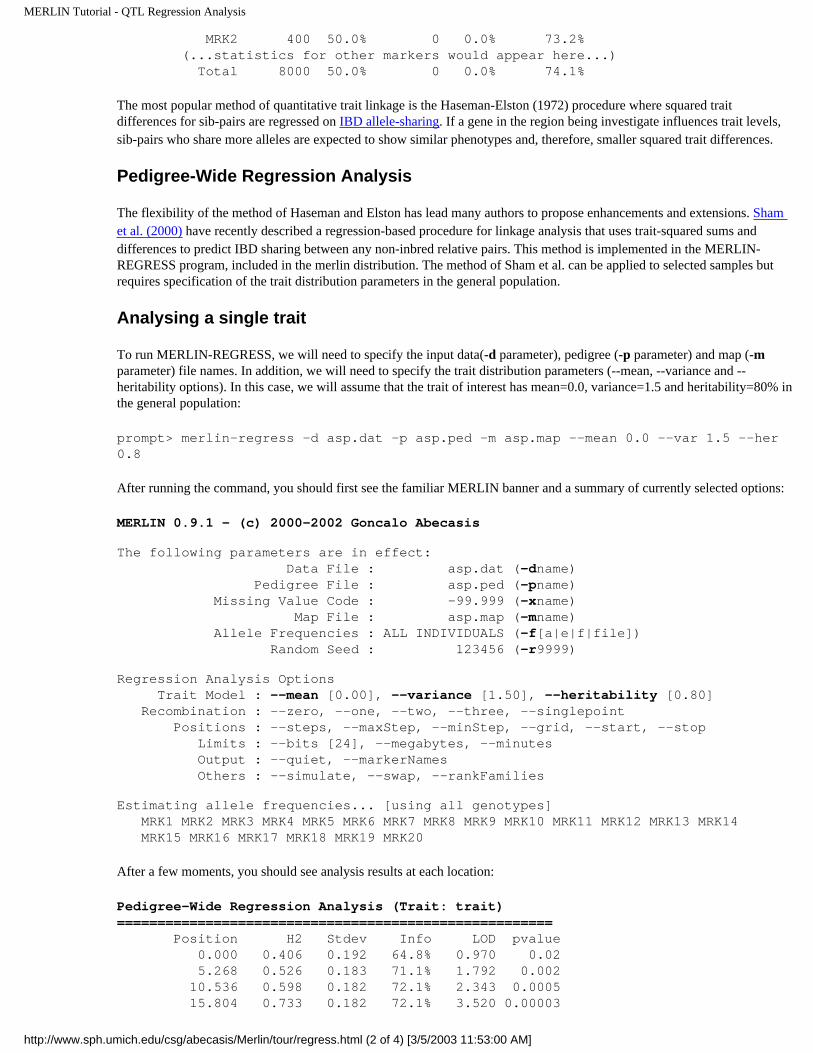
MRK2 400 50.0% 0 0.0% 73.2% (...statistics for other markers would appear here...) Total 8000 50.0% 0 0.0% 74.1%
The most popular method of quantitative trait linkage is the Haseman-Elston (1972) procedure where squared trait differences for sib-pairs are regressed on IBD allele-sharing. If a gene in the region being investigate influences trait levels, sib-pairs who share more alleles are expected to show similar phenotypes and, therefore, smaller squared trait differences.
Pedigree-Wide Regression Analysis
The flexibility of the method of Haseman and Elston has lead many authors to propose enhancements and extensions. Sham et al. (2000) have recently described a regression-based procedure for linkage analysis that uses trait-squared sums and differences to predict IBD sharing between any non-inbred relative pairs. This method is implemented in the MERLIN-REGRESS program, included in the merlin distribution. The method of Sham et al. can be applied to selected samples but requires specification of the trait distribution parameters in the general population.
Analysing a single trait
To run MERLIN-REGRESS, we will need to specify the input data(-d parameter), pedigree (-p parameter) and map (-m parameter) file names. In addition, we will need to specify the trait distribution parameters (--mean, --variance and --heritability options). In this case, we will assume that the trait of interest has mean=0.0, variance=1.5 and heritability=80% in the general population:
prompt> merlin-regress -d asp.dat -p asp.ped -m asp.map --mean 0.0 --var 1.5 --her 0.8
After running the command, you should first see the familiar MERLIN banner and a summary of currently selected options:
MERLIN 0.9.1 - (c) 2000-2002 Goncalo Abecasis
The following parameters are in effect: Data File : asp.dat (-dname) Pedigree File : asp.ped (-pname) Missing Value Code : -99.999 (-xname) Map File : asp.map (-mname) Allele Frequencies : ALL INDIVIDUALS (-f[a|e|f|file]) Random Seed : 123456 (-r9999)
Regression Analysis Options Trait Model : --mean [0.00], --variance [1.50], --heritability [0.80] Recombination : --zero, --one, --two, --three, --singlepoint Positions : --steps, --maxStep, --minStep, --grid, --start, --stop Limits : --bits [24], --megabytes, --minutes Output : --quiet, --markerNames Others : --simulate, --swap, --rankFamilies
Estimating allele frequencies... [using all genotypes] MRK1 MRK2 MRK3 MRK4 MRK5 MRK6 MRK7 MRK8 MRK9 MRK10 MRK11 MRK12 MRK13 MRK14 MRK15 MRK16 MRK17 MRK18 MRK19 MRK20
After a few moments, you should see analysis results at each location:
Pedigree-Wide Regression Analysis (Trait: trait)====================================================== Position H2 Stdev Info LOD pvalue 0.000 0.406 0.192 64.8% 0.970 0.02 5.268 0.526 0.183 71.1% 1.792 0.002 10.536 0.598 0.182 72.1% 2.343 0.0005 15.804 0.733 0.182 72.1% 3.520 0.00003
http://www.sph.umich.edu/csg/abecasis/Merlin/tour/regress.html (2 of 4) [3/5/2003 11:53:00 AM]

MERLIN Tutorial - QTL Regression Analysis
21.072 0.586 0.182 72.2% 2.255 0.0006 26.340 0.596 0.190 66.0% 2.135 0.0009 31.608 0.535 0.189 67.0% 1.744 0.002 36.876 0.522 0.184 70.6% 1.752 0.002 42.144 0.414 0.181 73.0% 1.137 0.011 47.412 0.295 0.175 77.5% 0.614 0.05(... results continue at other locations ...)
Successive columns indicate position along the chromosome (in CM), estimated locus specific heritability, standard deviation for the estimate of locus specific heritability, proportion of linkage information extracted at this location (100% information corresponds to the smallest possible confidence interval for estimated effect size), LOD score and corresponding p-value. In this case, linkage peaks at position 15.8 with an estimated locus specific heritability of 73.3% and a LOD score of 3.52 (probability 0.00003).
Estimating family informativeness
Another useful option in MERLIN-REGRESS is the ability to quantify the expected amount of linkage information in each family. This can be useful when focusing genotyping efforts (for example, by genotyping the most informative families first) or identifying problematic outliers (extreme outliers will lead to some families with very large weights which can reduce effective sample size in linkage analyses).
To estimate family informativeness, specify the trait distribution in the population (by specifying it's mean, variance and heritability) and use the --rankFamilies option. Using the example input files the command line would read:
prompt> merlin-regress -d asp.dat -p asp.ped --mean 0 --var 1.5 --her 0.8 --rank
Running this command would produce the familiar MERLIN output screen followed by a table looking like the one below:
Family Informativeness====================== Family Trait People Phenos Pairs Info ELOD20 1 trait 4 2 1 0.099 0.001 2 trait 4 2 1 0.025 0.000 3 trait 4 2 1 1.989 0.017 4 trait 4 2 1 0.269 0.002 5 trait 4 2 1 0.327 0.003(... additional rows follow for other families)
Each row indicates the family and trait of interest, followed by number of individuals and phenotypes in each family, the number of phenotyped relative pairs and the relative informativeness of the family. The final column indicates the expected LOD score for a region with a locus specific heritability of 20% when a fully informative marker is typed. In this case family 3 seems particularly informative (you can try and find out why by examining the phenotypes for each individual in the asp.ped pedigree file).
Expected LOD scores are proportional to the squared locus specific heritability. To calculate expected LOD scores for a different effect size, simply multiply the expected LOD score by (heritability/20)^2, where H2 denotes your desired effect size and ^2 denotes the square operator. For example, for an effect size of 40%, you should multiply each expected LOD score by 4.
Comparing trait models and analysing multiple traits
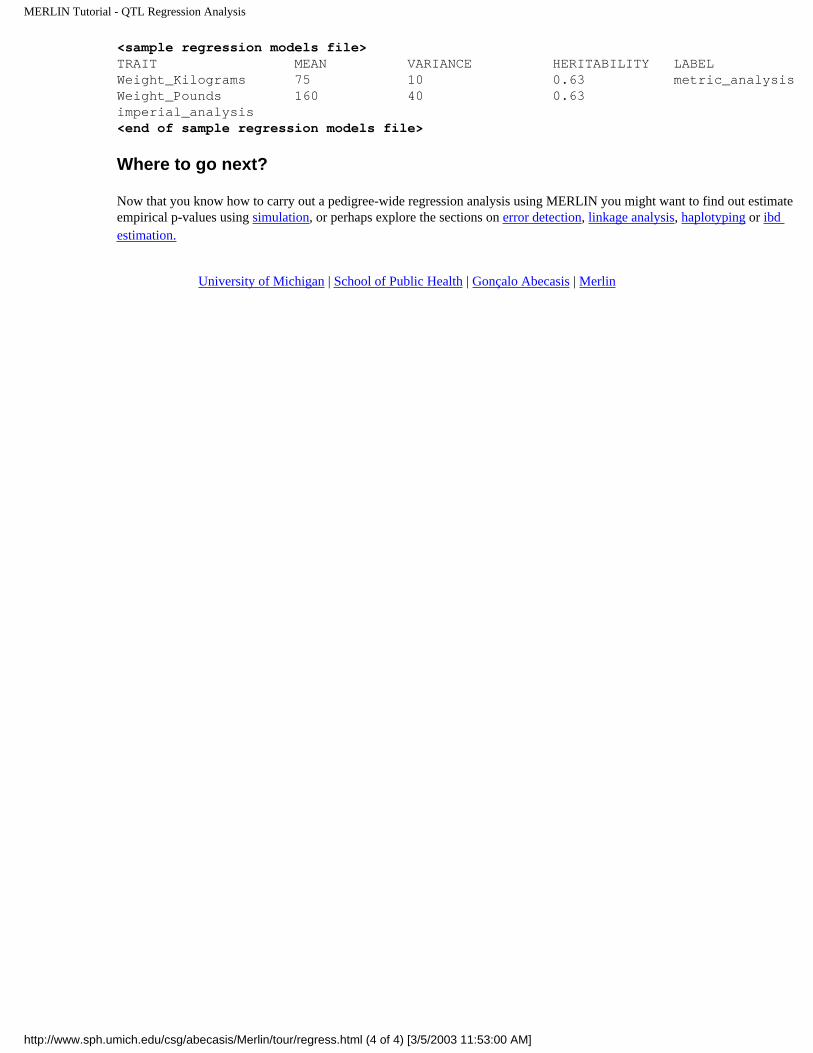
Often multiple quantitative traits may be available in a particular dataset. Each of these traits is likely to have a distinct mean, variance and heritability in the population. The -t models_file specifies the name of a text file listing analysis models, one for each trait. Using a models table allows distinct models to be specified for each phenotype in the pedigree file.
A models table includes four columns. The first column indicates the trait name and is followed by columns indicating the trait mean, variance and heritability. Optionally, a fifth column can be included with a label for each model. Here is an example:
http://www.sph.umich.edu/csg/abecasis/Merlin/tour/regress.html (3 of 4) [3/5/2003 11:53:00 AM]
MERLIN Tutorial - QTL Regression Analysis
<sample regression models file>TRAIT MEAN VARIANCE HERITABILITY LABELWeight_Kilograms 75 10 0.63 metric_analysisWeight_Pounds 160 40 0.63 imperial_analysis<end of sample regression models file>
Where to go next?
Now that you know how to carry out a pedigree-wide regression analysis using MERLIN you might want to find out estimate empirical p-values using simulation, or perhaps explore the sections on error detection, linkage analysis, haplotyping or ibd estimation.
University of Michigan | School of Public Health | Gonçalo Abecasis | Merlin
http://www.sph.umich.edu/csg/abecasis/Merlin/tour/regress.html (4 of 4) [3/5/2003 11:53:00 AM]
Windows Version of Merlin
MERLIN
Home
Tutorial
Download
Register
Reference
FAQ
Windows Version of Merlin
These executables were compiled using MINGW, a minimalist port of the GNU utilities to a Windows environment. Using these executables requires a working knowledge of the Windows command prompt. The command prompt is a Windows utility that allows you to execute software with a text based interface, such as Merlin.
In general, you should unpack the merlin download and place the executable (.EXE) files in a subdirectory of the Program Files directory. For convenience, you can add this directory to your path statement. For example, if you install the merlin executable files in the directory C:\Program Files\Merlin you might add the following line to your autoexec.bat file:
@set path=c:\Program Files\Merlin;$path
After rebooting your computer you should be able to start a command prompt by selecting Run.. from the Start menu and entering CMD (in Windows XP) or COMMAND (in some older versions of Windows) in the dialog box. If everything is working, you should be able to execute MERLIN by typing MERLIN at the prompt.
University of Michigan | School of Public Health | Gonçalo Abecasis
http://www.sph.umich.edu/csg/abecasis/Merlin/download/Windows.html [3/5/2003 11:54:25 AM]

Record of Changes to MERLIN
MERLIN
Home
Tutorial
Download
Register
Reference
FAQ
Record of Changes to MERLIN
ChangeLog
=============================================================CHANGES AFTER PUBLIC RELEASE OF MERLIN=============================================================
MERLIN 0.9.8============
* Basic PDF output. Merlin and Merlin-Regress now produce a simple PDF file with one LOD score plot per page when the --pdf option is used. Each trait, chromosome and analysis option is plotted on a separate page.
* Pedigree Trimming. Merlin and Merlin-Regress can now remove uninformative individuals from pedigrees to speed up analysis. To use this functionality, use the --trim command line option.
* Microsatellite Allele Sizes. Allele numbers are now recoded internally, allowing microsatellite allele sizes to be used in the pedigree file.
* Extended IBD state information. Extended allele IBD state probabilities, which distinguish maternal and paternal allele sharing and provide additional information on inbreeding can now be calculated.
* Multiple Trait Models for Regression Analyses. MERLIN-REGRESS now accepts an optional table describing mean, variance and heritability for each trait. This facilitates analyses of pedigree files with multiple traits.
* Founder couple symmetries can be optionally disabled with the --noCoupleBits option.
* For variance components analysis, fixed bug that led to non-invertible matrices when the parameter estimated variance components are close to zero. This condition could produce a crash in earlier versions.
* Fixed bug in Merlin-Regress that caused crashes in families with more than 4 pairs of grand-parents with no phenotype or genotype data. This condition would produce a crash in earlier versions.
* Fixed aggressive optimization that could cause the --all option (which lists all non-recombinant haplotypes) to miss some haplotype states. Formerly, markers were labelled uninformative whenever they implied identical likelihoods for all inheritance vectors. This version implements a stricter definition that also requires that the same allelic state is implied for each vector.
MERLIN 0.9.3============
* Minor source code changes for compatibility with GCC version 3.
* Horizontal haplotypes are no longer output by default, but
http://www.sph.umich.edu/csg/abecasis/Merlin/download/ChangeLog.html (1 of 5) [3/5/2003 11:55:42 AM]
Record of Changes to MERLIN
require --horizontal flag.
MERLIN 0.9.2============
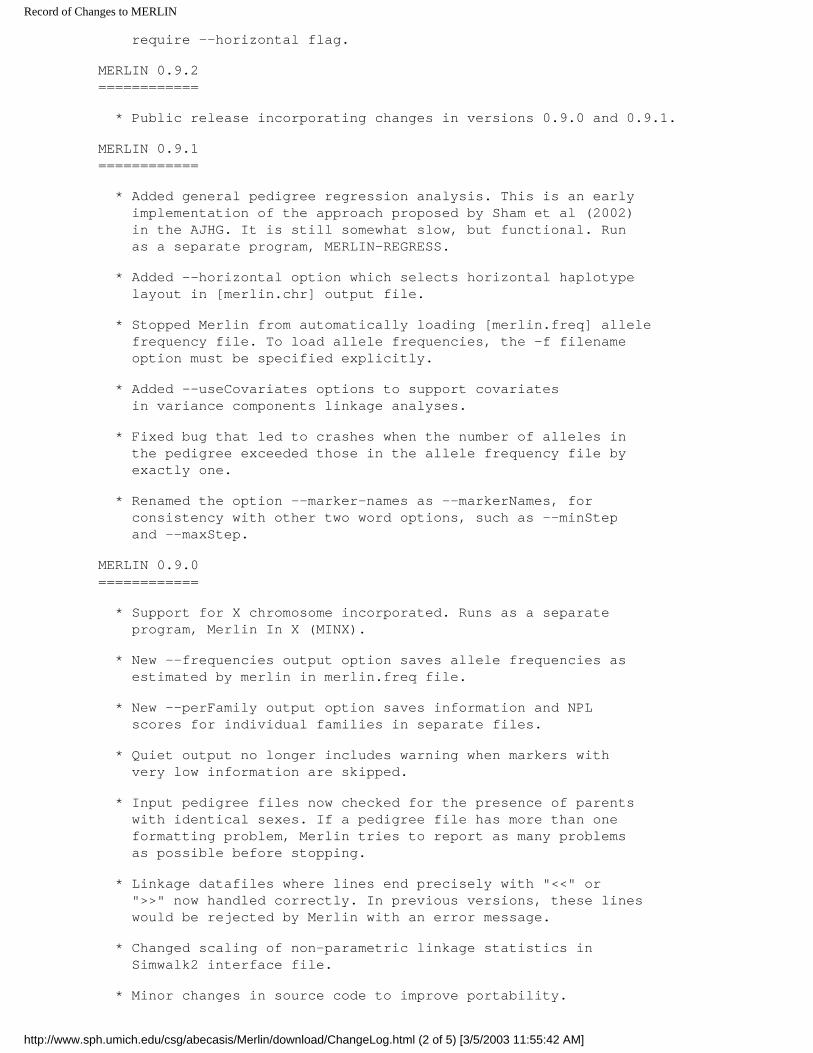
* Public release incorporating changes in versions 0.9.0 and 0.9.1.
MERLIN 0.9.1 ============
* Added general pedigree regression analysis. This is an early implementation of the approach proposed by Sham et al (2002) in the AJHG. It is still somewhat slow, but functional. Run as a separate program, MERLIN-REGRESS.
* Added --horizontal option which selects horizontal haplotype layout in [merlin.chr] output file.
* Stopped Merlin from automatically loading [merlin.freq] allele frequency file. To load allele frequencies, the -f filename option must be specified explicitly.
* Added --useCovariates options to support covariates in variance components linkage analyses.
* Fixed bug that led to crashes when the number of alleles in the pedigree exceeded those in the allele frequency file by exactly one.
* Renamed the option --marker-names as --markerNames, for consistency with other two word options, such as --minStep and --maxStep.
MERLIN 0.9.0 ============
* Support for X chromosome incorporated. Runs as a separate program, Merlin In X (MINX).
* New --frequencies output option saves allele frequencies as estimated by merlin in merlin.freq file.
* New --perFamily output option saves information and NPL scores for individual families in separate files.
* Quiet output no longer includes warning when markers with very low information are skipped.
* Input pedigree files now checked for the presence of parents with identical sexes. If a pedigree file has more than one formatting problem, Merlin tries to report as many problems as possible before stopping.
* Linkage datafiles where lines end precisely with "<<" or ">>" now handled correctly. In previous versions, these lines would be rejected by Merlin with an error message.
* Changed scaling of non-parametric linkage statistics in Simwalk2 interface file.
* Minor changes in source code to improve portability.
http://www.sph.umich.edu/csg/abecasis/Merlin/download/ChangeLog.html (2 of 5) [3/5/2003 11:55:42 AM]
Record of Changes to MERLIN
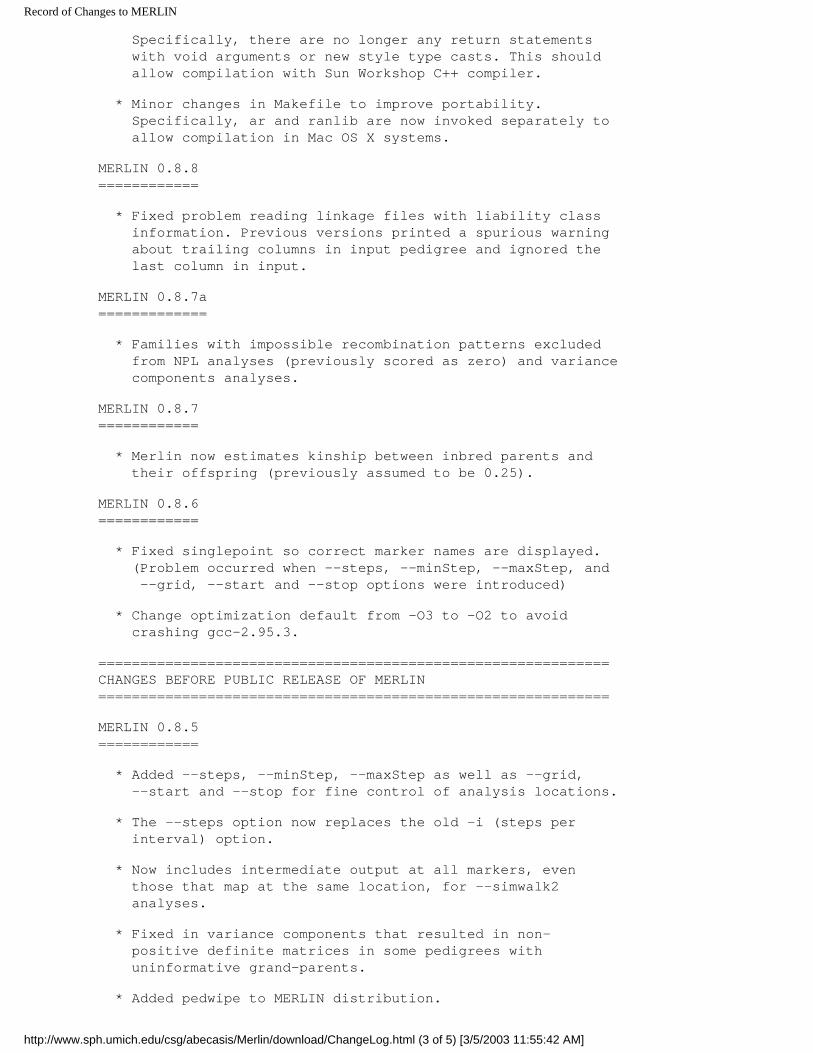
Specifically, there are no longer any return statements with void arguments or new style type casts. This should allow compilation with Sun Workshop C++ compiler.
* Minor changes in Makefile to improve portability. Specifically, ar and ranlib are now invoked separately to allow compilation in Mac OS X systems.
MERLIN 0.8.8============
* Fixed problem reading linkage files with liability class information. Previous versions printed a spurious warning about trailing columns in input pedigree and ignored the last column in input.
MERLIN 0.8.7a=============
* Families with impossible recombination patterns excluded from NPL analyses (previously scored as zero) and variance components analyses.
MERLIN 0.8.7============
* Merlin now estimates kinship between inbred parents and their offspring (previously assumed to be 0.25).
MERLIN 0.8.6============
* Fixed singlepoint so correct marker names are displayed. (Problem occurred when --steps, --minStep, --maxStep, and --grid, --start and --stop options were introduced)
* Change optimization default from -O3 to -O2 to avoid crashing gcc-2.95.3.
=============================================================CHANGES BEFORE PUBLIC RELEASE OF MERLIN=============================================================
MERLIN 0.8.5============
* Added --steps, --minStep, --maxStep as well as --grid, --start and --stop for fine control of analysis locations.
* The --steps option now replaces the old -i (steps per interval) option.
* Now includes intermediate output at all markers, even those that map at the same location, for --simwalk2 analyses.
* Fixed in variance components that resulted in non- positive definite matrices in some pedigrees with uninformative grand-parents.
* Added pedwipe to MERLIN distribution.
http://www.sph.umich.edu/csg/abecasis/Merlin/download/ChangeLog.html (3 of 5) [3/5/2003 11:55:42 AM]
Record of Changes to MERLIN
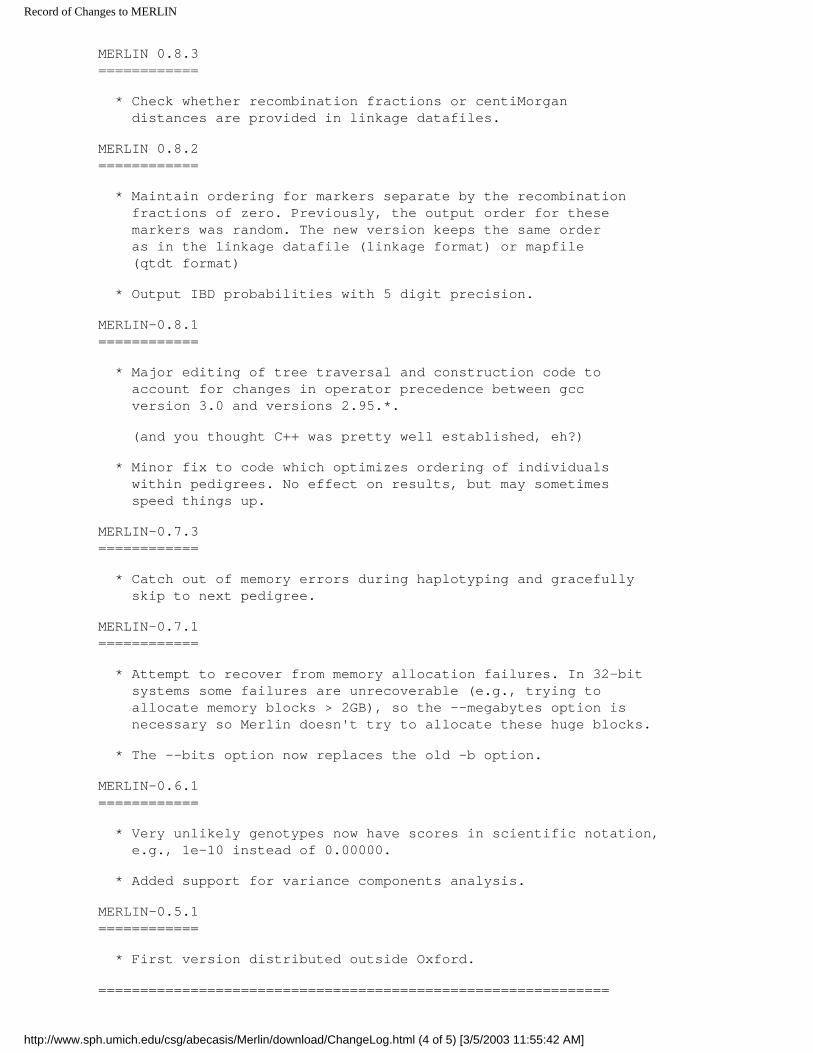
MERLIN 0.8.3============
* Check whether recombination fractions or centiMorgan distances are provided in linkage datafiles.
MERLIN 0.8.2============
* Maintain ordering for markers separate by the recombination fractions of zero. Previously, the output order for these markers was random. The new version keeps the same order as in the linkage datafile (linkage format) or mapfile (qtdt format)
* Output IBD probabilities with 5 digit precision.
MERLIN-0.8.1============
* Major editing of tree traversal and construction code to account for changes in operator precedence between gcc version 3.0 and versions 2.95.*.
(and you thought C++ was pretty well established, eh?)
* Minor fix to code which optimizes ordering of individuals within pedigrees. No effect on results, but may sometimes speed things up.
MERLIN-0.7.3============
* Catch out of memory errors during haplotyping and gracefully skip to next pedigree.
MERLIN-0.7.1============
* Attempt to recover from memory allocation failures. In 32-bit systems some failures are unrecoverable (e.g., trying to allocate memory blocks > 2GB), so the --megabytes option is necessary so Merlin doesn't try to allocate these huge blocks.
* The --bits option now replaces the old -b option.
MERLIN-0.6.1============
* Very unlikely genotypes now have scores in scientific notation, e.g., 1e-10 instead of 0.00000.
* Added support for variance components analysis.
MERLIN-0.5.1============
* First version distributed outside Oxford.
=============================================================
http://www.sph.umich.edu/csg/abecasis/Merlin/download/ChangeLog.html (4 of 5) [3/5/2003 11:55:42 AM]

Record of Changes to MERLIN
OLDER VERSIONS OF MERLIN ONLY USED INTERNALLY=============================================================
University of Michigan | School of Public Health | Gonçalo Abecasis
http://www.sph.umich.edu/csg/abecasis/Merlin/download/ChangeLog.html (5 of 5) [3/5/2003 11:55:42 AM]
Extended IBD states
MERLIN
Home
Tutorial
Download
Register
Reference
FAQ
Extended IBD states
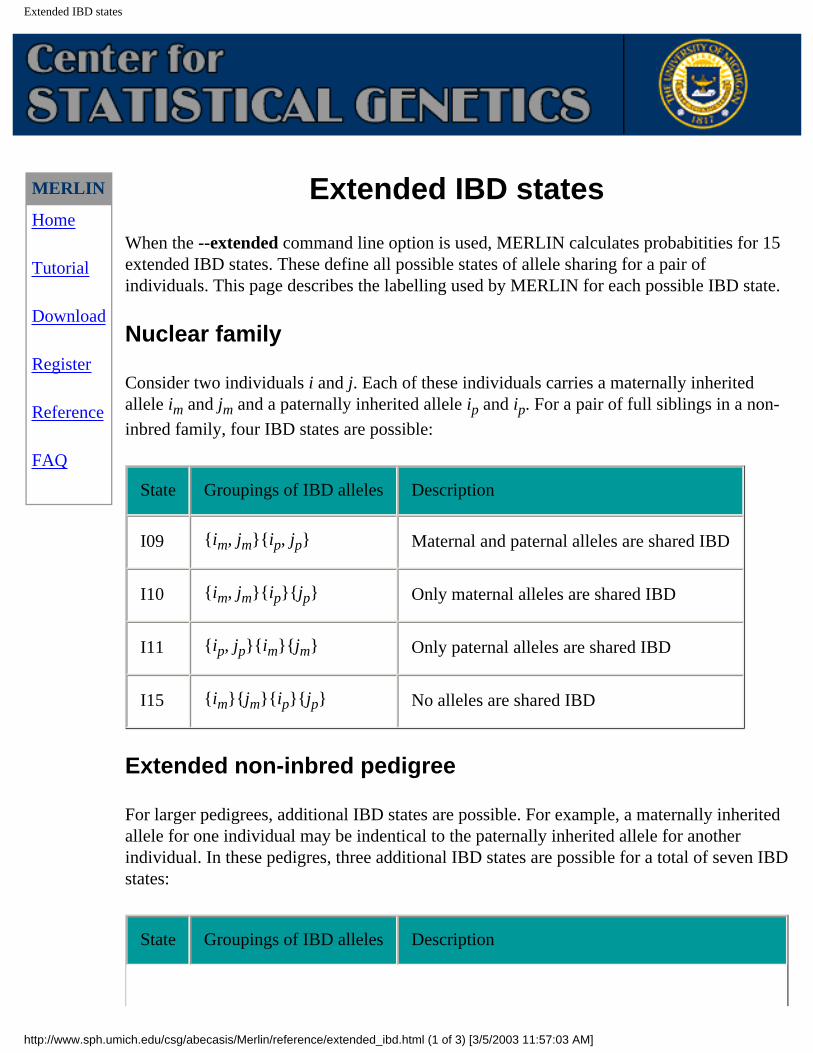
When the --extended command line option is used, MERLIN calculates probabitities for 15 extended IBD states. These define all possible states of allele sharing for a pair of individuals. This page describes the labelling used by MERLIN for each possible IBD state.
Nuclear family
Consider two individuals i and j. Each of these individuals carries a maternally inherited allele im and jm and a paternally inherited allele ip and ip. For a pair of full siblings in a non-
inbred family, four IBD states are possible:
State Groupings of IBD alleles Description
I09 {im, jm}{ip, jp} Maternal and paternal alleles are shared IBD
I10 {im, jm}{ip}{jp} Only maternal alleles are shared IBD
I11 {ip, jp}{im}{jm} Only paternal alleles are shared IBD
I15 {im}{jm}{ip}{jp} No alleles are shared IBD
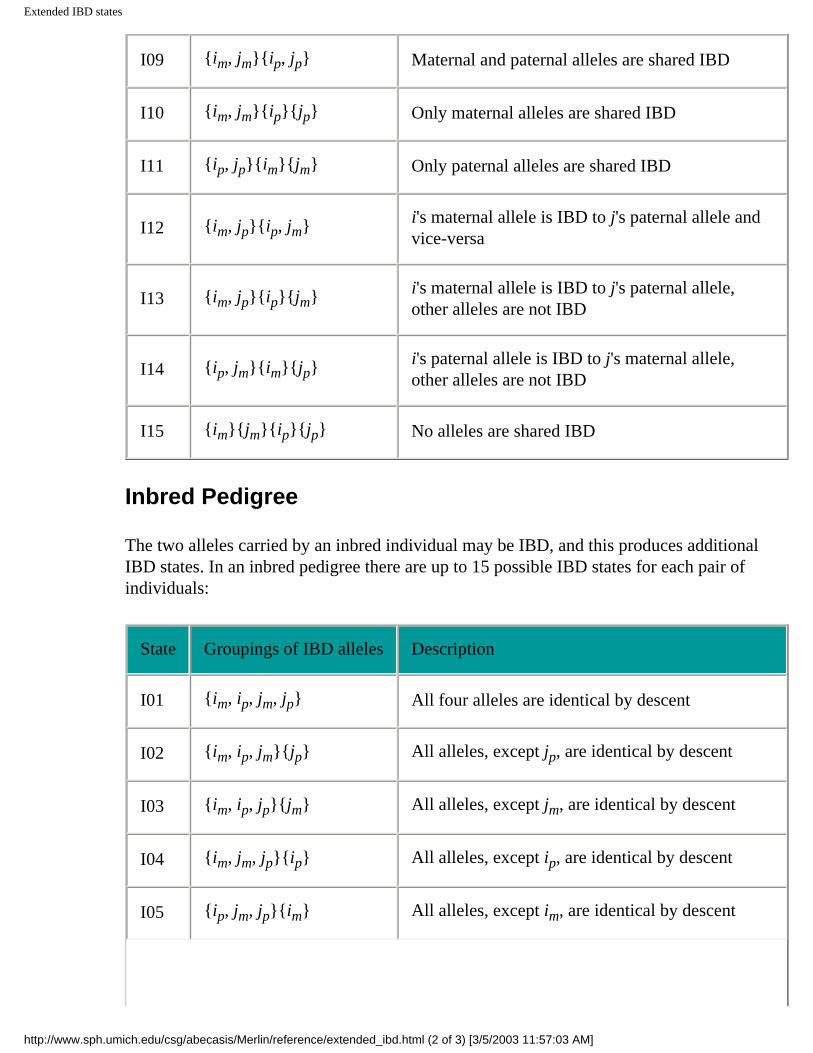
Extended non-inbred pedigree
For larger pedigrees, additional IBD states are possible. For example, a maternally inherited allele for one individual may be indentical to the paternally inherited allele for another individual. In these pedigres, three additional IBD states are possible for a total of seven IBD states:
State Groupings of IBD alleles Description
http://www.sph.umich.edu/csg/abecasis/Merlin/reference/extended_ibd.html (1 of 3) [3/5/2003 11:57:03 AM]
Extended IBD states
I09 {im, jm}{ip, jp} Maternal and paternal alleles are shared IBD
I10 {im, jm}{ip}{jp} Only maternal alleles are shared IBD
I11 {ip, jp}{im}{jm} Only paternal alleles are shared IBD
I12 {im, jp}{ip, jm} i's maternal allele is IBD to j's paternal allele and vice-versa
I13 {im, jp}{ip}{jm} i's maternal allele is IBD to j's paternal allele, other alleles are not IBD
I14 {ip, jm}{im}{jp} i's paternal allele is IBD to j's maternal allele, other alleles are not IBD
I15 {im}{jm}{ip}{jp} No alleles are shared IBD
Inbred Pedigree
The two alleles carried by an inbred individual may be IBD, and this produces additional IBD states. In an inbred pedigree there are up to 15 possible IBD states for each pair of individuals:
State Groupings of IBD alleles Description
I01 {im, ip, jm, jp} All four alleles are identical by descent
I02 {im, ip, jm}{jp} All alleles, except jp, are identical by descent
I03 {im, ip, jp}{jm} All alleles, except jm, are identical by descent
I04 {im, jm, jp}{ip} All alleles, except ip, are identical by descent
I05 {ip, jm, jp}{im} All alleles, except im, are identical by descent
http://www.sph.umich.edu/csg/abecasis/Merlin/reference/extended_ibd.html (2 of 3) [3/5/2003 11:57:03 AM]

Extended IBD states
I06 {im, ip}{jm, jp} i and j are inbred and alleles are IBD within each individual
I07 {im, ip}{jm}{jp} i is inbred and carries maternal and paternal alleles that are IBD
I08 {im}{ip}{jm, jp} j is inbred and carries maternal and paternal alleles that are IBD
I09 {im, jm}{ip, jp} Maternal and paternal alleles are shared IBD
I10 {im, jm}{ip}{jp} Only maternal alleles are shared IBD
I11 {ip, jp}{im}{jm} Only paternal alleles are shared IBD
I12 {im, jp}{ip, jm} i's maternal allele is IBD to j's paternal allele and vice-versa
I13 {im, jp}{ip}{jm} i's maternal allele is IBD to j's paternal allele, other alleles are not IBD
I14 {ip, jm}{im}{jp} i's paternal allele is IBD to j's maternal allele, other alleles are not IBD
I15 {im}{jm}{ip}{jp} No alleles are shared IBD
References
For more information on extended IBD states, see the excellent book Lange K (1997) Mathematical and statistical methods for genetic analysis.
University of Michigan | School of Public Health | Gonçalo Abecasis
http://www.sph.umich.edu/csg/abecasis/Merlin/reference/extended_ibd.html (3 of 3) [3/5/2003 11:57:03 AM]
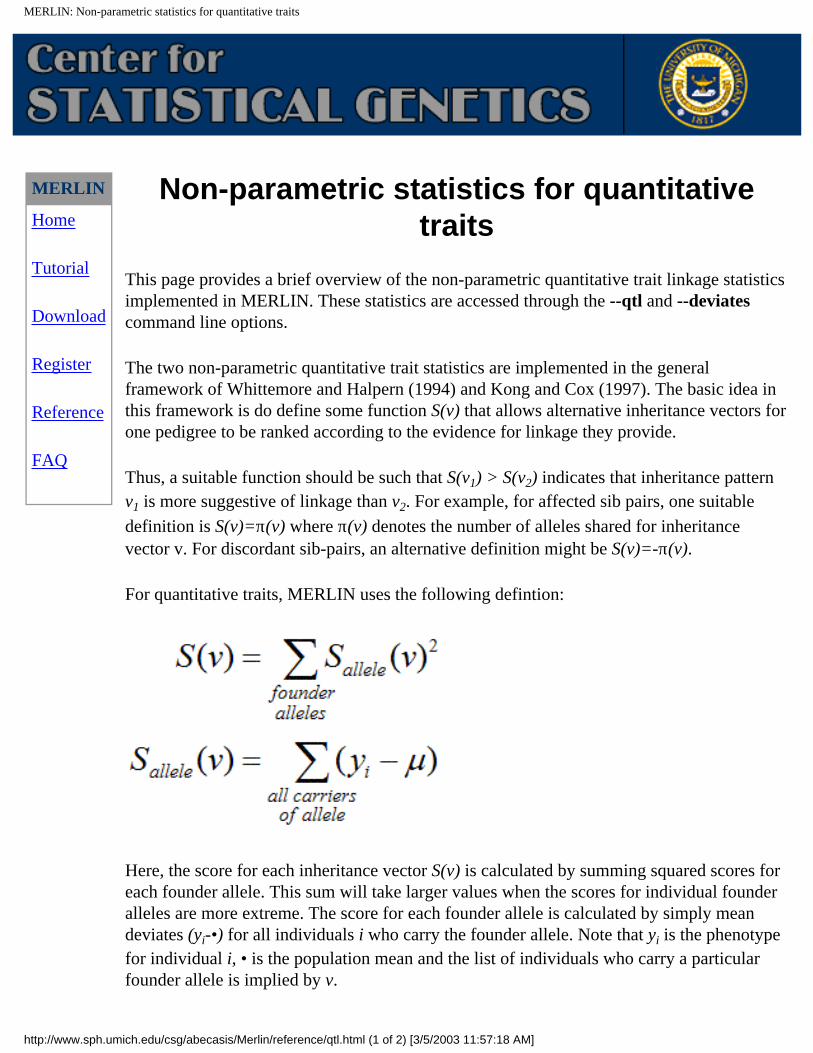
MERLIN: Non-parametric statistics for quantitative traits
MERLIN
Home
Tutorial
Download
Register
Reference
FAQ
Non-parametric statistics for quantitative traits
This page provides a brief overview of the non-parametric quantitative trait linkage statistics implemented in MERLIN. These statistics are accessed through the --qtl and --deviates command line options.
The two non-parametric quantitative trait statistics are implemented in the general framework of Whittemore and Halpern (1994) and Kong and Cox (1997). The basic idea in this framework is do define some function S(v) that allows alternative inheritance vectors for one pedigree to be ranked according to the evidence for linkage they provide.
Thus, a suitable function should be such that S(v1) > S(v2) indicates that inheritance pattern v1 is more suggestive of linkage than v2. For example, for affected sib pairs, one suitable
definition is S(v)=π(v) where π(v) denotes the number of alleles shared for inheritance vector v. For discordant sib-pairs, an alternative definition might be S(v)=-π(v).
For quantitative traits, MERLIN uses the following defintion:
Here, the score for each inheritance vector S(v) is calculated by summing squared scores for each founder allele. This sum will take larger values when the scores for individual founder alleles are more extreme. The score for each founder allele is calculated by simply mean deviates (yi-•) for all individuals i who carry the founder allele. Note that yi is the phenotype for individual i, • is the population mean and the list of individuals who carry a particular founder allele is implied by v.
http://www.sph.umich.edu/csg/abecasis/Merlin/reference/qtl.html (1 of 2) [3/5/2003 11:57:18 AM]
MERLIN: Non-parametric statistics for quantitative traits
When the --qtl option is selected MERLIN uses the sample mean to estimate •. When the --deviates option is selected, MERLIN fixes • at 0 (zero). The later option is suitable for the analysis of selected samples if the sample mean is subtracted from individual phenotypes prior to analysis.
The procedure for converting scores for individual inheritance vectors into Z-scores for a single or multiple pedigrees is described in detail by Whittemore and Halpern (1994). These Z-scores are used by MERLIN to construct a likelihood ratio test for linkage and define a LOD score statistic using the procedure described by Kong and Cox (1997).
MERLIN also implements variance components (--vc option) and regression-based (MERLIN-REGRESS package) tests of linkage for quantitative traits. Both of these tests are designed for traits which are normally distributed in the population and are likely to be more powerful for such traits. Detailed descriptions of these alternatives are available elsewhere (see for example, Amos, 1994; Sham et al, 2002).
References
Amos (1994) Robust variance-components approach for assessing genetic linkage in pedigrees. American Journal of Human Genetics 54535-543
Kong and Cox (1997) Allele-sharing models: LOD scores and accurate linkage tests. American Journal of Human Genetics 61:1179-1188
Sham, Purcell, Cherny and Abecasis (2002) Powerful regression-based quantitative-trait linkage analysis of general pedigrees. American Journal of Human Genetics 71:238-253
Whittemore and Halpern (1994) A class of tests for linkage using affected pedigree members. Biometrics 50118-127
University of Michigan | School of Public Health | Gonçalo Abecasis
http://www.sph.umich.edu/csg/abecasis/Merlin/reference/qtl.html (2 of 2) [3/5/2003 11:57:18 AM]

How MERLIN Simulates Data
MERLIN
Home
Tutorial
Download
Register
Reference
FAQ
How MERLIN simulates data
With the --simulate option, Merlin can generate random datasets that look like the original data in terms of marker informativeness, spacing and missing data patterns. In these datasets, marker data are simulated under the null hypothesis of no linkage or association to observed phenotypes. Phenotypic measurements, including covariates, quantitative traits and affection status are preserved.
Here is what the --simulate option does:
1. It assigns random chromosomes to founders according to allele frequencies at at each marker. No allowance is made for marker-marker disequilibrium.
2. It segregates these chromosomes through the pedigree using the relationships specified in the original pedigree file and recombination fraction specified in the map file or linkage format data file.
3. It replaces the original genotypes with these simulated genotypes, retaining the original pattern of missing data exactly. (For example, if individual A is untyped at marker B in the original data, individual A's genotype at marker B will be discarded in all replicates).
The net result of this is that you get a random chromosome (or genome) that is unlinked to any of your traits of interest. These simulated data are suitable for examining false positive rates in a genome scan and should allow for quirks of marker informativeness, trait distribution and selection scheme.
The data can be saved to a file with the --save command line option or it can be analysed with any of the regular Merlin options. Changing the random seed (with the -i command line option) generates a different set of founder chromosomes and segregation pattern.
If you are interested in finding out more about gene-dropping simulations, two useful references are:
1. Sawcer S, Jones HB, Judge D, Visser F, Compston A, Goodfellow PN, Clayton D (1997) Empirical genomewide significance levels established by whole genome simulations. Genet Epidemiol 14:223-9.
2. Kruglyak L, Daly MJ (1998) Linkage thresholds for two-stage genome scans. Am J Hum Genet 62:994-7.
http://www.sph.umich.edu/csg/abecasis/Merlin/reference/simulation.html (1 of 2) [3/5/2003 11:58:33 AM]

How MERLIN Simulates Data
University of Michigan | School of Public Health | Gonçalo Abecasis
http://www.sph.umich.edu/csg/abecasis/Merlin/reference/simulation.html (2 of 2) [3/5/2003 11:58:33 AM]

MERLIN Reference
MERLIN
Home
Tutorial
Download
Register
Reference
FAQ
MERLIN Reference
General
Quick Reference
Specific Topics
How Merlin Simulates Data
Non-parametric statistics for quantitative traits
Calculation of extended IBD states
University of Michigan | School of Public Health | Gonçalo Abecasis
http://www.sph.umich.edu/csg/abecasis/Merlin/reference/ [3/5/2003 12:02:26 PM]