Embed Size (px)
Citation preview

1
Merging Data Sources in BusinessObjects - Finance
Goal: We’ll be creating a report that merges data from different queries and relates the information from the different queries
to the related Funds Centers and Functional Areas to provide a summary and detailed look into a hypothetical program.
Most programs/departments/divisions are some combination of FI Account Assignment information like Funds Center,
Functional Area, Fund, Grant, State Funded Program, etc. For this example, I’ll just be looking at two hypothetical
programs that are made of the Funds Center D500BA0000 and Functional Area D500_BA00 (BusinessObjects Program)
and D500CE500/D500_CE01 (Reporting Program).
Budget (FM Budget vs Actual)
Encumbrances by Vendor (Open Encumbrance Report)
Revenue (Funds Management Revenue Report)
Payments by PO (FI Invoices)
Expenses by Vendor (Funds Manament Expense Report)
To get all of this information by Funds Center/Functional Area, we’ll have to add these queries to the report and create
merged dimensions.
The finished report will look something like:

2
Merging Data Sources in BusinessObjects - Finance
We can then drill into the summary, by including another report that breaks out expenditures by more detailed
Commitment Items like:
3
Merging Data Sources in BusinessObjects - Finance
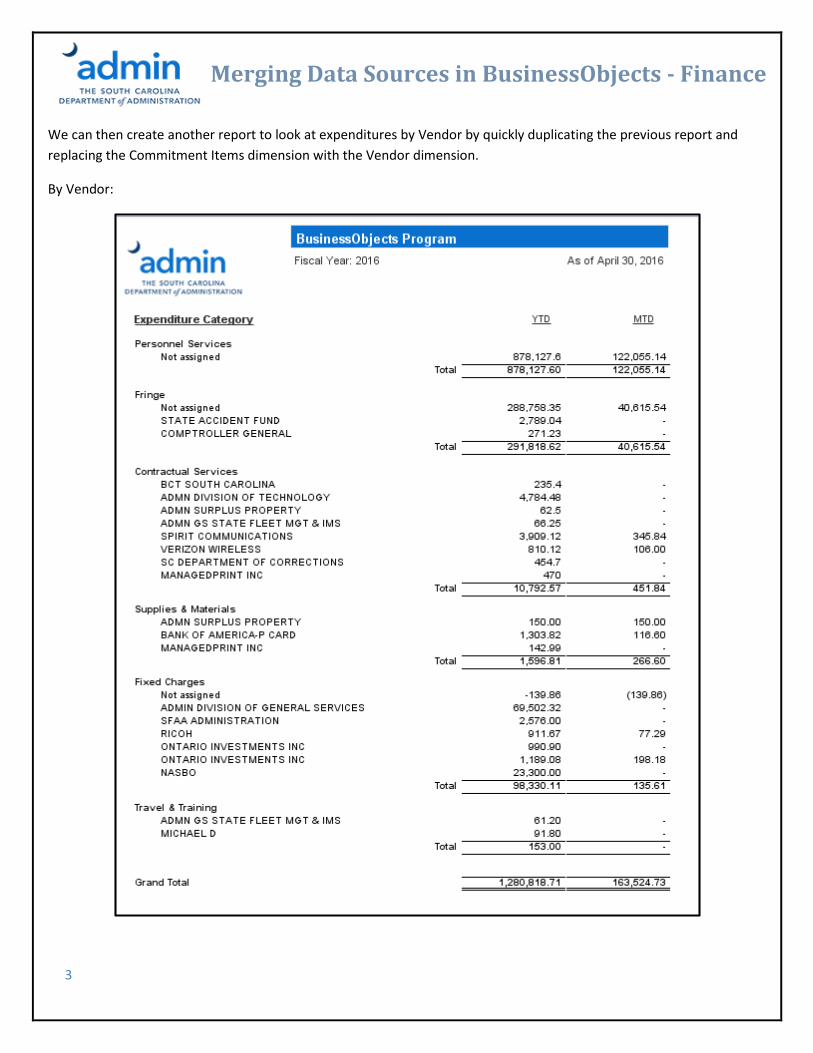
We can then create another report to look at expenditures by Vendor by quickly duplicating the previous report and
replacing the Commitment Items dimension with the Vendor dimension.
By Vendor:
4
Merging Data Sources in BusinessObjects - Finance
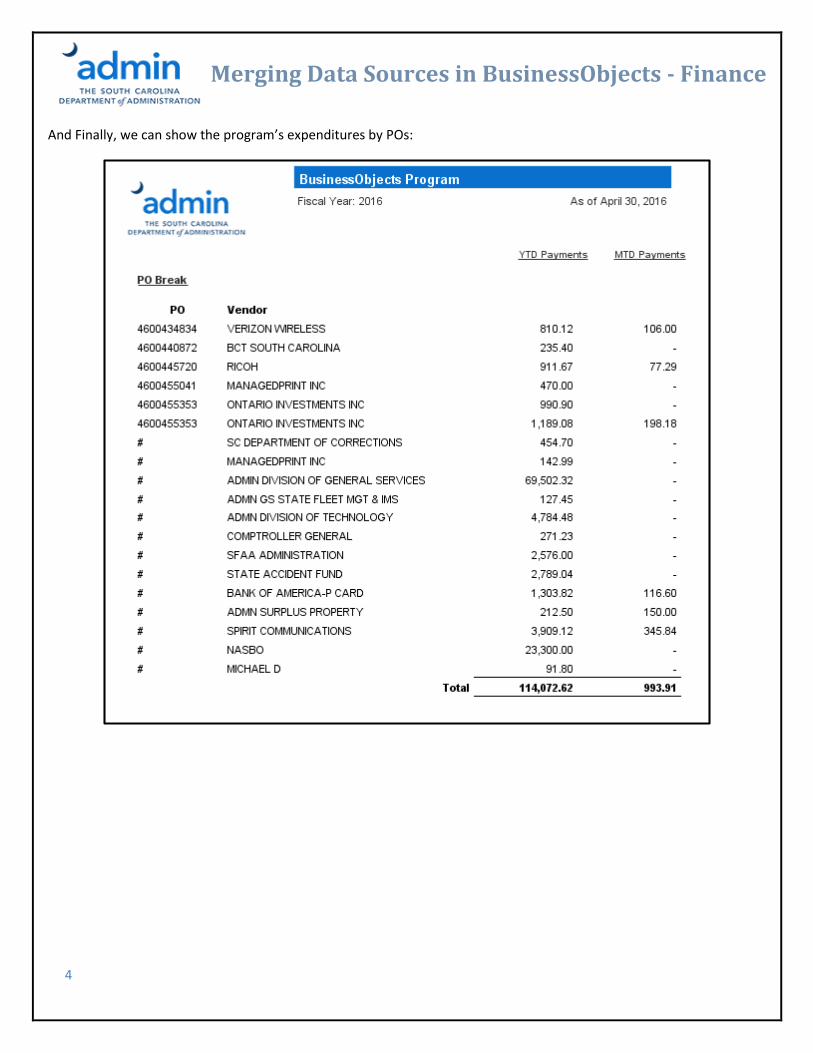
And Finally, we can show the program’s expenditures by POs:

5
Merging Data Sources in BusinessObjects - Finance
Choosing a Data Source First, we’ll need an initial data source to supply our report with data. If we’re strictly using SCEIS data, we’ll use a BEx
query connection.
To begin: 1. Click on the Web Intelligence icon:
2. Click on the New icon:
3. You’ll then be prompted to choose a data source. For any SCEIS information, choose a BEx query. The BEx query
option is a connection directly to same query that you would find and execute in BEx.
Note: Non-SCEIS information can be loaded by putting the data into an Excel file, loading it into BusinessObjects and
choosing that file as a data source.

6
Merging Data Sources in BusinessObjects - Finance
4. Look for the FM Budget vs Actual query in the in the folder BEx Queries\Accounting\Funds Management.
Note: The queries in Business Objects will be found in the same roles folders that they would be found in BEx.
5. Before the query panel will appear, you’ll need to pre-run the query. You cannot type directly into the blank fields,
but if you click on the “…” icon, a box will appear where you can search for and choose from a list of values to input
into the prompt box.

7
Merging Data Sources in BusinessObjects - Finance
Note: The default search is to set for the name of the object being put into the field (for example, “General Fund” rather
than “1001000” or “Department of Administration” rather than the key, “D500”. To search for the key, ensure that
Search in keys is checked next to the binoculars icon. You can then select the item and move it over to the Selected
Values(s) area by double-clicking or using the right-arrow. Then select OK to input the value into the prompt. Like:
Once you’ve input all items (make sure all the required fields have values), you can then click OK and the query panel
will appear.

8
Merging Data Sources in BusinessObjects - Finance
Query Panel: The query panel is where you will choose the list of items (objects) that you want to include in your report. In addition
to choosing the items you want to include; in the query panel, you can also:
Add other queries
Filter the report
Preview the data (the first 100 records are retrieved)
To include other items after the initial run, or to do any of the things above, you can get back to the query panel by
clicking on the Edit Data Provider icon above the Available Objects area in the top-left area in the design mode of the
report.
After the prompt values have been input and the query has run, you will see this:

9
Merging Data Sources in BusinessObjects - Finance
6. Drag objects from the outline area to the Result Objects area. You can delete unwanted items using the delete
icons in the top right area. The objects needed for the report will be the key detail and the dimension for:
Funds Center (Key and Dimension) Current Budget
Functional Area ( Key and Dimension) Any other objects you’d like to put in your report
Commitment Item (Key and Dimension)
7. Once you run the query, you will have a table of data to use in your report (showing current budget by Functional
Area and Funds Center):
Adding Additional Queries: Now that we have an initial query and table in the report, we can now add the other queries. But before we do, let’s
check a setting that will make a multi-query report easier to work with.
8. Change the Document properties and uncheck Merge prompts (BEx Variables).
a) In the Properties tab at the top-left of the report
b) Go to Document
c) Uncheck the Merge prompts (BEx Variables) setting.
Note: Unchecking the Merge prompts option will allow us to refresh multiples queries at once by setting the prompts
individually. This means that we can set query parameters separately from one another.

10
Merging Data Sources in BusinessObjects - Finance
9. To Add additional Queries:
a) Open the Query Panel using the Edit Query Panel button.
b) When the Query Panel opens, choose Add Query and From BEx
c) Find the Funds Management Revenue Report in the BEx Queries\Accounting\Funds Management folder and
add these objects:
Funds Center (Key and Dimension) FY Total
Functional Area (Key and Dimension) Any other objects you’d like to put in your report
Commitment Item (Key and Dimension)
Note: You can include the keys for any objects needed or any other objects you wish to include in report. In this example,
I’ll just be including the dimensions of each object above.
This Query will provide us with the revenue for our programs.
Note: It’s a best practice to rename the queries as you add them. This will come in handy when we’re trying to determine
which objects come from which query. It’ll also be easier to determine which date parameters to run each query for. For

11
Merging Data Sources in BusinessObjects - Finance
this example, I suggest naming the queries based on their function in the report. To do this, simply right-click on the tab
of the query name and choose rename, like:
10. Repeat this step for the other queries:
a) Funds Management Expense Report (BEx Queries\Accounting\Funds Management)
Objects:
Funds Center (Key and Dimension) FY Total
Functional Area (Key and Dimension) Any other objects you’d like to put in your report
Commitment Item (Key and Dimension) Posting Period?
Vendor (Key and Dimension)
b) Open Encumbrance – by Function Area, Fund, Cost Cent (BEx Queries\Accounting\Materials
Management\Procurement Reports)
Objects:
Funds Center (Key and Dimension) Remaining Balance
Functional Area (Key and Dimension) Any other objects you’d like to put in your report
Vendor (Key and Dimension)
c) FI Vendor Invoices (BEx Queries\Accounting\Funds Managment)
Objects:
Funds Center (Key and Dimension) Remaining Balance
Functional Area (Key and Dimension) Any other objects you’d like to put in your report
Vendor (Key and Dimension)
Purch Order (if appl)

12
Merging Data Sources in BusinessObjects - Finance
We now have all the objects that we’ll need to use in our report. Once you rename each query in the Query Panel, the
bottom of the Query Panel should look like:
11. You can then refresh all the queries at once. Ensure that each required prompt has a value.
12. Once the report finishes running, this box will appear. Choose the first option. This will put the data from the new
queries into new tabs of the report.
In the Results Objects navigation pane to the left of the report, change the Arranged By
setting from Alphabetical Order to Query. You’ll then notice the objects that are from
each query).
13. Merge the like Dimensions and Keys:
a) In the Available Objects area, use the Ctrl key and select Functional Area
Dimensions from each of the five queries query. Note: An object that is bold does
not have data. To merge a bold object, you must first drag it into the report and
refresh the related query. Once the query is refreshed, you can then merge that
object with other like objects.
b) Right-click on any of the selected Functional Area dimensions.
c) Select Merge.
d) You’ll then see a new merged dimension for Functional Area in the Merged Dimensions area.
e) Repeat this for the Functional Area – Key, Funds Center (Key and Dimension) and the other like objects you’ve
chosen to use in your report.

13
Merging Data Sources in BusinessObjects - Finance
Putting the Report Together: Now that you have merged dimensions, you can use those new objects in the report to combine and filter your data.
The new object allows you to bring in information from different queries into the same block or section.
To create a table, simply build your table by dragging items from the available objects area into the report to build your
tables. Like this:
You can also use merged dimensions to filter several blocks in a report at once. The information on our summary page
comes from 4 different queries, but we’re able to use the merged dimension to filter them all at once. We have blocks
for each query. One that shows the budget for the program, one that shows receipts, a disbursements table and a
commitments tables. By utilizing merged dimensions we can place a filter at the report level to filter the other tables in
the report. Like this:

14
Merging Data Sources in BusinessObjects - Finance
Working with merged dimensions is exactly the same as using
objects from just one query. The merged dimension will simply
merge all the values for the field from each query and allow
you to relate the measures to the shared dimension that is
found in two or more queries. The only difference is that you’ll
be using the dimensions in the Merged Dimension area of the
available objects area. Here:
15
Merging Data Sources in BusinessObjects - Finance
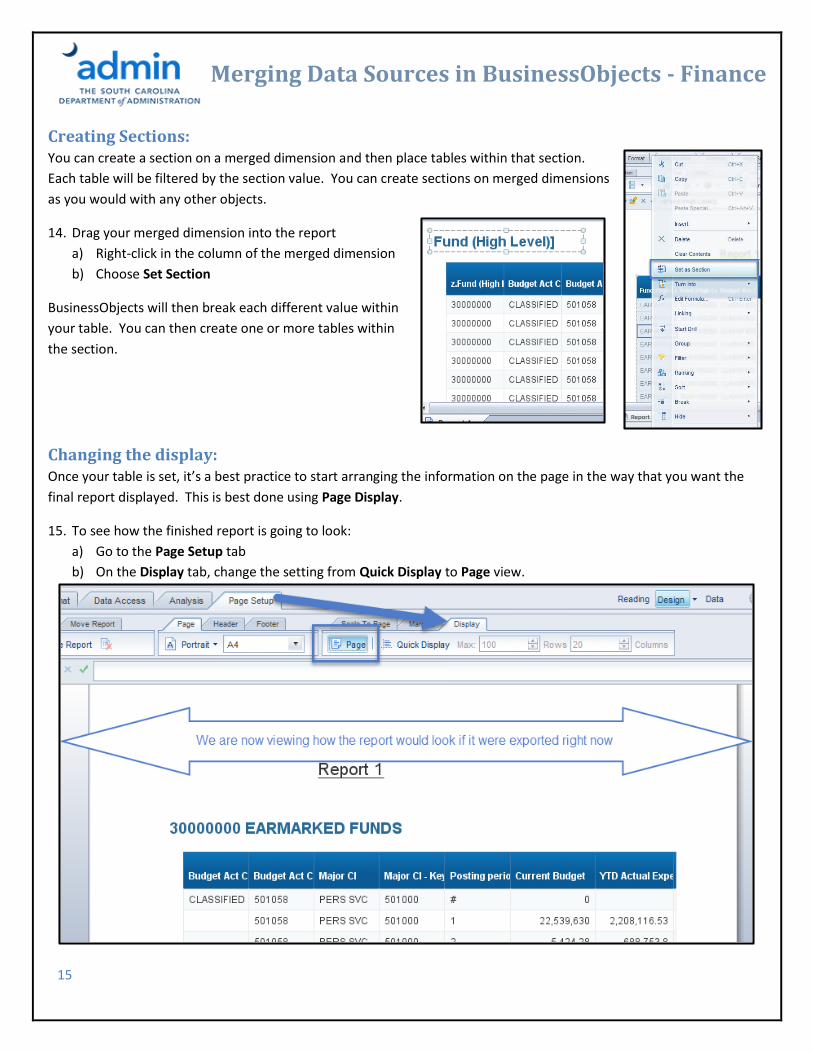
Creating Sections: You can create a section on a merged dimension and then place tables within that section.
Each table will be filtered by the section value. You can create sections on merged dimensions
as you would with any other objects.
14. Drag your merged dimension into the report
a) Right-click in the column of the merged dimension
b) Choose Set Section
BusinessObjects will then break each different value within
your table. You can then create one or more tables within
the section.
Changing the display: Once your table is set, it’s a best practice to start arranging the information on the page in the way that you want the
final report displayed. This is best done using Page Display.
15. To see how the finished report is going to look:
a) Go to the Page Setup tab
b) On the Display tab, change the setting from Quick Display to Page view.

16
Merging Data Sources in BusinessObjects - Finance
Note: you can go to the next page using the next page options at the bottom of the report:
Changing the Margins, Orientation, and Page Size: 16. Change the page properties by going to the Page Setup tab and changing the Margins or other Page properties.
Removing Items from your report: 17. Almost any item (table, chart, cell, section, etc.) can be deleted by right-clicking and choosing delete. Let’s delete
the “Report 1” cell by right-clicking and choosing delete.

17
Merging Data Sources in BusinessObjects - Finance
Positioning the section, table, and sizing the columns: Once you have the tables or sections in the report that you need, you can position them anywhere in the report.
18. To adjust the layout of the section:
a) Right-click anywhere in the section
b) Go to Format Section
c) In the Layout area, change the Minimum Top Offset and Top Margin to ensure that there is no extra space at
the top
19. To adjust tables:
a) Right-click on the edge of the table
b) Go to Format Table
c) In the Layout area, set the Horizontal position to 0” to the left of the section.
Note: The steps for positioning a text box is the same

18
Merging Data Sources in BusinessObjects - Finance
Note: You can make the table’s position relative to other tables, charts, or cells in a report by selecting whether to make
them relative to the Bottom Edge or Top Edge of a report component. In the example above, the table is set be
positioned .1” at the bottom edge of our section header. This is particularly useful when you have several tables of
information on one page of the report and the length of any one table is subject to change. Making tables relative to
another will avoid one table overlapping another.
Adjusting the size of columns You can set any column to auto-width, but for reports intended to be exported to PDF (like this one). It’s generally a
best practice to have each column have a set width.
20. Change the size of multiple columns simultaneously:
a) Use Ctrl and left-click the Budget Act CI and Commitment Items dimensions.
b) On the Format tab, go to the Size subsection and set both columns to 2.5”
21. Change the size of the measures by:
a) Using Shift and left click within the Budget column.
b) Left-clicking the remaining balance column. This will select the two columns and all columns in between.
c) Change the size to 1.4”
22. To Format Numbers:
a) Select all measures using Ctrl and left-clicking.
i) Note: You will need to select each measure in the subtotals and totals rows if you have subtotaled the table
before formatting the numbers (which we did).

19
Merging Data Sources in BusinessObjects - Finance
ii) Note 2: This is easier done by going to the last page of the report to see the totals rows, the subtotals rows,
and regular rows.
b) Once all the measures are selected and highlighted (like the image above), you can choose the number format
of your choice. The setting will then be applied to all selected columns.

20
Merging Data Sources in BusinessObjects - Finance
Putting Tables into your Report: Once you’ve got your margins and other settings changed, you can drag information from the different queries into a
report and filter them all for the same FI Account Assignment Information using the Merged Dimensions that we merged
earlier. Your report can contain multiple tables from multiple queries, but using a merged dimension will allow us to
filter each table for the same Funds Center/Functional Area.