Embed Size (px)
Citation preview
Cogent Analytics M&A Manual
Mergers and Acquisitions – A beginner’s guide
Cogent Analytics M&A Manual
2
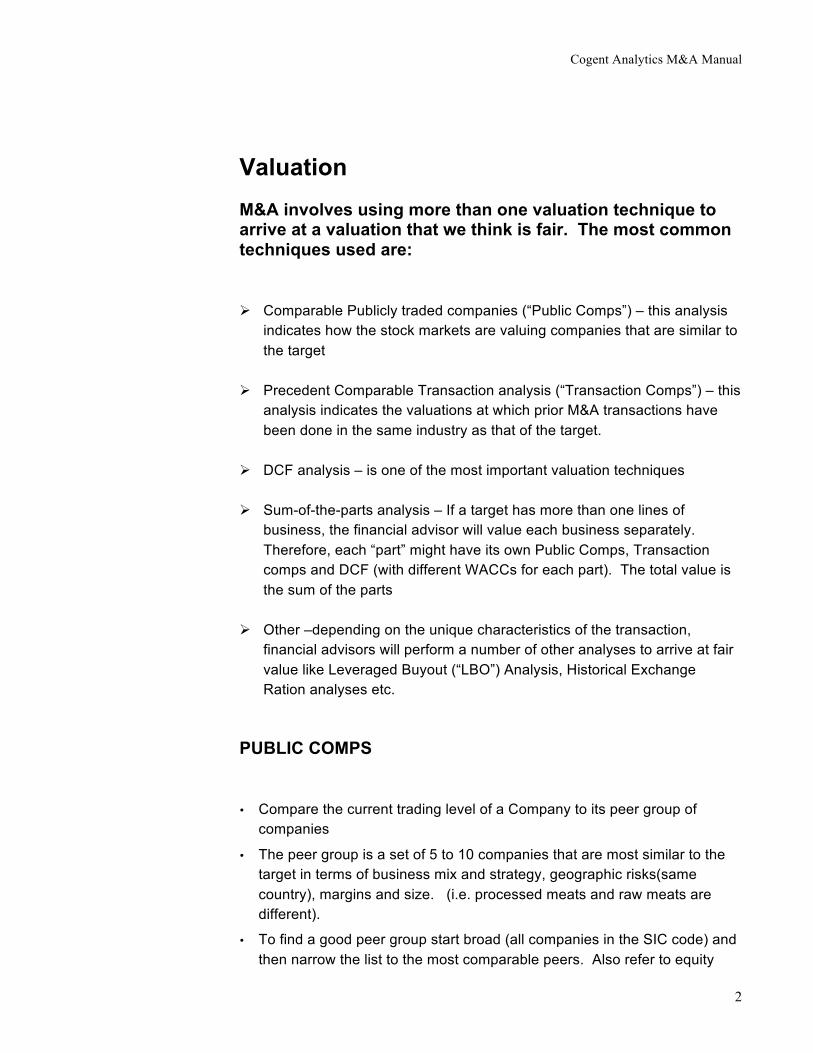
Valuation M&A involves using more than one valuation technique to arrive at a valuation that we think is fair. The most common techniques used are:
! Comparable Publicly traded companies (“Public Comps”) – this analysis indicates how the stock markets are valuing companies that are similar to the target
! Precedent Comparable Transaction analysis (“Transaction Comps”) – this analysis indicates the valuations at which prior M&A transactions have been done in the same industry as that of the target.
! DCF analysis – is one of the most important valuation techniques
! Sum-of-the-parts analysis – If a target has more than one lines of business, the financial advisor will value each business separately. Therefore, each “part” might have its own Public Comps, Transaction comps and DCF (with different WACCs for each part). The total value is the sum of the parts
! Other –depending on the unique characteristics of the transaction, financial advisors will perform a number of other analyses to arrive at fair value like Leveraged Buyout (“LBO”) Analysis, Historical Exchange Ration analyses etc.
PUBLIC COMPS
• Compare the current trading level of a Company to its peer group of companies
• The peer group is a set of 5 to 10 companies that are most similar to the target in terms of business mix and strategy, geographic risks(same country), margins and size. (i.e. processed meats and raw meats are different).
• To find a good peer group start broad (all companies in the SIC code) and then narrow the list to the most comparable peers. Also refer to equity

Cogent Analytics M&A Manual
3
research reports, industry reports, the company’s 10K where its discusses competitors and Bloomberg (Quote 2) to identify the most comparable peers. (look at filing 8K, prospectuses when they do a filing for new debt or equity – in freeedgar.)
• The goal of the analysis is to understand how the markets is valuing the peer group in terms of Price to Earnings, Price to Book value, Price to Cashflow to Equity, What the PEG ratio is, Enterprise Value to Revenues, EBITDA, Net Assets etc. Also understand if merger premium is already built into price – industry group should know this.
• There are always some industry specific comps (Telecom – Enterprise Value to POPs and SUBs, Electric Utilities - $/Mw etc.). Make sure you capture these in your analysis.
• Using these, we will try to value the target bearing in mind that public comps don’t reflect the “control premium” that an acquirer will pay for buying control of the target. The control premium is generally around 30% for U.S. transactions. Also, some companies that are widely perceived to be acquisition targets may have some premium built into their stock price.
• Most common multiples are:
1. Equity Multiples: P/E (Price / LTM EPS, Price / 1-Year forward EPS, Note that the Earnings need to be after Preferred Dividends so that they are earnings that are available to Common shareholders), Price to Book (Price / Book value of equity per share).
2. Enterprise Value Multiples: EV/Revenues, EV/ EBITDA, EV/EBIT (Note that the Revenues, EBITDA and EBIT multiples could be computed for LTM and 1-Year forward projected numbers)
TRANSACTION COMPS
• The goal here is to understand the multiples at which transactions in the target’s industry sector have been announced or completed. The importance difference with public comps is that in this case, a control premium is built into the offer price and therefore the multiples.
• Specifically, determine the pricing of past deals as compared to the target’s financial performance and unaffected (pre-announcement) market value
Understand why Equity valuation and Enterprise valuation are different
Cogent Analytics M&A Manual
4
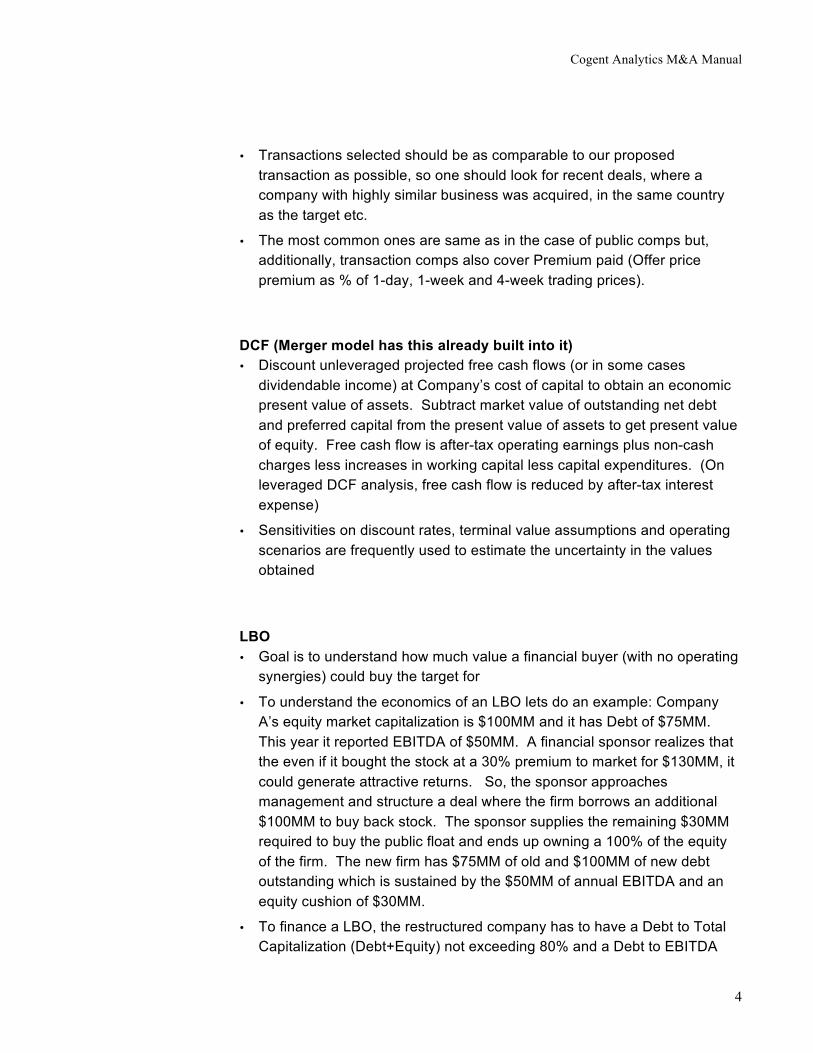
• Transactions selected should be as comparable to our proposed transaction as possible, so one should look for recent deals, where a company with highly similar business was acquired, in the same country as the target etc.
• The most common ones are same as in the case of public comps but, additionally, transaction comps also cover Premium paid (Offer price premium as % of 1-day, 1-week and 4-week trading prices).
DCF (Merger model has this already built into it) • Discount unleveraged projected free cash flows (or in some cases
dividendable income) at Company’s cost of capital to obtain an economic present value of assets. Subtract market value of outstanding net debt and preferred capital from the present value of assets to get present value of equity. Free cash flow is after-tax operating earnings plus non-cash charges less increases in working capital less capital expenditures. (On leveraged DCF analysis, free cash flow is reduced by after-tax interest expense)
• Sensitivities on discount rates, terminal value assumptions and operating scenarios are frequently used to estimate the uncertainty in the values obtained
LBO • Goal is to understand how much value a financial buyer (with no operating
synergies) could buy the target for
• To understand the economics of an LBO lets do an example: Company A’s equity market capitalization is $100MM and it has Debt of $75MM. This year it reported EBITDA of $50MM. A financial sponsor realizes that the even if it bought the stock at a 30% premium to market for $130MM, it could generate attractive returns. So, the sponsor approaches management and structure a deal where the firm borrows an additional $100MM to buy back stock. The sponsor supplies the remaining $30MM required to buy the public float and ends up owning a 100% of the equity of the firm. The new firm has $75MM of old and $100MM of new debt outstanding which is sustained by the $50MM of annual EBITDA and an equity cushion of $30MM.
• To finance a LBO, the restructured company has to have a Debt to Total Capitalization (Debt+Equity) not exceeding 80% and a Debt to EBITDA

Cogent Analytics M&A Manual
5
ratio that does not exceed 5.0x. Note that these could vary based on the nature of the industry.
• Assume current market scenarios for pricing the new debt
• The exit mechanism is an important element since it defines what the sponsor will do in, say, 5 years to exit the investment. In other words, is the sponsor planning an IPO or sale to strategic players? The sponsor’s returns will be driven by EBITDA growth rate, margins improvements, Capex, and exit multiples
• In a LBO, the entire equity is privately held, while in a Leveraged Recapitalization, there is usually a small percentage owned by publicly.

Cogent Analytics M&A Manual
6
Selected Public Comps statistics explained
(1) Closing price: most recent closing stock price (from Bloomberg, ILX or Populator). Prices for all companies should be as of the same date.
(2) Equity value: last closing stock price multiplied by number of shares outstanding. Shares outstanding from front page of latest 10K, 10Q, or other public document adjusted for options or other instruments in existence (if applicable). Note date of shares outstanding on the exhibit. The following is a list of definitions of shares outstanding:
• Basic: The actual outstanding shares which can be found on the cover of the latest 10Q or 10K.
• Diluted: This is the Basic shares plus the dilutive impact of any “in-the-money” options or warrants that are outstanding as calculated by the Treasury stock adjustment method. Look for average strike price and if lower than closing price then assume would convert. Look at public comps template. Option info is in 10K.
• Fully diluted: Basic + All options and warrants (as if all converted into equity)
• Average: This calculates the average shares that were outstanding during the year or quarter
(3) Firm value (or Enterprise Value): Equity market value + LT debt + ST debt + preferred stock + Minority Interest (-) cash. (Enterprise value may value from firm to firm or industry to industry – sum of total value of firm. Comes from cash flows of business.)
• Use net income to common for common share price
• Up to EBIT – still enterprise #’s. As soon as you pay interest – the net income belongs to equity holders.
LT debt: from latest 10K/Q under N/C liabilities – LT debt plus redeemable pfd. (Other types of pfd. stock are not considered LT debt.)

Cogent Analytics M&A Manual
7
ST debt: from latest 10K/Q under current liabilities – “ST borrowings,” “bank notes,” “loans,” plus “ “accrued interest” and “current maturities of LT debt” (if any)
Preferred stock: from latest 10K/Q under stockholders’ equity. Use market values, if possible, otherwise book values. (Market value can frequently be obtained from Bloomberg.)
Cash: from latest 10K/Q – “cash and cash equivalents” plus “marketable securities” (if any)
Common Firm Value multiples are: FV/Revenues, FV/EBITDA, FV/EBIT, FV/Cashflow, FV/Customers etc. We do NOT calculate FV/Net Income or FV/Book Value since the denominators in these “belong” to equity holders and so they are Equity multiples not Firm value multiples.
(4) Equity value multiples: While the Firm value multiples reflect how the business is valued, equity multiples reflect how equities are valued relative to the net income or EPS (LTM and projected) and Book value (latest available).
– Divide the LTM NI by the weighted average number of shares outstanding from the most recent 10Q to calculate LTM EPS. (Do not use LTM average shares!)
– Divide stock price by LTM EPS
Projected P/E: Get median I/B/E/S estimates for the next two years. (Available on Bloomberg, Infocenter, Insight, or Populator by inputting = IDD (“ticker,” “FY1MEDIA” or “FY2MEDIA,” 0). These estimates are reported on fully diluted basis and updated every Thursday. Always use median I/B/E/S (not mean) to avoid skewed data values. Calendarize earnings estimates as needed
Projected net income multiple: Multiply forward I/B/E/S by I/B/E/S projected weighted average shares outstanding (=IDD (“ticker,” “ibesshrs,” 0) to obtain projected net income. (Note that I/B/E/S shares are not fully diluted and are source from Exlel not “street” analysts. It is thus important to check to see that I/B/E/S projected shares outstanding are consistent with credible brokerage reports; if not, use most recent 10-Q shares outstanding to derive fully diluted shares.) Divide projected net income into current equity value.
(5) Long-term EPS growth rate: Get median I/B/E/S estimate from Infocenter, Insight, or Populator by typing = IDD (“ticker,” “MEDLTG,”

Cogent Analytics M&A Manual
8
0). These estimates are updated every Thursday. It is advisable to crosscheck this with analyst reports. (Bloomberg)
(6) Other equity multiples:( look at PEG ratios)
Price/book value per share: Book value equal to sum of common equity accounts on most recent financial stated divided by most recent number of shares outstanding; this result then divided into most recent stock price.
Price/cash flow per share: Cash flow refers to operating cash flow, or NI plus D&A plus deferred taxes plus other non-cash charges, divided by average number of shares outstanding; this result is then divided into most recent stock price.
(7) Last 12-Month (“LTM”) statistics: In order to see how a firm trades it is customary to calculate LTM Revenues, EBITDA, EBIT, Cashflow and Net Income or EPS (before any extraordinary items). Say, you are spreading comps in September 2001 for a company that has a Jan-Dec financial year. You would calculate the LTM EBITDA as follows: FYE 12/31/00 EBITDA (from 10K) + 6-Month EBITDA for 2001 (from the 10Q dated 6/30/01) (-) 6-Month EBITDA for 2000 (from the 10Q dated 6/30/01).
(8) Projected firm value statistics: In addition to LTM multiples, its customary to look at the multiples of 1 and 2 year forward Revenues, EBITDA, EBIT etc. We usually cite recent equity analyst reports as sources for publicly available projections. However, we could also make our own (private) projections and use them for calculation multiples. To adjust projected net income:
EBT = (NI + (Pref. Dividends + Minority Interest)) ÷ (1 - marginal tax rate) EBIT = EBT + net interest expense EBITDA = EBIT + Depreciation + Amortization

Cogent Analytics M&A Manual
9
Publicly Traded Comparable Company Analysis (Sample)
Closing Equity Firm Firm value/LTM Firm value/FY1 (first
proj. year) Price per share/EPS LT growth Optional multiples
Company Price¹ Value² Value³ Revenue EBITDA EBIT EBITDA EBIT LTM FY1 FY2 rate P/BVPS P/CFPS
($) ($MM) ($MM) (x) (x) (x) (x) (x) (%) (x) (x) Comp 1 Comp 2 Comp 3 Comp 4 Comp 5
Mean Median
Company financials Implied firm value Net debt Implied equity value Implied equity value per share Implied premium/ (discount)
¹ Based on closing stock price as of (date) ² Based on (#) shares outstanding from the latest 10K/Q dated (K/Q date) ³ Equity value plus total debt less cash

Cogent Analytics M&A Manual
10
Trading comparables
Exhibit: Selected operating statistics Projected LT growth rates LTM leverage Company
Business description
Sales¹
CF ¹,²
Five-year EPS³
LTM EBIT margin LTM EBITDA Margin
Adjusted book
Adjusted market
LTM EBIT/interest
(%) (%) (%) (%) (%) (%) (%) (x) Comp 1 Comp 2 Comp 3 Comp 4 Comp 5
Mean Median
Company ¹ Estimated CAGR over the next five years based on the Value Line report as of (date) ² Cash flow as defined by Value Line ³ Median estimated CAGR of EPS over the next five years based on the I/B/E/S report as of (date)

Cogent Analytics M&A Manual
11
Trading comparables
Exhibit: Selected credit and operating statistics Growth² Margins Returns Credit
Sales Earnings EBIT Earnings ROE ROC Leverage Interest coverage5 S&P/Mdy
Company¹ L3YA L3YA N5YA L3YA LTM L3YA LTM LFY LFY Book³ Mkt.4 L3YA LTM Rating (%) (%) (%) (%) (%) (%) (%) (%) (%) (%) (%) (x) (x) Comp 1 Comp 2 Comp 3 Comp 4 Comp 5
Mean Median
Company 1 All financial information is before extraordinary items. All LTM figures are for the period ending (latest 10K/Q date). Three-year averages for the fiscal years (date)–(date) 2 Next 5-years average annual EPS growth rate represents mean estimates from I/B/E/S report of (date) 3 Total debt divided by total debt and book value as of (latest 10K/Q) 4 Total debt divided by total debt and current market value 5 EBIT divided by gross interest expense
Cogent Analytics M&A Manual
12
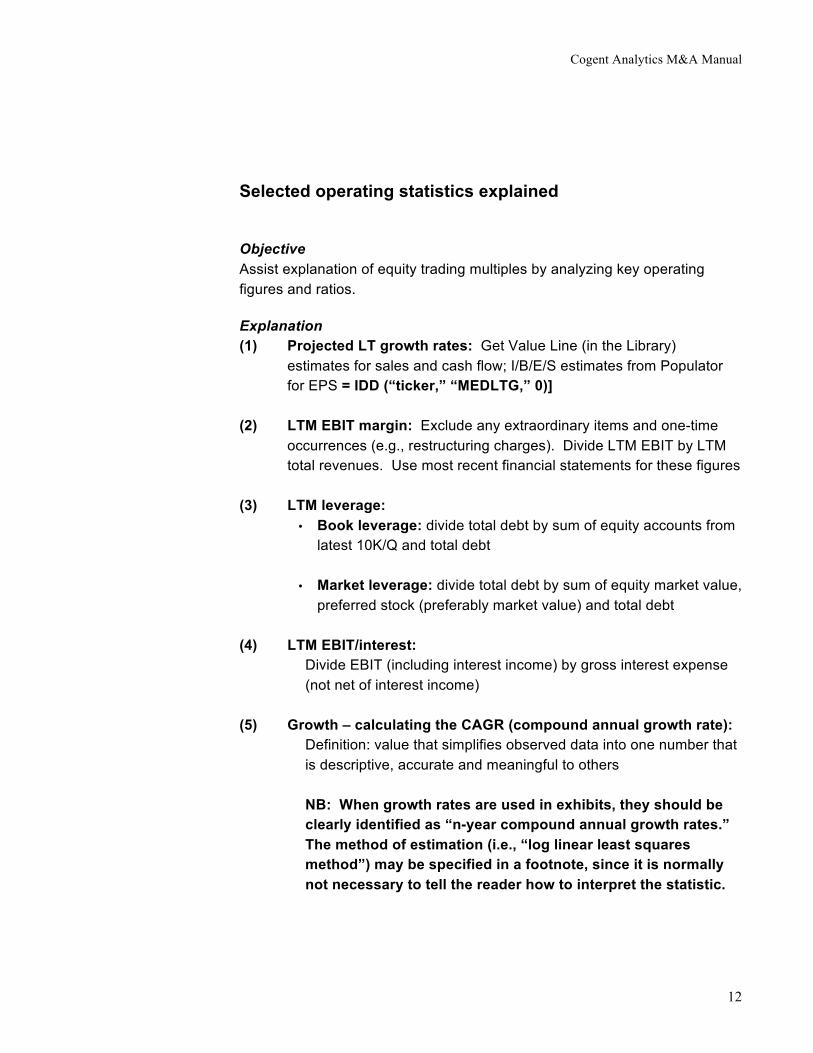
Selected operating statistics explained
Objective Assist explanation of equity trading multiples by analyzing key operating figures and ratios.
Explanation (1) Projected LT growth rates: Get Value Line (in the Library)
estimates for sales and cash flow; I/B/E/S estimates from Populator for EPS = IDD (“ticker,” “MEDLTG,” 0)]
(2) LTM EBIT margin: Exclude any extraordinary items and one-time occurrences (e.g., restructuring charges). Divide LTM EBIT by LTM total revenues. Use most recent financial statements for these figures
(3) LTM leverage: • Book leverage: divide total debt by sum of equity accounts from
latest 10K/Q and total debt
• Market leverage: divide total debt by sum of equity market value, preferred stock (preferably market value) and total debt
(4) LTM EBIT/interest: Divide EBIT (including interest income) by gross interest expense
(not net of interest income)
(5) Growth – calculating the CAGR (compound annual growth rate): Definition: value that simplifies observed data into one number that
is descriptive, accurate and meaningful to others
NB: When growth rates are used in exhibits, they should be clearly identified as “n-year compound annual growth rates.” The method of estimation (i.e., “log linear least squares method”) may be specified in a footnote, since it is normally not necessary to tell the reader how to interpret the statistic.
Cogent Analytics M&A Manual
13
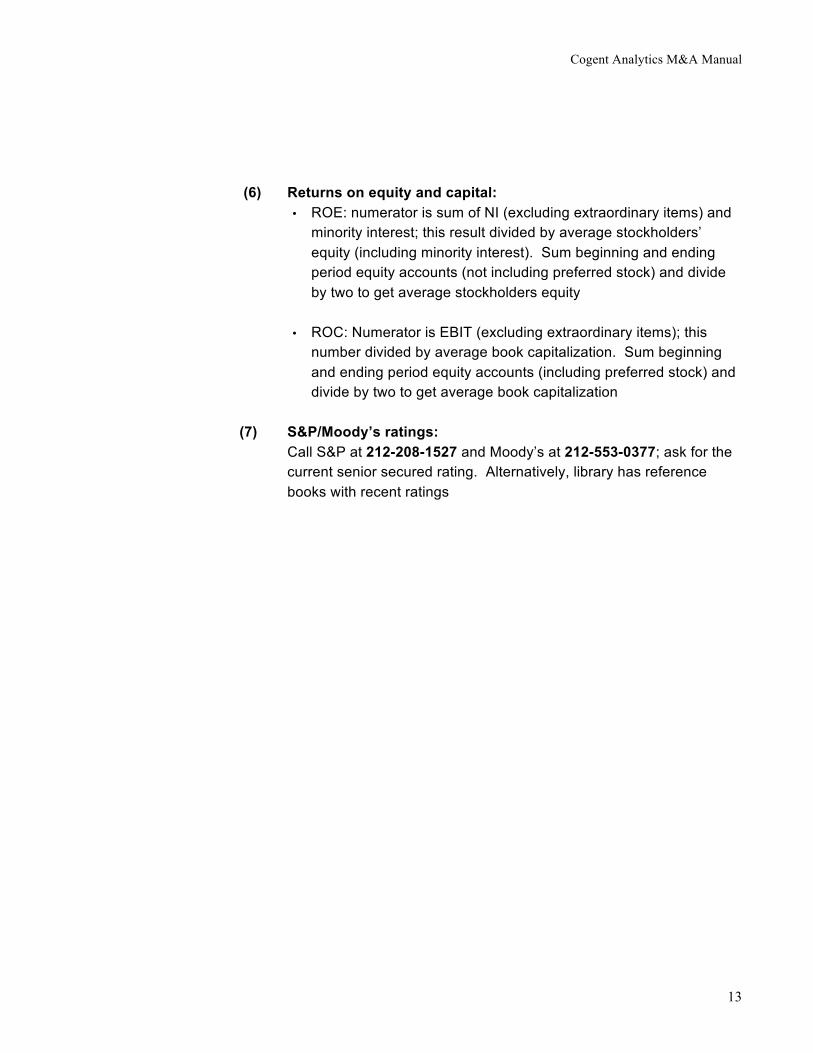
(6) Returns on equity and capital: • ROE: numerator is sum of NI (excluding extraordinary items) and
minority interest; this result divided by average stockholders’ equity (including minority interest). Sum beginning and ending period equity accounts (not including preferred stock) and divide by two to get average stockholders equity
• ROC: Numerator is EBIT (excluding extraordinary items); this number divided by average book capitalization. Sum beginning and ending period equity accounts (including preferred stock) and divide by two to get average book capitalization
(7) S&P/Moody’s ratings: Call S&P at 212-208-1527 and Moody’s at 212-553-0377; ask for the
current senior secured rating. Alternatively, library has reference books with recent ratings
Cogent Analytics M&A Manual
14
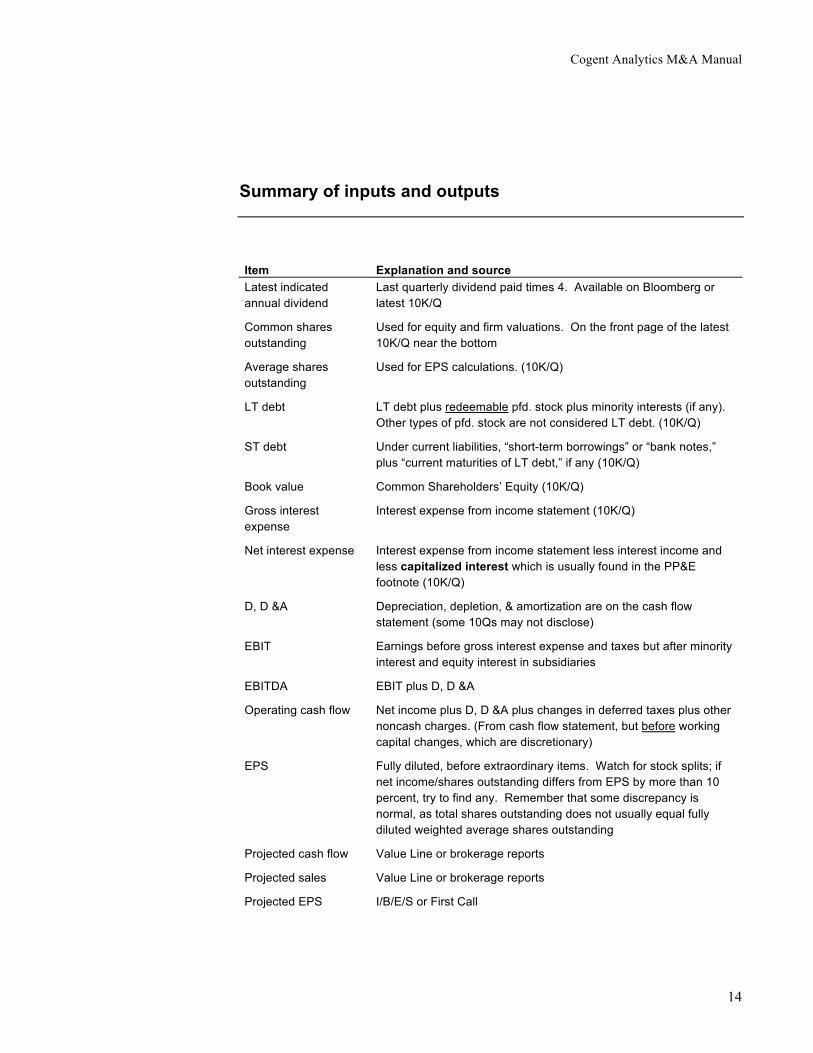
Summary of inputs and outputs
Item Explanation and source Latest indicated annual dividend
Last quarterly dividend paid times 4. Available on Bloomberg or latest 10K/Q
Common shares outstanding
Used for equity and firm valuations. On the front page of the latest 10K/Q near the bottom
Average shares outstanding
Used for EPS calculations. (10K/Q)
LT debt LT debt plus redeemable pfd. stock plus minority interests (if any). Other types of pfd. stock are not considered LT debt. (10K/Q)
ST debt Under current liabilities, “short-term borrowings” or “bank notes,” plus “current maturities of LT debt,” if any (10K/Q)
Book value Common Shareholders’ Equity (10K/Q)
Gross interest expense
Interest expense from income statement (10K/Q)
Net interest expense Interest expense from income statement less interest income and less capitalized interest which is usually found in the PP&E footnote (10K/Q)
D, D &A Depreciation, depletion, & amortization are on the cash flow statement (some 10Qs may not disclose)
EBIT Earnings before gross interest expense and taxes but after minority interest and equity interest in subsidiaries
EBITDA EBIT plus D, D &A
Operating cash flow Net income plus D, D &A plus changes in deferred taxes plus other noncash charges. (From cash flow statement, but before working capital changes, which are discretionary)
EPS Fully diluted, before extraordinary items. Watch for stock splits; if net income/shares outstanding differs from EPS by more than 10 percent, try to find any. Remember that some discrepancy is normal, as total shares outstanding does not usually equal fully diluted weighted average shares outstanding
Projected cash flow Value Line or brokerage reports
Projected sales Value Line or brokerage reports
Projected EPS I/B/E/S or First Call

Cogent Analytics M&A Manual
15
Exhibit: Outputs to the comparables Item Recipe, comments
Equity value Stock price x common shares outstanding
Equity capitalization Equity value + LT debt
Firm value Equity value + LT debt + ST debt – cash (+ minority interest, if added back to EBIT and EBITDA)
Price/earnings Stock price/EPS or equity value/net income (see EPS)
Price/cash flow Stock price/operating cash flow per share
Dividend yield Annual dividend/stock price
Price/book Stock price/book value per share
Percent payout Annual dividend/EPS
Interest coverage EBIT/gross interest expense
Firm value/EBIT1
Firm value/EBITDA1
Firm value/sales1
1 The idea is that since EBIT, EBITDA, and sales are not affected by the Company’s choice of capital structure (as cash flow, earnings, EPS, and book value are) the appropriate multiples use total capital and not just equity capital

Cogent Analytics M&A Manual
16
Comparable transactions analysis Typically, we begin with a SDC search for transactions in particular industry or SIC code. Additionally, one can usually find applicable transactions by looking at the acquisitions announced by companies in the peer group (of public comps by using the Bloomberg function CACS) and by reading the fairness opinions for these transactions from the merger proxies. 1. Date of announcement: Public announcement date (not rumor date).
From SDC output (check against news articles)
2. Target/target: Indicate acquiring company and target company or subsidiary of target company with parent of subsidiary in parenthesis. From SDC output
3. Consideration/transaction terms: Indicate consideration paid (cash, notes, stock) and terms offered (percent acquired; exchange ratio, offer price per share, debt assumption, competitive or negotiated bidding, etc.). From SDC output and public documents
4. Status: Indicate if transaction is pending, closed or terminated (footnote reason for termination of transaction). From SDC output
5. Equity purchase price: Equity value paid = Offer price x Target shares (cash transaction); Acquirer issue price x Exchange ratio x Target shares (stock transaction). From 8K or proxy1
6. Aggregate purchase price: Equity value paid + Target debt assumed2 – Target cash
7. Premium over market: Premium paid to get control of a target company. Equal to ((offer price per target share (cash transaction) or issue price per acquirer share times exchange ratio (stock transaction)) ÷ (the “unaffected” share price) – 1) x 100
N.B.: “Unaffected” share price is target share price one week prior to announcement. In instances where a transaction has been rumored for some time, it may be appropriate to use a longer time frame to calculate the “unaffected” share price
8. Transaction multiples
(a) Calculate LTM Revenue, EBITDA, EBIT, and net income using the latest financial statements prior to the announcement of the Transaction.
– See Trading Comparables if unclear on calculating LTM numbers

Cogent Analytics M&A Manual
17
(b) Calculate Book Value by taking Common Equity accounts from the annual report or 10K/Q immediately prior to the date of the transaction.
(c) Divide Book value and LTM net income into the equity purchase price; divide LTM Revenues, EBITDA and EBIT into Aggregate purchase price. The results are the comparable transactions multiples.
9. Estimated LTG rate: Calculate estimated long-term growth rate by taking the latest median I/B/E/S LTG rate prior to announcement of transaction. (Available on Intracenter, Insight or Populator)
10. Description of Target’s business: Summary of target’s business activities; from Bloomberg, S&P Tear Sheets, or Value Line
11. Other transaction multiples (Check with senior team member to ascertain whether inclusion is
appropriate)
(a) P/E - price earnings ratio can be calculated by dividing the offer price per target share (cash transaction) or the issue price per acquirer share times the exchange ratio (stock transaction) by LTM EPS available prior to transaction date
NB: This is not the same multiple as dividing the Equity purchase price by LTM net income. Transaction P/E value are often compared to the P/E values of a comparable industry or composite group on the transaction date.
(b) Price/Operating Cash Flow: Divide offer price per target share (cash transaction) or issue price per acquirer share times exchange ratio (stock transaction) by LTM OCF available prior to transaction date

Cogent Analytics M&A Manual
18
Exhibit: Premiums and multiples paid on comparable transactions Aggregate
purchase price as a multiple of
LTM:
Implied firm value as a multiple of LTM
Acquirer/ Target
Ann. Date
Consideration/ transaction terms
Status
% Vote
acquire.
Control?
Agg. purch.
price
Implied mkt. cap
Implied firm
value
Prem. over mkt.
LTM
NI
Book value
Sales
EBITDA
EBIT
Est. LTG Rate
Target Business Description
(%) ($MM) ($MM) ($MM) (1) (%) (2) (x) (x) (x) (x) (x) (%) (3) Ag-biotechnology – Mycogen transactions Pioneer/Mycogen 9/18/95 Cash; private; 3MM primary shares @ $10;
also, $21MM for R&D funding Closed 13.4 No 30.0 257.3 196.9 (13.0) NM 1.8 1.7 NM NM 17.5 Biopesticides;
crop protection DowElanco/Mycogen 1/15/96 Privately negotiated purchase of
secondary 9.5MM shares, from Lubrizol; Closed 36.6 No 126.0 444.7 358.1 (6.9) NM 2.3 2.9 NM NM 18.0 Biopesticides;
crop protection Mycogen/Lubrizol 1/15/96 Buyback of 19.46% stake in Mycogen Seeds from Lubrizol for 1.5MM
primary shares; separately, Lubrizol converts preferred shares, into 1.8MM primary shares @ 17.398 (25% premium over average closing price during prior 60 days)
– – – – – – – – – – NM
Mycogen/United Agriseeds 1/15/96 Concurrent sale by (DowElanco to MYCO for 4.5MM shares. (14.8%) and $26.4MM cash (DowElanco’s MYCO stake raised to 46.1%)
Closed 100.0 Yes 98.4 98.4 98.4 – – – – – – – Hybrid seed – corn soybean
Implied MYCO valuation @ $16 per share (last close pre issuance of 4.5MM shares. to DowElanco) No 72 536.6 623.3 12.3 NM 2.7 5.0 NM NM 18.0 DowElanco/Mycogen 12/4/96 Negotiated purchase of 1MM shares. from
Co. to thwart Monsanto overtures; DE stake over 50%
Closed 3.3 Yes 16.8 587.9 556.7 0.0 NM 3.4 3.5 NM NM 20.0 Biopesticides; crop protection
Ag-biotechnology – Calgene transactions Monsanto/Calgene 6/28/95 30.2MM primary shares (49.9%) in ex. for
$30.0MM cash, oils & produce techn., Gargiolyo (tomato germ plasm); privately negotiated reorg. w/purchase acct.
Closed 49.9 No 144.2 299.8 268.0 (30.5) NM 6.5 4.8 NM NM NA Food, seed and oleochemical biotech.
Monsanto/Calgene 7/31/96 Cash; 6.25MM primary shares @ 48.00 privately negotiated; MTC gains Board control with 54.6% voting block
Closed 4.7 Yes 50.0 573.1 620.5 80.3 NM 6.1 6.5 NM NM 20.0 Food, seed and oleochemical biotech.
Monsanto/Calgene 1/27/97 Two-step cash offer for last 45% stake; original offer of $7.25 in Jan., 1997, privately negotiated final offer @ $8.00
Pending 45.4 No 242.6 573.4 615.3 64.1 NM 7.2 4.0 NM NM 20.0 Food, seed and oleochemical biotech
Ag-biotechnology – other transactions Bionova (ELM)/DNA Plant Tech.
1/29/96 Stock swap reverse merger – DNAP is surviving entity s. ELM as 70% owner and Bionova mgmt. $39MM deal based on last DNAP close of $7 per share
Closed 70.0 Yes 38.6 63.4 67.9 (25.3) NM NM 4.5 NM NM 50.0 Plant cellular genetics
AgEvo (Hoechst/Schering) Plant Genetic Systems
8/23/96 Competitive bidding serious interest from Novartis, DuPont, Bayer and Zeneca
Closed 70.0 Yes 550.0 785.7 NA NA NA NA >100 NA NA NA Plant biotechnology
Ag-biotechnology – all transactions Mean: 10.1 NA 4.3 4.1 NA NA 23.4 Median: (3.5) NA 3.4 4.3 NA NA 20.0 1 Equal to amount paid per share times the pro forma number of shares outstanding (including options) 2 Equal to implied market capitalization plus total pro forma net debt 3 Unaffected price defined as closing price one week prior to transaction announcement 4 Median estimated CAGR of EPS over the five years post announcement date, based on the latest I/B/E/S report as of transaction announcement

Cogent Analytics M&A Manual
19
Discounted Cash Flow (“DCF”)
Unlevered and Levered DCFs: Levered DCF involves discounting cash flows available to equity holders i.e. the cash flow after interest and scheduled debt repayments. The discount rate is the equity cost of capital. Unlevered DCF discounts the firm’s free cash flows by the WACC. Unlevered means not looking at capital structure but rather CF to business.
Free Cash Flow (“FCF”) Definition: • Cash flow generated by all assets employed in business (tangible and
intangible)
• Unlevered (“free from financing considerations”)
• Accrual to all providers of capital
Calculation: Net income (excluding extraordinary items and before preferred
dividends, equity income and minority interest) + After-tax interest expense (net interest expense (1- average tax rate)) + Depreciation & amortization & deferred taxes & other non-cash charges – Capital expenditures – Difference between beginning and ending Net Working Investment
(“NWI”) = Free cash flow (unlevered)
NB: contrasted with cash flow from operations (net income available to common shareholders + depreciation & amortization + deferred taxes + non-cash charges)
Whether you use levered/unlevered – equity value should come out to same amount.
WACC is project specific – they may use acquirer’s WACC instead.