Embed Size (px)
Citation preview

NYJC 2015 9646/01/J2PRELIM/15
NANYANG JUNIOR COLLEGE JC 2 PRELIMINARY EXAMINATION Higher 2
PHYSICS 9646/01 Paper 1 Multiple Choice 30 September 2015
1 hour 15 minutes Additional Materials: Multiple Choice Answer Sheet
READ THESE INSTRUCTIONS FIRST
Write in soft pencil. Do not use staples, paper clips, highlighters, glue or correction fluid. Write your name, class and tutor’s name on the Answer Sheet in the spaces provided unless this has been done for you.
There are forty questions on this paper. Answer all questions. For each question there are four possible answers A, B, C and D. Choose the one you consider correct and record your choice in soft pencil on the separate Answer Sheet.
Read the instructions on the Answer Sheet very carefully.
Each correct answer will score one mark. A mark will not be deducted for a wrong answer. Any rough working should be done in this booklet.
This document consists of 18 printed pages.
[Turn over

2
NYJC 2015 9646/01/J2PRELIM/15
Data
Formulae
uniformly accelerated motion, s = ut + ½at2
v2 = u2 + 2as
work done on/by a gas, W = pΔV
hydrostatic pressure, p = ρgh
gravitational potential, φ = /Gm r−
displacement of particle in s.h.m. x = xo sin ωt
velocity of particle in s.h.m. v = vo cos ωt
= ( )22 xxo −± ω
mean kinetic energy of a molecule of an ideal gas E = 3
2kT
resistors in series, R = R1 + R2 + …
resistors in parallel, 1/R = 1/R1 + 1/R2 + …
electric potential, V = Q / 4πεor
alternating current/voltage, x = xo sin ωt
transmission coefficient, T ∝ exp(-2kd)
where k = ( )2
2
8 m U Eh
π −
radioactive decay, x = xo exp (-λt)
decay constant λ =
21
693.0t
speed of light in free space, c = 3.00 × 10⁸ m s-1
permeability of free space, μo = 4π × 10-7 H m-1
permittivity of free space, εo = 8.85 × 10⁻¹² F m-1
(1 / (36 π)) × 10-9 F m-1
elementary charge, e = 1.60 × 10⁻¹⁹ C
the Planck constant, h = 6.63 × 10⁻³⁴ J s
unified atomic mass constant, u = 1.66 × 10⁻²⁷ kg
rest mass of electron, me = 9.11 × 10⁻³¹ kg
rest mass of proton, mp = 1.67 × 10⁻²⁷ kg
molar gas constant, R = 8.31 J K-1 mol-1
the Avogadro constant, NA = 6.02 × 10²³ mol-1
the Boltzmann constant, k = 1.38 × 10⁻²³ J K-1
gravitational constant, G = 6.67 × 10⁻¹¹ N m2 kg-2
acceleration of free fall, g = 9.81 m s-2

3
NYJC 2015 9646/01/J2PRELIM/15 [Turn over
1 The figure below shows a particle moving with constant speed 10 m s-1 in a horizontal circular path about a point O.
What is the change in velocity of the particle in its motion from the point P to the point Q? A 5.0 m s-1 in the direction of PX.
B 7.3 m s-1 at an angle of 30 ° to the direction PX.
C 8.7 m s-1 at an angle of 90 ° to the direction PX.
D 10.0 m s-1 at an angle of 120 ° to the direction PX.
2 The density of a steel ball is determined by measuring its mass and diameter. The mass was measured within 1% and the diameter within 3%. The error in the calculated density of the steel ball is at most
A 2% B 4% C 10% D 28%
3 A stone is released from rest at a great height in air and falls owing to gravity. Each of the three graphs below represents the variation with time of one of three variables p, q and r.
Which of the following row correctly identifies the three variables p, q and r?
p q r
A acceleration velocity displacement
B acceleration displacement velocity
C displacement acceleration velocity
D velocity displacement acceleration
4
NYJC 2015 9646/01/J2PRELIM/15
4 In a tennis match, a ball is hit horizontally with a speed v as shown in the diagram.
The bottom of the ball is initially 2.4 m above the ground and at a horizontal distance 12 m from the net.
The ball just clears the net, which is 0.90 m high.
What is the value of v? (Neglect the effect of air resistance.) A 17 m s-1 B 22 m s-1 C 40 m s-1 D 43 m s-1
5 Two blocks, X and Y of mass m and 3m respectively, are accelerated along a smooth
horizontal surface by a force F applied to block Y as shown in the figure below.
The surface between the blocks is rough. If block X does not slide on block Y, what is the frictional force acting on block X?
A 4F B
3F C
2F D F
X
Y F

5
NYJC 2015 9646/01/J2PRELIM/15 [Turn over
6 Two spheres, X and Y, are moving towards each other at speeds u1 and u2 respectively, and make a head-on elastic collision. After the collision, X and Y move off with speeds v1 and v2 respectively, in the directions as shown.
What is the correct expression that equates the relative speed of approach to the relative speed of separation?
A u1 – u2 = v2 – v1
B u2 – u1 = v2 – v1
C u1 + u2 = v1 + v2
D u1 + u2 = v2 – v1
7 A small raft with a teenager and a bowling ball on it floats in a swimming pool. The water level at the edge of the pool is marked. The teenager drops the bowling ball into the pool. As a result, the level of water in the pool
A will rise.
B will fall.
C will stay the same.
D cannot be determined unless the masses of the raft, the teenager and the bowling ball are known.
u1 u2 before collision X Y
after collision v1 v2
X Y
6
NYJC 2015 9646/01/J2PRELIM/15
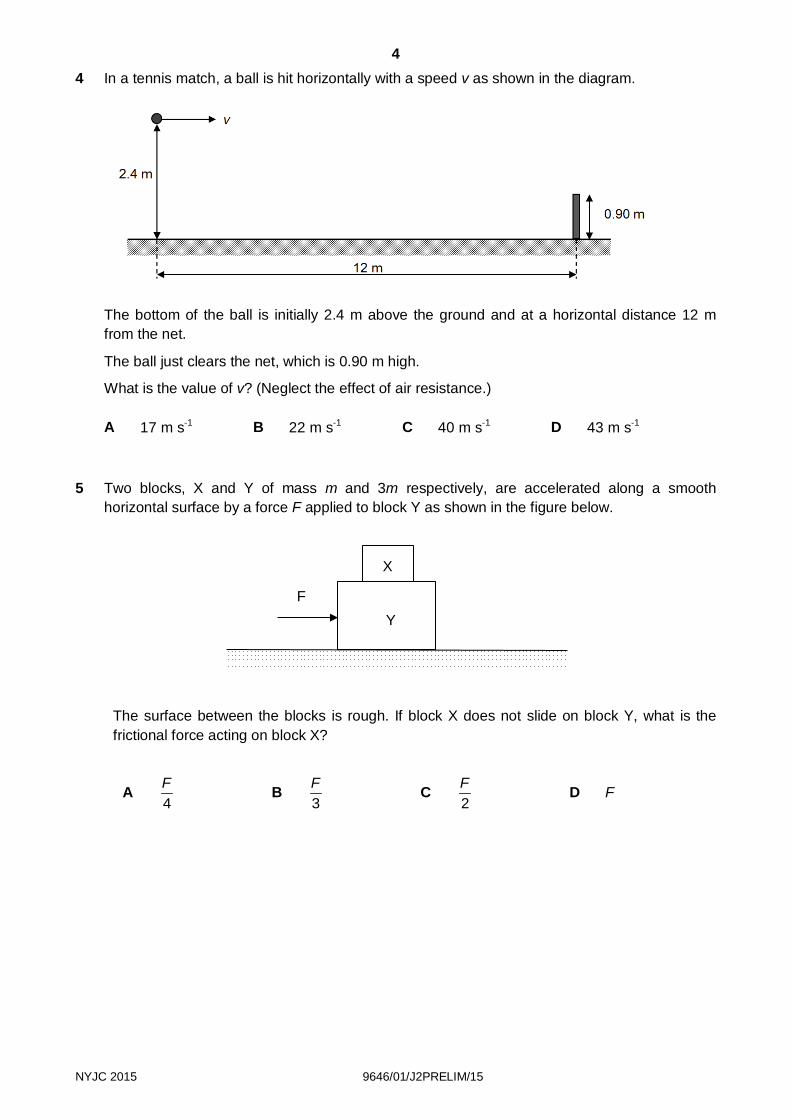
8 In order to support a load W, four light hinged rods P, Q, R and S are connected as shown below and mounted in a vertical plane.
Which rods are in compression and which are in tension? In compression In tension
A P Q, R, S
B P, Q R, S
C Q, R P, S
D R, S P, Q
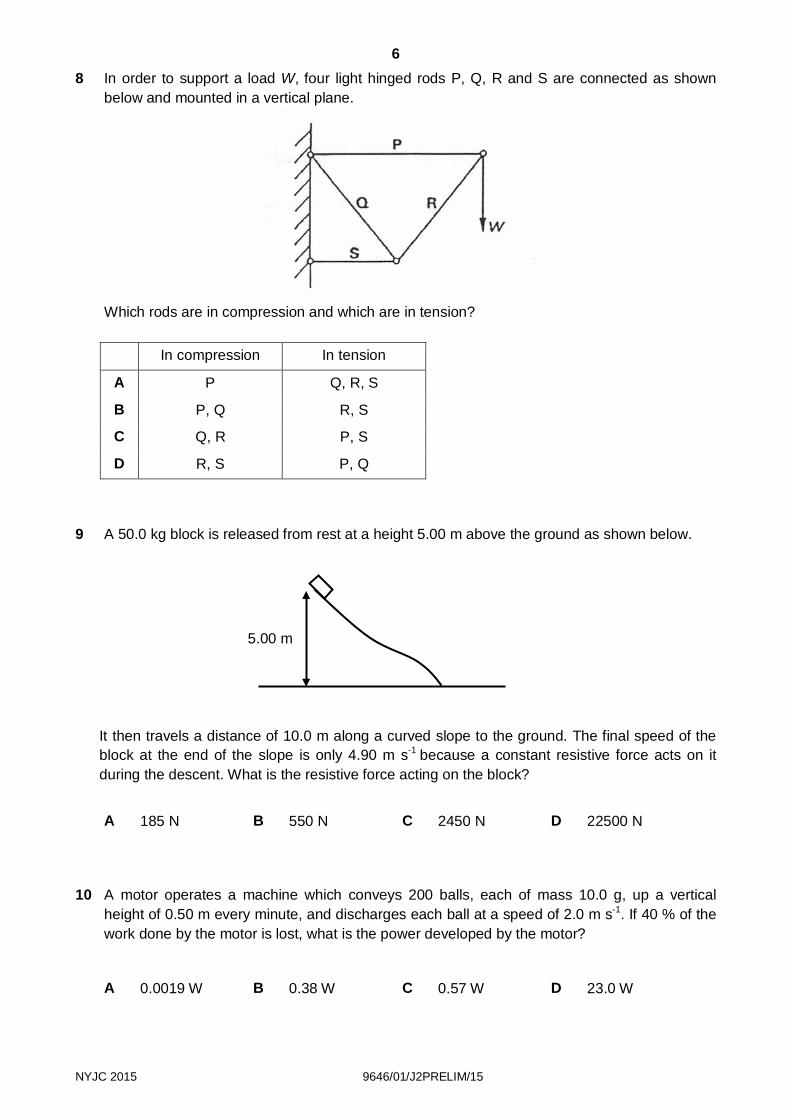
9 A 50.0 kg block is released from rest at a height 5.00 m above the ground as shown below.
It then travels a distance of 10.0 m along a curved slope to the ground. The final speed of the block at the end of the slope is only 4.90 m s-1 because a constant resistive force acts on it during the descent. What is the resistive force acting on the block?
A 185 N B 550 N C 2450 N D 22500 N
10 A motor operates a machine which conveys 200 balls, each of mass 10.0 g, up a vertical height of 0.50 m every minute, and discharges each ball at a speed of 2.0 m s-1. If 40 % of the work done by the motor is lost, what is the power developed by the motor?
A 0.0019 W B 0.38 W C 0.57 W D 23.0 W
5.00 m

7
NYJC 2015 9646/01/J2PRELIM/15 [Turn over
11 A rod is rotating about a pivot as shown. Points P and Q represent the two ends of the rotating rod. Point P moves with a linear speed vP and angular speed ωP, while point Q moves with a linear speed vQ and angular speed ωQ.
Which of the following correctly relates the linear speeds and angular speeds of P and Q?
Linear speed Angular speed
A vP = vQ ωP = ωQ
B vP = vQ 2ωP = ωQ
C 2vP = vQ ωP = ωQ
D 2vP = vQ 2ωP = ωQ
12 A toy car is released from rest from a height H and allowed to move along a smooth track. It then enters a loop-the-loop of diameter H as shown.
What is the likely position that the toy car will leave the track? A Between point X and point Y.
B At point Y.
C Between points Y and Z.
D At point Z.
H
track
Z(highest point)
Y(mid height)
X
toy car
pivot
P Q
L 2L

8
NYJC 2015 9646/01/J2PRELIM/15
13 Two stationary particles of mass 32 kg and 100 kg respectively are at a distance 20 m apart. A third particle, lying on the line joining the particles, experiences no resultant gravitational force. What is the distance of this particle from the 32 kg mass?
A 4.8 m B 7.2 m C 9.8 m D 11.3m
14 In two widely-separated planetary systems whose suns have masses S1 and S2, planet P1 of
mass M1 and planet P2 of mass M2 are observed to have circular orbits of equal radii about S1 and S2 respectively. If P1 completes an orbit in half the time taken by P2, it may be deduced that
A S1 = 0.25 S2 only.
B S1 = 0.25 S2 and M1 = M2.
C S1 = 4S2 only.
D S1 = 4S2 and M1 = M2.
15 Two vessels X and Y, of volume VX and VY, are kept at temperatures TX and TY respectively.
They are filled with the same ideal gas and connected by a narrow tube.
What is the ratio number of molecules in Xnumber of molecules in Y
?
A X X
Y Y
T VT V
B X Y
X X
T VT V
C Y Y
Y X
T VT V
D Y X
X Y
T VT V
16 A 2.0 kg chunk of ice at -20 oC is placed in 4.0 kg of water at an initial temperature. What is
the initial temperature of the water that will allow all the ice to just melt? Specific heat capacity of water = 4200 J kg-1 K-1 Specific heat capacity of ice = 2100 J kg-1 K-1 Specific latent heat of fusion = 3.35 × 10⁵ J kg-1
A 20 oC B 40 oC C 45 oC D 90 oC

9
NYJC 2015 9646/01/J2PRELIM/15 [Turn over
17 A particle of a mass of 90.0 g undergoes simple harmonic motion. The graph below shows the variation of its kinetic energy EK with time t.
What is the maximum acceleration of the particle?
A 0.074 m s -2 B 0.148 m s -2 C 37 m s-2 D 74 m s-2
18 In microwave ovens, water molecules in food are set into resonance when microwaves of a fixed frequency are incident on them. This causes the molecules to receive energy and hence warms up the food. In order to warm up the food faster, one can
A increase the frequency of the incident microwave while keeping its amplitude fixed.
B increase the frequency and amplitude of the incident microwave.
C increase the amplitude of the incident microwave while keeping its frequency fixed.
D keep both frequency and amplitude of the microwave the same as before but increase the frequency of the water molecules.
19 A point source of sound emits energy equally in all directions at a constant rate. A person 8 m
from the source listens to the sound. After a short while, the power of the source is halved. How far should the person now be from the source if he wishes to hear the sound with the same loudness as before?
A 2√2 m B 4 m C 4√2 m D 8√2 m 20 Which of the following statements describes a situation in which polarisation could not occur?
A Light waves pass through a pair of sunglasses.
B Light waves pass through a liquid crystal display.
C Microwaves pass through a metal grid.
D Sound waves pass through a metal grid.
t / ms
EK / J
1.0
100 200 300 400 0
10
NYJC 2015 9646/01/J2PRELIM/15
21 The stationary wave shown below is the result of the superposition of two identical waves travelling in opposite directions.
Which of the following best states the phase difference between the two waves at points X, Y and Z? X Y Z
A −π 0 π
B −π/2 0 π/2
C π/2 π 3π/2
D 0 π 2π
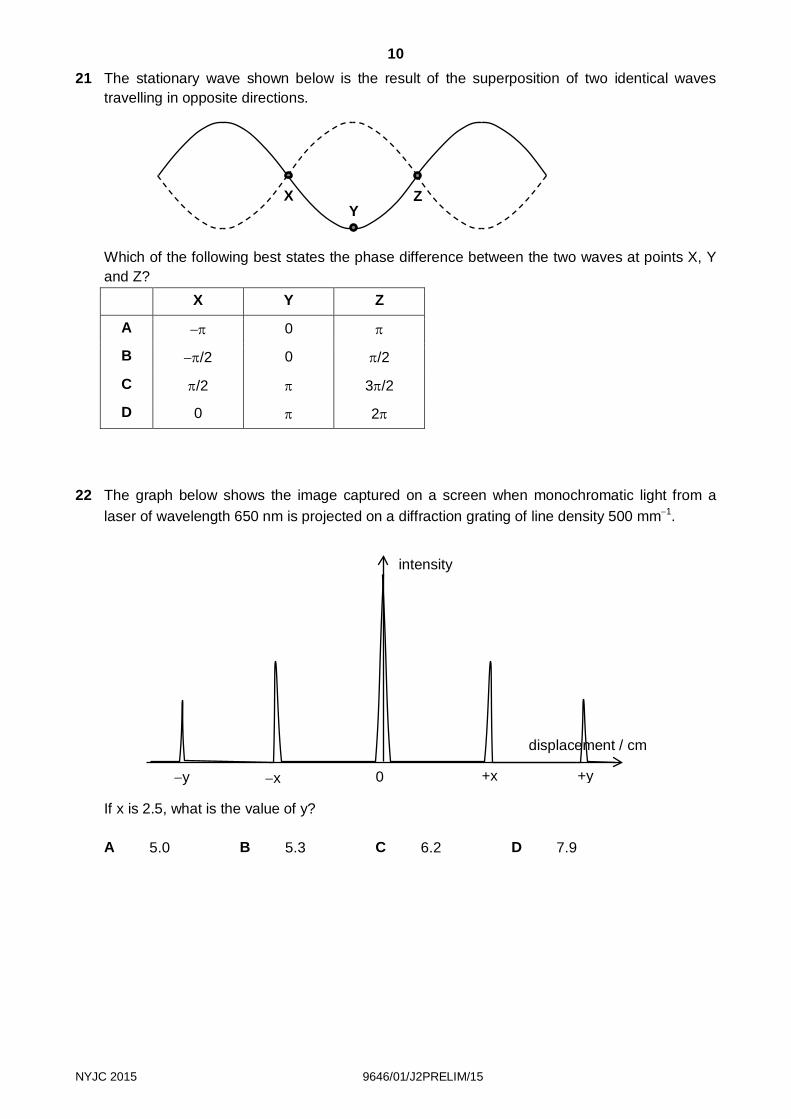
22 The graph below shows the image captured on a screen when monochromatic light from a
laser of wavelength 650 nm is projected on a diffraction grating of line density 500 mm−1.
If x is 2.5, what is the value of y? A 5.0 B 5.3 C 6.2 D 7.9
intensity
displacement / cm
0 −x −y +x +y
X Z Y

11
NYJC 2015 9646/01/J2PRELIM/15 [Turn over
23 Which of the following statements about an electric field is incorrect?
A The electric field strength due to a point charge is proportional to 1/r2 where r is the distance from the charge.
B Electric field strength is a vector quantity.
C The electric field strength is zero at all points where the potential is zero.
D The force acting on an electron, in the electric field between two oppositely charged large parallel plates, is constant.
24 An oil droplet has a charge –q and is situated between two parallel horizontal metal plates as
shown in the diagram.
The separation of the plates is d. The droplet is observed to be stationary when the upper plate is at potential +V and the lower plate at potential –V.
For this to occur, the weight of the droplet must be equal in magnitude to
A Vqd
B 2Vqd
C Vdq
D 2Vd
q
25 A slow beam of electrons is accelerated through a uniform electric field, such that the speed of
the electron doubles.
What is the ratio of Current of slow electron beam before acceleration
Current of accelerated electron beam ?
A 1 B 1/√2 C 1/2 D 1/(2)2
d
+V
-V
-q

12
NYJC 2015 9646/01/J2PRELIM/15
26 The graph below shows the I-V graph for a conductor X.
What is the resistance of X when it is connected across a 5.0 V cell? A 0.40 Ω B 0.50 Ω C 2.0 Ω D 2.5 Ω
27 The figure shows the arrangement of four resistors, each with a different resistance.
Which of the following switch settings will produce the greatest current in the circuit?
P Q R
A Open Open Open
B Open Closed Closed
C Closed Open Closed
D Closed Closed Closed
I / A
V / V
6.0 4.0 0
4.0
P Q R
1 Ω 2 Ω
8 Ω 4 Ω

13
NYJC 2015 9646/01/J2PRELIM/15 [Turn over
28 The figure below shows a circuit containing a cell, an ideal voltmeter, two identical resistors and two switches.
The table below shows the voltmeter readings at different states of the switches.
Switch P Open Closed
Switch Q Open Open
Voltmeter Reading 12.0 V 10.0 V What is the voltmeter reading when both switches are closed? A 8.0 V B 8.6 V C 9.2 V D 10.0 V
V
P
Q

14
NYJC 2015 9646/01/J2PRELIM/15
29 The diagram below shows a horizontal plane through which four long straight vertical wires pass.
Wires P, Q and R are at three corners of a square and wire S is at the centre. Wire P carries a current of 1 A out of the paper. Wire Q carries 2 A into the paper. Wire R carries 3 A out of the paper. Wire S carries a current out of the paper. Which one of the arrows below shows the direction of the force on wire S?
30 A horseshoe magnet rests on a top-pan balance with a wire situated between the poles of the magnet.
With no current in the wire, the reading on the balance is 142.0 g. With a current of 2.0 A in the wire in the direction XY, the reading on the balance changes to 144.6 g.
What is the reading on the balance, when there is a current of 3.0 A in the wire in the direction YX?
A 138.1 g B 140.7 g C 145.9 g D 148.5 g

15
NYJC 2015 9646/01/J2PRELIM/15 [Turn over
31 The circuit as shown below is set up with the switch closed and a small current is passed through the coil X. The current is slowly increased using the variable resistor. The current reaches a maximum value and is then switched off.
The maximum reading on the ammeter occurs when
A the current is small, at the beginning.
B the current is being increased.
C the current is being switched off.
D the current in X is zero. 32 A rectangular coil of area A has N turns of wire. The coil is placed in a uniform magnetic field
as shown.
When the coil is rotated at a constant frequency f about axis XX, an alternating e.m.f. of peak
value εo is induced in it. What is the maximum value of the magnetic flux linkage through the coil?
A 2
o
fεπ
B o
fεπ
C ofπ ε D 2 ofπ ε
uniform magnetic field region
X X
16
NYJC 2015 9646/01/J2PRELIM/15
33 A sinusoidal alternating supply of peak voltage 100 V is connected in series to a diode and a 100 Ω resistor. The diode is ideal with zero forward resistance and an infinite reverse resistance.
What is the value of the mean current in the resistor?
A less than 0.5 A
B 0.5 A
C 0.7 A
D 1 A 34 A transformer has 1150 turns on the primary coil and 500 turns on the secondary coil. The
primary coil draws a current of 0.26 A from a 230 V a.c. supply. The current in the secondary current is 0.50 A.
What is the efficiency of the transformer?
A 42% B 50% C 84% D 100%
35 An electron of mass m and charge e is accelerated from rest through an electric field of potential difference V. What is the frequency of a photon whose wavelength is equal to the de Broglie wavelength of this electron? (c is the speed of light and h is the Planck constant.)
A 2c meVh
B 2h
c meV C hc
eV D eV
h
36 The photoelectric work function for sodium is 3.65 × 10⁻¹⁹ J. Ultraviolet radiation of frequency
8.90 × 10¹⁴ Hz is directed at a clean sodium surface in a vacuum, causing photoelectric emission.
What is the kinetic energy of the fastest electron emitted?
A 2.25 × 10⁻¹⁹ J B 3.65 × 10⁻¹⁹ J C 5.90 × 10⁻¹⁹ J D 9.55 × 10⁻¹⁹ J
37 Which of the following statements about laser is false?
A The laser beam is monochromatic because most electrons undergo the same transition.
B The laser beam is extremely unidirectional.
C When a laser beam passes through a small aperture, it undergoes diffraction.
D All photons in the laser cavity are generated by stimulated emission.
17
NYJC 2015 9646/01/J2PRELIM/15 [Turn over
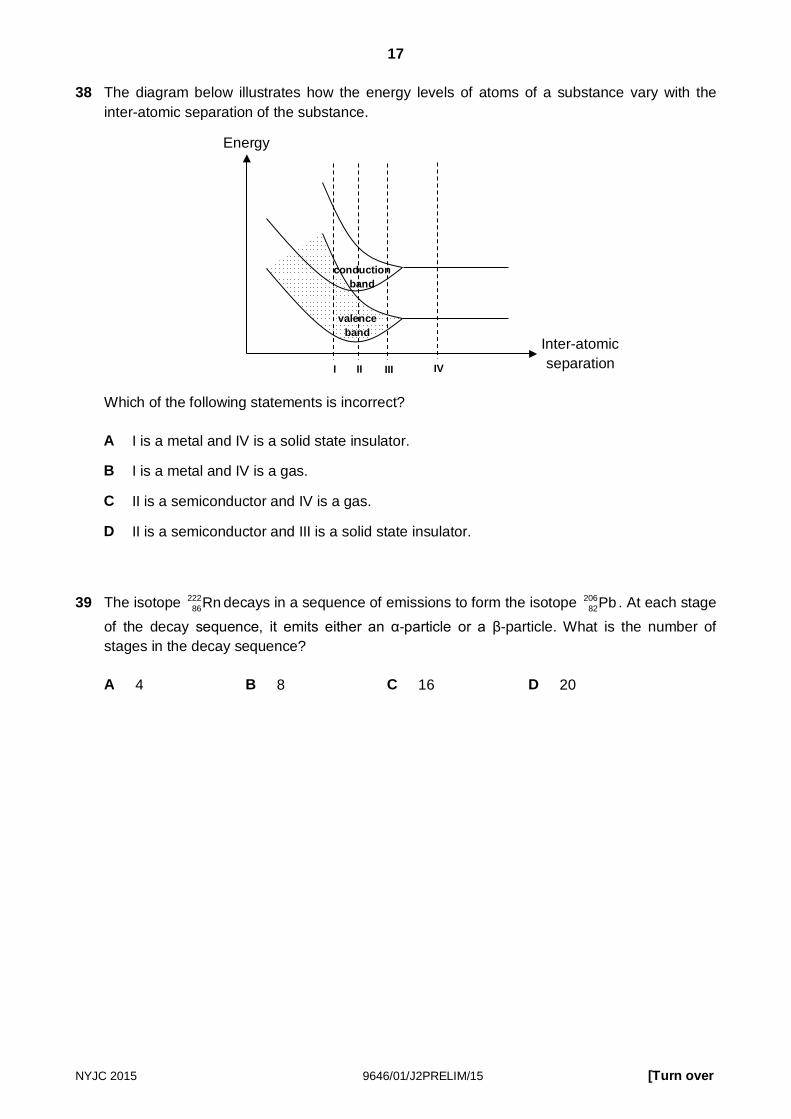
38 The diagram below illustrates how the energy levels of atoms of a substance vary with the inter-atomic separation of the substance.
Which of the following statements is incorrect? A I is a metal and IV is a solid state insulator.
B I is a metal and IV is a gas.
C II is a semiconductor and IV is a gas.
D II is a semiconductor and III is a solid state insulator.
39 The isotope 222
86Rn decays in a sequence of emissions to form the isotope 20682Pb . At each stage
of the decay sequence, it emits either an α-particle or a β-particle. What is the number of stages in the decay sequence?
A 4 B 8 C 16 D 20
II
valence band
conduction band
Energy
Inter-atomic separation IV III I

18
NYJC 2015 9646/01/J2PRELIM/15
40 Alpha, beta and gamma radiations are absorbed to different extents in solids, and behave differently in electric and magnetic fields. The diagrams below illustrate these behaviours.
Which three labels on these diagrams refer to the same kind of radiation?
A N, Q, X B M, P, Z C L, P, Z D L, P, X

H2 Physics Paper 1 Answer Key
1 D 11 C 21 A 31 C 2 C 12 C 22 C 32 A 3 B 13 D 23 C 33 A 4 B 14 C 24 B 34 C 5 A 15 D 25 A 35 B 6 C 16 C 26 D 36 A 7 B 17 D 27 D 37 D 8 D 18 C 28 B 38 A 9 A 19 C 29 B 39 B 10 B 20 D 30 A 40 B

NYJC 2015 9646/02/J2PRELIM/15
NANYANG JUNIOR COLLEGE JC 2 PRELIMINARY EXAMINATION Higher 2
CANDIDATE NAME
CLASS
TUTOR’S NAME
PHYSICS 9646/02 Paper 2 Structured Questions 17 September 2015
1 hour 45 minutes Candidates answer on the Question Paper. No Additional Materials are required.
READ THESE INSTRUCTIONS FIRST
Write your name and class on all the work you hand in. Write in dark blue or black pen on both sides of the paper. You may use an HB pencil for any diagrams or graphs. Do not use staples, paper clips, glue or correction fluid. The use of an approved scientific calculator is expected where appropriate. Answer all questions. At the end of the examination, fasten all your work securely together. The number of marks is given in brackets [ ] at the end of each question or part question.
For Examiner’s Use
1
2
3
4
5
6
7
8
Total
This document consists of 19 printed pages.
[Turn over

2
NYJC 2015 9646/02/J2PRELIM/15
Data
Formulae
uniformly accelerated motion, s = ut + ½at2
v2 = u2 + 2as
work done on/by a gas, W = pΔV
hydrostatic pressure, p = ρgh
gravitational potential, φ = /Gm r−
displacement of particle in s.h.m. x = xo sin ωt
velocity of particle in s.h.m. v = vo cos ωt
= ( )22 xxo −± ω
mean kinetic energy of a molecule of an ideal gas E = 3
2kT
resistors in series, R = R1 + R2 + …
resistors in parallel, 1/R = 1/R1 + 1/R2 + …
electric potential, V = Q / 4πεor
alternating current/voltage, x = xo sin ωt
transmission coefficient, T ∝ exp(–2kd)
where k = ( )2
2
8 m U Eh
π −
radioactive decay, x = xo exp (–λt)
decay constant λ =
21
693.0t
speed of light in free space, c = 3.00 × 10⁸ m s–1
permeability of free space, μo = 4π × 10–7 H m–1
permittivity of free space, εo = 8.85 × 10⁻¹² F m–1
(1 / (36 π)) × 10–9 F m–1 elementary charge, e = 1.60 × 10⁻¹⁹ C
the Planck constant, h = 6.63 × 10⁻³⁴ J s
unified atomic mass constant, u = 1.66 × 10⁻²⁷ kg
rest mass of electron, me = 9.11 × 10⁻³¹ kg
rest mass of proton, mp = 1.67 × 10⁻²⁷ kg
molar gas constant, R = 8.31 J K–1 mol–1
the Avogadro constant, NA = 6.02 × 10²³ mol–1
the Boltzmann constant, k = 1.38 × 10⁻²³ J K–1
gravitational constant, G = 6.67 × 10⁻¹¹ N m2 kg–2
acceleration of free fall, g = 9.81 m s–2

3
NYJC 2015 9646/02/J2PRELIM/15 [Turn over
For Examiner’s
Use
1 A speed-time graph for an MRT train travelling between two stations is shown in Fig. 1.1.
(a) On Fig. 1.2, draw the corresponding acceleration-time graph. Add numerical values
on the acceleration axis. [2]
0
5
10
15
20
25
0 20 40 60 80 100 120
spee
d / m
s-1
time / s
0 20 40 60 80 100 120
acce
lera
tion
/ m s
-2
time / s
Fig. 1.1
Fig. 1.2

4
NYJC 2015 9646/02/J2PRELIM/15
For Examiner’s
Use (b) Calculate the distance travelled between the two stations.
distance = m [2]
(c) On Fig.1.3, sketch a labelled distance-time graph of the train between the two stations.
[3]
time / s
distance / m
Fig. 1.3

5
NYJC 2015 9646/02/J2PRELIM/15 [Turn over
For Examiner’s
Use
2 Object X, of mass 8.50 kg, is connected to object Y, of mass 5.00 kg, by a light inextensible string as shown in Fig. 2.1.
Fig. 2.1
Initially, the system is at rest, the spring is at its natural length and there is tension in the
string. Assume the incline and pulley are smooth. (a) Explain why X will move up the slope after the system is released from rest.
[1]
(b) Calculate the speed of X when Y has travelled a distance of 1.50 m. The spring is at
its natural length at this moment. speed of X = m s-1 [3]
300
X Y

6
NYJC 2015 9646/02/J2PRELIM/15
For Examiner’s
Use (c) The string is cut and object Y free falls. The speed of Y is 3.00 m s-1 when the spring starts to change its length. The spring
has a spring constant of 2.00 × 10² N m-1. Show that the maximum change in length of the spring is 0.289 m. [2] 3 The variation with displacement of the acceleration of an animal’s eardrum is shown in
Fig. 3.1.
Fig. 3.1
acceleration / m s-2
-0.20
-0.15
-0.10
-0.05
0.00
0.05
0.10
0.15
0.20
-2.5 -2.0 -1.5 -1.0 -0.5 0.0 0.5 1.0 1.5 2.0 2.5displacement / cm

7
NYJC 2015 9646/02/J2PRELIM/15 [Turn over
For Examiner’s
Use
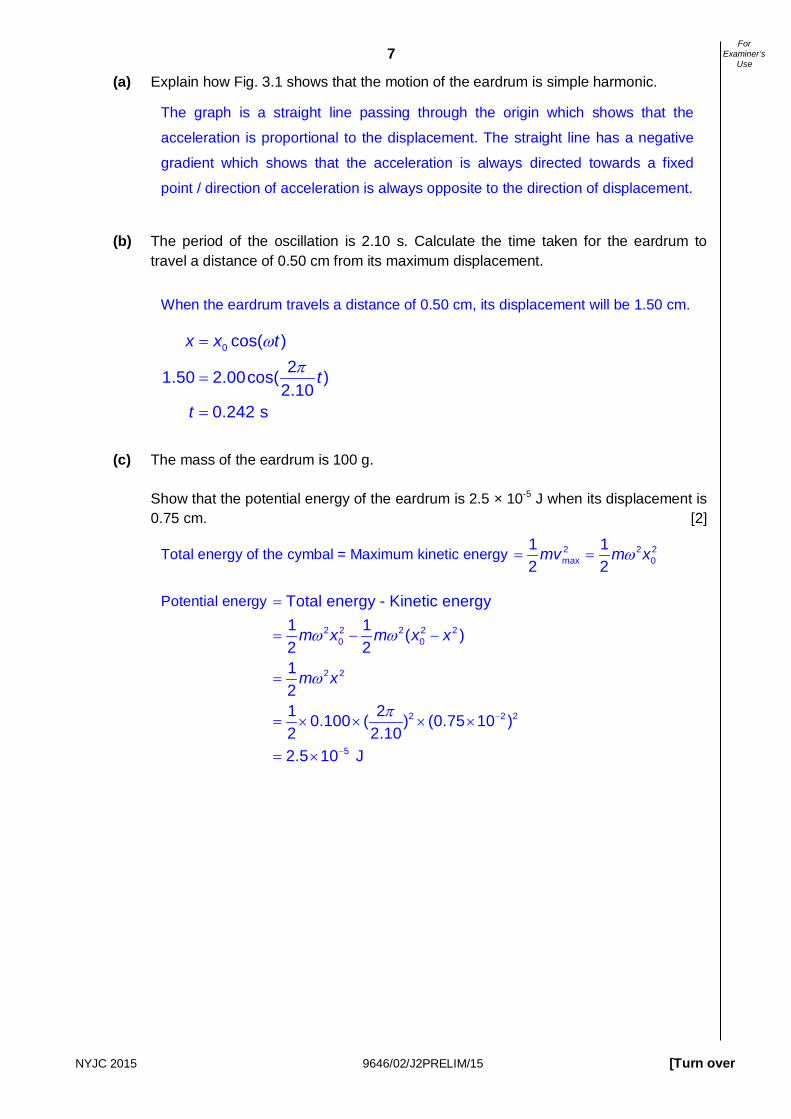
(a) Explain how Fig. 3.1 shows that the motion of the eardrum is simple harmonic.
[2]
(b) The period of the oscillation is 2.10 s. Calculate the time taken for the eardrum to
travel a distance of 0.50 cm from its maximum displacement. time taken = s [3] (c) The mass of the eardrum is 100 g. Show that the potential energy of the eardrum is 2.5 × 10⁻⁵ J when its displacement is
0.75 cm. [2]

8
NYJC 2015 9646/02/J2PRELIM/15
For Examiner’s
Use 4 (a) (i) Explain why the gravitational potential at a point in a gravitational field is negative.
[1]
(ii) The gravitational potential at the surface of Earth is -62.6 × 10⁶ J kg-1, and that
at the surface of moon is -28.1 × 10⁶ J kg-1. 1. On Fig. 4.1, sketch a graph which shows the variation of gravitational field
strength along a line from the surface of Earth to the surface of Moon. [1]
2. Hence sketch, on Fig. 4.2, a graph which shows the variation of gravitational potential along a line from the surface of Earth to the surface of Moon. [1]
Moon Earth
Fig. 4.1
Fig. 4.2
Distance from surface of Earth
Distance from surface of Earth
Gravitational field strength
Gravitational potential

9
NYJC 2015 9646/02/J2PRELIM/15 [Turn over
For Examiner’s
Use
(b) An isolated spherical planet has a diameter of 6.8 × 10⁶ m. Its mass of 6.4 × 10²³ kg may be assumed to be a point mass at the centre of the planet.
(i) Show that the gravitational field strength at the surface of the planet is
3.7 N kg-1. [1]
(ii) A stone of mass 2.4 kg is raised from the surface of the planet through a vertical height of 1800 m. Use the value of the field strength from (i) to determine the change in gravitational potential energy of the stone. Explain your working. change in gravitational potential energy = J [2]
(iii) A rock, initially at rest at infinity, moves towards the planet. At point P, its height above the surface of the planet is 3.5 D, where D is the diameter of the planet, as shown in Fig. 4.3.
Fig. 4.3 Calculate the speed of the rock at point P. speed at point P = m s-1 [2]

10
NYJC 2015 9646/02/J2PRELIM/15
For Examiner’s
Use 5 Electrical wires are often made up of thin copper strands wrapped inside an insulating rubber sheath. Electrical resistivity of copper is 1.7 × 10⁻⁸ Ω m.
(a) Calculate the resistance of a thin copper strand of diameter 0.10 mm and length
30 cm. resistance = Ω [2] (b) Calculate the number of such strands in a connecting wire of length 30 cm and
resistance 50 mΩ. number of strands = [2]
(c) Two of the wires described in (b) are used to set up the circuit shown in Fig. 5.1.
Fig. 5.1
2.0 V
24 Ω

11
NYJC 2015 9646/02/J2PRELIM/15 [Turn over
For Examiner’s
Use
Calculate the ratio of Total Power Loss in Connecting Wires
Total Power Supplied by Cell .
ratio = [4] (d) Explain why a connecting wire that is made up of thin strands may cause electrical
fires if its end is frayed.
[2]
6 (a) (i) Explain how band theory predicts that the conductivity of a metal should
increase when temperature increases.
[2]
(ii) Explain why the conductivity of metal actually decreases when temperature
increases.
[2]

12
NYJC 2015 9646/02/J2PRELIM/15
For Examiner’s
Use (b) (i) With reference to a p-type semi-conductor, explain how doping increases the conductivity of the semi-conductor.
[2]
(ii) Suggest why the resistance of a highly doped semi-conductor will actually increase rather than decrease, when temperature increases.
[1] 7 A capillary tube is a tube that is open at both ends and has a very narrow bore. A capillary
tube is supported vertically with one end immersed in water. Water rises up the tube due to a phenomenon called capillary action. The water in the bore of the tube forms a column of height h as shown in Fig. 7.1.
Fig. 7.1
h
glass wall glass wall
narrow bore
water

13
NYJC 2015 9646/02/J2PRELIM/15 [Turn over
For Examiner’s
Use
(a) The height h for a particular capillary tube was measured for different temperatures of the water. The variation with temperature θ of the height h is as shown in Fig. 7.2.
Fig. 7.2
(i) Draw the best fit line for the data points on Fig. 7.2. [1] (ii) Explain why the results suggest that the relationship between h and θ is of the
form h = ho (1 – kθ), where ho and k are constants.
[2]
8
9
10
11
12
13
14
15
16
17
0 10 20 30 40 50 60 70 80 90 100θ /
oC
h / cm

14
NYJC 2015 9646/02/J2PRELIM/15
For Examiner’s
Use (iii) Use Fig. 7.2 to determine the constants ho and k, with appropriate units. ho = units: [2]
k = units: [3]
(b) The experiment is repeated using tubes with bores of different radii r but keeping the
water temperature constant. Fig 7.3 shows the variation with 1r
of the height h for
capillary tubes of different radii r for a water temperature of 20 oC.
1
r
Fig. 7.3
0.00
0.05
0.10
0.15
0.20
0.25
0.30
0.35
0 5 10 15 20 25
/ × 103 m-1
h / m

15
NYJC 2015 9646/02/J2PRELIM/15 [Turn over
For Examiner’s
Use
It is suggested that capillary action is one of the means by which water moves from the roots of a tree to the leaves. (i) Using information from Fig. 7.3, estimate the radius of the bore of the tubes that
will enable water to be raised by capillary action from the ground to the top of a tree which has a height of 25 m. State one assumption that was made.
radius of bore = m [3] Assumption:
[1]
(ii) Comment on your answer to (i).
[1]
(c) Suggest two other factors, apart from temperature and bore radii, which will affect the height h of the column.
1.
2.
[2]

16
NYJC 2015 9646/02/J2PRELIM/15
For Examiner’s
Use 8 A transformer is an electrical device that transfers electrical energy between two or more circuits through electromagnetic induction. A varying current in the transformer's primary winding creates a varying magnetic flux in the transformer core and a varying magnetic field impinging on the transformer's secondary winding. Commonly, transformers are used to increase or decrease the voltages of alternating current in electric power applications. A student suggests that if there is a break in the transformer core, the output voltage in the secondary coil will be different from the value when there is no break.
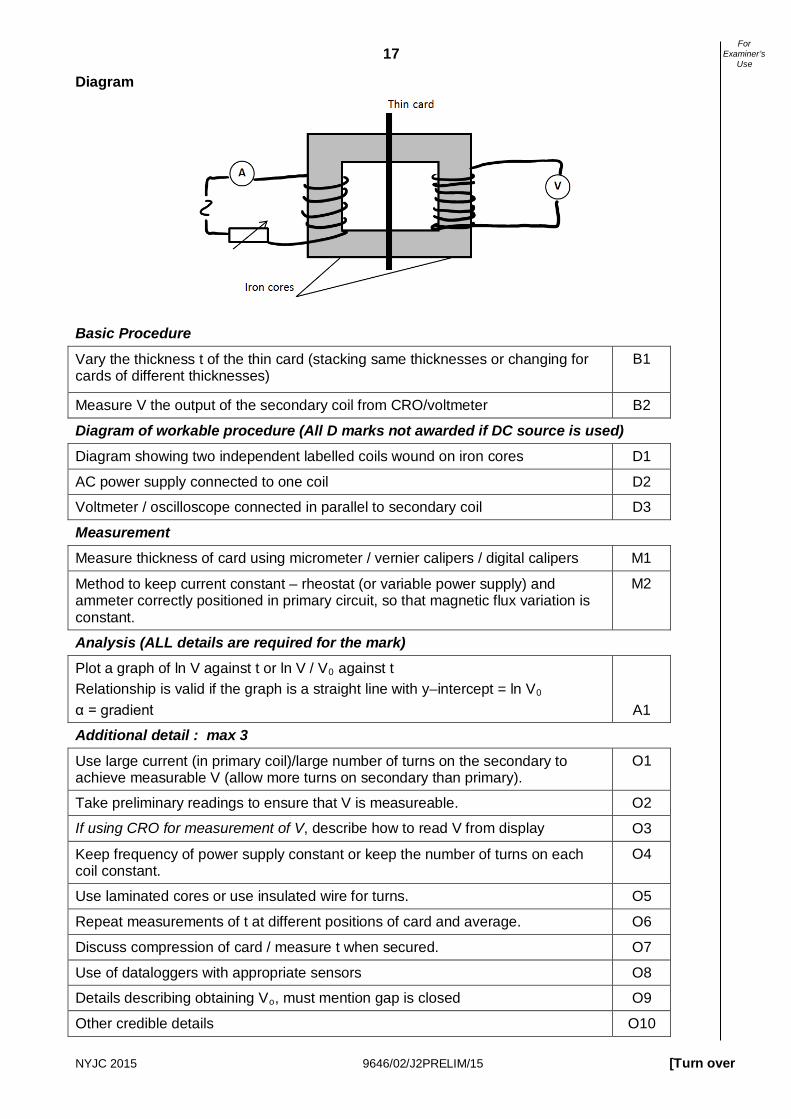
To study this effect, a model can be set up using a thin card inserted between two separate iron cores, as shown in Fig. 8.1.
Fig. 8.1
A coil is wound around one core. A current in the coil may induce an e.m.f. in another coil wound on the other core. The induced e.m.f. V depends on the thickness t of the card. The student suggests that
V = V0 e-αt
where V0 is the induced e.m.f. without card between the cores and α is a constant. Design a laboratory experiment to test the relationship between V and t, and determine the value of α. In your account you should pay particular attention to
(a) the procedure to be followed,
(b) the measurements to be taken,
(c) the control of variables,
(d) the analysis of the data,
(e) the safety precautions to be taken.
Thin card
iron cores

17
NYJC 2015 9646/02/J2PRELIM/15 [Turn over
For Examiner’s
Use
Diagram

18
NYJC 2015 9646/02/J2PRELIM/15
For Examiner’s
Use

19
NYJC 2015 9646/02/J2PRELIM/15 [Turn over
For Examiner’s
Use
[12]

NYJC 2015 9646/02/J2PRELIM/15
NANYANG JUNIOR COLLEGE JC 2 PRELIMINARY EXAMINATION Higher 2
CANDIDATE NAME
CLASS
TUTOR’S NAME
PHYSICS 9646/02 Paper 2 Structured Questions 17 September 2015
1 hour 45 minutes Candidates answer on the Question Paper. No Additional Materials are required.
READ THESE INSTRUCTIONS FIRST
Write your name and class on all the work you hand in. Write in dark blue or black pen on both sides of the paper. You may use an HB pencil for any diagrams or graphs. Do not use staples, paper clips, glue or correction fluid. The use of an approved scientific calculator is expected where appropriate. Answer all questions. At the end of the examination, fasten all your work securely together. The number of marks is given in brackets [ ] at the end of each question or part question.
For Examiner’s Use
1
2
3
4
5
6
7
8
Total
This document consists of 18 printed pages.
[Turn over
SOLUTION
2
NYJC 2015 9646/02/J2PRELIM/15
Data
Formulae
uniformly accelerated motion, s = ut + ½at2
v2 = u2 + 2as
work done on/by a gas, W = pΔV
hydrostatic pressure, p = ρgh
gravitational potential, φ = /Gm r−
displacement of particle in s.h.m. x = xo sin ωt
velocity of particle in s.h.m. v = vo cos ωt
= ( )22 xxo −± ω
mean kinetic energy of a molecule of an ideal gas E = 3
2kT
resistors in series, R = R1 + R2 + …
resistors in parallel, 1/R = 1/R1 + 1/R2 + …
electric potential, V = Q / 4πεor
alternating current/voltage, x = xo sin ωt
transmission coefficient, T ∝ exp(–2kd)
where k = ( )2
2
8 m U Eh
π −
radioactive decay, x = xo exp (–λt)
decay constant λ =
21
693.0t
speed of light in free space, c = 3.00 × 10⁸ m s–1
permeability of free space, μo = 4π × 10–7 H m–1
permittivity of free space, εo = 8.85 × 10⁻¹² F m–1
(1 / (36 π)) × 10–9 F m–1 elementary charge, e = 1.60 × 10⁻¹⁹ C
the Planck constant, h = 6.63 × 10⁻³⁴ J s
unified atomic mass constant, u = 1.66 × 10⁻²⁷ kg
rest mass of electron, me = 9.11 × 10⁻³¹ kg
rest mass of proton, mp = 1.67 × 10⁻²⁷ kg
molar gas constant, R = 8.31 J K–1 mol–1
the Avogadro constant, NA = 6.02 × 10²³ mol–1
the Boltzmann constant, k = 1.38 × 10⁻²³ J K–1
gravitational constant, G = 6.67 × 10⁻¹¹ N m2 kg–2
acceleration of free fall, g = 9.81 m s–2

3
NYJC 2015 9646/02/J2PRELIM/15 [Turn over
For Examiner’s
Use
1 A speed-time graph for an MRT train travelling between two stations is shown in Fig. 1.1.
(a) On Fig. 1.2, draw the corresponding acceleration-time graph. Add numerical values
on the acceleration axis. [2]
0
5
10
15
20
25
0 20 40 60 80 100 120
spee
d / m
s-1
time / s
0 20 40 60 80 100 120
acce
lera
tion
/ m s
-2
time / s
Fig. 1.1
Fig. 1.2
0
1.0
2.0
-2.0
-1.0

4
NYJC 2015 9646/02/J2PRELIM/15
For Examiner’s
Use (b) Calculate the distance travelled between the two stations.
distance = m [2]
(c) On Fig.1.3, sketch a labelled distance-time graph of the train between the two stations.
[3]
time / s
distance / m
Fig. 1.3
distance travelled = area under speed-time graph from 0 – 120s = ½ (20.0)(120+88) – 1/2 (20)(5.0) = 2030 = 2.0 × 10³ m

5
NYJC 2015 9646/02/J2PRELIM/15 [Turn over
For Examiner’s
Use
2 Object X, of mass 8.50 kg, is connected to object Y, of mass 5.00 kg, by a light inextensible string as shown in Fig. 2.1.
Fig. 2.1
Initially, the system is at rest, the spring is at its natural length and there is tension in the
string. Assume the incline and pulley are smooth. (a) Explain why X will move up the slope after the system is released from rest.
(b) Calculate the speed of X when Y has travelled a distance of 1.50 m. The spring is at
its natural length at this moment.
Since the component of the weight of X along the slope (mg sin 300 = 42 N) is
smaller than the weight of Y (mg = 49 N), X will move up the slope.
Height gained by X 01.50sin30 0.75 m= =
By conservation of energy,
2 2
2
loss in G.P.E of Y Gain in G.P.E of X Gain in K.E of X Gain in K.E of Y1 15.00 9.81 1.50 8.50 9.81 0.75 5.00 8.502 2
1(5.00 8.50) 5.00 9.81 1.50 8.50 9.81 0.752
2(5.00 9.81 1.50 8.50 9.81
v v
v
v
= + +
× × = × × + × × + × ×
+ × = × × − × ×
× × − × ×=
1
0.75)5.00 8.50
1.28 m s−
+=
300
X Y

6
NYJC 2015 9646/02/J2PRELIM/15
For Examiner’s
Use (c) The string is cut and object Y free falls.
The speed of Y is 3.00 m s-1 when the spring starts to change its length. The spring has a spring constant of 2.00 × 10² N m-1.
Show that the maximum change in length of the spring is 0.289 m. [2]
3 The variation with displacement of the acceleration of an animal’s eardrum is shown in
Fig. 3.1.
Fig. 3.1
By conservation of energy,
2 2 2
2
loss in G.P.E of Y Loss in K.E of Y Gain in E.P.E of spring1 15.00 9.81 5.00 3.00 2.00 102 2
100 49.05 22.5 00.289 m
x x
x xx
+ =
× × + × × + = × × ×
− − ==
acceleration / m s-2
-0.20
-0.15
-0.10
-0.05
0.00
0.05
0.10
0.15
0.20
-2.5 -2.0 -1.5 -1.0 -0.5 0.0 0.5 1.0 1.5 2.0 2.5displacement / cm
7
NYJC 2015 9646/02/J2PRELIM/15 [Turn over
For Examiner’s
Use
(a) Explain how Fig. 3.1 shows that the motion of the eardrum is simple harmonic.
(b) The period of the oscillation is 2.10 s. Calculate the time taken for the eardrum to
travel a distance of 0.50 cm from its maximum displacement.
(c) The mass of the eardrum is 100 g. Show that the potential energy of the eardrum is 2.5 × 10⁻⁵ J when its displacement is
0.75 cm. [2]
The graph is a straight line passing through the origin which shows that the
acceleration is proportional to the displacement. The straight line has a negative
gradient which shows that the acceleration is always directed towards a fixed
point / direction of acceleration is always opposite to the direction of displacement.
When the eardrum travels a distance of 0.50 cm, its displacement will be 1.50 cm.
0 cos( )21.50 2.00cos( )
2.100.242 s
x x t
t
t
ωπ
=
=
=
Total energy of the cymbal = Maximum kinetic energy 2 2 2max 0
1 12 2
mv m xω= =
Potential energy
2 2 2 2 20 0
2 2
2 2 2
5
Total energy - Kinetic energy1 1 ( )2 2121 20.100 ( ) (0.75 10 )2 2.102.5 10 J
m x m x x
m x
ω ω
ω
π −
−
=
= − −
=
= × × × ×
= ×

8
NYJC 2015 9646/02/J2PRELIM/15
For Examiner’s
Use 4 (a) (i) Explain why the gravitational potential at a point in a gravitational field is negative.
Since the direction of the force exerted by the external agent is opposite to the
direction of displacement of the mass when it moves from infinity to a point in
the gravitational field, the work done by the external agent is negative. Hence
gravitational potential at that point is negative.
(ii) The gravitational potential at the surface of Earth is -62.6 × 10⁶ J kg-1, and that at the surface of moon is -28.1 × 10⁶ J kg-1. 1. On Fig. 4.1, sketch a graph which shows the variation of gravitational field
strength along a line from the surface of Earth to the surface of Moon. [1]
2. Hence sketch, on Fig. 4.2, a graph which shows the variation of gravitational potential along a line from the surface of Earth to the surface of Moon. [1]
Moon Earth
Fig. 4.1
Fig. 4.2
-62.6 × 10⁶ J kg-1
-28.1 × 10⁶ J kg-1
Distance from surface of Earth
Distance from surface of Earth
Gravitational field strength
Gravitational potential

9
NYJC 2015 9646/02/J2PRELIM/15 [Turn over
For Examiner’s
Use
(b) An isolated spherical planet has a diameter of 6.8 × 10⁶ m. Its mass of 6.4 × 10²³ kg may be assumed to be a point mass at the centre of the planet.
(i) Show that the gravitational field strength at the surface of the planet is
3.7 N kg-1. [1] 11 23
1 12 6 2
(6.67 10 )(6.4 10 ) 3.69 N kg 3.7 N kg(3.4 10 )
GMgr
−− −× ×
= = = =×
(ii) A stone of mass 2.4 kg is raised from the surface of the planet through a vertical
height of 1800 m. Use the value of the field strength from (i) to determine the change in gravitational potential energy of the stone. Explain your working. Since the height of 1800 m is much smaller than the radius of the planet, it can be assumed that the stone is moved through 1800 m in a uniform gravitational field. Hence 42.4(3.7)(1800) 1.6 10 JpE mg h∆ = ∆ = = ×
(iii) A rock, initially at rest at infinity, moves towards the planet. At point P, its height above the surface of the planet is 3.5 D, where D is the diameter of the planet, as shown in Fig. 4.3.
Fig. 4.3 Calculate the speed of the rock at point P.
Assumption: All the loss in gravitational potential energy of the rock is transferred to its kinetic energy.
Total final KE + GPE = Total initial KE + GPE
2
11 233 1
6
1 0 02 8
(6.67 10 )(6.4 10 ) 1.77 10 m s4 4(3.4 10 )
GMmmvr
GMvr
−−
+ − = +
× ×⇒ = = = ×
×

10
NYJC 2015 9646/02/J2PRELIM/15
For Examiner’s
Use 5 Electrical wires are often made up of thin copper strands wrapped inside an insulating rubber sheath. Electrical resistivity of copper is 1.7 × 10⁻⁸ Ω m.
(a) Calculate the resistance of a thin copper strand of diameter 0.10 mm and length
30 cm. resistance = Ω [2] (b) Calculate the number of such strands in a connecting wire of length 30 cm and
resistance 50 mΩ. number of strands = [2]
(c) Two of the wires described in (b) are used to set up the circuit shown in Fig. 5.1.
Fig. 5.1
Calculate the ratio of Total Power Loss in Connecting Wires
Total Power Supplied by Cell .
ratio = [4]
2.0 V
24 Ω
R = ρ L / A
= 1.7×10−8 × 0.30 / π(5.0×10⁻⁵)2
= 0.65 Ω m−1
Strands are in parallel.
R’ = R/N N = R/R’ = 0.65/0.050 = 13
Total resistance = 24 Ω
Current in each wire = V / RTotal = 2.0 / 24 = 0.083 A
Total power loss = 2 × (0.0832 × 0.050) = 6.9×10⁻⁴ W
Total power supplied = I E = 0.083 × 2.0 = 0.167 W
Ratio = 6.9×10⁻⁴ / 0.167 = 4.2×10⁻³

11
NYJC 2015 9646/02/J2PRELIM/15 [Turn over
For Examiner’s
Use
(d) Explain why a connecting wire that is made up of thin strands may cause electrical fires if its end is frayed.
[2]
6 (a) (i) Explain how band theory predicts that the conductivity of a metal should
increase when temperature increases.
[2]
(ii) Explain why the conductivity of metal actually decreases when temperature
increases.
[2]
Frayed ends: Not all the strands are connected
may cause sparking with external surfaces due to potential difference
start fires with nearby combustible / flammable materials, or
increase in resistance of wire increase in heat generated in wires
When temperature increase, more electrons are able to gain sufficient energy
to reach the conduction band creating more ‘holes’ in the valence band
increasing the conductivity due to increase in number of charge carriers.
When temperature increase, the lattice vibration will also increase which also
decrease the mobility of the charge carriers. When this outweighs the effect of
increase in charge carriers, the resistance will increase.

12
NYJC 2015 9646/02/J2PRELIM/15
For Examiner’s
Use (b) (i) With reference to a p-type semi-conductor, explain how doping increases the conductivity of the semi-conductor.
[2]
(ii) Suggest why the resistance of a highly doped semi-conductor will actually increase rather than decrease, when temperature increases.
[1] 7 A capillary tube is a tube that is open at both ends and has a very narrow bore. A capillary
tube is supported vertically with one end immersed in water. Water rises up the tube due to a phenomenon called capillary action. The water in the bore of the tube forms a column of height h as shown in Fig. 7.1.
Fig. 7.1
h
glass wall glass wall
narrow bore
water
The acceptor atoms introduce an energy level (called acceptor level) just above
the valence band.
As the energy gap is smaller now, more electrons are able to enter the acceptor
level leaving more holes in the valence band resulting in an increase in the
number of holes. This will increase the conductivity for p-type semiconductor.
A highly doped semiconductor will have relatively large number of charge carrier
and it can behave as metals.

13
NYJC 2015 9646/02/J2PRELIM/15 [Turn over
For Examiner’s
Use
(a) The height h for a particular capillary tube was measured for different temperatures of the water. The variation with temperature θ of the height h is as shown in Fig. 7.2.
Fig. 7.2
(i) Draw the best fit line for the data points on Fig. 7.2. [1] (ii) Explain why the results suggest that the relationship between h and θ is of the
form h = ho (1 – kθ), where ho and k are constants.
[2]
8
9
10
11
12
13
14
15
16
17
0 10 20 30 40 50 60 70 80 90 100θ /
oC
h / cm
The equation will yield h = ho – (ho k) θ, which is in the form of the equation of
straight line, y = mx + c.
Since the graph of h against θ is a straight line with a negative gradient,
with a non-zero y-intercept,
the results suggest that the relationship is of the given form.

14
NYJC 2015 9646/02/J2PRELIM/15
For Examiner’s
Use (iii) Use Fig. 7.2 to determine the constants ho and k, with appropriate units. ho = units: [2]
k = units: [3]
(b) The experiment is repeated using tubes with bores of different radii r but keeping the
water temperature constant. Fig 7.3 shows the variation with 1r
of the height h for
capillary tubes of different radii r for a water temperature of 20 oC.
1
r
Fig. 7.3
0.00
0.05
0.10
0.15
0.20
0.25
0.30
0.35
0 5 10 15 20 25
/ × 103 m-1
h / m
ho = y-intercept = 16.3 cm (± 0.2 cm) - ho k = gradient of the graph = 15.8−10.2
6−78
= – 0.078 (± 0.004) k = −0.078
−16.3
= 4.8 × 10⁻³ oC-1

15
NYJC 2015 9646/02/J2PRELIM/15 [Turn over
For Examiner’s
Use
It is suggested that capillary action is one of the means by which water moves from the roots of a tree to the leaves. (i) Using information from Fig. 7.3, estimate the radius of the bore of the tubes that
will enable water to be raised by capillary action from the ground to the top of a tree which has a height of 25 m. State one assumption that was made.
radius of bore = m [3] Assumption:
[1]
(ii) Comment on your answer to (i).
[1]
(c) Suggest two other factors, apart from temperature and bore radii, which will affect the height h of the column. 1.
2.
[2]
h1
h2=
r2
r1
250.220
=1
15.0 × 10³r1
r1 = 5.9 × 10⁻⁷ m
From the graph, hr = constant.
The direct proportion of h with 1r holds for values of h up to 25 m.
The value of r is very small that it is unlikely that capillary action is the only
mechanism that enables water to be raised from the ground to the top of the
tree.
liquid-air surface tension / viscosity of liquid / density of liquid /
acceleration due to gravity, g

16
NYJC 2015 9646/02/J2PRELIM/15
For Examiner’s
Use 8 A transformer is an electrical device that transfers electrical energy between two or more circuits through electromagnetic induction. A varying current in the transformer's primary winding creates a varying magnetic flux in the transformer core and a varying magnetic field impinging on the transformer's secondary winding. Commonly, transformers are used to increase or decrease the voltages of alternating current in electric power applications. A student suggests that if there is a break in the transformer core, the output voltage in the secondary coil will be different from the value when there is no break.
To study this effect, a model can be set up using a thin card inserted between two separate iron cores, as shown in Fig. 8.1.
Fig. 8.1
A coil is wound around one core. A current in the coil may induce an e.m.f. in another coil wound on the other core. The induced e.m.f. V depends on the thickness t of the card. The student suggests that
V = V0 e-αt
where V0 is the induced e.m.f. without card between the cores and α is a constant. Design a laboratory experiment to test the relationship between V and t, and determine the value of α. In your account you should pay particular attention to
(a) the procedure to be followed,
(b) the measurements to be taken,
(c) the control of variables,
(d) the analysis of the data,
(e) the safety precautions to be taken.
Thin card
iron cores
17
NYJC 2015 9646/02/J2PRELIM/15 [Turn over
For Examiner’s
Use
Diagram
Basic Procedure
Vary the thickness t of the thin card (stacking same thicknesses or changing for cards of different thicknesses)
B1
Measure V the output of the secondary coil from CRO/voltmeter B2
Diagram of workable procedure (All D marks not awarded if DC source is used) Diagram showing two independent labelled coils wound on iron cores D1
AC power supply connected to one coil D2
Voltmeter / oscilloscope connected in parallel to secondary coil D3
Measurement Measure thickness of card using micrometer / vernier calipers / digital calipers M1
Method to keep current constant – rheostat (or variable power supply) and ammeter correctly positioned in primary circuit, so that magnetic flux variation is constant.
M2
Analysis (ALL details are required for the mark) Plot a graph of ln V against t or ln V / V0 against t Relationship is valid if the graph is a straight line with y–intercept = ln V0 α = gradient
A1
Additional detail : max 3
Use large current (in primary coil)/large number of turns on the secondary to achieve measurable V (allow more turns on secondary than primary).
O1
Take preliminary readings to ensure that V is measureable. O2
If using CRO for measurement of V, describe how to read V from display O3
Keep frequency of power supply constant or keep the number of turns on each coil constant.
O4
Use laminated cores or use insulated wire for turns. O5
Repeat measurements of t at different positions of card and average. O6
Discuss compression of card / measure t when secured. O7
Use of dataloggers with appropriate sensors O8
Details describing obtaining Vo, must mention gap is closed O9
Other credible details O10
18
NYJC 2015 9646/02/J2PRELIM/15
For Examiner’s
Use Safety considerations
Precaution linked to hot coil(s) e.g. switch off when not in use / do not touch / wear gloves.
S1
Total: 12

NYJC 2015 9646/03/J2PRELIM/15
NANYANG JUNIOR COLLEGE JC 2 PRELIMINARY EXAMINATION Higher 2
CANDIDATE NAME
CLASS
TUTOR’S NAME
PHYSICS 9646/03 Paper 3 Longer Structured Questions 22 September 2015
2 hours Candidates answer on the Question Paper. No Additional Materials are required.
READ THESE INSTRUCTIONS FIRST
Write your name and class on all the work you hand in. Write in dark blue or black pen on both sides of the paper. You may use an HB pencil for any diagrams or graphs. Do not use staples, paper clips, glue or correction fluid. The use of an approved scientific calculator is expected where appropriate. Section A Answer all questions. Section B Answer any two questions. You are advised to spend about one hour on each section. At the end of the examination, fasten all your work securely together. The number of marks is given in brackets [ ] at the end of each question or part question.
For Examiner’s Use
Section A
1
2
3
4
5
6
Section B
7
8
9
Total
This document consists of 23 printed pages.
[Turn over
H

2
NYJC 2015 9646/03/J2PRELIM/15
Data
Formulae
uniformly accelerated motion, s = ut + ½at2
v2 = u2 + 2as
work done on/by a gas, W = pΔV
hydrostatic pressure, p = ρgh
gravitational potential, φ = /Gm r−
displacement of particle in s.h.m. x = xo sin ωt
velocity of particle in s.h.m. v = vo cos ωt
= ( )22 xxo −± ω
mean kinetic energy of a molecule of an ideal gas E = 3
2kT
resistors in series, R = R1 + R2 + …
resistors in parallel, 1/R = 1/R1 + 1/R2 + …
electric potential, V = Q / 4πεor
alternating current/voltage, x = xo sin ωt
transmission coefficient, T ∝ exp(–2kd)
where k = ( )2
2
8 m U Eh
π −
radioactive decay, x = xo exp (–λt)
decay constant. λ =
21
693.0t
speed of light in free space, c = 3.00 × 10⁸ m s–1
permeability of free space, μo = 4π × 10–7 H m–1
permittivity of free space, εo = 8.85 × 10⁻¹² F m–1
(1 / (36 π)) × 10–9 F m–1 elementary charge, e = 1.60 × 10⁻¹⁹ C
the Planck constant, h = 6.63 × 10⁻³⁴ J s
unified atomic mass constant, u = 1.66 × 10⁻²⁷ kg
rest mass of electron, me = 9.11 × 10⁻³¹ kg
rest mass of proton, mp = 1.67 × 10⁻²⁷ kg
molar gas constant, R = 8.31 J K–1 mol–1
the Avogadro constant, NA = 6.02 × 10²³ mol–1
the Boltzmann constant, k = 1.38 × 10⁻²³ J K–1
gravitational constant, G = 6.67 × 10⁻¹¹ N m2 kg–2
acceleration of free fall. g = 9.81 m s–2

3
NYJC 2015 9646/03/J2PRELIM/15 [Turn over
For Examiner’s
Use
Section A
Answer all the questions in the spaces provided. 1 Fig. 1.1 shows 2 identical magnets moving towards each other on a surface with the same
initial speed. Magnets A and B experience the same frictional force which is constant throughout the motion except when they are stationary. Assume friction is negligible when the magnets are stationary and there is negligible air resistance.
Fig. 1.1 Fig. 1.2 shows the variation of velocity with time of magnet A during the collision.
Fig. 1.2
magnet A magnet B
S N N S
velocity of magnet A / m s-1
time / 10-2 s

4
NYJC 2015 9646/03/J2PRELIM/15
For Examiner’s
Use (a) Define acceleration.
[1]
(b) On Fig. 1.2, identify a point where the 2 magnets are closest to each other. Label the point P. [1]
(c) Explain why the average gradient of the graph from 0 s to 6.0 × 10⁻² s is greater than
the average gradient of the graph from 6.0 × 10⁻² s to 15 × 10-2 s. [3]
(d) Using Fig. 1.2 and taking the mass of magnet A to be 0.10 kg, calculate the magnitude of the magnetic force at 6.0 × 10⁻² s. Explain your working.
magnetic force = N [2]
5
NYJC 2015 9646/03/J2PRELIM/15 [Turn over
For Examiner’s
Use
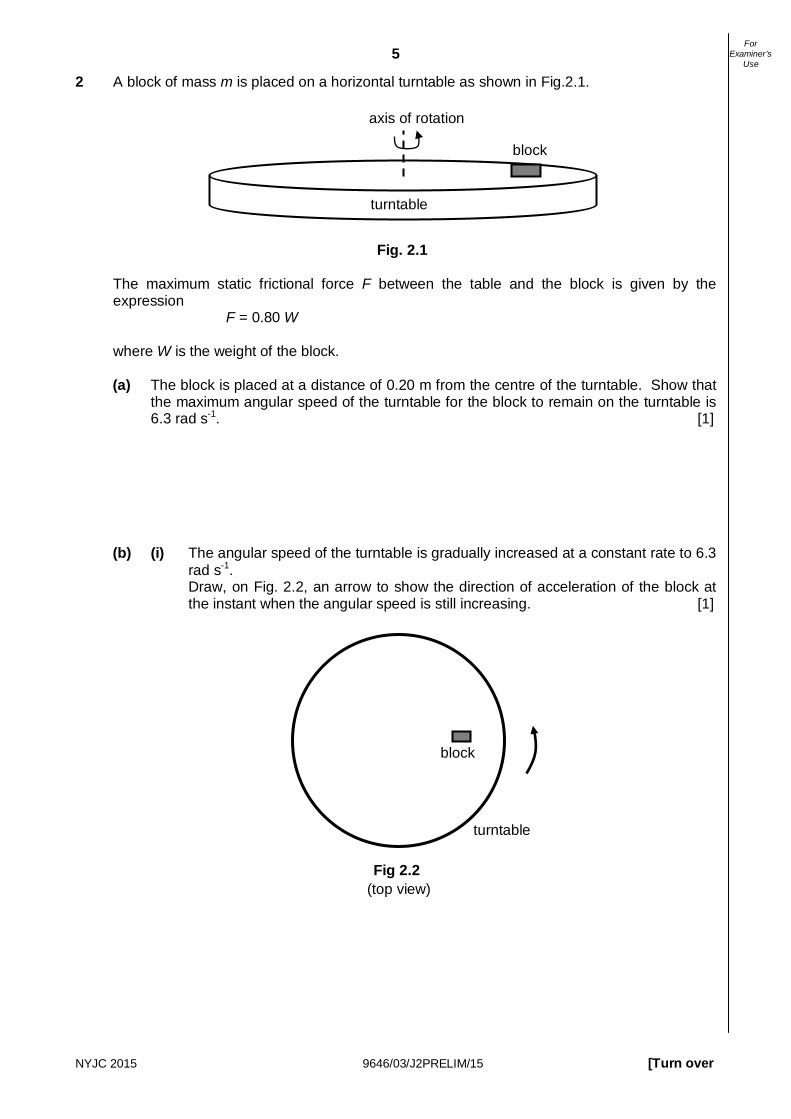
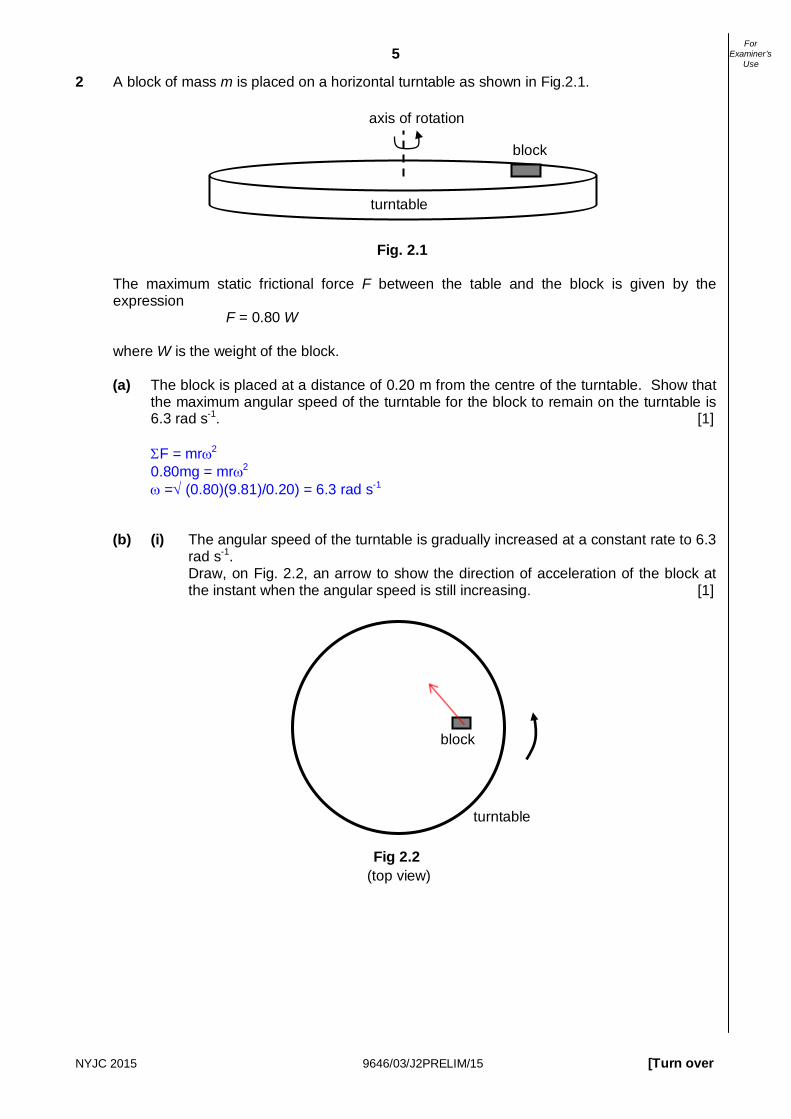
2 A block of mass m is placed on a horizontal turntable as shown in Fig.2.1. Fig. 2.1 The maximum static frictional force F between the table and the block is given by the
expression F = 0.80 W where W is the weight of the block.
(a) The block is placed at a distance of 0.20 m from the centre of the turntable. Show that the maximum angular speed of the turntable for the block to remain on the turntable is 6.3 rad s-1. [1]
(b) (i) The angular speed of the turntable is gradually increased at a constant rate to 6.3 rad s-1. Draw, on Fig. 2.2, an arrow to show the direction of acceleration of the block at the instant when the angular speed is still increasing. [1]
axis of rotation
turntable
block
(top view)
turntable
block
Fig 2.2
6
NYJC 2015 9646/03/J2PRELIM/15
For Examiner’s
Use (ii) Suggest why the block will start to slide before it reaches the angular speed 6.3 rad s-1.
[1]
(iii) Explain why the block will continue to slide while it is still on the turntable.
[1]
(c) The orientation of the block is then changed such that its centre of gravity is now higher. The angular speed is again increased gradually. Explain why the chance of the block toppling before it slides is now higher.
[1]
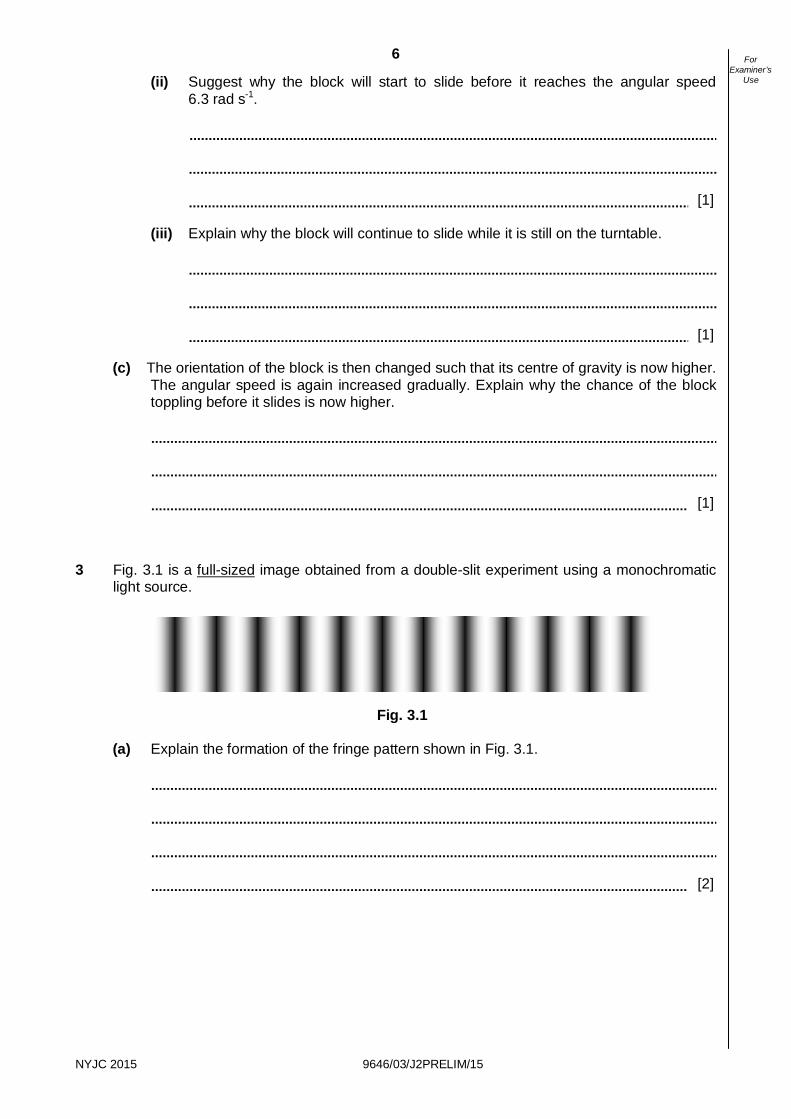
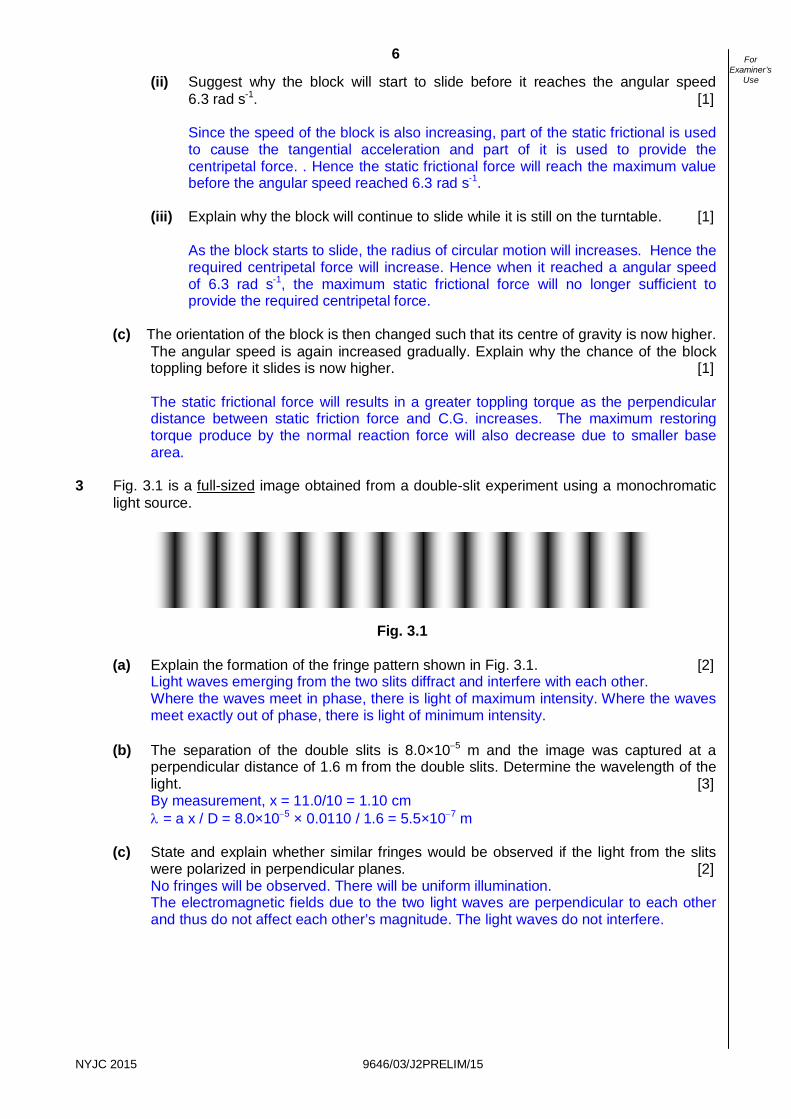
3 Fig. 3.1 is a full-sized image obtained from a double-slit experiment using a monochromatic
light source.
Fig. 3.1
(a) Explain the formation of the fringe pattern shown in Fig. 3.1.
[2]

7
NYJC 2015 9646/03/J2PRELIM/15 [Turn over
For Examiner’s
Use
(b) The separation of the double slits is 8.0×10⁻⁵ m and the image was captured at a perpendicular distance of 1.6 m from the double slits. Determine the wavelength of the light.
wavelength = m [3]
(c) State and explain whether similar fringes would be observed if the light from the slits were polarized in perpendicular planes.
[2]
4 (a) Define magnetic flux density.
[1]
(b) The specific charge e
em
of an electron may be measured using the apparatus shown in
Fig. 4.1. (me is the mass of the electron while e is the elementary charge.)
Fig. 4.1
V
Uniform magnetic field applied in the region from S1 to A

8
NYJC 2015 9646/03/J2PRELIM/15
For Examiner’s
Use Electrons are emitted from a cathode C and are accelerated by the potential difference V between the cathode and the slit S1.
(i) Show that the speed of the electron at S1 is 2
e
eVm
. [1]
After the electrons pass through the slit S1, they enter a uniform magnetic field of flux
density B as shown in Fig. 4.1. The electrons follow a circular path of radius R, passing through the slits S2 and S3, and are collected by the electrode A. The magnitude of the magnetic flux density is adjusted so that the current at the collector is the maximum.
(ii) State and explain the direction of the magnetic field.
[1]
(iii) Determine an expression for e
em
in terms of V, B and R.
e
em
= [3]

9
NYJC 2015 9646/03/J2PRELIM/15 [Turn over
For Examiner’s
Use
5 Fig. 5.1 shows the structure of a geophone which is used by geophysicists to determine the speed of seismic waves traveling within the ground layer.
Fig. 5.1 The spike of the geophone is inserted into the ground. When a seismic vibration moves the
case and coil, the magnet remains stationary due to its inertia.
(a) State Faraday’s law of electromagnetic induction. [1]
(b) Using Faraday’s law, explain how an e.m.f. is generated between the terminals when seismic waves pass through the ground.
[2]
magnet
terminal
spike in ground
spring
fixed coil connected
to case

10
NYJC 2015 9646/03/J2PRELIM/15
For Examiner’s
Use (c) A coil of 50 turns generates a maximum e.m.f. of 85 mV in a geophone. Calculate the rate of change of flux needed to generate this e.m.f. Provide an appropriate unit for your answer.
rate of change of flux = unit: [3]
(d) State 2 changes to the geophone which will make it more sensitive.
[2]
6 (a) State a word equation to express the principle of energy conservation as applied to the
First Law of Thermodynamics.
[1]

11
NYJC 2015 9646/03/J2PRELIM/15 [Turn over
For Examiner’s
Use
(b) A fixed mass of ideal gas undergoes a cycle of changes A → B → C → D → A as shown in Fig. 6.1.
Fig. 6.1
(i) Use Fig. 6.1 to determine the work done on the gas during the change D → A.
work done = J [2]
(ii) Explain why the total change in the internal energy of the gas during a complete cycle must be zero.
[2]
A
B C
D

12
NYJC 2015 9646/03/J2PRELIM/15
For Examiner’s
Use (iii) A student states that the gas can undergo a change from A → C directly with no net heat transfer. Explain why his statement is not valid. [2]

13
NYJC 2015 9646/03/J2PRELIM/15 [Turn over
For Examiner’s
Use
Section B
Answer two questions from this Section in the spaces provided.
7 (a) Define electric potential at a point.
[2]
(b) A positively charged sphere A, isolated in space, has radius R. The charge of the
sphere may be considered to be a point charge at the centre of the sphere. The electric potential at the surface of the sphere is Фs.
(i) On Fig. 7.1, sketch a graph to show the variation of the electric potential of the
sphere with distance from its centre. You should consider distances in the range R to 4R. [2]
Fig. 7.1
(ii) Charged sphere A has a charge 8.3 × 10⁻⁹ C and diameter 18 cm. Calculate the electric potential at 3R.
electric potential = V [2]
R 2R 3R 4R 0
0.2 Фs
0.4 Фs
0.6 Фs
0.8 Фs
1.0 Фs

14
NYJC 2015 9646/03/J2PRELIM/15
For Examiner’s
Use (iii) Another charged sphere B, of charge 1.8 × 10⁻⁹ C and diameter 12 cm, is brought near to charged sphere A, as shown in Fig. 7.2.
Fig. 7.2 The centres of the spheres are separated by a distance of 50 cm. Show that the electric potential at a distance 3R from sphere A is 350 V. [2]
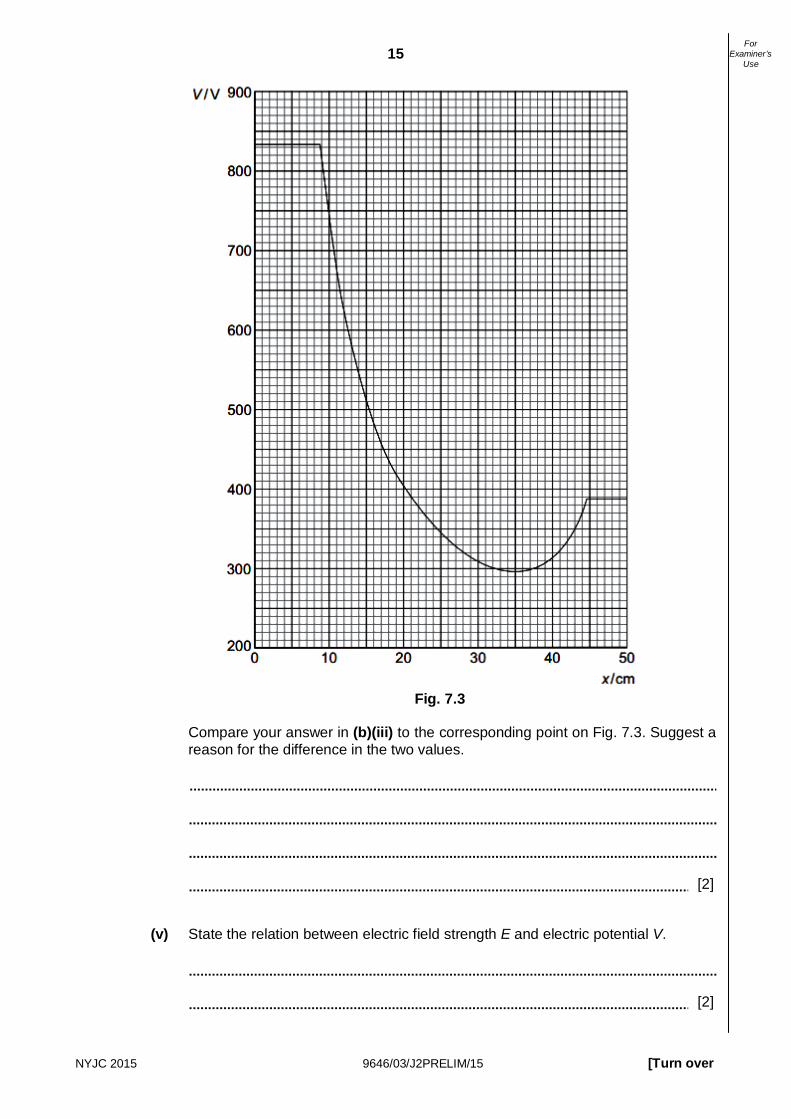
(iv) With reference to Fig. 7.2, Point P is at a distance x from the centre of sphere A along the line joining the centres of the two spheres.
The variation with x of the electric potential V at P is shown in Fig. 7.3.
18 cm
sphere A sphere B
12 cm
50 cm
x
P
15
NYJC 2015 9646/03/J2PRELIM/15 [Turn over
For Examiner’s
Use
Fig. 7.3
Compare your answer in (b)(iii) to the corresponding point on Fig. 7.3. Suggest a reason for the difference in the two values.
[2]
(v) State the relation between electric field strength E and electric potential V.
[2]
16
NYJC 2015 9646/03/J2PRELIM/15
For Examiner’s
Use (vi) With reference to Fig. 7.3, state the value of x where E = 0. x = cm [1]
(vii) With reference to Fig. 7.3, state qualitatively, and explain the variation with
distance of the force on a proton placed at point P, as x varies from x = 10 cm to x = 41 cm.
[5]
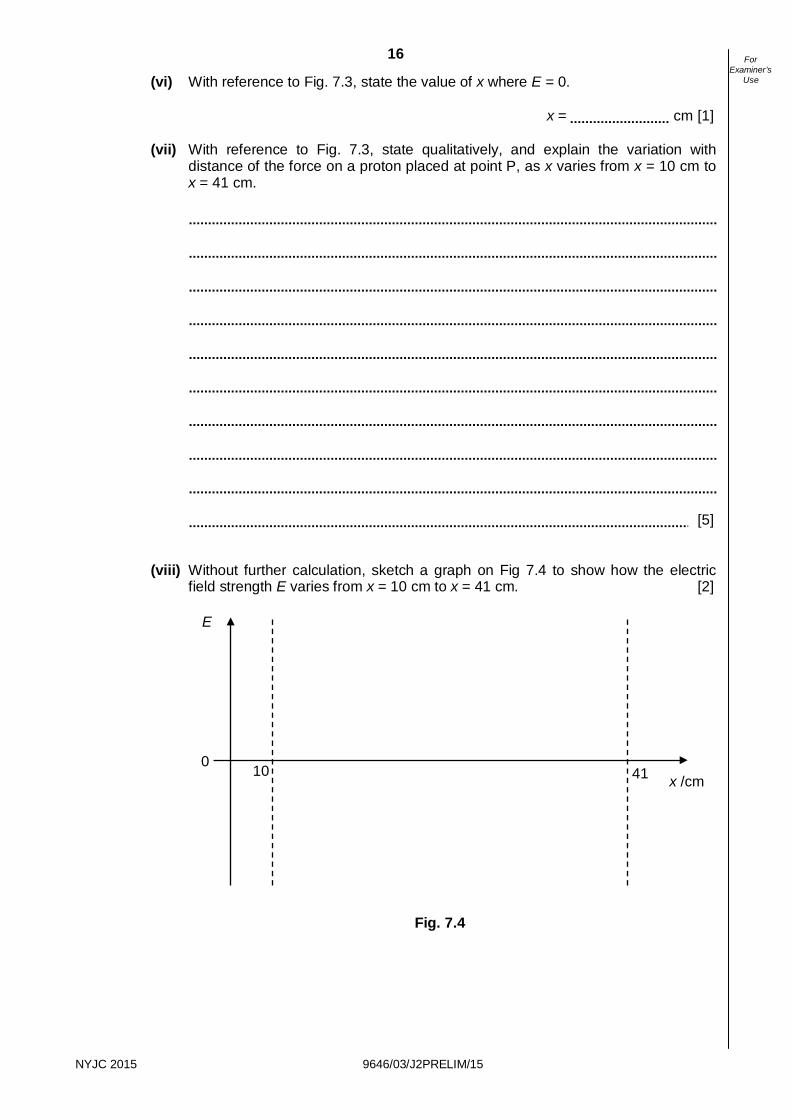
(viii) Without further calculation, sketch a graph on Fig 7.4 to show how the electric field strength E varies from x = 10 cm to x = 41 cm. [2]
Fig. 7.4
x /cm
E
0 10 41
17
NYJC 2015 9646/03/J2PRELIM/15 [Turn over
For Examiner’s
Use
8 (a) (i) State what is meant by the photoelectric effect.
[1]
(ii) Explain what a photon is.
[1]
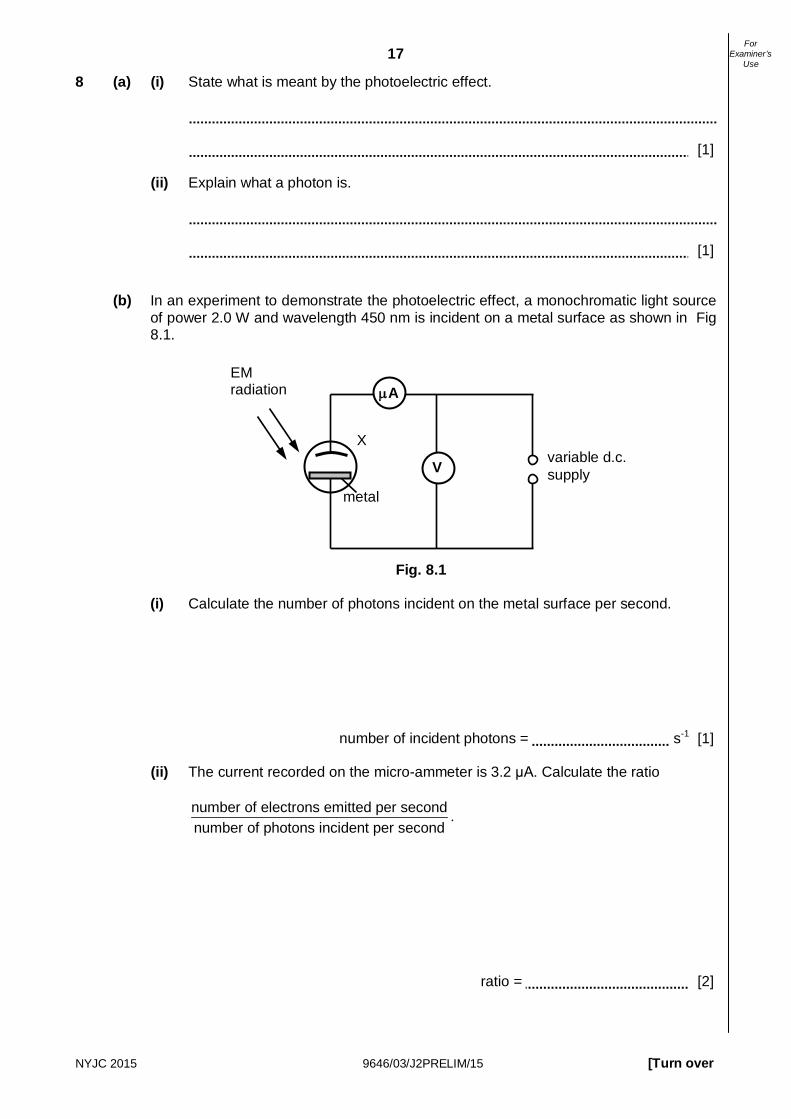
(b) In an experiment to demonstrate the photoelectric effect, a monochromatic light source
of power 2.0 W and wavelength 450 nm is incident on a metal surface as shown in Fig 8.1.
Fig. 8.1
(i) Calculate the number of photons incident on the metal surface per second.
number of incident photons = s-1 [1]
(ii) The current recorded on the micro-ammeter is 3.2 μA. Calculate the ratio
number of electrons emitted per secondnumber of photons incident per second
.
ratio = [2]
variable d.c. supply
µA
X
V
metal
EM radiation

18
NYJC 2015 9646/03/J2PRELIM/15
For Examiner’s
Use (iii) By making reference to the work function energy of metal, suggest why, for frequencies of light slightly above the threshold frequency, the number of electrons emitted from the metal may be smaller than expected.
[2]
(c) In another photoelectric experiment, the metal plate is illuminated by two lamps A and
B. The wavelengths of light emitted by the two lamps are 400 nm and 600 nm respectively, as shown in Fig. 8.2.
Fig. 8.2
(i) It is given that the current recorded when both lamps are switched on is 5.0 µA.
Assume the frequency of light from both lamps is above the threshold frequency. Use your answer in (b)(ii) to show that the total number of photons incident on the metal surface in one second is 7.0 x 10¹⁸. [1]
(ii) State an assumption made in the above calculation.
[1]
(iii) When the intensity of lamp A is doubled, the current reading increases to 7.2 µA. Calculate the total power dissipated by the two lamps before the intensity of lamp A is doubled.
total power dissipated = W [3]
lamp wavelength / nm A 400 B 600

19
NYJC 2015 9646/03/J2PRELIM/15 [Turn over
For Examiner’s
Use
(d) Fig 8.3 shows an experimental set-up to produce the emission line spectrum of a hydrogen gas.
Fig. 8.3
(i) Explain how the line spectrum of hydrogen provides evidence for the existence of discrete electron energy levels in atoms.
[2]
Some of the lines of the emission spectrum of atomic hydrogen are shown in Fig 8.4, which is drawn to scale. Fig. 8.4 (drawn to scale) (ii) Calculate the energy of the photon emitted for emission line labelled X.
energy of photon = J [2]
(iii) Suggest why the actual spacing of the lines in the emission spectrum is not proportional to the difference in the wavelengths of the photons emitted.
[1]
discharge lamp
diffraction grating
screen
X 410nm 434nm 486nm
20
NYJC 2015 9646/03/J2PRELIM/15
For Examiner’s
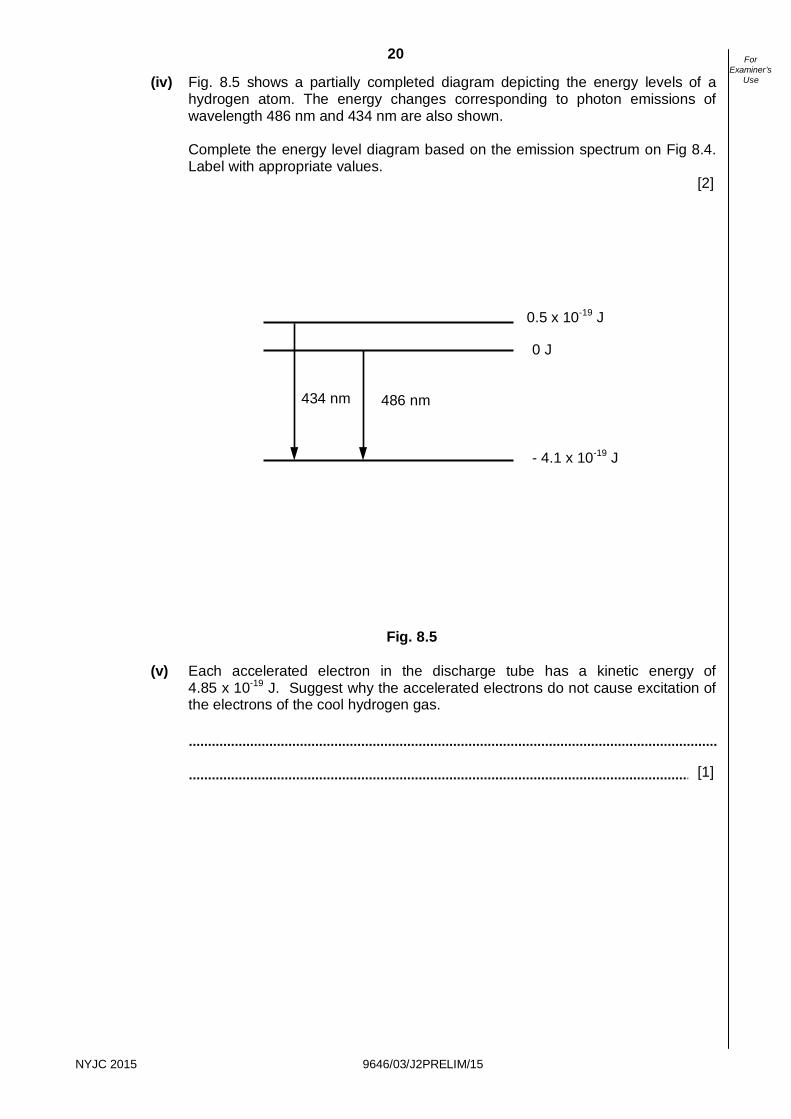
Use (iv) Fig. 8.5 shows a partially completed diagram depicting the energy levels of a hydrogen atom. The energy changes corresponding to photon emissions of wavelength 486 nm and 434 nm are also shown. Complete the energy level diagram based on the emission spectrum on Fig 8.4. Label with appropriate values. [2]
Fig. 8.5
(v) Each accelerated electron in the discharge tube has a kinetic energy of 4.85 x 10⁻¹⁹ J. Suggest why the accelerated electrons do not cause excitation of the electrons of the cool hydrogen gas.
[1]
- 4.1 x 10⁻¹⁹ J
0 J
486 nm
0.5 x 10⁻¹⁹ J
434 nm

21
NYJC 2015 9646/03/J2PRELIM/15 [Turn over
For Examiner’s
Use
9 (a) (i) Draw a labelled diagram, showing the key features of the experiment performed by Rutherford, Geiger and Marsden to investigate the scattering of alpha particles. [2]
(ii) On Fig. 9.1, sketch a graph showing the distribution of the scattered particles in
different directions. [2] Fig. 9.1 (b) (i) State and explain how the mass of a 4
2He nucleus is different from the total mass of its protons and neutrons when separated.
[2]
(ii) Explain why nuclei in a star have to be at high temperature for fusion to take
place.
[2]
Number of alpha particles detected
-180˚ -90˚ +90˚ +180˚ Angle of deflection

22
NYJC 2015 9646/03/J2PRELIM/15
For Examiner’s
Use (c) (i) The isotope of uranium, 23892U, decays into a stable isotope of lead, 206
82Pb , by a series of α and β-decays. There are a total of 8 α-decays and n β-decays.
Calculate the value of n. n = [2]
(ii) Fig. 9.2 shows the binding energy per nucleon for some stable nuclides. Fig. 9.2 Use Fig 9.2 to estimate the binding energy, in MeV, of the 206
82Pb nucleus. binding energy = MeV [2]
(iii) The half life of 238
92Uis 4.5 × 10⁹ years. At any given time most of the atoms are either 238
92Uor 20682Pb , as the half lives of all the other products are negligible.
When a rock sample is formed, it originally contained 3.0 × 10²² atoms of 238
92Uand no 206
82Pb atoms. Sketch, on Fig. 9.3, graphs to show how the number of 238
92U atoms and the number of 206
82Pb atoms in the rock sample vary over a period of 1.0 × 10¹⁰ years from its formation. Label your graphs U and Pb. [4]
binding energy per nucleon / MeV
nucleon number

23
NYJC 2015 9646/03/J2PRELIM/15 [Turn over
For Examiner’s
Use
Fig. 9.3
(iv) At a certain time t after its formation, the sample contained twice as many 238
92U atoms as 20682Pb atoms. Show that the number of 238
92U atoms in the rock sample at time t was 2.0 × 10²². [1]
(v) Calculate t in years.
t = years [3]
Time / × 1010 years
Number of atoms / × 1022
1.0
2.0
3.0
0 0.2 0.4 0.6 0.8 1.0

NYJC 2015 9646/03/J2PRELIM/15
NANYANG JUNIOR COLLEGE JC 2 PRELIMINARY EXAMINATION Higher 2
CANDIDATE NAME
CLASS
TUTOR’S NAME
PHYSICS 9646/03 Paper 3 Longer Structured Questions 22 September 2015
2 hours Candidates answer on the Question Paper. No Additional Materials are required.
READ THESE INSTRUCTIONS FIRST
Write your name and class on all the work you hand in. Write in dark blue or black pen on both sides of the paper. You may use an HB pencil for any diagrams or graphs. Do not use staples, paper clips, glue or correction fluid. The use of an approved scientific calculator is expected where appropriate. Section A Answer all questions. Section B Answer any two questions. You are advised to spend about one hour on each section. At the end of the examination, fasten all your work securely together. The number of marks is given in brackets [ ] at the end of each question or part question.
For Examiner’s Use
Section A
1
2
3
4
5
6
Section B
7
8
9
Total
This document consists of 20 printed pages.
[Turn over
H SOLUTION

2
NYJC 2015 9646/03/J2PRELIM/15
Data
Formulae
uniformly accelerated motion, s = ut + ½at2
v2 = u2 + 2as
work done on/by a gas, W = pΔV
hydrostatic pressure, p = ρgh
gravitational potential, φ = /Gm r−
displacement of particle in s.h.m. x = xo sin ωt
velocity of particle in s.h.m. v = vo cos ωt
= ( )22 xxo −± ω
mean kinetic energy of a molecule of an ideal gas E = 3
2kT
resistors in series, R = R1 + R2 + …
resistors in parallel, 1/R = 1/R1 + 1/R2 + …
electric potential, V = Q / 4πεor
alternating current/voltage, x = xo sin ωt
transmission coefficient, T ∝ exp(–2kd)
where k = ( )2
2
8 m U Eh
π −
radioactive decay, x = xo exp (–λt)
decay constant. λ =
21
693.0t
speed of light in free space, c = 3.00 × 10⁸ m s–1
permeability of free space, μo = 4π × 10–7 H m–1
permittivity of free space, εo = 8.85 × 10⁻¹² F m–1
(1 / (36 π)) × 10–9 F m–1 elementary charge, e = 1.60 × 10⁻¹⁹ C
the Planck constant, h = 6.63 × 10⁻³⁴ J s
unified atomic mass constant, u = 1.66 × 10⁻²⁷ kg
rest mass of electron, me = 9.11 × 10⁻³¹ kg
rest mass of proton, mp = 1.67 × 10⁻²⁷ kg
molar gas constant, R = 8.31 J K–1 mol–1
the Avogadro constant, NA = 6.02 × 10²³ mol–1
the Boltzmann constant, k = 1.38 × 10⁻²³ J K–1
gravitational constant, G = 6.67 × 10⁻¹¹ N m2 kg–2
acceleration of free fall. g = 9.81 m s–2

3
NYJC 2015 9646/03/J2PRELIM/15 [Turn over
For Examiner’s
Use
Section A
Answer all the questions in the spaces provided. 1 Fig. 1.1 shows 2 identical magnets moving towards each other on a surface with the same
initial speed. Magnets A and B experience the same frictional force which is constant throughout the motion except when they are stationary. Assume friction is negligible when the magnets are stationary and there is negligible air resistance.
Fig. 1.1 Fig. 1.2 shows the variation of velocity with time of magnet A during the collision.
Fig. 1.2
magnet A magnet B
S N N S
velocity of magnet A / m s-1
time / 10-2 s
P

4
NYJC 2015 9646/03/J2PRELIM/15
For Examiner’s
Use (a) Define acceleration. [1] It is the rate of change of velocity with respect to time.
(b) On Fig. 1.2, identify a point where the 2 magnets are closest to each other. Label the point P. [1]
Since both magnets have the same mass, same initial speed and experience the same amount of force throughout the collision, both of them will stop and change their direction of motion at the same time. This will mean they are closest to each other when they have zero velocity i.e. at time 6.0 × 10⁻² s.
(c) Explain why the average gradient of the graph from 0 s to 6.0 × 10⁻² s is greater than
the average gradient of the graph from 6.0 × 10⁻² s to 15 × 10-2 s. [3] From 0 s to 6 × 10⁻² s, the resultant force is larger since the magnetic force and friction are in the same direction while the resultant force is smaller since they are in opposite directions from 6 × 10⁻² s to 15 × 10-2 s. Therefore, by Newton’s 2nd Law, the average acceleration from 0 s to 6 × 10⁻² s is always larger than the average acceleration from 6 × 10⁻² s to 15 × 10-2 s. Since the acceleration is given by the gradient of the graph, the average gradient of the graph from 0 s to 6 × 10⁻² s is greater than the average gradient of the graph from 6 × 10⁻² s to 15 × 10-2 s.
(d) Using Fig. 1.2 and and taking the mass of magnet A to be 0.10 kg, calculate the
magnitude of the magnetic force at 6.0 × 10⁻² s. Explain your working. [2] The acceleration at 6.0 × 10⁻² s is given by the gradient of the graph 6.0 × 10⁻² s.
Gradient 2 2
2 2
10.0 ( 10.0)10.0 10 2.0 102.5 10 m s
− −
−
− −=
× − ×= ×
The frictional force will be 0 N since the magnet is stationary.
20 0.10 2.5 1025 N
B
B
F ma
FF
=
− = × ×
=
∑
5
NYJC 2015 9646/03/J2PRELIM/15 [Turn over
For Examiner’s
Use
2 A block of mass m is placed on a horizontal turntable as shown in Fig.2.1. Fig. 2.1 The maximum static frictional force F between the table and the block is given by the
expression F = 0.80 W where W is the weight of the block.
(a) The block is placed at a distance of 0.20 m from the centre of the turntable. Show that the maximum angular speed of the turntable for the block to remain on the turntable is 6.3 rad s-1. [1]
ΣF = mrω2
0.80mg = mrω2 ω =√ (0.80)(9.81)/0.20) = 6.3 rad s-1
(b) (i) The angular speed of the turntable is gradually increased at a constant rate to 6.3 rad s-1. Draw, on Fig. 2.2, an arrow to show the direction of acceleration of the block at the instant when the angular speed is still increasing. [1]
axis of rotation
turntable
block
(top view)
turntable
block
Fig 2.2
6
NYJC 2015 9646/03/J2PRELIM/15
For Examiner’s
Use (ii) Suggest why the block will start to slide before it reaches the angular speed 6.3 rad s-1. [1]
Since the speed of the block is also increasing, part of the static frictional is used
to cause the tangential acceleration and part of it is used to provide the centripetal force. . Hence the static frictional force will reach the maximum value before the angular speed reached 6.3 rad s-1.
(iii) Explain why the block will continue to slide while it is still on the turntable. [1]
As the block starts to slide, the radius of circular motion will increases. Hence the required centripetal force will increase. Hence when it reached a angular speed of 6.3 rad s-1, the maximum static frictional force will no longer sufficient to provide the required centripetal force.
(c) The orientation of the block is then changed such that its centre of gravity is now higher.
The angular speed is again increased gradually. Explain why the chance of the block toppling before it slides is now higher. [1]
The static frictional force will results in a greater toppling torque as the perpendicular
distance between static friction force and C.G. increases. The maximum restoring torque produce by the normal reaction force will also decrease due to smaller base area.
3 Fig. 3.1 is a full-sized image obtained from a double-slit experiment using a monochromatic
light source.
Fig. 3.1
(a) Explain the formation of the fringe pattern shown in Fig. 3.1. [2] Light waves emerging from the two slits diffract and interfere with each other.
Where the waves meet in phase, there is light of maximum intensity. Where the waves meet exactly out of phase, there is light of minimum intensity.
(b) The separation of the double slits is 8.0×10⁻⁵ m and the image was captured at a
perpendicular distance of 1.6 m from the double slits. Determine the wavelength of the light. [3]
By measurement, x = 11.0/10 = 1.10 cm λ = a x / D = 8.0×10−5 × 0.0110 / 1.6 = 5.5×10⁻⁷ m
(c) State and explain whether similar fringes would be observed if the light from the slits were polarized in perpendicular planes. [2] No fringes will be observed. There will be uniform illumination. The electromagnetic fields due to the two light waves are perpendicular to each other and thus do not affect each other’s magnitude. The light waves do not interfere.

7
NYJC 2015 9646/03/J2PRELIM/15 [Turn over
For Examiner’s
Use
4 (a) Define magnetic flux density. [1] Magnetic flux density is defined as the force per unit length exerted on a straight
conductor carrying a unit current in a direction perpendicular to the magnetic field.
(b) The specific charge e
em
of an electron may be measured using the apparatus shown in
Fig. 4.1. (me is the mass of the electron while e is the elementary charge.)
Fig. 4.1 Electrons are emitted from a cathode C and are accelerated by the potential difference
V between the cathode and the slit S1.
(i) Show that the speed of the electron at S1 is 2
e
eVm
. [1]
Gain in KE = Loss in EPE 21
22
e
e
m u eV
eVum
=
=
After the electrons pass through the slit S1, they enter a uniform magnetic field of flux
density B as shown in Fig. 4.1. The electrons follow a circular path of radius R, passing through the slits S2 and S3, and are collected by the electrode A. The magnitude of the magnetic flux density is adjusted so that the current at the collector is the maximum.
(ii) State and explain the direction of the magnetic field. [1]
The magnetic field acts into the page, so as to produce a force on the electron that always acts towards O (using Fleming’s Left Hand Rule).
V
Uniform magnetic field applied in the region from S1 to A
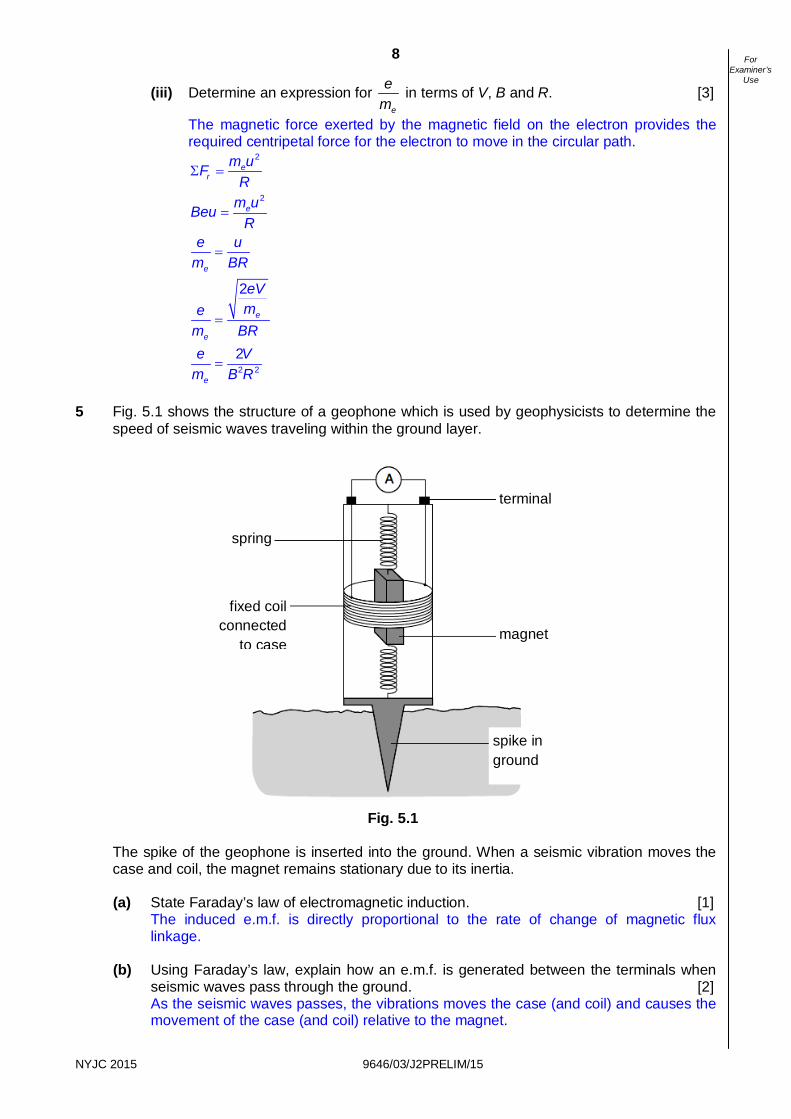
8
NYJC 2015 9646/03/J2PRELIM/15
For Examiner’s
Use
(iii) Determine an expression for e
em
in terms of V, B and R. [3]
The magnetic force exerted by the magnetic field on the electron provides the required centripetal force for the electron to move in the circular path.
2
2
2 2
2
2
er
e
e
e
e
e
m uFR
m uBeuR
e um BR
eVme
m BRe V
m B R
Σ =
=
=
=
=
5 Fig. 5.1 shows the structure of a geophone which is used by geophysicists to determine the
speed of seismic waves traveling within the ground layer.
Fig. 5.1 The spike of the geophone is inserted into the ground. When a seismic vibration moves the
case and coil, the magnet remains stationary due to its inertia.
(a) State Faraday’s law of electromagnetic induction. [1] The induced e.m.f. is directly proportional to the rate of change of magnetic flux linkage.
(b) Using Faraday’s law, explain how an e.m.f. is generated between the terminals when
seismic waves pass through the ground. [2] As the seismic waves passes, the vibrations moves the case (and coil) and causes the movement of the case (and coil) relative to the magnet.
magnet
terminal
spike in ground
spring
fixed coil connected
to case

9
NYJC 2015 9646/03/J2PRELIM/15 [Turn over
For Examiner’s
Use
This results in a change of magnetic flux linkage through the coil, and by Faraday’s law, an e.m.f. will be induced across the coil.
(c) A coil of 50 turns generates a maximum e.m.f. of 85 mV in a geophone. Calculate the
rate of change of flux needed to generate this e.m.f. Provide an appropriate unit for your answer. [3]
(d) State 2 changes to the geophone which will make it more sensitive. [2]
magnet with stronger magnetic field / coil with many turns / spring with a lower spring constant.
6 (a) State a word equation to express the principle of energy conservation as applied to the First Law of Thermodynamics. [1]
Increase in internal energy = Heat supplied to the system + Work done on the system (b) A fixed mass of ideal gas undergoes a cycle of changes A → B → C → D → A as
shown in Fig. 6.1.
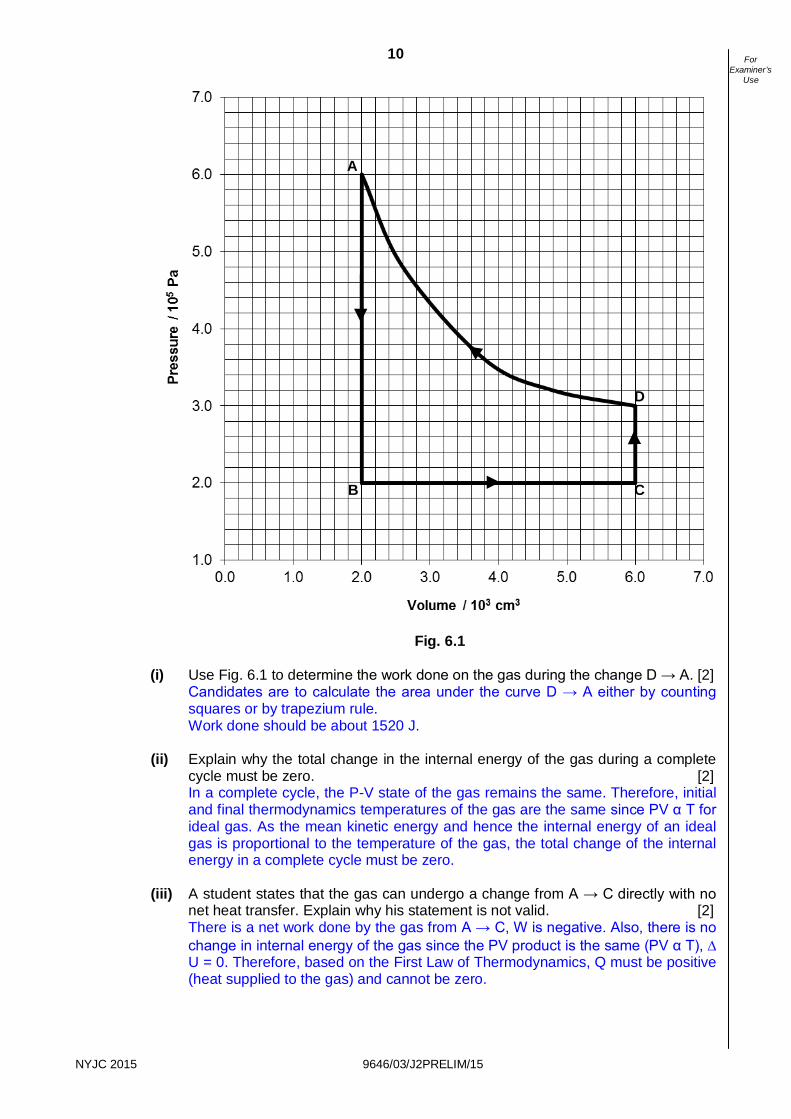
10
NYJC 2015 9646/03/J2PRELIM/15
For Examiner’s
Use
Fig. 6.1
(i) Use Fig. 6.1 to determine the work done on the gas during the change D → A. [2] Candidates are to calculate the area under the curve D → A either by counting squares or by trapezium rule. Work done should be about 1520 J.
(ii) Explain why the total change in the internal energy of the gas during a complete cycle must be zero. [2] In a complete cycle, the P-V state of the gas remains the same. Therefore, initial and final thermodynamics temperatures of the gas are the same since PV α T for ideal gas. As the mean kinetic energy and hence the internal energy of an ideal gas is proportional to the temperature of the gas, the total change of the internal energy in a complete cycle must be zero.
(iii) A student states that the gas can undergo a change from A → C directly with no
net heat transfer. Explain why his statement is not valid. [2] There is a net work done by the gas from A → C, W is negative. Also, there is no change in internal energy of the gas since the PV product is the same (PV α T), ∆ U = 0. Therefore, based on the First Law of Thermodynamics, Q must be positive (heat supplied to the gas) and cannot be zero.
A
B C
D

11
NYJC 2015 9646/03/J2PRELIM/15 [Turn over
For Examiner’s
Use
Section B
Answer two questions from this Section in the spaces provided.
7 (a) Define electric potential at a point. [2] Electric potential at a point is the work done per unit positive charge to move a test charge from infinity to the point in the electric field by an external agent (without a change in kinetic energy).
(b) A positively charged sphere A, isolated in space, has radius R. The charge of the
sphere may be considered to be a point charge at the centre of the sphere. The electric potential at the surface of the sphere is Фs.
(i) On Fig. 7.1, sketch a graph to show the variation of the electric potential of the
sphere with distance from its centre. You should consider distances in the range R to 4R. [2]
Fig. 7.1
(ii) Charged sphere A has a charge 8.3 × 10⁻⁹ C and diameter 18 cm. Calculate the electric potential at 3R. [2] Ф3R = 1/4πε0 (8.3 × 10⁻⁹ / 0.27) = 2.8 × 10² V
R 2R 3R 4R 0
0.2 Фs
0.4 Фs
0.6 Фs
0.8 Фs
1.0 Фs
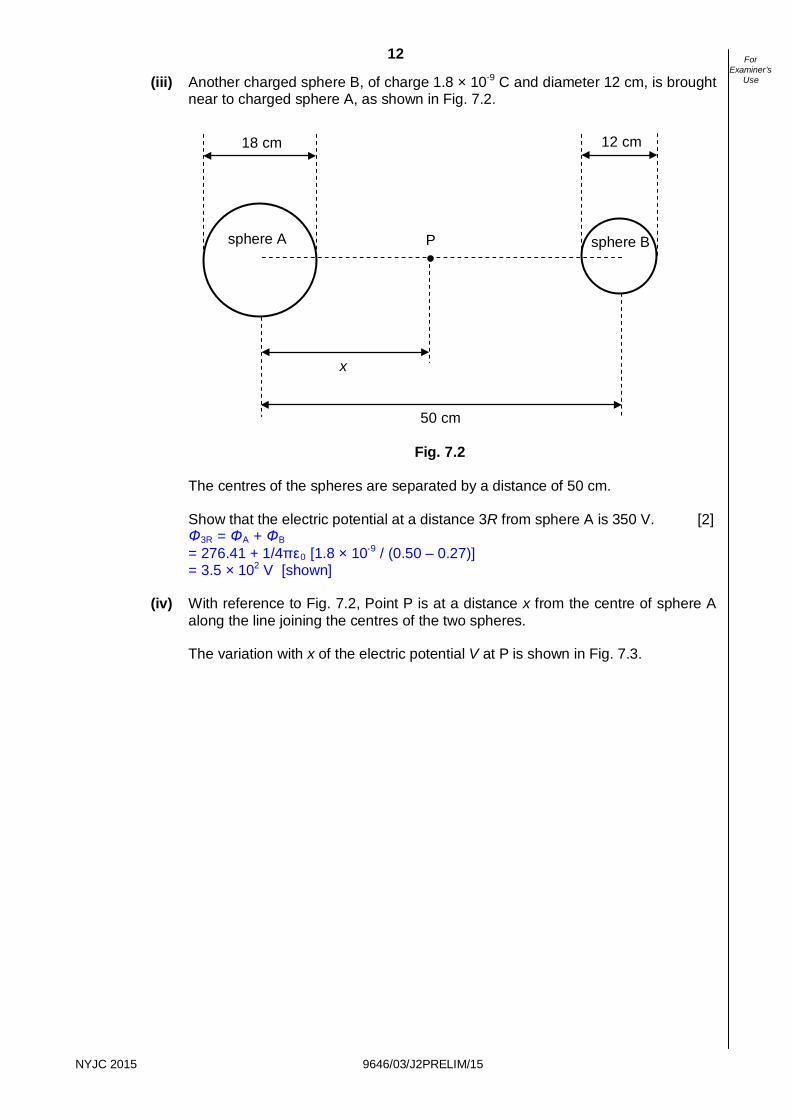
12
NYJC 2015 9646/03/J2PRELIM/15
For Examiner’s
Use (iii) Another charged sphere B, of charge 1.8 × 10⁻⁹ C and diameter 12 cm, is brought near to charged sphere A, as shown in Fig. 7.2.
Fig. 7.2 The centres of the spheres are separated by a distance of 50 cm. Show that the electric potential at a distance 3R from sphere A is 350 V. [2] Ф3R = ФA + ФB = 276.41 + 1/4πε0 [1.8 × 10⁻⁹ / (0.50 – 0.27)] = 3.5 × 10² V [shown]
(iv) With reference to Fig. 7.2, Point P is at a distance x from the centre of sphere A along the line joining the centres of the two spheres.
The variation with x of the electric potential V at P is shown in Fig. 7.3.
18 cm
sphere A sphere B
12 cm
50 cm
x
P

13
NYJC 2015 9646/03/J2PRELIM/15 [Turn over
For Examiner’s
Use
Fig. 7.3
Compare your answer in (b)(iii) to the corresponding point on Fig. 7.3. Suggest a reason for the difference in the two values. [2] At a distance of 3R from sphere A (x = 27 cm), the electric potential from the graph is 330 V which is smaller than 350 V from (b)(iii). This could be due to the fact that the centre of charge of the two sphere are further apart than their geometric centre-to-centre distance (due to the repulsion of like charges in the two spheres).
(v) State the relation between electric field strength E and electric potential V. [2]
The electric field strength E is the negative electric potential gradient. (E = - dV/dr). The field strength E acts in the direction of decreasing potential.
(vi) With reference to Fig. 7.3, state the value of x where E = 0. [1]
x = 35.0 cm

14
NYJC 2015 9646/03/J2PRELIM/15
For Examiner’s
Use (vii) With reference to Fig. 7.3, state qualitatively, and explain the variation with distance of the force on a proton placed at point P, as x varies from x = 10 cm to x = 41 cm. [5] At x = 10 cm, the gradient of the tangent is steep and negative, signifying a field strength towards the right with high magnitude. Since force acting on a proton is proportional to the field strength, the proton will experience a force with a large magnitude towards the right (towards sphere B).
Between x = 10 cm to x = 41 cm the force at x = 10 cm is the maximum due to its steepest gradient.
From x = 10 cm to x = 35 cm, the gradient of the graph becomes less and less negative. The magnitude of the force will decrease with distance. The direction will remain towards the right.
At x = 35 cm, the gradient is zero. The proton will experience no resultant electric force.
From x = 35 cm to x = 41 cm, the gradient of the graph becomes more and more positive. The proton will experience a resultant force towards the left (towards sphere A). The magnitude of the force will increase from x = 35 cm to x = 41 cm.
(viii) Without further calculation, sketch a graph on Fig 7.4 to show how the electric field strength E varies from x = 10 cm to x = 41 cm. [2]
Fig. 7.4
x /cm
E
0 10 41

15
NYJC 2015 9646/03/J2PRELIM/15 [Turn over
For Examiner’s
Use
8 (a) (i) State what is meant by the photoelectric effect. [1]
Photoelectric effect is the phenomenon of emission of electrons from a metal when EM radiation of sufficiently high frequency is radiated on it.
(ii) Explain what a photon is. [1] A photon is a quantum of energy of electromagnetic radiation. (b) In an experiment on the photoelectric effect, a monochromatic light source of power
2.0 W and wavelength 450 nm is incident on a metal surface as shown in Fig 8.1. Fig. 8.1
(i) Calculate the number of photons incident on the metal surface per second. [1] Np/t = power/hf = (2.0)(450 x 10-9)/(6.63 x 10-34)(3.0 x 10⁸) = 4.5 x 10¹⁸
(ii) The current recorded on the micro-ammeter is 3.2 μA. Calculate the ratio
number of electrons emitted per secondnumber of photons incident per second
. [2]
Ne/t = current / e = (3.2 x 10⁻⁶)/(1.6 x 10-19) = 2.0 x 10¹³ Ratio = 4.4 x 10⁻⁶
(iii) By making reference to the work function energy of metal, suggest why, for frequencies of light slightly above the threshold frequency, the number of electrons emitted from the metal may be smaller than expected. [2]
Since work function energy is the minimum energy for electron to be emitted from the metal surface, more energy is required to bring other electrons to the surface before they escape. Hence when frequency is slightly above threshold value, the photon will only have sufficient energy to allow those electrons at the metal surface to escape but not enough to allow other electrons below the surface to escape. Hence the number of emitted electrons will be smaller compared to those metal illuminated by light of frequency well above the threshold value.
variable d.c. supply
µA
X
V
metal
EM radiation

16
NYJC 2015 9646/03/J2PRELIM/15
For Examiner’s
Use (c) In another photoelectric experiment, the metal plate is illuminated by two lamps A and
B. The wavelengths of light emitted by the two lamps are 400 nm and 600 nm respectively, as shown in Fig. 8.2.
Fig. 8.2
(i) It is given that the current recorded when both lamps are switched on is 5.0 µA. Assume the frequency of light from both lamps is above the threshold frequency. Use your answer in (b)(ii) to show that the total number of photons incident on the metal surface in one second is 7.0 x 10¹⁸. [1] Np/t = 5.0/3.2 x 4.5 x 1018 = 7.0 x 10¹⁸
(ii) State an assumption made in the above calculation. [1]
The ratio of the rate of emission of electrons to the rate of photons incident on metal remains the same for different frequencies for light OR The frequency is well above the threshold value.
(iii) When the intensity of lamp A is doubled, the current reading increases to 7.2 µA. Calculate the total power dissipated by the two lamps before the intensity of lamp A is doubled. [3]
New Np/t = 7.2/5.0 x 10.1 x 1018 Hence np/t for λ = 400 nm = 3.1 x 10¹⁸
Np/t for λ = 600 nm= 3.9 x 10¹⁸ Total power = (3.1 x 10¹⁸)(hc/λ1) + (3.9 x 10¹⁸)(hc/λ2) = 1.5 + 1.3 = 2.8 W
(d) Fig 8.3 shows an experimental set-up to produce the emission line spectrum of a
hydrogen gas. Fig. 8.3
(i) Explain how the line spectrum of hydrogen provides evidence for the existence of discrete electron energy levels in atoms. [2]
When electrons get de-excited, they lose energy and photons are emitted.
Due to discrete energy levels of atom, only photons of specific energies are emitted.
Hence only photons of specific frequencies/wavelengths are emitted as they have energy equal to the difference of any two energy level of the atoms.
lamp wavelength / nm A 400 B 600
discharge lamp
diffraction grating
screen

17
NYJC 2015 9646/03/J2PRELIM/15 [Turn over
For Examiner’s
Use
Some of the lines of the emission spectrum of atomic hydrogen are shown in Fig 8.4, which is drawn to scale. Fig. 8.4 (drawn to scale) (ii) Calculate the energy of the photon emitted for emission line labelled X. [2]
By measuring, wavelength = 656 nm Energy of photon = hc/λ = 3.0 x 10⁻¹⁹ J
(iii) Suggest why the actual spacing of the lines in the emission spectrum is not proportional to the difference in the wavelengths of the photons emitted. [1]
Based on the diffraction grating formula, dsinθ=nλ. Hence the distance is not proportional to λ or ∆λ as the distance is not proportional to sinθ.
(iv) Fig. 8.5 shows a partially completed diagram depicting the energy levels of a
hydrogen atom. The energy changes corresponding to photon emissions of wavelength 486 nm and 434 nm are also shown. Complete the energy level diagram based on the emission spectrum on Fig 8.4. Label with appropriate values. [2]
Fig. 8.5
(v) Each accelerated electron in the discharge tube has a kinetic energy of 4.85 x 10⁻¹⁹ J. Suggest why the accelerated electrons do not cause excitation of the electrons of the cool hydrogen gas. [1]
The lowest energy level shown in Fig 8.5 may not be the energy level at ground state.
- 4.1 x 10⁻¹⁹ J
0 J
486 nm
X 410nm 434nm 486nm
0.5 x 10⁻¹⁹ J
434 nm
0.7 x 10⁻¹⁹ J
-1.1 x 10⁻¹⁹ J

18
NYJC 2015 9646/03/J2PRELIM/15
For Examiner’s
Use 9 (a) (i) Draw a labelled diagram, showing the key features of the experiment performed by Rutherford, Geiger and Marsden to investigate the scattering of alpha particles. [2]
(ii) On Fig. 9.1, sketch a graph showing the distribution of the scattered particles in
different directions. [2]
(b) (i) State and explain how the mass of a 4
2He nucleus is different from the total mass of its protons and neutrons when separated. [2]
The separated nucleons have a greater mass than when they combine to from the He nucleus
This difference in mass is equivalent to the binding energy released when the nucleus is formed. / This difference in mass is equivalent to the binding energy added to separate completely the neutrons.
(ii) Explain why nuclei in a star have to be at high temperature for fusion to take
place. [2] When the temperature is high the nuclei will have high KE And this will allow them to overcome the strong nuclear repulsion when they in
order to be closer together (c) (i) The isotope of uranium, 238
92U, decays into a stable isotope of lead, 20682Pb , by a
series of α and β-decays. There are a total of 8 α-decays and n β-decays. Calculate the value of n. [2] 238 206 4 0
92 82 2 -1U Pb + 8 He + en→ 92 = 82 + 16 + -n n = 6

19
NYJC 2015 9646/03/J2PRELIM/15 [Turn over
For Examiner’s
Use
(ii) Fig. 9.2 shows the binding energy per nucleon for some stable nuclides. Fig. 9.2 Use Fig 9.2 to estimate the binding energy, in MeV, of the 206
82Pb nucleus. [2] From the graph, the value corresponding to mass number 206 is 7.87 MeV The total binding energy is (7.87) (206) = 1620 MeV (allow 1600-1640 MeV)
(iii) The half life of 238
92Uis 4.5 × 10⁹ years. At any given time most of the atoms are either 238
92Uor 20682Pb , as the half lives of all the other products are negligible.
When a rock sample is formed, it originally contained 3.0 × 10²² atoms of 238
92Uand no 206
82Pb atoms. Sketch, on Fig. 9.3, graphs to show how the number of 238
92U atoms and the number of 206
82Pb atoms in the rock sample vary over a period of 1.0 × 10¹⁰ years from its formation. Label your graphs U and Pb. [4]
Fig. 9.3
U: a graph starting at 3.0 X10²², showing exponential decay with time passing through (4.5 X 10⁹ years, 1.5 X 10²² atoms) and (9 X 10⁹ years ,0.75 X1022 atoms) Pb: reflected graph of the above, starting from zero total MUST be 3.0 X 10²² atoms, so passes through (4.5 X 10⁹ years, 1.5 X 10²² atoms) and (9 X 10⁹ years , 2.25 X10²² atoms)
binding energy per nucleon / MeV
nucleon number
Time / × 1010 years
Number of atoms / × 1022
1.0
2.0
3.0
0 0.2 0.4 0.6 0.8 1.0

20
NYJC 2015 9646/03/J2PRELIM/15
For Examiner’s
Use (iv) At a certain time t after its formation, the sample contained twice as many 238
92U atoms as 20682Pb atoms. Show that the number of 238
92U atoms in the rock sample at time t was 2.0 × 10²². [1] nu represents the number of uranium atoms at time t nu = 2 X ( 3.0 X10²² - nu) nu = 6.0 X10²² – 2 nu nu = 2.0 X 10²² atoms
(v) Calculate t in years. [3] N = No e-λt
2.0 × 1022 = 3.0 X10²² e-λt
e-λt = 2/3
-λt = ln (2/3)
λt = ln (3/2)
t = ln 1.5 / λ
(and λ = ln 2 / t1/2) t = 2.6 X 10⁹ years