Embed Size (px)
Citation preview
Mercury Emissions from GMOS / AMAP / UNEP
by
Nicola PirroneCNR – Institute of Atmospheric Pollution Research, Rome, Italy
www.iia.cnr.it
HTAP WorkshopPasadena,CA – 1-3 February 2012

Main steps of the “Mercury Policy Process”
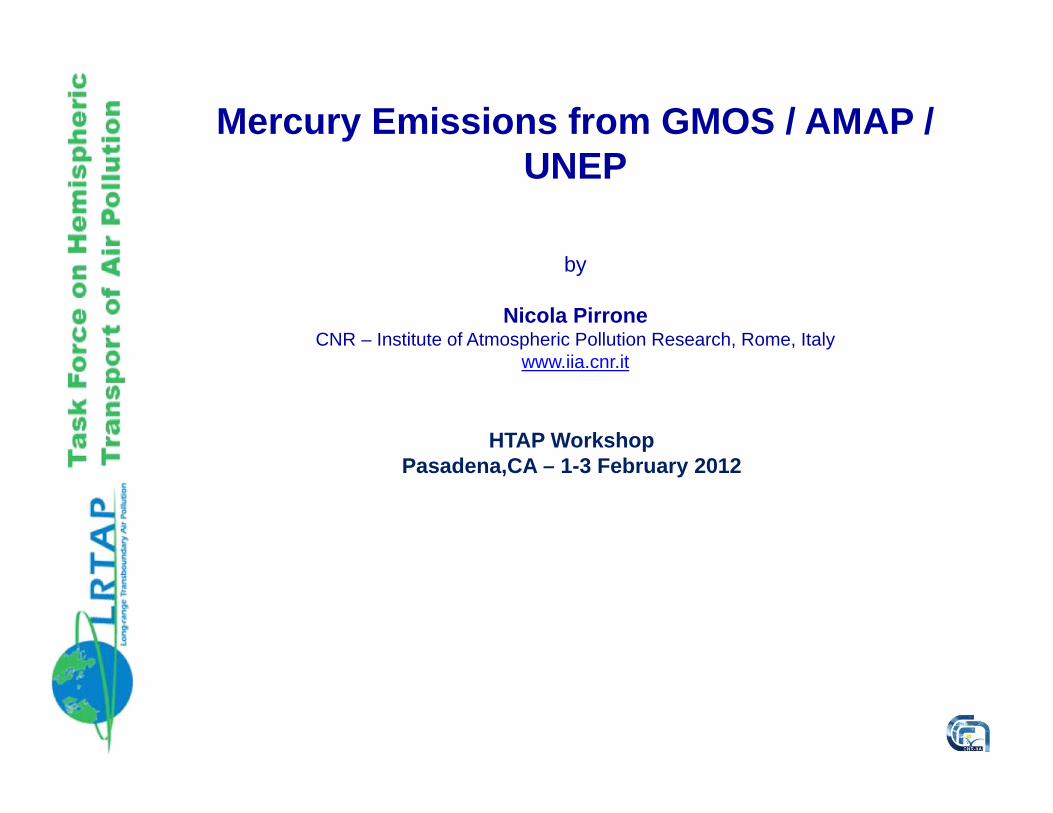
2001 UNEP GC at its 21st session: need for a global assessment of mercury recognized
2003 Study “GMA Report“, prepared by UNEP presented to the GC at its 22nd
session. GC agreed for further international action on mercury
2005 UNEP GC at its 23rd session called for Mercury Partnerships between governments and stakeholders: Five Partnership Areas were identified
UNEP F&T published “Dynamics of mercury pollution on regional and global scales” Springer, USA (Pirrone and Mahaffey, Eds.)2005
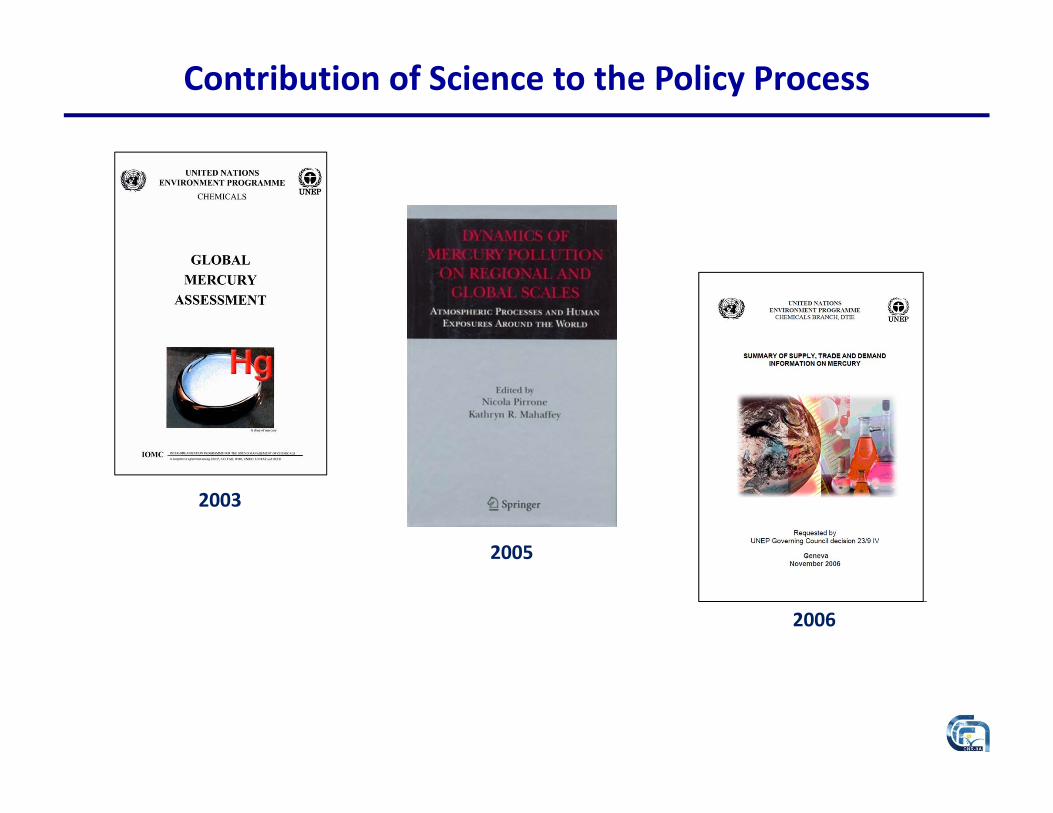
UNEP GC at its 24th session: “two-track “ approach based on voluntary actions and on the path to LBI. An overarching framework for strengthening
UNEP Global Mercury Programme partnerships was developed 2007
AMAP and UNEP published “"The Global Atmospheric Mercury Assessment: Sources, Emissions and Transport”2008
UNEP F&T published “Mercury Fate and Transport in the Global Atmosphere: Emissions, Measurements and Models” Springer, USA
(Pirrone and Mason, Eds.) 2008-2009
UNEP GC at its 25th session: agreed on an Intergovernmental Negotiating Committee (INC) to prepare a legally binding instrument
on mercury 2009
INC’s work started in 2010 and will end in 20132010-2013
Contribution of Science to the Policy Process
2003
2005
2006
Contribution of Science to the Policy Process
2009
2009
AMAP/UNEP 2008
UNEP F&T 2008
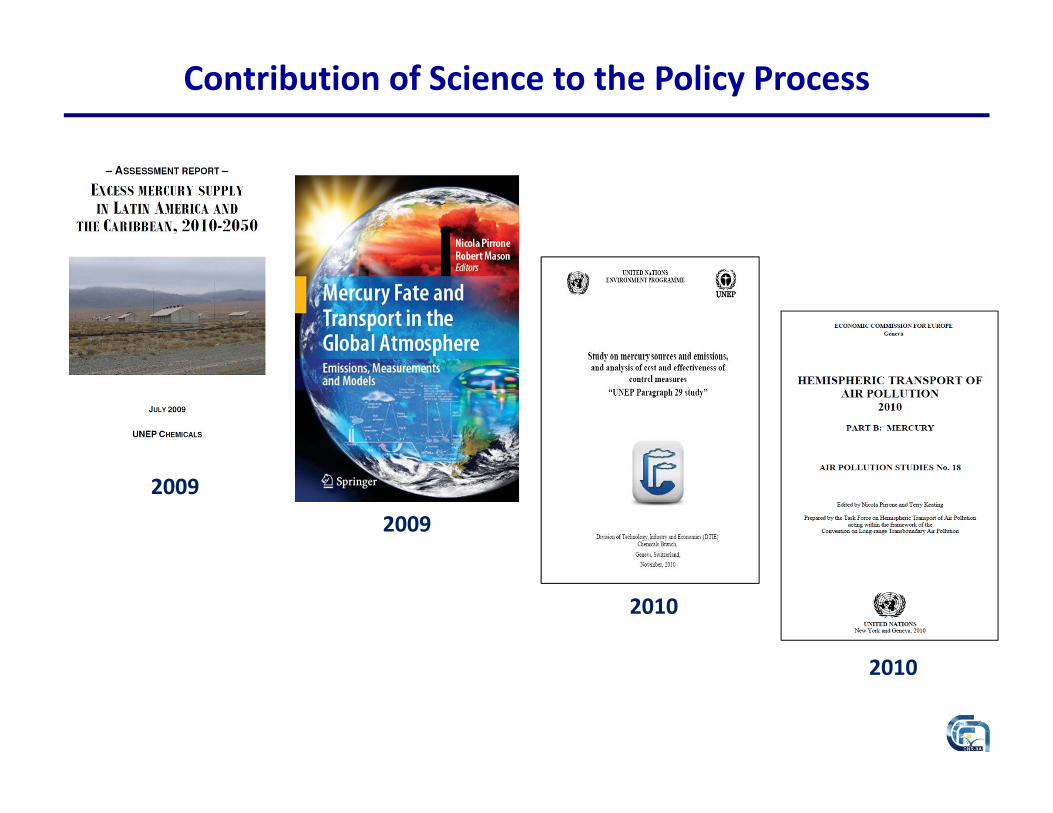
Contribution of Science to the Policy Process
2009
2010
2010
2009

TF HTAP-UNECE 2010 ”Part B: Mercury” ReportPirrone N. and Keeting T., Editors
The HTAP report, published in 2010,was made possible by the commitment and voluntary contributions of a large network of experts in academia, government agencies and international organizations.
The objective of HTAP 2010 assessment is not limited to informing the LRTAP Convention but, in a wider context, to provide data and information to national governments and internationalorganizations on issues of long-range and intercontinental transport of air pollution and to serve as a basis for future cooperative research and policy action.

GMOS Goal
To establish a Global Observation System for Mercury able to provide ambient concentrations and deposition fluxes of
mercury species around the world, by combining observations from permanent ground‐based stations, and
from oceanographic and tropospheric measurement campaigns.
www.gmos.eu
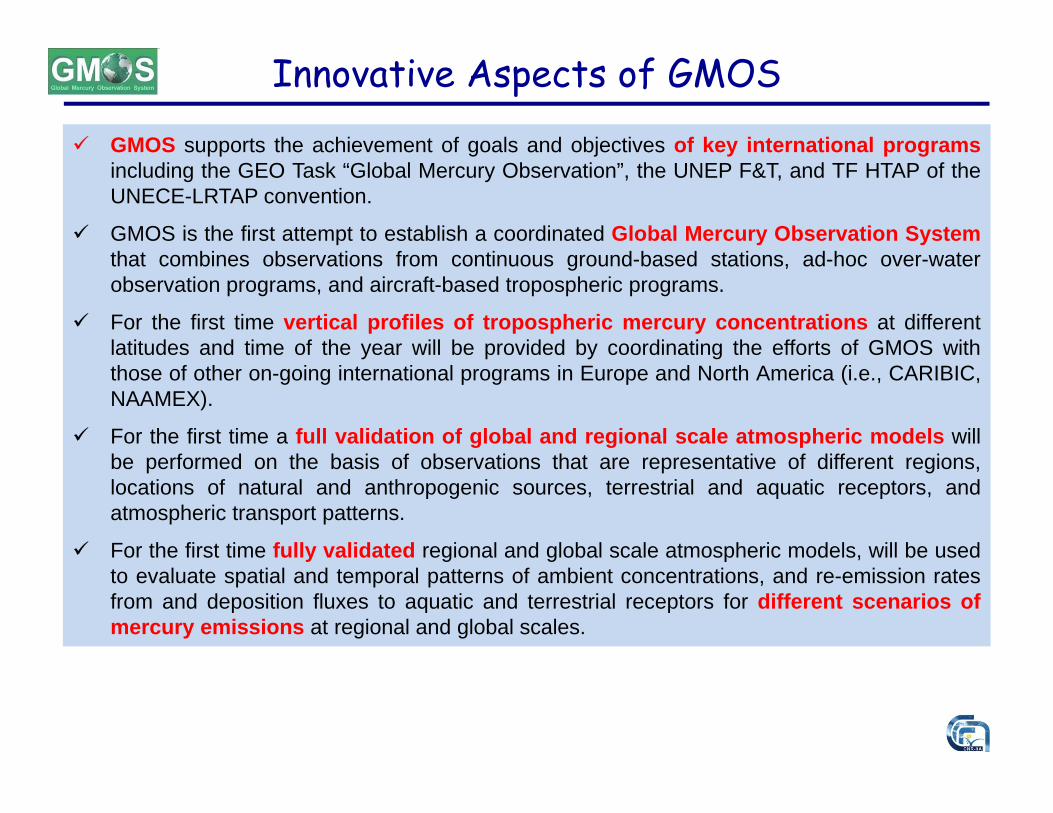
Innovative Aspects of GMOS GMOS supports the achievement of goals and objectives of key international programs
including the GEO Task “Global Mercury Observation”, the UNEP F&T, and TF HTAP of theUNECE-LRTAP convention.
GMOS is the first attempt to establish a coordinated Global Mercury Observation Systemthat combines observations from continuous ground-based stations, ad-hoc over-waterobservation programs, and aircraft-based tropospheric programs.
For the first time vertical profiles of tropospheric mercury concentrations at differentlatitudes and time of the year will be provided by coordinating the efforts of GMOS withthose of other on-going international programs in Europe and North America (i.e., CARIBIC,NAAMEX).
For the first time a full validation of global and regional scale atmospheric models willbe performed on the basis of observations that are representative of different regions,locations of natural and anthropogenic sources, terrestrial and aquatic receptors, andatmospheric transport patterns.
For the first time fully validated regional and global scale atmospheric models, will be usedto evaluate spatial and temporal patterns of ambient concentrations, and re-emission ratesfrom and deposition fluxes to aquatic and terrestrial receptors for different scenarios ofmercury emissions at regional and global scales.
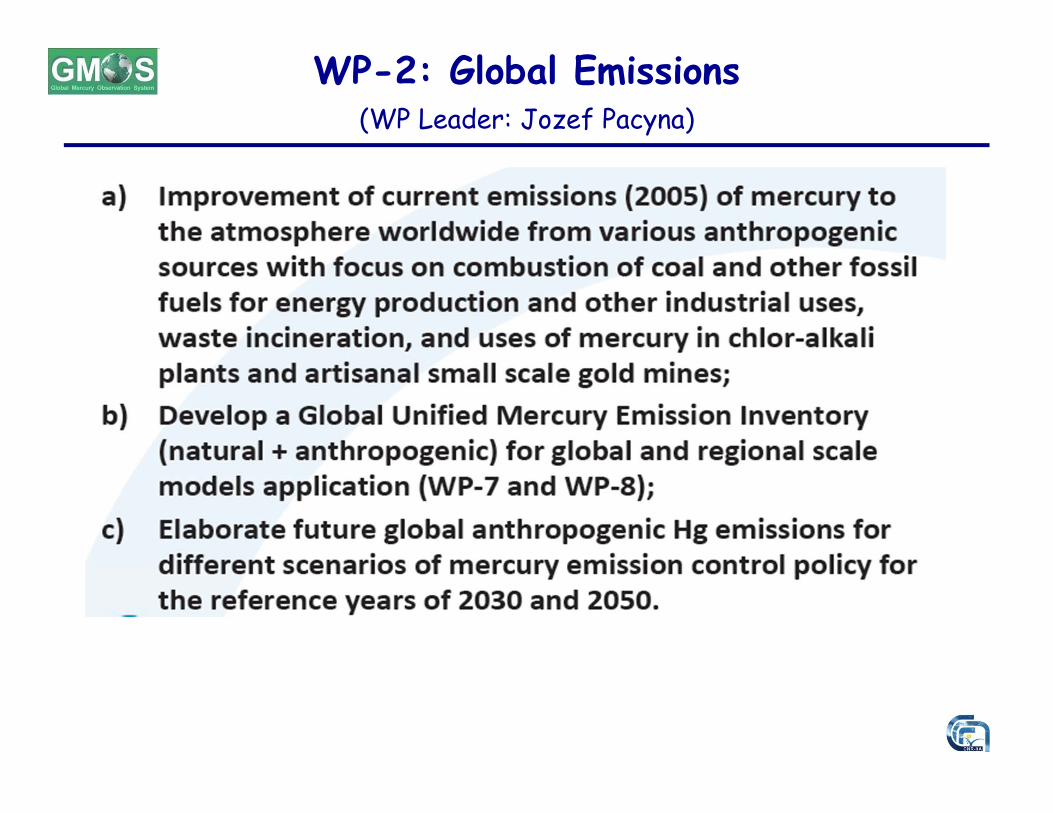
WP-2: Global Emissions (WP Leader: Jozef Pacyna)
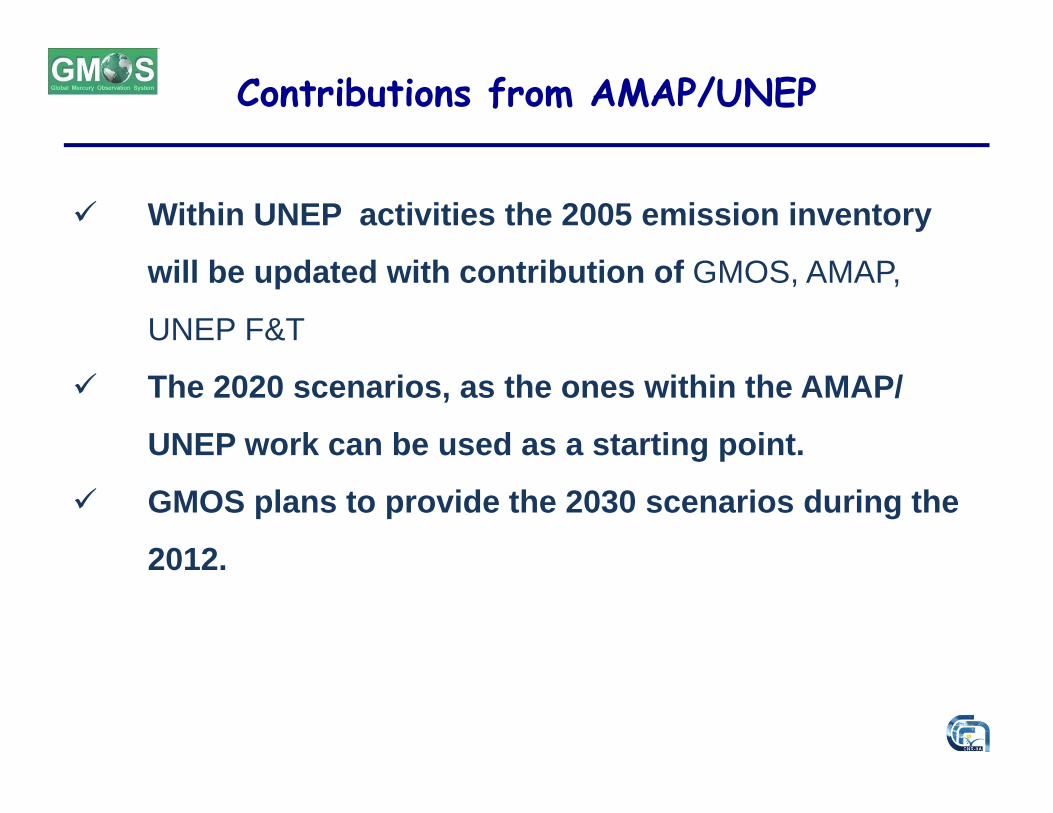
Contributions from AMAP/UNEP
Within UNEP activities the 2005 emission inventory
will be updated with contribution of GMOS, AMAP,
UNEP F&T
The 2020 scenarios, as the ones within the AMAP/
UNEP work can be used as a starting point.
GMOS plans to provide the 2030 scenarios during the
2012.

Global Pathways of Mercury
Source: Swain et al. (2007) Ambio 36, 45-61.
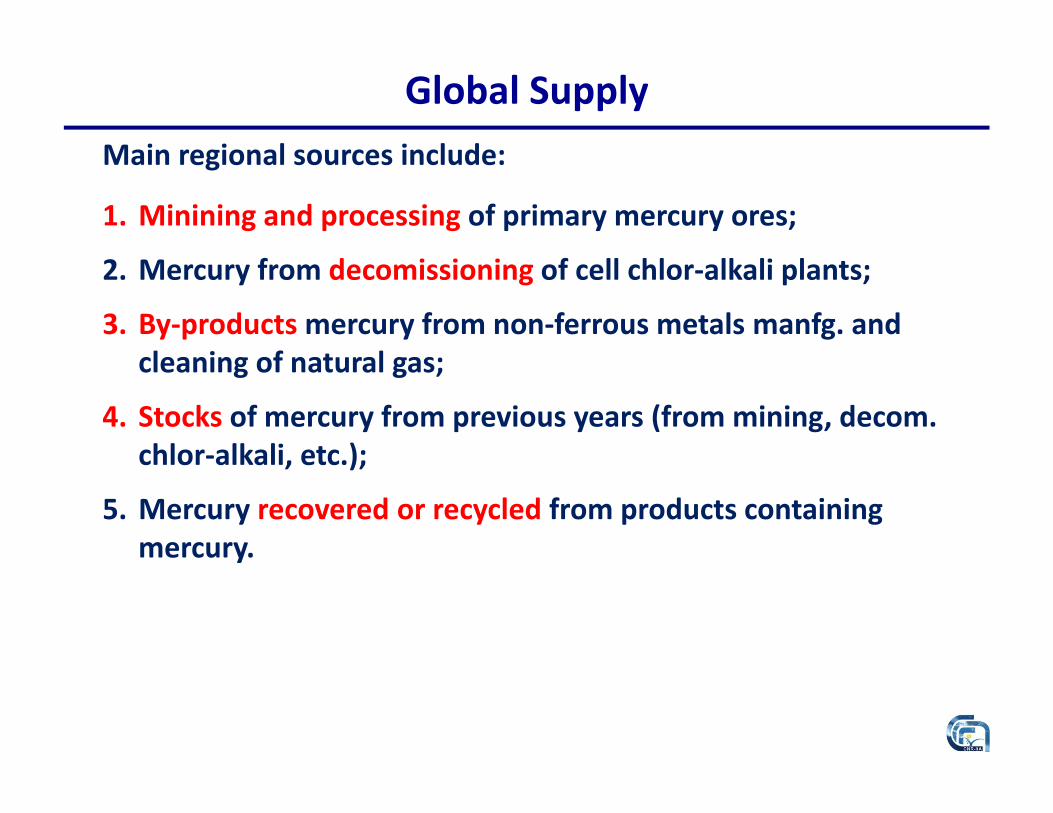
Global SupplyMain regional sources include:
1. Minining and processing of primary mercury ores;
2. Mercury from decomissioning of cell chlor‐alkali plants;
3. By‐products mercury from non‐ferrous metals manfg. and cleaning of natural gas;
4. Stocks of mercury from previous years (from mining, decom. chlor‐alkali, etc.);
5. Mercury recovered or recycled from products containing mercury.

Global Mercury Uses
Chlor‐alkali10%
Batteries10%
Dental amalgam10%
Meas. & control10%
Lighting4%
Elect. controls5%
Gold and silver mining22%
Other uses8%
VCM21%
Maxson, 2010
Chlor‐alkali13%
Batteries10%
Dental amalgam10%
Meas. & control9%
Lighting4%
Elect. controls5%
Gold and silver mining21%
Other uses8%
VCM20%
Maxson, 2005

Mercury Consumption by Region and Application
Source: Maxson, 2010

Mercury Supply‐Excess / Asia and LA&C
Source: Maxson (2009)
The vast majority of imported mercury is used for ASGM and in lesser extent for Chlor‐alkaly and products.
The time of anticipated mercury excessdepends on demand reduction in key sectors and policy decisions about recovering of mercury, and
mercury storage management.
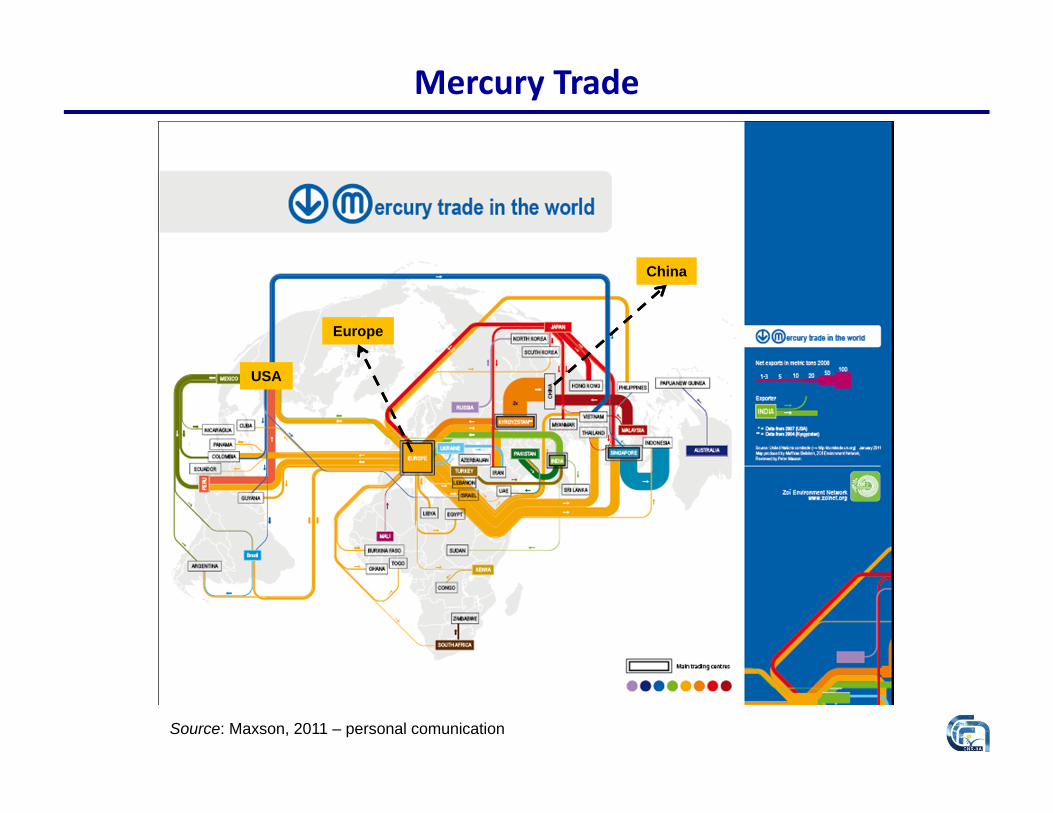
Mercury Trade
Source: Maxson, 2011 – personal comunication
Europe
China
USA

The need to unify current emission inventories
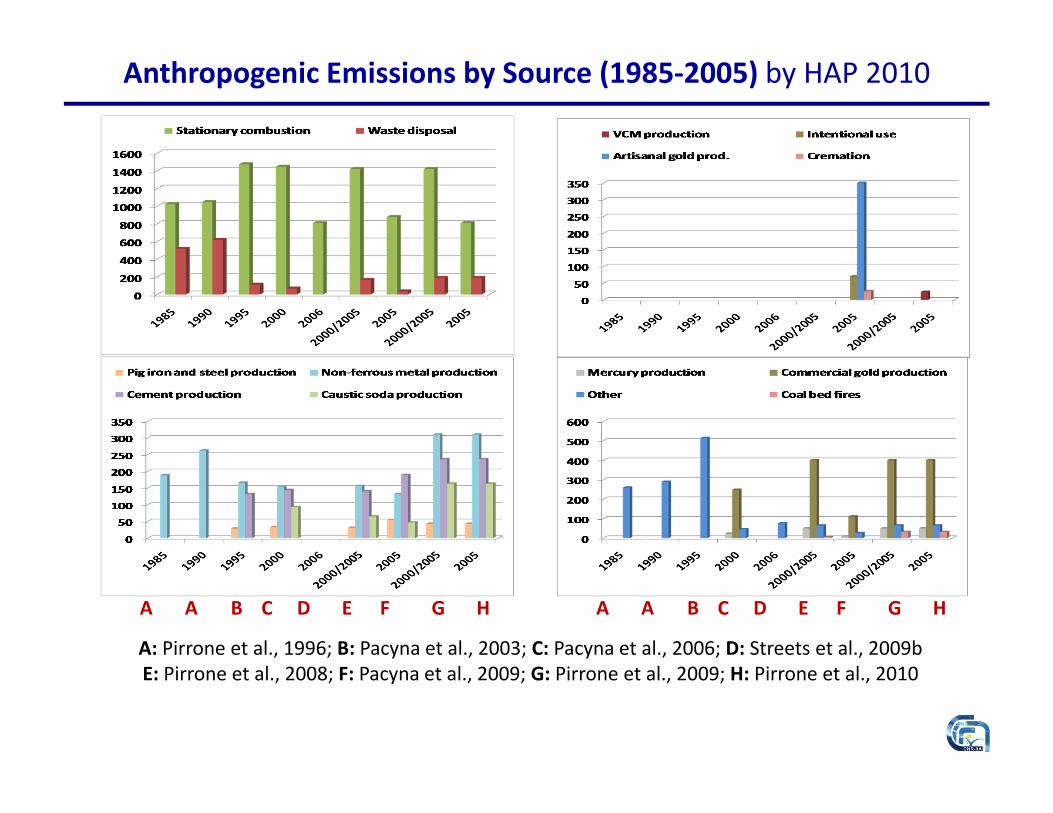
A: Pirrone et al., 1996; B: Pacyna et al., 2003; C: Pacyna et al., 2006; D: Streets et al., 2009bE: Pirrone et al., 2008; F: Pacyna et al., 2009; G: Pirrone et al., 2009; H: Pirrone et al., 2010
A A B C D E F G H A A B C D E F G H
Anthropogenic Emissions by Source (1985‐2005) by HAP 2010

A: Pirrone et al., 1996; B: Pacyna et al., 2003; C: Pacyna et al., 2006; D: Streets et al., 2009bE: Pirrone et al., 2008; F: Pacyna et al., 2009; G: Pirrone et al., 2009; H: Pirrone et al., 2010
A A B C D E F G H
Total Anthropogenic Emissions (1985‐2005) by HAP 2010
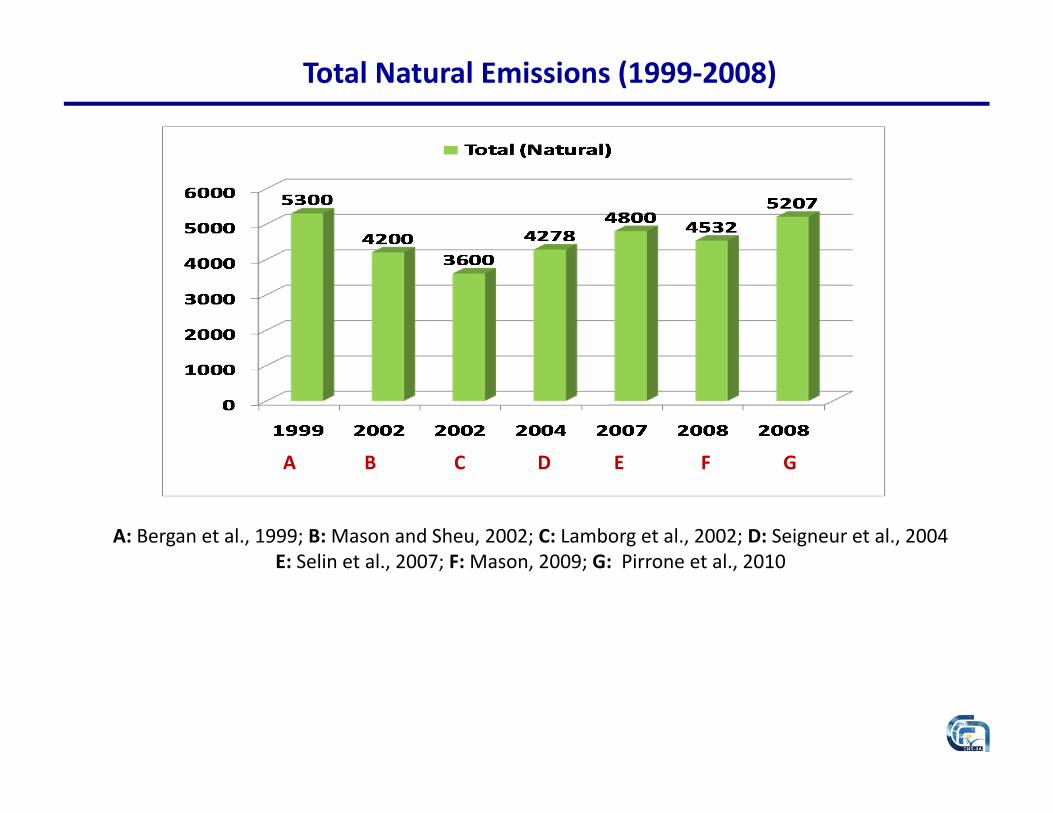
A: Bergan et al., 1999; B:Mason and Sheu, 2002; C: Lamborg et al., 2002; D: Seigneur et al., 2004E: Selin et al., 2007; F:Mason, 2009; G: Pirrone et al., 2010
A B C D E GF
Total Natural Emissions (1999‐2008)
Where the uncertainties are ?

Water Surfaces
Region Net Evasion (average)(Mg y-1)
Net Evasion (average)(ng m-2 h-1)
Atlantic Ocean 842 0.94Pacific and Indian Ocean 1705 0.87Antarctic Ocean 10 0.11Mediterranean 70 1.83Coastal waters 60 1.96Lakes 96 2.39Total 2763 0.83
Source: Chapter‐7, by Mason (2008), Springer 2009; Pirrone et al. ACP, 2010;

Forest Fires
Source: Friedli et al. ES&T (2008)
Global Emission:
675 Mg y‐1
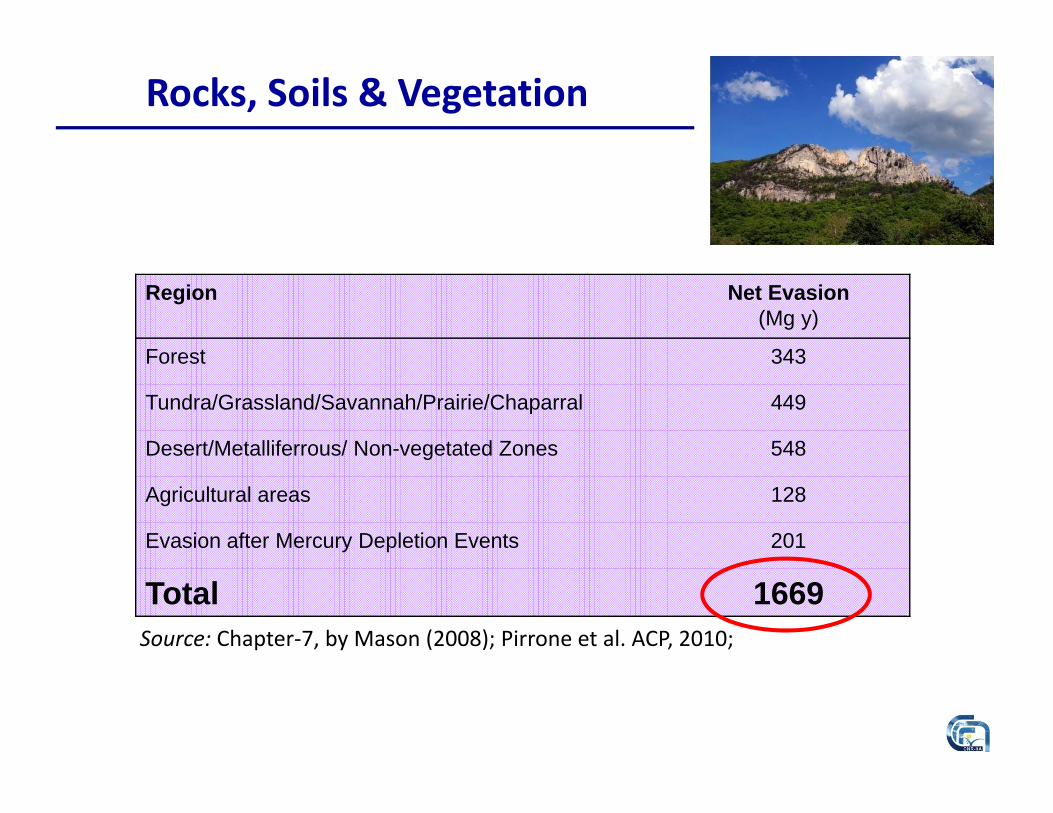
Rocks, Soils & Vegetation
Region Net Evasion (Mg y)
Forest 343
Tundra/Grassland/Savannah/Prairie/Chaparral 449
Desert/Metalliferrous/ Non-vegetated Zones 548
Agricultural areas 128
Evasion after Mercury Depletion Events 201
Total 1669Source: Chapter‐7, by Mason (2008); Pirrone et al. ACP, 2010;
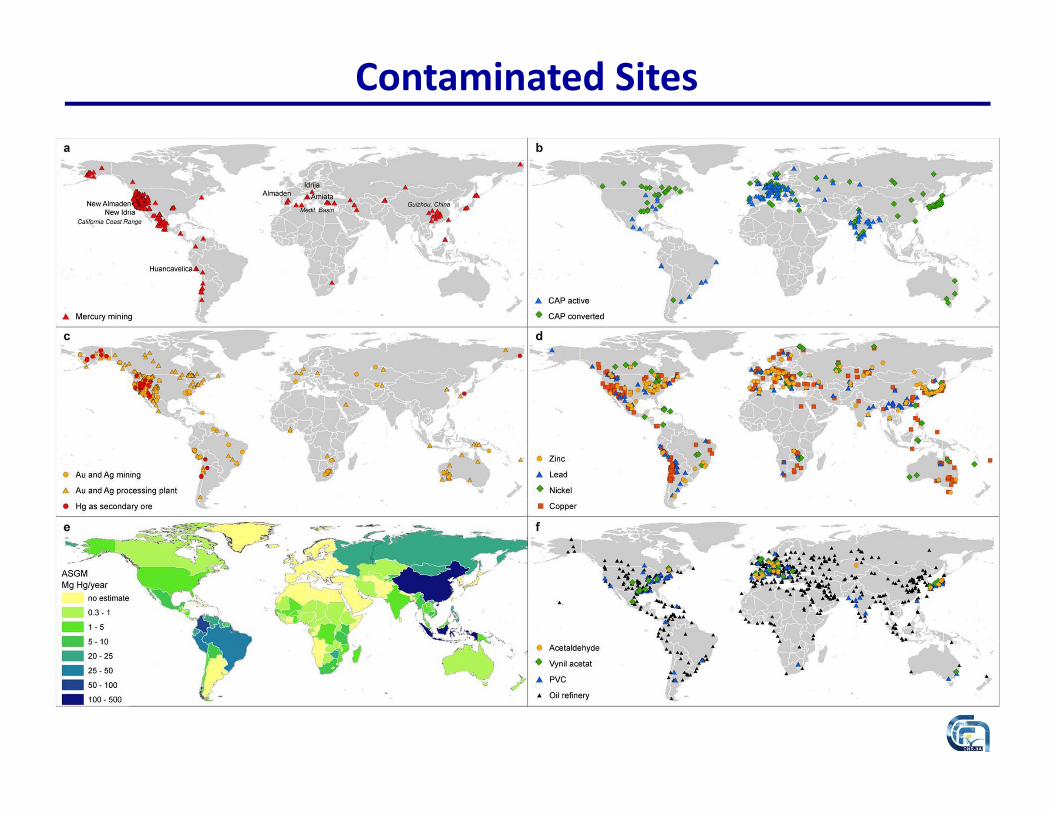
Contaminated Sites
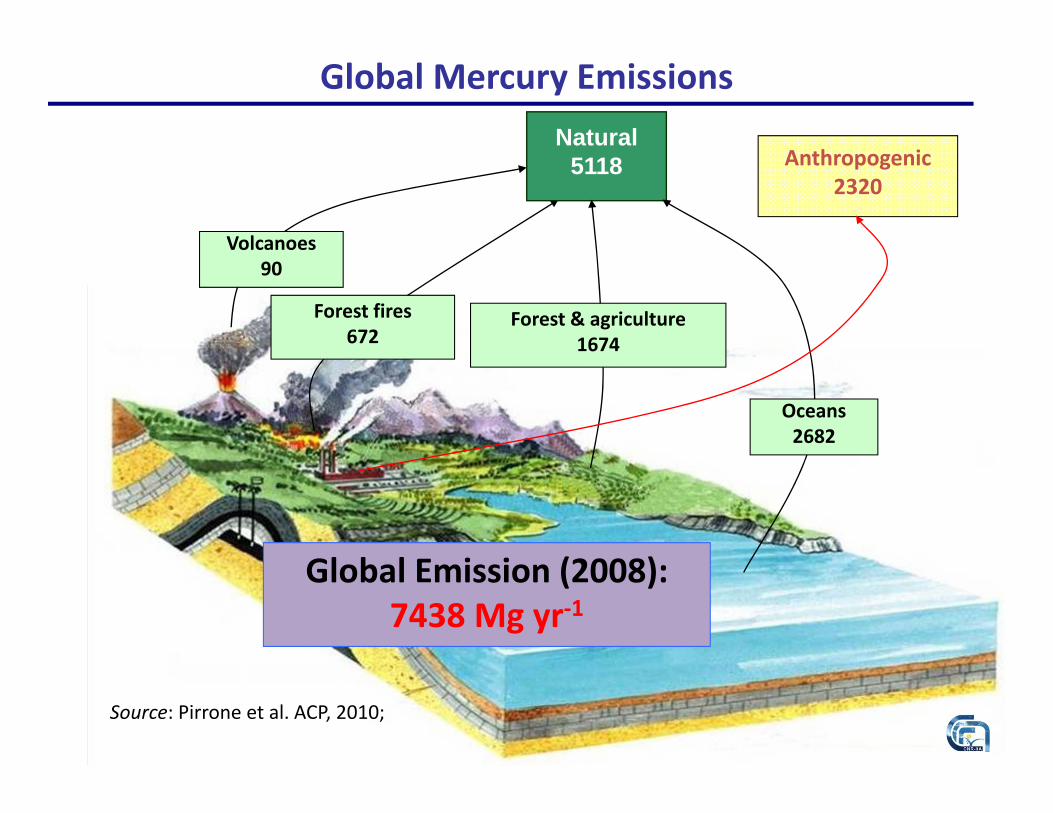
Global Mercury Emissions
Volcanoes90
Natural5118
Forest fires672
Oceans2682
Forest & agriculture1674
Anthropogenic2320
Global Emission (2008):7438 Mg yr‐1
Source: Pirrone et al. ACP, 2010;


UNECE‐LRTAP TF HTAP Policy‐Relevant Science Questions
How does the intercontinental or hemispheric transport affect deposition patterns in the NH ?
Is it possible to characterize source-receptor relationship taking into account the various mechanisms affecting its cycle (emission-chemistry-deposition-reemission) and the spatial scale (local-to-regional-to-global) ?
Are emission inventories consistent with observations ? Is the contribution of natural sources well characterized ? Is the assumption of steady-state still valid ? What about the
temporal variation of the residence time of different Hg compounds ? Besides speciated Hg measurements, what other key
measurements do we need to improve our models capabilities ? How deposition loads would change in the next 20-50 years if a
50% reduction will occur in Hg emissions ? How future changes in ozone and aerosol concentrations will
affect Hg fate and transport ?
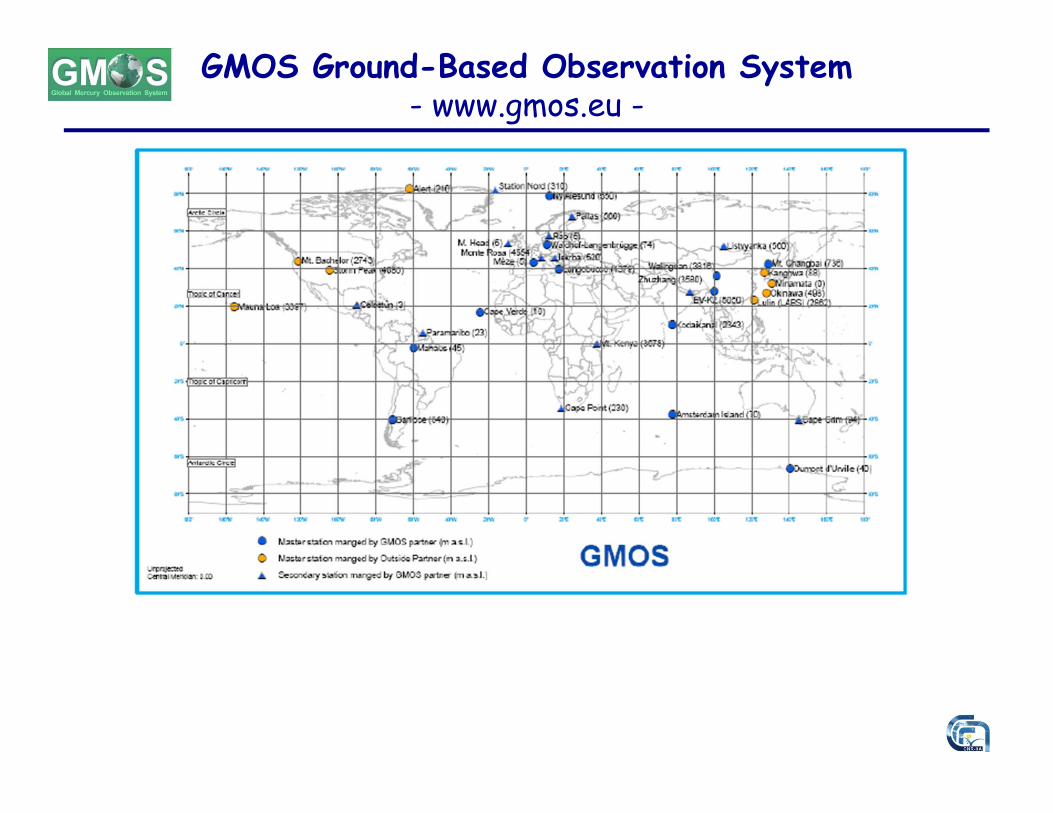
GMOS Ground-Based Observation System- www.gmos.eu -
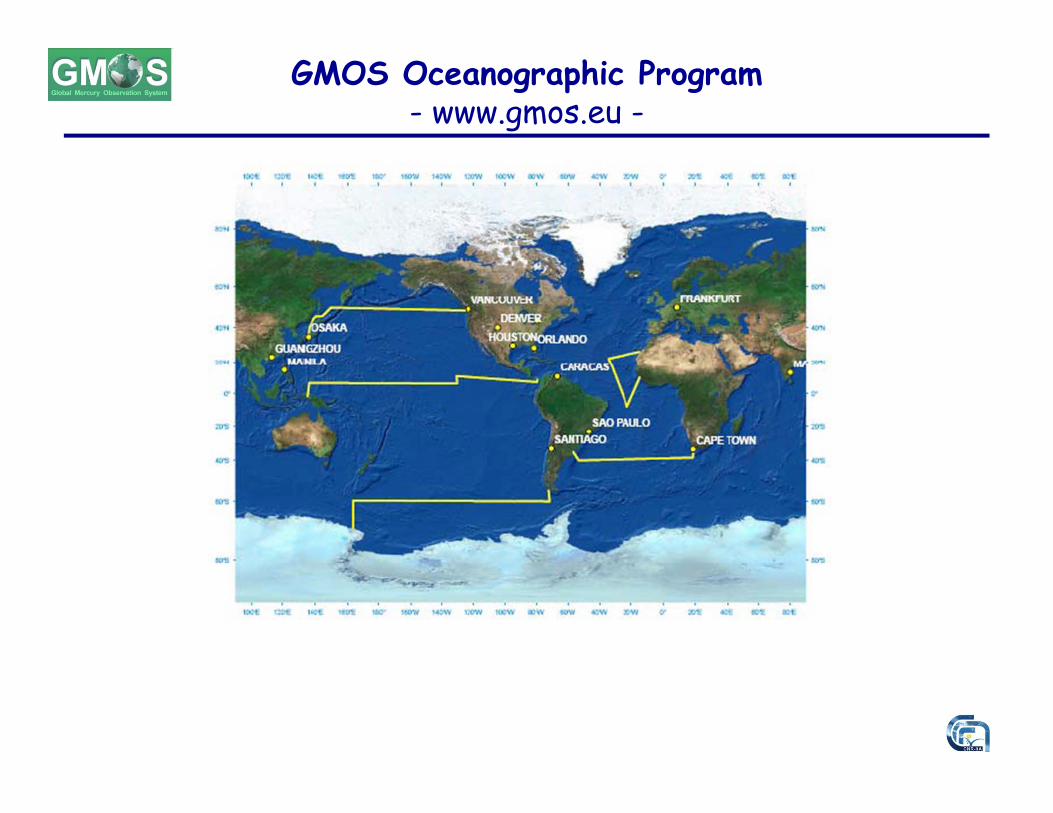
GMOS Oceanographic Program- www.gmos.eu -

GMOS Aircraft-Based Program- www.gmos.eu -
CARIBIC Flights
European Tropospheric Mercury Experiments- ETMEx -
Mace Head, Irland
Po Valley, Italy
Etna Volcanoes, Italy

by an Intergovernmental Negotiating Committee (INC) supported by the Chemicals Branch of the UNEP Division
of Technology, Industry and Economics as secretariat
February 2009
UNEP GC agreed on
developing a global legally binding instrument on
mercury
About INC
All Governments
Intergovernmental organizations
Civil society’s representatives
Take part to INC
as o
bser
vers
as o
bser
vers

INC’s goal is to complete the negotiations before the 27th regular session of the
GC/Global Ministerial Environment Forum in 2013
Neg
otia
tion
sJune 2010
January 2011
Oct-Nov 2011
June 2012
Early 2013
INC-1: Stockholm, Sweden
INC-2: Chiba, Japan
INC-3: Nairobi, Kenya
INC-4: Uruguay
Diplomatic Conf: Japan
Following the negotiations, the text will be open for signature at a diplomatic conference (Conference of Plenipotentiaries),
To be held in 2013 in Japan
About INC
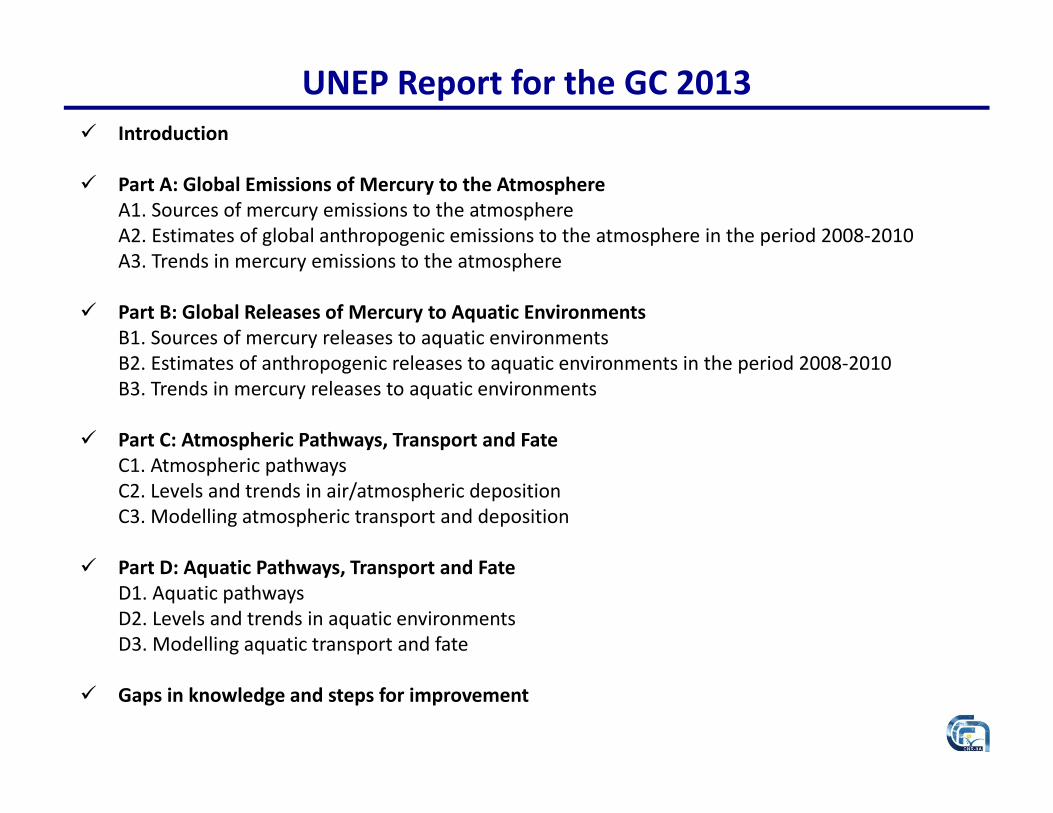
UNEP Report for the GC 2013 Introduction
Part A: Global Emissions of Mercury to the AtmosphereA1. Sources of mercury emissions to the atmosphereA2. Estimates of global anthropogenic emissions to the atmosphere in the period 2008‐2010A3. Trends in mercury emissions to the atmosphere
Part B: Global Releases of Mercury to Aquatic EnvironmentsB1. Sources of mercury releases to aquatic environmentsB2. Estimates of anthropogenic releases to aquatic environments in the period 2008‐2010B3. Trends in mercury releases to aquatic environments
Part C: Atmospheric Pathways, Transport and FateC1. Atmospheric pathwaysC2. Levels and trends in air/atmospheric depositionC3. Modelling atmospheric transport and deposition
Part D: Aquatic Pathways, Transport and FateD1. Aquatic pathwaysD2. Levels and trends in aquatic environmentsD3. Modelling aquatic transport and fate
Gaps in knowledge and steps for improvement

UNEP Report – Work PlanPhase 1June‐July 2011: Initiate work, develop detailed project plan for Phase 1, first ‘preliminary emissions estimate’ expert meeting (see section “Organization and management”).
July‐ September 2011: Collect and review information (acquisition of preliminary data and information), compilation of preliminary data and prepare preliminary updated emissions estimates for selected countries and sectors. Meeting in the core expert and coordination group to review data.
July‐December 2011: Identify and engage relevant experts world wide, in particular from major emitting countries to obtain additional information and to check calculated emissions.
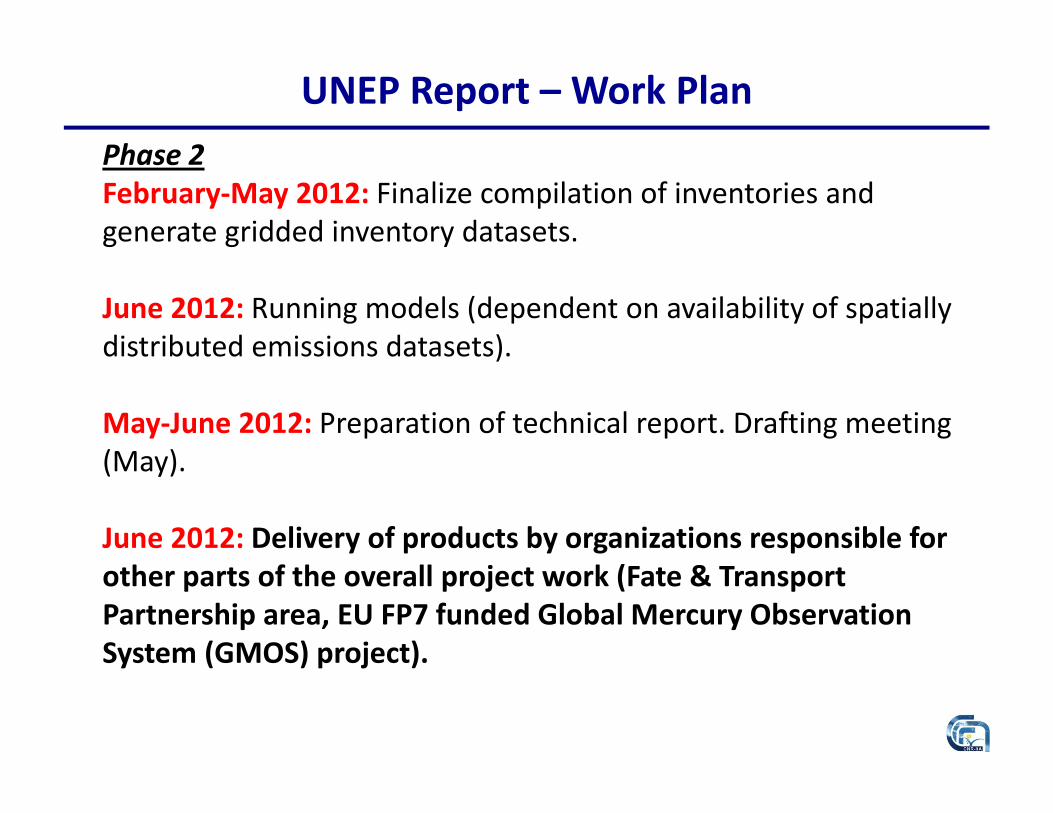
UNEP Report – Work PlanPhase 2February‐May 2012: Finalize compilation of inventories and generate gridded inventory datasets.
June 2012: Running models (dependent on availability of spatially distributed emissions datasets).
May‐June 2012: Preparation of technical report. Drafting meeting (May).
June 2012: Delivery of products by organizations responsible for other parts of the overall project work (Fate & Transport Partnership area, EU FP7 funded Global Mercury Observation System (GMOS) project).

UNEP Report – Work PlanPhase 2August‐September 2012: Finalization of technical report and summary report (incl. government review), i.e. develop final draft in which peer review comments have been taken into account;
End‐September 2012:Project expert meeting to discuss and approve products and plan presentation.
October‐December 2012: Production of reports. Deadline for the summary report: 1st week of December 2012.
February 2013: Delivery of Technical report to UNEP Governing Council