Embed Size (px)
Citation preview

SandeepSandeep GargGargBureau of Energy EfficiencyBureau of Energy Efficiency
Standards & labeling Program for motors Standards & labeling Program for motors
in in
IndiaIndia
MEPSA 2009 , 4MEPSA 2009 , 4--5th February 2009, Sydney5th February 2009, Sydney
Bureau of Energy Efficiency
Established in 2002, under the Energy Conservation Act, 2001.Improve energy efficiency through various regulatory and promotional instruments
Plan, manage and implement provisions the EC ActAppliance standards and labelingIndustrial energy benchmarksEnergy Conservation Building CodesMonitor energy use in high energy‐consumption unitsCertify and accredit energy auditors and energy managers
Provide a policy framework and direction to national energy conservation activitiesDisseminate information and knowledge, and facilitate pilot and demonstration projectsEstablish EE delivery systems through Public‐Private Partnerships (PPP).
2

3
Action Plans of BEE
(S&L)-12 Projects (ECBC) NBC
Energy consumptionnorms for
Designated Consumers (15)Schedule-Section 2(s)-ECA
EA/EMNational Certification Exam
BEE created as a nodal statutory body to improve energy –efficiency through:
Bachat Lamp Yojna
EE delivery systems through Public-Private Partnerships (PPP)
State Designated Agencies(30-SDAs)
Fund Req.
983.3 In Rs.Mn
Collectively Save 308 MW ofEnergy
Rs.1843 Cr. Per yr.By implementation of
Energy Efficiency measures.
SDC (9)Required Auditing
& by BEE certified Auditor ESCOs
Installed Capacity India (as on 31st August, 2008)
TOTAL IC-1,45,627 MW
HYDRO, 36198, 24.8
%
THERMAL 9311564%
NUCLEAR 41202.8%
R.E.S., 121958.4%
Per Capita Consumption of Electricity in India
Source: CEA
176348
559632 672 704
1000
613
1980-81
1990-91
2000-01
2004-05
2005-06
2006-07
2007-08
2011-12
kWh/year
(Projected)
As per UN Methodology (Gross Electrical Energy Availability / Population)
Growth Pattern
6
Up to 30
Up to 20
Up to 30
Up to 25
Conservation potential (%)
20-25%
Commercial Sector
Domestic Sector
Agriculture Sector
Industrial Sector
Sector
Sector wise Energy Saving potential
Energy Handled by Motors (%)
70-75%
2-3%
4-5%
Source : AFF report

Products covered under Indian S&L Program
Current List 1. Frost-free Refrigerators2. Tubular Fluorescent Lamps (TFL)3. Air-conditioners 4. Direct cool /Frost Free Refrigerators5. Distribution Transformers6. Motors7. Pump sets 8. Ceiling fans9. LPG Stoves10.Colour TVs11.Storage Water Geysers
Launched on 18th May 2006 , for 4 products by BEE
Future Products under Indian S&L Program
•Compact Fluorescent Lamps ( CFLs)•Transport Sector
•Passenger Cars•2 & 4 Wheelers•Heavy Commercial Vehicles.
•Office Equipments ( Monitors, Fax, Copiers etc)•Washing Machines•Consumer Electronics
•Set-Top Boxes, Microwaves etc•Invertors •Uninterrupted Power Supply (UPS)•External Power Supplies (EPS)•Battery Chargers (BCs)•Compressors•Industrial Fans & Blowers

100%
70%
40%
3%
0% 10% 20% 30% 40% 50% 60% 70% 80% 90% 100%
TheoroticalPotential
Technicallyfeasible
Economicallyviable
Marketpenetration
9
Barriers to penetration of HEM s1. Lack of knowledge/ awareness with users2. Non availability of EE motors3. Confusion – EE motor definition4. Need to have focused market transformation
• Higher initial cost• Low demand; high price• Lesser working hours• Lack of technology
1. Poor power quality in rural sector2. Application limitations
10
Regulation:
•Policies & its framework •Standards & Labels to be made mandatory at appropriate time
Supply Push
•Design & technology developments•Align with international trends•Handholding of some segments of manufacturers
Demand Pull
•Awareness & dissemination•Demand for the EE products
Energy Efficiency

Institutional frame work for regulation
BIS – National Standards BodyFormulation & Implementation of National Standards
Production certification, Quality system certification, EMS
certification etc.
Bureau of Energy Efficiency (BEE)BEE is established to implement & monitor the Energy
Conservation Act, 2001
One of the key thrust areas of EC Act, 2001 is Standards &
Labeling Programme
Formulation of Energy Efficiency Standards.
11
Impact of S&L ProgramS.No. Particulars Motors (<15kW)
1. No. of products currently in use (Million) (31 December 2005) 1.68
2. Total energy use by the products (Million kWh/Year) (2005-06) 24988
3. Contribution to demand (MW) (2005-06) 5112
4. Current Annual Sales (Million/Year) 0.36
Energy Savings Potential
5. 2009 (MUs/Yr) 314
6. 2011 (MUs/Yr) 974
7. 2015 (MUs/Yr) 3051
8. 2020 (MUs/Yr) 6455
Demand Saving Potential (MW)
9. 2009 64
10. 2011 199
11. 2015 624
12. 2020 1320

Market Transformation Potential : Induction Motors
EFF3
EFF2
EFF 1
IEEMA members
Small MM
Focus area
Minimum Benchmark Crompton Greaves 40%
Bharat Bijlee& Others 7%
ABB 16%
Siemens 37%
Source: Primary Survey, AFF Estimates
Market Share - EFF1 Motors (Nos.)
EE Motors: Current Market Status
Market growth CAGR of 2 % , with 50 % unorganized sector
Policy interventions
•Designated consumers, which are basically energy intensive industry, commercial buildings and establishments.
•Energy consumption standards and labeling program for equipment and appliances.
•Energy conservation building codes for efficient use of energy and its conservation in the buildings and building complex.
•Promotion of R&D, energy efficiency in buildings and establishments, awareness creation among educational institutions etc.

Methodology used for formulating the scheme
Market SurveySelect Sample ratings & make of motorsPurchase of Standard motorsTest for performance in NABL accredited laboratories.Assess constructional features, quantity & quality of active materials Techno‐commercial analysis Finalize recommendations with all the stakeholders Launch of scheme after due approvals
15
Motor Market Segments
Fractional HP motors9.32 Million Units
DC Motors6,500 Units
0.75-7.5 kW1.18 Million Units
11-37.5 kW0.13Million Units
+37.5 kW10,000 Units
Low TensionSquirrel Cage
1.31 Million Units
Low TensionSlip Ring
4,000 Units
ACLow Tension Motors
1.31 Million Units
ACHigh Tension Motors
1,000 Units
Motors10.64 Million Units
16
•Domestic Appliances•Light Loading
•60% Agricultural Pumps•30% Industrial•10% Domestic
•90% Industrial•10% Agricultural
•Industrial
Source: AFF Estimates, IEEMA Statistics, Primary Survey
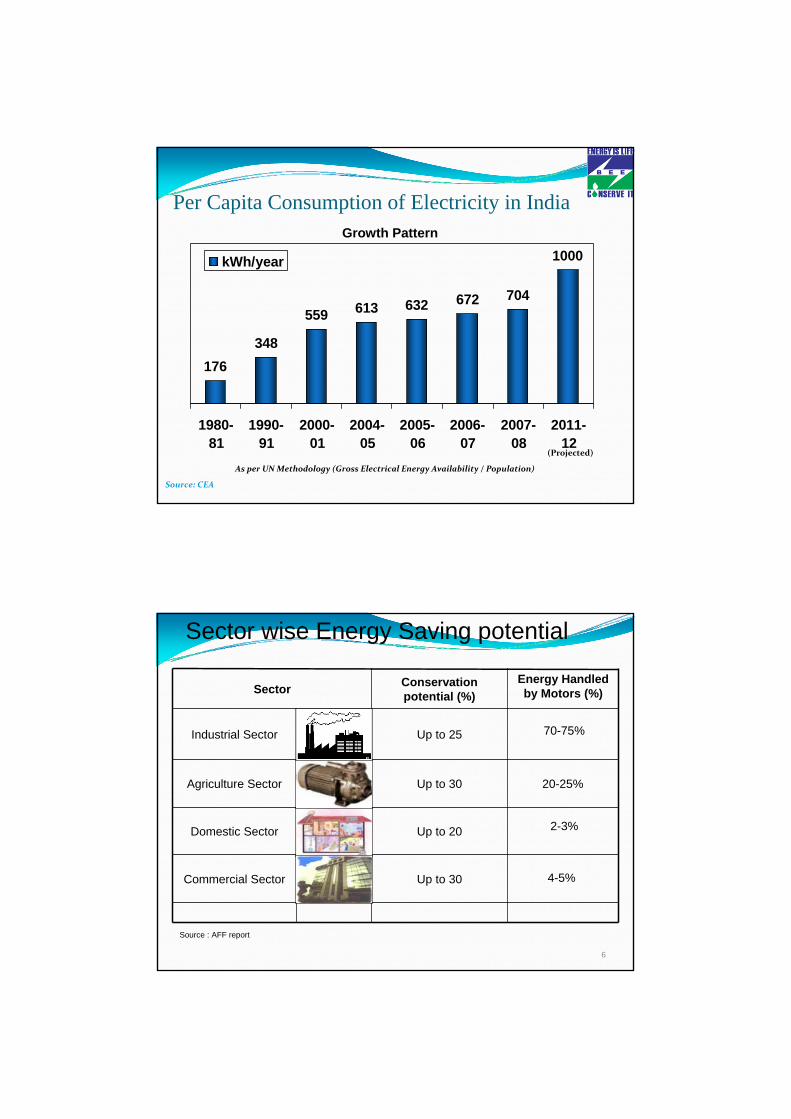
0.75-7.5kW89%
11-37kW10%
>37kW1%
National players
54%
regional /Local
players46%
17
Source: AFF Estimates, IEEMA Statistics, Primary Survey
89%
Market Size & break up
Rating wise break up for 3 ph sq cage Induction motors (2003-04)
Manufacturing sector break up Induction motors (2003-04)
Sample Plan for techno commercial study
3‐phase 4 pole squirrel cage induction motor: 2.2 kW (26 motors), 3.7 kW (27 motors)
8 national manufacturers
18 regional/local manufacturers
18
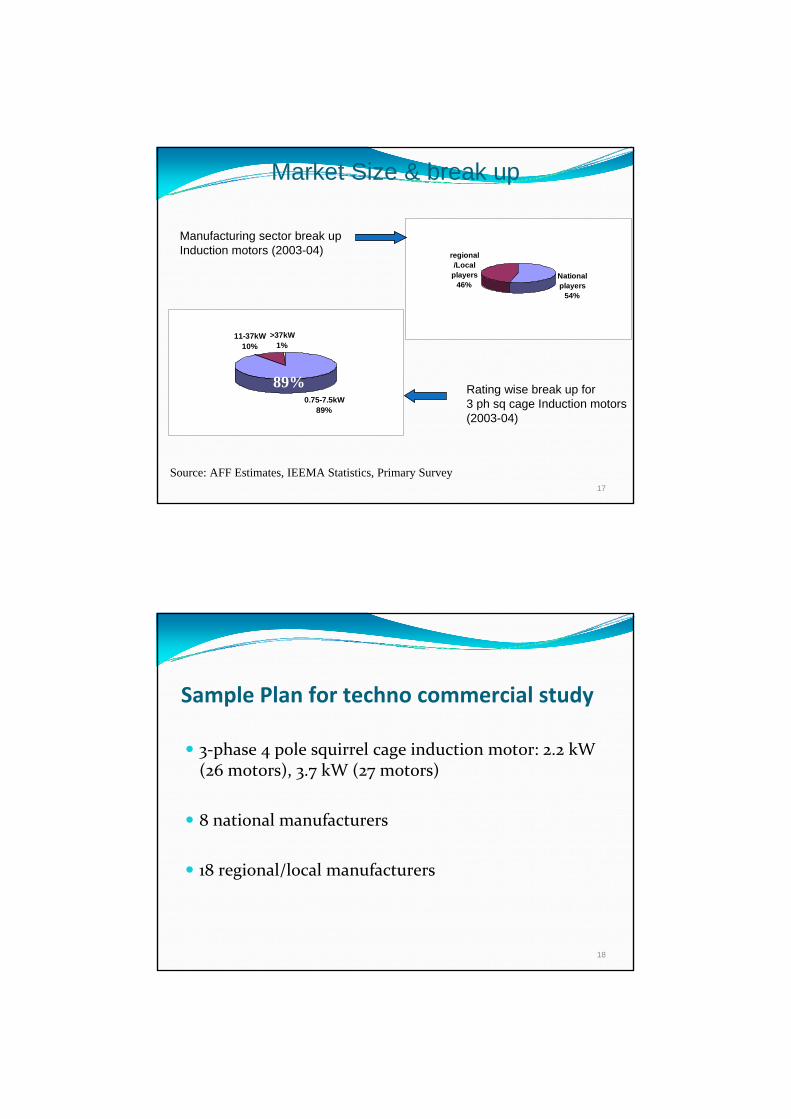
Distribution by Efficiency Class
2.2 kW 3.7 kW2.2 kW 3.7 kW
19
38.5 38.5
23.1
05
101520253035404550
Eff2 Eff2(-) non-Eff2
Shar
e,%
48.1
22.2
29.6
05
101520253035404550
Eff2 Eff2(-) non-Eff2
Shar
e,%
Source: AFF Estimates, Primary Survey
Efficiency Improvement Analysis
Efficiency improvement will involve
motor design changes / redesign
manufacturing practices changes
manufacturing equipment changes.
Material optimization
20

3 HP ( 2.2 kW ) Induction Motors - Efficiency, Material Used & Price
0.00
10.00
20.00
30.00
40.00
50.00
60.00
70.00
80.00
90.00
100.00
1 2 3 4 5 6 7 8 9 10 11 12 13 14 15 16 17 18 19 20 21 22 23 24 25 26 27 28
Samples
Effic
ienc
y (
% )
/
Wat
t Los
s : W
15/
50 (
W/k
g )
2,000
3,000
4,000
5,000
6,000
7,000
100 % loadW 15/50 ( W/kg @ 1.5 tesla )Weight of steelCu WeightPrice ( INR )
EFF1 : 86.40 ~ 84.36 %
EFF2 : 81.00 ~ 78.15 %
Electrical Steel : < 8 W/kg / 5.3 W/Kg
21
Analysis background
Source: AFF Report
Classification of MotorsMotors were classified into efficiency classes depending on full load
efficiency:Following options were considered
Eff 1 and Eff 2 for motors having efficiency as per efficiency class in IS 12615 but without the allowed lower toleranceEff 1(‐) and Eff 2(‐) for motors having efficiency up to the allowed lower toleranceNon‐Eff 2 for motors having efficiency lower than the Eff 2 value with allowed tolerance.
It was agreed that Eff 2 is well‐established efficiency levels by virtue of being specified in IS 12615.
22

Benefits of Eff2Benefits of Eff2
23
Eff 2(-) Eff 2 Savings, GWh/yr 30.6 102.2 Savings, Rs crores 15.29 51.11 Affected Production, % 18.9 53.7
Source: AFF Report
24
Scope of motors covered
•General purpose, S1 duty, 3 phase squirrel cage
induction motors
•Motors up to 15kW, 4 & 2 pole considered
•Governing standard-
– IS 12615: 2004
– IS 325: 1996

MOTOR EFFICIENCY LEVELS(qualitative comparison)
Vision & Choice
Prepared for ICA by Peter Liu, E&E, May 2008
75
80
85
90
95
100
1 5 10 20 40 75 150
Induction Motor Kilowatt rating - 3 phase - 4 pole, general purpose
% E
ffic
ienc
y(a
t ful
l loa
d)
NEMA Premium
Standard Eff.High Efficiency
Super Premium
EFF 1 ~ EPAct=JIS 4212
EFF 2
26
Final labeling plan
•MEPS to be at Eff2 level and qualify for energy efficient endorsement label. •Eff1 would be a High energy efficient endorsement label
–Consider efficiency at 100% loading –Include 2 pole motors also on addition to 4 pole motors
•Label contents –
–Parameters spelt out in clause 20.1a of IS 325 : 1996–BEE logo, license number & Efficiency class marking
•Mandatory process to be initiated after positive market transformation.
27
Future plans
•Undertake DSM initiatives with the end users. •Develop CDM framework to instigate new buisness models.•Review the plan after periodically to up grade & align with international standards & norms.•Align National Programs such as APDRP and RGGVY schemes to trigger market pull and transformation.
Manufacturing of energy efficient motors
EPACT (NEMA MG1-2006)motors already being exported to north & south America.
EPACT motors are tested as per IEEE 112 (method B) standard for efficiency determination.

Project Objective
Overall objective:
Transfer high pressure die casting technology & Energy Efficient Motor
(EEM) design capabilities to motor industry in order to achieve energy
savings
Project Components:
1. Establish Centre of Excellence (C o E) with skills & technology
2. Enhance Energy efficiency Motor design competence to support SME’s
3. Transfer technology to at least two manufacturers
4. Technology commercialization
Component 1: Manufacturing capabilitySpecific objective:
Establish physical & operational facility
Sub components
Launch project, constitute team
Select the site
Finalize equipment specifications
Procure & install the equipments
Make the manufacturing facility operational
Die casting trials
UNDP- BEE and ICA Joint Project on the technology development of Die Casting Copper
Rotors

Component 2: Design CompetenceSpecific objective:
Enhance EEM design competency to support SME’s
Sub components
Procure design software
Engage consultants to train design engineers of C o E
Select motor types / Applications for design optimizations
Vetting of designs & guidance from industry experts
Prototype EEM manufacture & testing
Component 3 : Technology Transfer
Specific objective:
To transfer the technology to at least two Indian motor manufacturers
Sub components
Identify potential partners
Enter in to agreement
Conduct design optimizations & die casting trials for them

Component 4: Tech. Commercialization
Specific objective: To disseminate technology to industry
Sub components
Dissemination workshops
Technology demonstration to motor industry
Training to motor manufacturers & die casters
Thank you for your attention,
Contact information:
Sandeep Garg ([email protected])Bureau of Energy Efficiency
(Ministry of Power, Govt. of India)4th Floor, Sewa Bhawan
R.K.PuramNew Delhi - 110066
www.bee-india.nic.in