Embed Size (px)
Citation preview

INTERIM REPORTQ3 2017
MENU:
Front page
Highlights and key figures Q3 2017
Third quarter 2017 Group review
Financial review
Order backlog and intake
Segments
Acquisitions in the period
Organisation and HSE
Subsequent events
Market outlook
Risk and uncertainties
Definitions
Disclaimer
Interim condensed consolidated statement of income
Interim condensed consolidated finacial statements
Interim condensed consolidated statement of comprehensive income
Interim condensed consolidated balance sheet
Interim condensed consolidated statement of changes in equity
Interim condensed consolidated statement of cash flows
Notes to the financial statements
Note 1: General information
Note 2: Basis of preparation and statements
Note 3: Estimates, judgments and assumptions
Note 4: Segments
Note 5: Explanatory comments about the seasonality or cyclicality of interim operations
Note 6: Significant events and transactions
Note 7: Related party transactions
Note 8: Treasury shares
Note 9: Earnings per share
Note 10: Retirement benefit obligations
Note 11: Fair value of financial instruments
Note 12: Business combinations
Alternative performance measures (APMs)
Company contact information
Click here for A4 print version of this report
Screen mode Page 1 2#: Level 2 anchor2#: Level 3 anchor
1: Front page

3
HIGHLIGHTS
\ Third quarter revenue growth of 9.8%, driven by acquisitions
\ Third quarter earnings impacted by lower billing ratio and negative calendar effect
\ Year to date 2017 revenue growth of 11.9%, earnings impacted by lower billing ratio
\ Stable order backlog at NOK 2.1 billion
\ Hjellnes group acquisition successfully completed
CONSOLIDATED KEY FIGURES
Amounts in MNOK (except EPS, shares and percentage) Q3 2017 Q3 2016 YTD 2017 YTD 2016 FY 2016
FINANCIAL Net operating revenues 608.8 554.4 2 147.4 1 919.2 2 604.6 Growth (%) 9.8% 13.9% 11.9% 20.1% 15.9%EBITDA, underlying 1) 22.6 45.6 155.4 195.8 225.5 EBITDA margin (%), underlying 1) 3.7% 8.2% 7.2% 10.2% 8.7%EBIT, underlying 1) 10.5 34.3 120.7 163.4 182.3 EBIT margin (%), underlying 1) 1.7% 6.2% 5.6% 8.5% 7.0%Basic earnings per share (NOK) 0.29 0.93 3.46 4.70 8.15Average number of shares 26 281 729 26 246 442 26 255 365 26 241 979 26 243 164 Net interest bearing debt (negative is asset) 1) 180.3 (74.9) 180.3 (74.9) (116.5)Cash and cash equivalents 156.0 116.8 156.0 116.8 176.0 OPERATIONAL Order intake 795.0 466.1 2 735.6 2 137.6 3 084.7 Order backlog 2 107.9 1 652.0 2 107.9 1 652.0 1 793.1 Billing ratio (%) 66.6% 67.7% 68.3% 69.3% 69.2%Employees 2 845 2 261 2 822 2 261 2 344
1) Refers to page 23 to define underlying financial performance and alternative performance measures
HIGHLIGHTS AND KEY FIGURES Q3 2017MENU:
Front page
Highlights and key figures Q3 2017
Third quarter 2017 Group review
Financial review
Order backlog and intake
Segments
Acquisitions in the period
Organisation and HSE
Subsequent events
Market outlook
Risk and uncertainties
Definitions
Disclaimer
Interim condensed consolidated statement of income
Interim condensed consolidated finacial statements
Interim condensed consolidated statement of comprehensive income
Interim condensed consolidated balance sheet
Interim condensed consolidated statement of changes in equity
Interim condensed consolidated statement of cash flows
Notes to the financial statements
Note 1: General information
Note 2: Basis of preparation and statements
Note 3: Estimates, judgments and assumptions
Note 4: Segments
Note 5: Explanatory comments about the seasonality or cyclicality of interim operations
Note 6: Significant events and transactions
Note 7: Related party transactions
Note 8: Treasury shares
Note 9: Earnings per share
Note 10: Retirement benefit obligations
Note 11: Fair value of financial instruments
Note 12: Business combinations
Alternative performance measures (APMs)
Company contact information
Q3 2017
Click here for A4 print version of this report
Page 3 Screen mode 3 Q3 20172#: Level 2 anchor2#: Level 3 anchor
1: Highlights and key figures Q3 2017
4
THIRD QUARTER 2017 GROUP REVIEW
Multiconsult delivered a third quarter EBIT of NOK 10.5 million, in a quarter that was impacted by a negative calendar effect of one less working day compared to the same period last year. The billing ratio was low at 66.6% reflecting lower project activity and resources allocated to implementation of the new ERP system. Net operating revenues grew by 9.8% to NOK 608.8 million. Order backlog is stable at NOK 2.1 billion. The significant frame agreement for Fornebubanen awarded in September is not yet reflected in the order backlog. Acquisition of Hjellnes Consult and Johs Holt was successfully completed, in line with 3-2-1 GO strategic objectives.
FINANCIAL REVIEW
(Figures in brackets = same period prior year or relevant balance sheet date 2017).
With effect from 1 January 2017, Multiconsult ASA has made a change to the reporting of its business areas. Please see note 4 for further details.
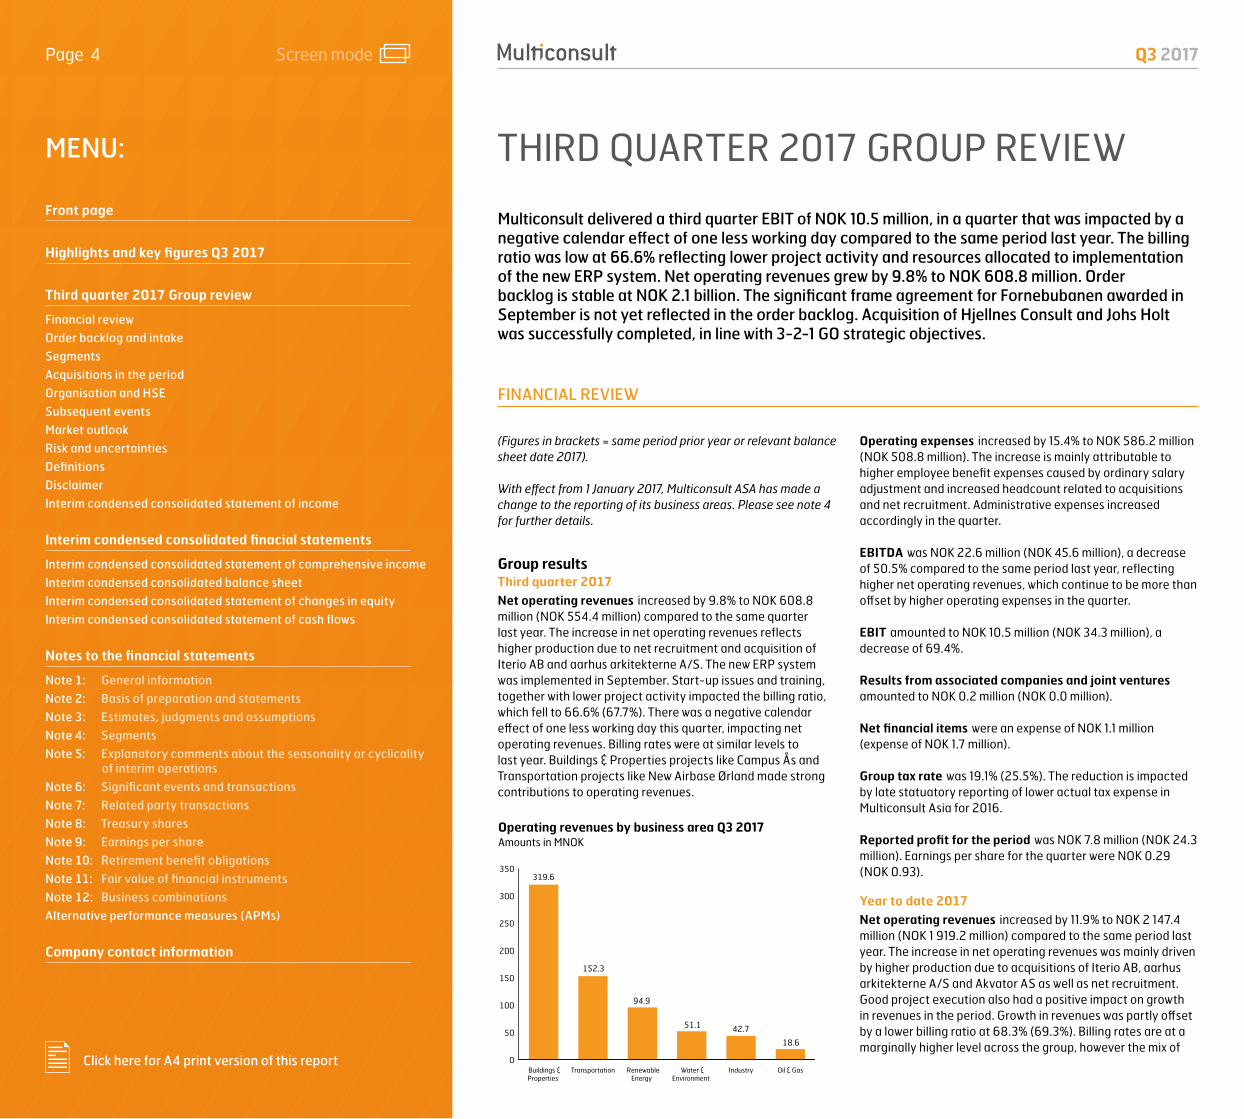
Group resultsThird quarter 2017Net operating revenues increased by 9.8% to NOK 608.8 million (NOK 554.4 million) compared to the same quarter last year. The increase in net operating revenues reflects higher production due to net recruitment and acquisition of Iterio AB and aarhus arkitekterne A/S. The new ERP system was implemented in September. Start-up issues and training, together with lower project activity impacted the billing ratio, which fell to 66.6% (67.7%). There was a negative calendar effect of one less working day this quarter, impacting net operating revenues. Billing rates were at similar levels to last year. Buildings & Properties projects like Campus Ås and Transportation projects like New Airbase Ørland made strong contributions to operating revenues.
Operating revenues by business area Q3 2017Amounts in MNOK
0
50
100
150
200
250
300
350
Oil & Gas Industry Water &Environment
RenewableEnergy
Transportation Buildings &Properties
319.6
152.3
94.9
51.1 42.7
18.6
Operating expenses increased by 15.4% to NOK 586.2 million (NOK 508.8 million). The increase is mainly attributable to higher employee benefit expenses caused by ordinary salary adjustment and increased headcount related to acquisitions and net recruitment. Administrative expenses increased accordingly in the quarter.
EBITDA was NOK 22.6 million (NOK 45.6 million), a decrease of 50.5% compared to the same period last year, reflecting higher net operating revenues, which continue to be more than offset by higher operating expenses in the quarter.
EBIT amounted to NOK 10.5 million (NOK 34.3 million), a decrease of 69.4%.
Results from associated companies and joint ventures amounted to NOK 0.2 million (NOK 0.0 million).
Net financial items were an expense of NOK 1.1 million (expense of NOK 1.7 million).
Group tax rate was 19.1% (25.5%). The reduction is impacted by late statuatory reporting of lower actual tax expense in Multiconsult Asia for 2016.
Reported profit for the period was NOK 7.8 million (NOK 24.3 million). Earnings per share for the quarter were NOK 0.29 (NOK 0.93).
Year to date 2017Net operating revenues increased by 11.9% to NOK 2 147.4 million (NOK 1 919.2 million) compared to the same period last year. The increase in net operating revenues was mainly driven by higher production due to acquisitions of Iterio AB, aarhus arkitekterne A/S and Akvator AS as well as net recruitment. Good project execution also had a positive impact on growth in revenues in the period. Growth in revenues was partly offset by a lower billing ratio at 68.3% (69.3%). Billing rates are at a marginally higher level across the group, however the mix of
MENU:
Front page
Highlights and key figures Q3 2017
Third quarter 2017 Group review
Financial review
Order backlog and intake
Segments
Acquisitions in the period
Organisation and HSE
Subsequent events
Market outlook
Risk and uncertainties
Definitions
Disclaimer
Interim condensed consolidated statement of income
Interim condensed consolidated finacial statements
Interim condensed consolidated statement of comprehensive income
Interim condensed consolidated balance sheet
Interim condensed consolidated statement of changes in equity
Interim condensed consolidated statement of cash flows
Notes to the financial statements
Note 1: General information
Note 2: Basis of preparation and statements
Note 3: Estimates, judgments and assumptions
Note 4: Segments
Note 5: Explanatory comments about the seasonality or cyclicality of interim operations
Note 6: Significant events and transactions
Note 7: Related party transactions
Note 8: Treasury shares
Note 9: Earnings per share
Note 10: Retirement benefit obligations
Note 11: Fair value of financial instruments
Note 12: Business combinations
Alternative performance measures (APMs)
Company contact information
Q3 2017
Click here for A4 print version of this report
Page 4 Screen mode Q3 20174 2#: Level 2 anchor2#: Level 3 anchor
1: Third quarter 2017 Group review

5
Norwegian and international activities results in a reduced average billing rate, partly offsetting growth in revenues.
EBITDA was NOK 155.4 million (NOK 195.8 million), a decrease of 20.6% compared to the same period last year. The higher net operating revenues were more than offset by the increase in operating expenses in the period. Higher employee benefit expenses reflect the impact of ordinary salary adjustment and increased headcount related to acquisitions and net recruitment. Administrative expenses increased accordingly in the period. However, some non-recurring expenses, including implementation of the new ERP system, impacted the period.
EBIT amounted to NOK 120.7 million (NOK 163.4 million), a decrease of 26.1%.
Group tax rate was 23.2% (24.7%). The decrease being mainly related to the reduction in corporate tax rates in Norway to 24% (25%) from 1 January 2017.
Reported profit for the period was NOK 90.8 million (NOK 123.3 million).
Financial position, cash flow and liquidityThird quarter 2017Net cash flow from operating activities was NOK 34.0 million (NOK 44.3 million). The decrease was mainly related to lower net profit that more than offset the decrease in working capital. Working capital decreased by NOK 17.3 million (NOK 0.3 million) due to higher reduction in receivables and work in progress, than in current liabilities.
Net cash flow used in investment activities was NOK 121.5 million this quarter (NOK 7.6 million), mainly related to acquisition of Hjellnes Consult AS and Johs Holt AS. NOK 7.6 million used in the same quarter last year was mainly for ordinary asset replacement.
Net cash flow from financing activities amounted to NOK 88.0 million (negative NOK 45.5 million), due to a higher level of interest bearing debt as a result of the acquisition og Hjellnes Consult AS and Johs Holt AS.
Year to date 2017Net cash flow from operating activities was negative NOK 18.9 million (negative NOK 16.3 million). Lower net profit more than offset lower income tax paid compared to the same period last year. Working capital increased year to date by NOK 132.7 million (NOK 144.1 million) due to higher trade receivables and work in progress as a result of higher production.
Net cash flow used in investment activities was NOK 202.0 million (NOK 48.3 million), mainly related to the acquisition of Iterio AB, Hjellnes Consult AS and Johs Holt AS, as well as ordinary asset replacement.
Net cash flow from financing activities was NOK 196.0 million (negative NOK 44.6 million), reflecting increased interest bearing debt less dividend payment.
Consolidated financial positionAs of 30 September 2017, total assets amounted to NOK 1 662.6 million (NOK 1 587.5 million at 30 June 2017), and total equity amounted to NOK 586.2 million (NOK 516.0 million at 30 June 2017), reflecting the issue of equity in connection with the acquisition of the Hjellnes group.
The group held cash and cash equivalents of NOK 156.0 million as of 30 September 2017 (NOK 157.8 million at 30 June 2017). Interest bearing debt amounted to NOK 336.4 million (NOK 246.8 million at 30 June 2017). Net interest bearing debt amounted to NOK 180.3 million (NOK 89 million at 30 June 2017).
ORDER BACKLOG AND INTAKE
The order backlog is stable at the end of the third quarter and was NOK 2 107.9 million (NOK 1 652.0 million), an increase of 27.6% year on year. The order backlog of the Hjellnes group of NOK 153.4 million is reported as order intake and included in order backlog as of 30 September 2017. Call-offs on frame agreements are only included in the order backlog when signed. This means that the new and significant frame agreement for Fornebubanen with Oslo kommune (municipality of Oslo) for the design of the entire Fornebu metro line is not included in the order backlog.
Order intake during the third quarter increased by 70.5% to NOK 795.0 million (NOK 466.1 million). There were solid sales within Transportation, Water & Environment and Renewable Energy in the quarter. New contribution from sales from
Iterio AB and aarhus arkitekterne A/S impacted the order intake positively in the quarter. There have been many small and mid-size contract awards and the tender pipeline in the transportation sector remains strong.
Among important new contracts this quarter was Multiconsult Polska’s work on the Ełk – Korsze railway line with PKP Polish Railway in Poland, as well as Multiconsult UK’s power utility identification and evaluation with ZESCO, the Zambian national power utility. Important add-ons to existing contracts this quarter were Intercity Haug - Halden and Bergheim healthcare facilities in Norway as well as Mount Coffee in Liberia.
MENU:
Front page
Highlights and key figures Q3 2017
Third quarter 2017 Group review
Financial review
Order backlog and intake
Segments
Acquisitions in the period
Organisation and HSE
Subsequent events
Market outlook
Risk and uncertainties
Definitions
Disclaimer
Interim condensed consolidated statement of income
Interim condensed consolidated finacial statements
Interim condensed consolidated statement of comprehensive income
Interim condensed consolidated balance sheet
Interim condensed consolidated statement of changes in equity
Interim condensed consolidated statement of cash flows
Notes to the financial statements
Note 1: General information
Note 2: Basis of preparation and statements
Note 3: Estimates, judgments and assumptions
Note 4: Segments
Note 5: Explanatory comments about the seasonality or cyclicality of interim operations
Note 6: Significant events and transactions
Note 7: Related party transactions
Note 8: Treasury shares
Note 9: Earnings per share
Note 10: Retirement benefit obligations
Note 11: Fair value of financial instruments
Note 12: Business combinations
Alternative performance measures (APMs)
Company contact information
Q3 2017
Click here for A4 print version of this report
Page 5 Screen mode 5 Q3 20171: Level 1 anchor2#: Level 2 anchor2#: Level 3 anchor

6
SEGMENTS
Multiconsult is organised in three geographical segments, Greater Oslo Area, Regions Norway, International, and a segment for LINK arkitektur.
Greater Oslo AreaThe segment offers services in six business areas and comprises the central area of eastern Norway, with regional offices in Oslo, Fredrikstad and Drammen.
Key figures Greater Oslo Area
Amounts in MNOKQ3
2017Q3
2016YTD
2017YTD
2016
Net op. revenues 255.6 256.7 914.5 882.9EBITDA 8.7 26.3 75.5 120.3EBITDA% 3.4% 10.3% 8.3% 13.6%Order intake 345.2 173.1 1 142.9 916.4Order Backlog 831.6 758.3 831.6 758.3Billing ratio 64.5% 68.1% 67.2% 70.9%Employees 1 187 881 1 187 881
Third quarter 2017Net operating revenues decreased by 0.4% to NOK 255.6 million (NOK 256.7 million) compared to the same quarter last year. The decrease was mainly driven by the lower billing ratio, which fell to 64.5% (68.1%) as well as the negative calendar effect of one less working day in the quarter. The significant decrease in billing ratio is mainly caused by implementation of the new ERP system and lower project activity especially within Oil & Gas. The decrease in revenues was partly offset by the impact of net recruitment. The billing rates continued to improve this quarter.
EBITDA amounted to NOK 8.7 million (NOK 26.3 million), a decrease of 67.1% from last year. Lower revenues and higher employee benefit expenses, as a result of net recruitment and ordinary salary adjustment as well as increased administrative expenses, contributed to the decrease in EBITDA.
Order intake in the third quarter was NOK 345.2 million (NOK 173.1 million), an increase of 99.5% compared to the same quarter last year. The order backlog of the Hjellnes group of NOK 153.4 million is reported as order intake and included in order backlog as of 30 September 2017. Renewable Energy and Water & Environment had a strong contribution in the quarter. The new significant frame agreement award for Fornebubanen in the quarter has not yet contributed. Important add-ons to existing contracts this quarter were Intercity Fredrikstad – Sarpsborg and Bergheim health facilities in Norway as well as Mount Coffee in Liberia. New contracts, such as the E18 Kjørholt and Bamble tunnels, were also awarded in the quarter. Order backlog for the segment at the end of the third quarter amounted to NOK 831.6 million (NOK 758.3 million), up 9.7% year on year.
Year to date 2017Net operating revenues increased by 3.6% to NOK 914.5 million (NOK 882.9 million), mainly due to higher production as a result of net recruitment. Good project execution resulted in net project write-ups and impacted net operating revenues positively. Billing rates have had a modest increase year to date 2017 and further support growth in revenues. The billing ratio decreased to 67.2% (70.9%) and partly offset the growth in revenues.
EBITDA amounted to NOK 75.5 million (NOK 120.3 million), a decrease of 37.3%. The increased revenues were more than offsetby higher employee benefit expenses. Net recruitment, ordinary salary adjustment and related administrative expenses contributed to the decrease in EBITDA.
Order intake amounted to NOK 1 142.9 million (NOK 916.4), an increase of 24.7% from last year. The order backlog of the Hjellnes group of NOK 153.4 million is reported as order intake and included in order backlog as of 30 September 2017.
Regions NorwayThe segment offers services in six business areas and comprises regional offices in Kristiansand, Stavanger, Bergen, Trondheim and Tromsø.
Key figures Regions Norway
Amounts in MNOKQ3
2017Q3
2016YTD
2017YTD
2016
Net op. revenues 215.8 208.0 765.8 710.2EBITDA 7.2 12.7 48.3 60.4EBITDA% 3.3% 6.1% 6.3% 8.5%Order intake 152.3 204.1 707.2 795.4Order Backlog 422.8 511.1 422.8 511.1Billing ratio 66.1% 67.3% 67.3% 68.7%Employees 842 792 842 792
Third quarter 2017Net operating revenues amounted to NOK 215.8 million (NOK 208.0 million), an increase of 3.7% compared to the same quarter last year. The growth was mainly driven by higher production due to net recruitment. Growth in net operating revenues was partly offset by a negative calendar effect of one less working day in the quarter and a decrease in the billing ratio to 66.1% (67.3%). The decrease in billing ratio is mainly caused by the implementation of new ERP system and lower project activity. Billing rates were stable in the quarter.
EBITDA was NOK 7.2 million (NOK 12.7 million), a decrease of 43.6%. The increase in net operating revenues was more than offset by higher operating expenses, such as ordinary salary adjustment, increased office rent and other administrative expenses.
MENU:
Front page
Highlights and key figures Q3 2017
Third quarter 2017 Group review
Financial review
Order backlog and intake
Segments
Acquisitions in the period
Organisation and HSE
Subsequent events
Market outlook
Risk and uncertainties
Definitions
Disclaimer
Interim condensed consolidated statement of income
Interim condensed consolidated finacial statements
Interim condensed consolidated statement of comprehensive income
Interim condensed consolidated balance sheet
Interim condensed consolidated statement of changes in equity
Interim condensed consolidated statement of cash flows
Notes to the financial statements
Note 1: General information
Note 2: Basis of preparation and statements
Note 3: Estimates, judgments and assumptions
Note 4: Segments
Note 5: Explanatory comments about the seasonality or cyclicality of interim operations
Note 6: Significant events and transactions
Note 7: Related party transactions
Note 8: Treasury shares
Note 9: Earnings per share
Note 10: Retirement benefit obligations
Note 11: Fair value of financial instruments
Note 12: Business combinations
Alternative performance measures (APMs)
Company contact information
Q3 2017
Click here for A4 print version of this report
Page 6 Screen mode Q3 20176 1: Level 1 anchor2#: Level 2 anchor2#: Level 3 anchor

7
Order intake in the third quarter was NOK 152.3 million (NOK 204.1 million), a decrease of 25.4% compared to the same quarter last year. There was lower order intake in Transportation and Buildings & Properties in the quarter, however, Water & Environment contributed positively. Among new contracts this quarter were call-offs on Mongstad frame agreement with Statoil.
Order backlog for the segment at the end of the third quarter amounted to NOK 422.8 million (NOK 511.1 million), down 17.3% year on year.
Year to date 2017Net operating revenues increased by 7.8% to NOK 765.8 million (NOK 710.2 million), mainly due to higher production due to acquisitions and net recruitment. Akvator AS contributed with a full nine months of the period compared to only four months last year. Growth in revenues was further supported by higher billing rates. The billing ratio decreased to 67.3% (68.7%) and partly offset growth in revenues.
EBITDA amounted to NOK 48.3 million (NOK 60.4 million), a decrease of 20.0%, mainly due to higher operating expenses, related to ordinary salary adjustments, office rent and other administrative expenses.
Order intake amounted to NOK 707.2 million (NOK 795.4), a decrease of 11.1% from last year.
InternationalThe international segment comprises the subsidiaries Multi-consult UK, Multiconsult Asia, Multiconsult Polska and Iterio AB.
Key figures International
Amounts in MNOKQ3
2017Q3
2016YTD
2017YTD
2016
Net op. revenues 37.8 22.4 130.6 66.2EBITDA 1.6 3.9 18.6 6.3EBITDA% 4.3% 17.5% 14.2% 9.5%Order intake 105.6 20.2 331.6 85.8Order Backlog 347.5 163.6 347.5 163.6Billing ratio 70.8% 67.7% 72.1% 63.2%Employees 205 124 205 124
Third quarter 2017Net operating revenues amounted to NOK 37.8 million (NOK 22.4 million), an increase of 69.1% compared to the same quarter last year. The increase in net operating revenues in the quarter is mainly due to contribution from the acquisition of Iterio AB.
EBITDA was NOK 1.6 million (NOK 3.9 million), a decrease of 58.7% in the quarter. Multiconsult UK, together with Multiconsult Polska and Iterio AB contributed positively in the quarter, while Multiconsult Asia was negatively impacted by low project activity.
Order intake in the third quarter was NOK 105.6 million (NOK 20.2 million), an increase of 422.7% compared to the same quarter last year. Main contribution to the order intake in the third quarter came from Multiconsult UK, within Renewable Energy, as well as within Transportation in Multiconsult Polska and Iterio AB.
Order backlog for the segment at the end of the third quarter amounted to NOK 347.5 million (NOK 163.6 million), up 112.4% year on year.
Year to date 2017Net operating revenues amounted to NOK 130.6 million (NOK 66.2 million), an increase of 97.1% compared to the same period last year. The growth in net operating revenues is mainly attributed to the contribution from Iterio AB as well as high short-term project activity supported by temporary staffing in Multiconsult Asia in the first quarter this year. The growth was further supported by increased production in Multiconsult UK and Multiconsult Polska.
EBITDA was NOK 18.6 million (NOK 6.3 million) for the period, reflecting increased activity in all subsidiaries as well as contribution from the acquisition of Iterio AB.
Order intake amounted to NOK 331.6 million (NOK 85.8 million), an increase of 286.4% from last year, reflecting the acquisition of Iterio AB in the first quarter 2017 and strong order intake in the third quarter 2017.
LINK arkitekturThis segment comprises LINK arkitektur with its 15 offices throughout Scandinavia.
Key figures LINK arkitektur
Amounts in MNOKQ3
2017Q3
2016YTD
2017YTD
2016
Net op. revenues 106.0 69.1 345.2 252.8EBITDA 5.7 3.6 15.8 9.4EBITDA% 5.4% 5.2% 4.6% 3.7%Order intake 191.4 68.8 549.6 339.9Order Backlog 506.0 219.0 506.0 219.0Billing ratio 70.3% 68.5% 71.4% 69.9%Employees 476 343 476 343
Third quarter 2017Net operating revenues amounted to NOK 106.0 million (NOK 69.2 million), an increase of 53.3% compared to the same quarter last year. The growth was mainly driven by higher production from net recruitment as well as contribution from the acquired aarhus arkitekterne A/S. Working hours were increased from 37.5 to 40.0 hours per week for all employees in Norway starting 1 October 2016 and contributed positively to the growth year on year. Growth in net operating revenues was partly offset by a negative calendar effect of one less working day compared to the same quarter last year.
MENU:
Front page
Highlights and key figures Q3 2017
Third quarter 2017 Group review
Financial review
Order backlog and intake
Segments
Acquisitions in the period
Organisation and HSE
Subsequent events
Market outlook
Risk and uncertainties
Definitions
Disclaimer
Interim condensed consolidated statement of income
Interim condensed consolidated finacial statements
Interim condensed consolidated statement of comprehensive income
Interim condensed consolidated balance sheet
Interim condensed consolidated statement of changes in equity
Interim condensed consolidated statement of cash flows
Notes to the financial statements
Note 1: General information
Note 2: Basis of preparation and statements
Note 3: Estimates, judgments and assumptions
Note 4: Segments
Note 5: Explanatory comments about the seasonality or cyclicality of interim operations
Note 6: Significant events and transactions
Note 7: Related party transactions
Note 8: Treasury shares
Note 9: Earnings per share
Note 10: Retirement benefit obligations
Note 11: Fair value of financial instruments
Note 12: Business combinations
Alternative performance measures (APMs)
Company contact information
Q3 2017
Click here for A4 print version of this report
Page 7 Screen mode 7 Q3 20171: Level 1 anchor2#: Level 2 anchor2#: Level 3 anchor
8
EBITDA amounted to NOK 5.7 million (NOK 3.6 million) in the third quarter. Improved net operating revenues were partly offset by higher employee benefit expenses as a result of acquisitions and net recruitment.
Order intake in the third quarter was NOK 191.4 million (NOK 68.8 million), an increase of 178.4% compared to the same quarter last year. The majority of the order intake in the quarter came from a substantial amount of smaller, but important new contracts and add-ons to existing contracts. LINK Sweden contributed with strong order intake in the third quarter. Among important new contracts this quarter were the Våberg student housing project with ELSA Förvaltnings AB outside Stockholm, Sweden, and Roligheden high school in Arendal, Norway, with BRG Entreprenør AS.
Order backlog for the segment at the end of the third quarter amounted to NOK 506.0 million (NOK 219.0 million), an increase of 131.1% compared to the same quarter last year.
Year to date 2017Net operating revenues amounted to NOK 345.2 million (NOK 252.8 million), an increase of 36.6% compared to the same period last year, mainly due to higher production from net recruitment and contribution from aarhus arkitekterne A/S.
EBITDA amounted to NOK 15.8 million (NOK 9.4 million) in the period, an increase of 69.9%. Improved net operating revenues were partly offset by higher employee benefit expenses as a result of acquisitions and net recruitment.
Order intake was NOK 549.6 million (NOK 339.9 million), an increase of 61.7%.
ACQUISITIONS IN THE PERIOD
On 25 September 2017, the acquisition of the Hjellnes group was successfully completed. As part of the completion procedure Multiconsult ASA has paid NOK 184 million to the sellers for 100% of the shares in Hjellnes Consult AS and Johs
Holt AS. The settlement is a combination of NOK 119 million in cash and NOK 65 million in Multiconsult shares. For more information please see note 12.
ORGANISATION AND HSE
At 30 September 2017 the group had 2 845 employees. The turnover ratio for the group was stable at 6.4% for the period September 2016 to September 2017.
Multiconsult has adopted HSE policies and implemented guidelines to ensure continued compliance with applicable regulations and to maintain and develop its HSE standards. The company’s HSE efforts are managed on both central and regional levels.
Recorded sick leave ratio (parent company) was 3.7% for the quarter (3.6%). Sick leave for the group in the third quarter was 2.9%.
Number of employees
0
500
1 000
1 500
2 000
2 500
3 000
30.09.201730.09.2016
2 261
2 845
SUBSEQUENT EVENTS
On 7 November 2017, Multiconsult was awarded a contract with Statoil ASA for Northern Lights – Site preparation and Marine structures. The value of the contract is approximately NOK 24 million for Multiconsult ASA and work will begin immediately. Multiconsult will perform the site preparation design and
marine structures design for the Northern Lights Onshore Facility Terminal. The Scope of Services include Concept, FEED, Detailed engineering and follow up phases. The contract award is subject to standstill period, which expires on 13 November 2017.
MENU:
Front page
Highlights and key figures Q3 2017
Third quarter 2017 Group review
Financial review
Order backlog and intake
Segments
Acquisitions in the period
Organisation and HSE
Subsequent events
Market outlook
Risk and uncertainties
Definitions
Disclaimer
Interim condensed consolidated statement of income
Interim condensed consolidated finacial statements
Interim condensed consolidated statement of comprehensive income
Interim condensed consolidated balance sheet
Interim condensed consolidated statement of changes in equity
Interim condensed consolidated statement of cash flows
Notes to the financial statements
Note 1: General information
Note 2: Basis of preparation and statements
Note 3: Estimates, judgments and assumptions
Note 4: Segments
Note 5: Explanatory comments about the seasonality or cyclicality of interim operations
Note 6: Significant events and transactions
Note 7: Related party transactions
Note 8: Treasury shares
Note 9: Earnings per share
Note 10: Retirement benefit obligations
Note 11: Fair value of financial instruments
Note 12: Business combinations
Alternative performance measures (APMs)
Company contact information
Q3 2017
Click here for A4 print version of this report
Page 8 Screen mode Q3 20178 1: Level 1 anchor2#: Level 2 anchor2#: Level 3 anchor

9
MARKET OUTLOOK
The overall market outlook for remains fairly positive.
Buildings & Properties is expected to maintain stable growth although there is some uncertainty in the residential market. The outlook for the architecture market shows signs of positive development especially within healthcare buildings, but continues to be impacted by regional variations. Public sector investment is driving a strong outlook for Transportation within road and rail and several large projects are expected to be assigned in the coming year. The Renewable Energy market in Norway is expected to be stable, with expected growth within transmission. International Renewable Energy markets continue to grow, providing new business opportunities for Multiconsult. Investments in the Industry segment are expected to be slightly lower due to completion of several major projects, while investments in metals and chemical industry are expected to be higher. Investment in aquaculture remains strong. Demand for our services in the Oil & Gas market is expected to slowly improve going forward, particularly in international markets. Within Water & Environment there is a stable demand for water and waste infrastructure projects as well as for soil contamination inspections.
The overall competitive landscape is migrating towards more Engineering, Procurement and Construction (EPC) contracts.
Continued strong competition is maintaining price pressure on large projects in Norway. Current market rates have stabilised, however the cost level for the Norwegian workforce is creating challenges to profitability for the industry in general.
Multiconsult’s strong market position, flexible business model and wide service offering provides a sound base for further growth, both domestic and international. Resources from Multiconsult Polska are planned to gradually be phased into ongoing projects to strengthen competitiveness. The top line synergies between Multiconsult and LINK arkitektur are expected to continue to further strengthen the group’s value proposition to customers. The integration of Hjellnes group into the Greater Oslo area segment is underway and is expected to provide both topline and efficiency synergies going forward.
The order backlog is stable and provides a strong foundation for continued growth, supported by valuable frame agreements generated from a broad and robust customer base.
Multiconsult will work to intensify its efforts on sales activity, billing ratio improvement, strong project execution and efficiency throughout the organisation to improve profitability and secure profitable growth.
RISK AND UNCERTAINTIES
The risk of disagreements and legal disputes related to the possible cost of delays and project errors is always present in the consultancy business. Multiconsult has good insurance policies and routines for following up such cases. Further details regarding the insurance coverage are provided in note 19 to the consolidated financial statements for 2016.
Multiconsult is exposed to credit risk, primarily related to transactions with clients and from bank deposits. The company’s losses on accounts receivable have historically been modest. New customers are subject to credit assessment and approval before credit is extended to them. Responsibility for credit management in the parent company is centralised, and routines are integrated in the group’s quality assurance system. The company has established routines for assessing the creditworthiness of the customer, and the possible need for bank guarantees or other risk mitigation measures.
The group is exposed to currency risk through ongoing projects abroad with fees in foreign currencies. Hedging contracts
have been entered into for certain projects to reduce this risk. Currency risk is regarded as modest.
In the third quarter 2017, Multiconsult ASA increased its debt and restructured its credit facilities in connection with the acquision of the Hjellnes group. Multiconsult ASA entered into a loan agreement with Nordea for NOK 215.0 million, which was used to pay the cash settlement of NOK 119.0 million to the selling shareholders in the Hjellnes Group as well as to pay down the previously drawn Multiconsult ASA revolving credit facility of NOK 95 million. Interest swaps have been entered into to ensure approximately 50% of interest cost at fixed rates.
The parent company has an overdraft facility of 220.0 million and an additional revolving credit facility of NOK 95.0 million with the parent company’s core bank. The revolving credit facility was undrawn at 30 September 2017.
MENU:
Front page
Highlights and key figures Q3 2017
Third quarter 2017 Group review
Financial review
Order backlog and intake
Segments
Acquisitions in the period
Organisation and HSE
Subsequent events
Market outlook
Risk and uncertainties
Definitions
Disclaimer
Interim condensed consolidated statement of income
Interim condensed consolidated finacial statements
Interim condensed consolidated statement of comprehensive income
Interim condensed consolidated balance sheet
Interim condensed consolidated statement of changes in equity
Interim condensed consolidated statement of cash flows
Notes to the financial statements
Note 1: General information
Note 2: Basis of preparation and statements
Note 3: Estimates, judgments and assumptions
Note 4: Segments
Note 5: Explanatory comments about the seasonality or cyclicality of interim operations
Note 6: Significant events and transactions
Note 7: Related party transactions
Note 8: Treasury shares
Note 9: Earnings per share
Note 10: Retirement benefit obligations
Note 11: Fair value of financial instruments
Note 12: Business combinations
Alternative performance measures (APMs)
Company contact information
Q3 2017
Click here for A4 print version of this report
Page 9 Screen mode 9 Q3 20171: Level 1 anchor2#: Level 2 anchor2#: Level 3 anchor

10
DEFINITIONS
Net operating revenues: Operating revenues less sub consultants and disbursements.
EBIT: Earnings before net financial items, results from associates and joint ventures and income tax.
EBIT margin (%): EBIT as a percentage of net operating revenues.
EBITDA: EBIT before depreciation, amortisation and impairment.
EBITDA margin (%): EBITDA as a percentage of net operating revenues.
Operating expenses: Employee benefit expenses plus other operating expenses.
Net interest bearing debt: Non-current and current interest bearing liabilities deducted cash and cash equivalents.
Order intake: Expected operating revenues on new contracts and confirmed changes to existing contracts. Only group external contracts are included.
Order Backlog: Expected remaining operating revenues on new and existing contracts. Only group external contracts are included. Call-offs on frame agreements are included in the order backlog when signed.
Billing ratio (%): Hours recorded on chargeable projects as a percentage of total hours worked (including administrative staff) and employer-paid absence. Billing ratio per segment includes allocated administrative staff.
Employees: Number of employees comprise all staff on payroll including staff on temporarily leave (paid and unpaid), excluding temporary personnel.
DISCLAIMER
This report includes forward-looking statements, which are based on our current expectations and projections about future events. All statements other than statements of historical facts included in this notice, including statements regarding our future financial position, risks and uncertainties related to our business, strategy, capital expenditures, projected costs and our plans and objectives for future operations, including our plans for future costs savings and synergies may be deemed to be forward-looking statements. Words such as “believe,” “expect,” “anticipate,” “may,” “assume,” “plan,” “intend,” “will,” “should,” “estimate,” “risk”
and similar expressions or the negatives of these expressions are intended to identify forward-looking statements. By their nature, forward-looking statements involve known and unknown risks and uncertainties because they relate to events and depend on circumstances that may or may not occur in the future. Forward-looking statements are not guarantees of future performance. You should not place undue reliance on these forward-looking statements. In addition, any forward-looking statements are made only as of the date of this notice, and we do not intend and do not assume any obligation to update any statements set forth in this notice.
MENU:
Front page
Highlights and key figures Q3 2017
Third quarter 2017 Group review
Financial review
Order backlog and intake
Segments
Acquisitions in the period
Organisation and HSE
Subsequent events
Market outlook
Risk and uncertainties
Definitions
Disclaimer
Interim condensed consolidated statement of income
Interim condensed consolidated finacial statements
Interim condensed consolidated statement of comprehensive income
Interim condensed consolidated balance sheet
Interim condensed consolidated statement of changes in equity
Interim condensed consolidated statement of cash flows
Notes to the financial statements
Note 1: General information
Note 2: Basis of preparation and statements
Note 3: Estimates, judgments and assumptions
Note 4: Segments
Note 5: Explanatory comments about the seasonality or cyclicality of interim operations
Note 6: Significant events and transactions
Note 7: Related party transactions
Note 8: Treasury shares
Note 9: Earnings per share
Note 10: Retirement benefit obligations
Note 11: Fair value of financial instruments
Note 12: Business combinations
Alternative performance measures (APMs)
Company contact information
Q3 2017
Click here for A4 print version of this report
Page 10 Screen mode Q3 201710 1: Level 1 anchor2#: Level 2 anchor2#: Level 3 anchor
11
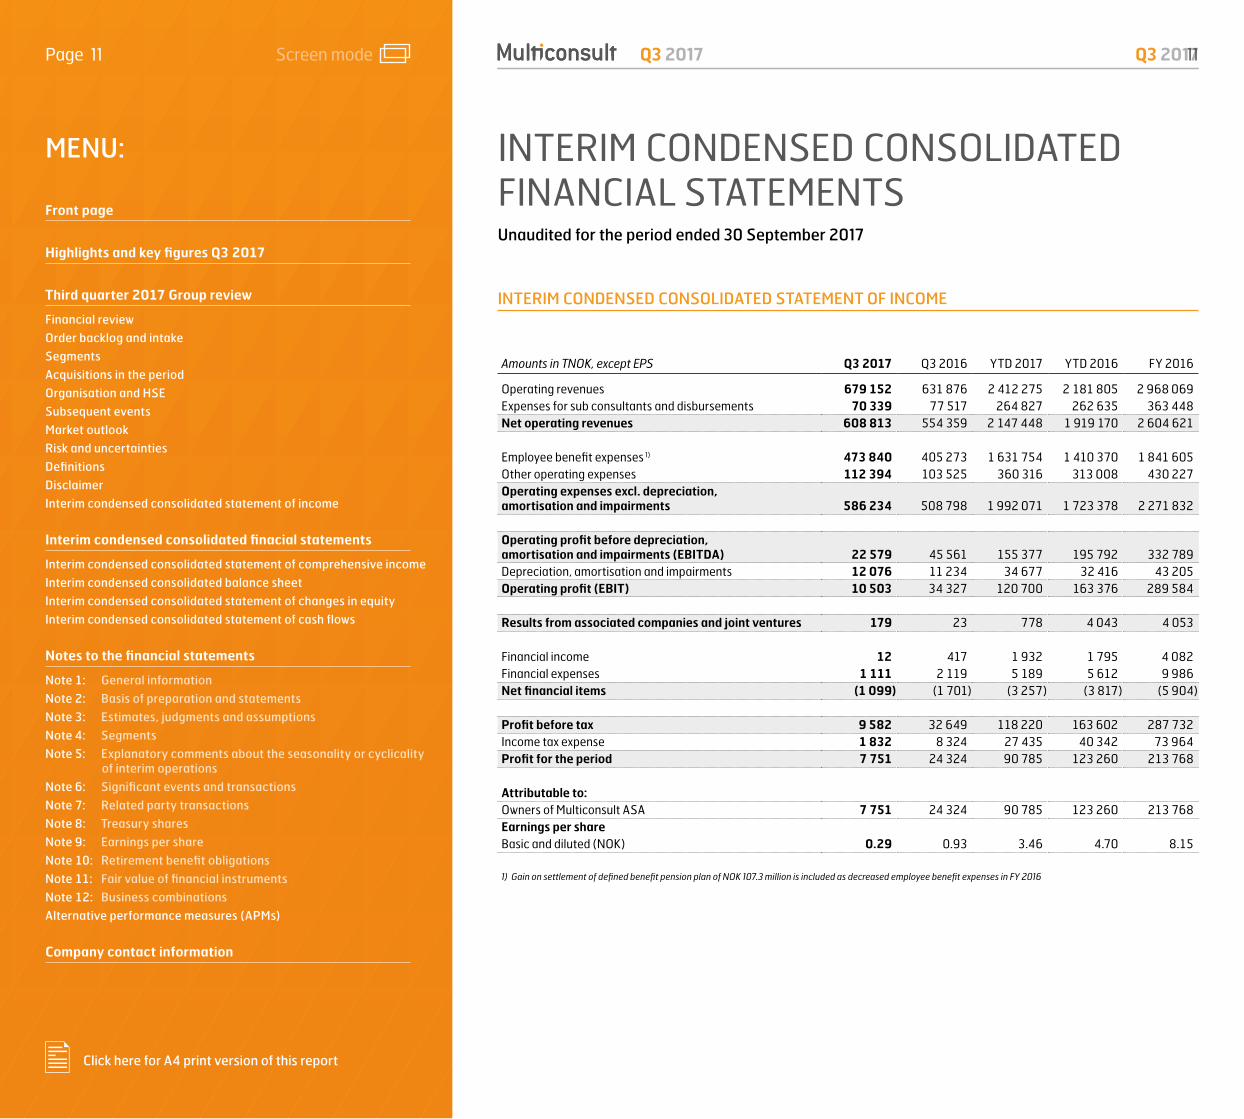
INTERIM CONDENSED CONSOLIDATED FINANCIAL STATEMENTS Unaudited for the period ended 30 September 2017
INTERIM CONDENSED CONSOLIDATED STATEMENT OF INCOME
Amounts in TNOK, except EPS Q3 2017 Q3 2016 YTD 2017 YTD 2016 FY 2016
Operating revenues 679 152 631 876 2 412 275 2 181 805 2 968 069 Expenses for sub consultants and disbursements 70 339 77 517 264 827 262 635 363 448 Net operating revenues 608 813 554 359 2 147 448 1 919 170 2 604 621 Employee benefit expenses 1) 473 840 405 273 1 631 754 1 410 370 1 841 605 Other operating expenses 112 394 103 525 360 316 313 008 430 227 Operating expenses excl. depreciation, amortisation and impairments 586 234 508 798 1 992 071 1 723 378 2 271 832 Operating profit before depreciation, amortisation and impairments (EBITDA) 22 579 45 561 155 377 195 792 332 789 Depreciation, amortisation and impairments 12 076 11 234 34 677 32 416 43 205 Operating profit (EBIT) 10 503 34 327 120 700 163 376 289 584 Results from associated companies and joint ventures 179 23 778 4 043 4 053 Financial income 12 417 1 932 1 795 4 082 Financial expenses 1 111 2 119 5 189 5 612 9 986 Net financial items (1 099) (1 701) (3 257) (3 817) (5 904) Profit before tax 9 582 32 649 118 220 163 602 287 732 Income tax expense 1 832 8 324 27 435 40 342 73 964 Profit for the period 7 751 24 324 90 785 123 260 213 768
Attributable to: Owners of Multiconsult ASA 7 751 24 324 90 785 123 260 213 768 Earnings per share Basic and diluted (NOK) 0.29 0.93 3.46 4.70 8.15
1) Gain on settlement of defined benefit pension plan of NOK 107.3 million is included as decreased employee benefit expenses in FY 2016
MENU:
Front page
Highlights and key figures Q3 2017
Third quarter 2017 Group review
Financial review
Order backlog and intake
Segments
Acquisitions in the period
Organisation and HSE
Subsequent events
Market outlook
Risk and uncertainties
Definitions
Disclaimer
Interim condensed consolidated statement of income
Interim condensed consolidated finacial statements
Interim condensed consolidated statement of comprehensive income
Interim condensed consolidated balance sheet
Interim condensed consolidated statement of changes in equity
Interim condensed consolidated statement of cash flows
Notes to the financial statements
Note 1: General information
Note 2: Basis of preparation and statements
Note 3: Estimates, judgments and assumptions
Note 4: Segments
Note 5: Explanatory comments about the seasonality or cyclicality of interim operations
Note 6: Significant events and transactions
Note 7: Related party transactions
Note 8: Treasury shares
Note 9: Earnings per share
Note 10: Retirement benefit obligations
Note 11: Fair value of financial instruments
Note 12: Business combinations
Alternative performance measures (APMs)
Company contact information
Q3 2017
Click here for A4 print version of this report
Page 11 Screen mode 11 Q3 20172#: Level 2 anchor2#: Level 3 anchor

12
INTERIM CONDENSED CONSOLIDATED STATEMENT OF COMPREHENSIVE INCOME
Amounts in TNOK Q3 2017 Q3 2016 YTD 2017 YTD 2016 FY 2016
Profit for the period 7 751 24 324 90 785 123 260 213 768
Other comprehensive income Remeasurment of defined benefit obligations - 28 815 - (44 524) 37 923Tax - (7 204) - 11 131 (9 471) Total items that will not be reclassified to profit or loss - 21 611 - (33 393) 28 452Currency translation differences (811) 419 3 854 (3 151) (4 187)Total items that may be reclassified subsequently to profit or loss (811) 419 3 854 (3 151) (4 187)Total other comprehensive income for the period (811) 22 030 3 854 (36 544) 24 265Total comprehensive income for the period 6 940 46 354 94 639 86 716 238 033
Attributable to:Owners of Multiconsult ASA 6 940 46 354 94 639 86 716 238 033
MENU:
Front page
Highlights and key figures Q3 2017
Third quarter 2017 Group review
Financial review
Order backlog and intake
Segments
Acquisitions in the period
Organisation and HSE
Subsequent events
Market outlook
Risk and uncertainties
Definitions
Disclaimer
Interim condensed consolidated statement of income
Interim condensed consolidated finacial statements
Interim condensed consolidated statement of comprehensive income
Interim condensed consolidated balance sheet
Interim condensed consolidated statement of changes in equity
Interim condensed consolidated statement of cash flows
Notes to the financial statements
Note 1: General information
Note 2: Basis of preparation and statements
Note 3: Estimates, judgments and assumptions
Note 4: Segments
Note 5: Explanatory comments about the seasonality or cyclicality of interim operations
Note 6: Significant events and transactions
Note 7: Related party transactions
Note 8: Treasury shares
Note 9: Earnings per share
Note 10: Retirement benefit obligations
Note 11: Fair value of financial instruments
Note 12: Business combinations
Alternative performance measures (APMs)
Company contact information
Q3 2017
Click here for A4 print version of this report
Page 12 Screen mode Q3 201712 2#: Level 2 anchor2#: Level 3 anchor
1: Interim condensed consolidated finacial statements
13
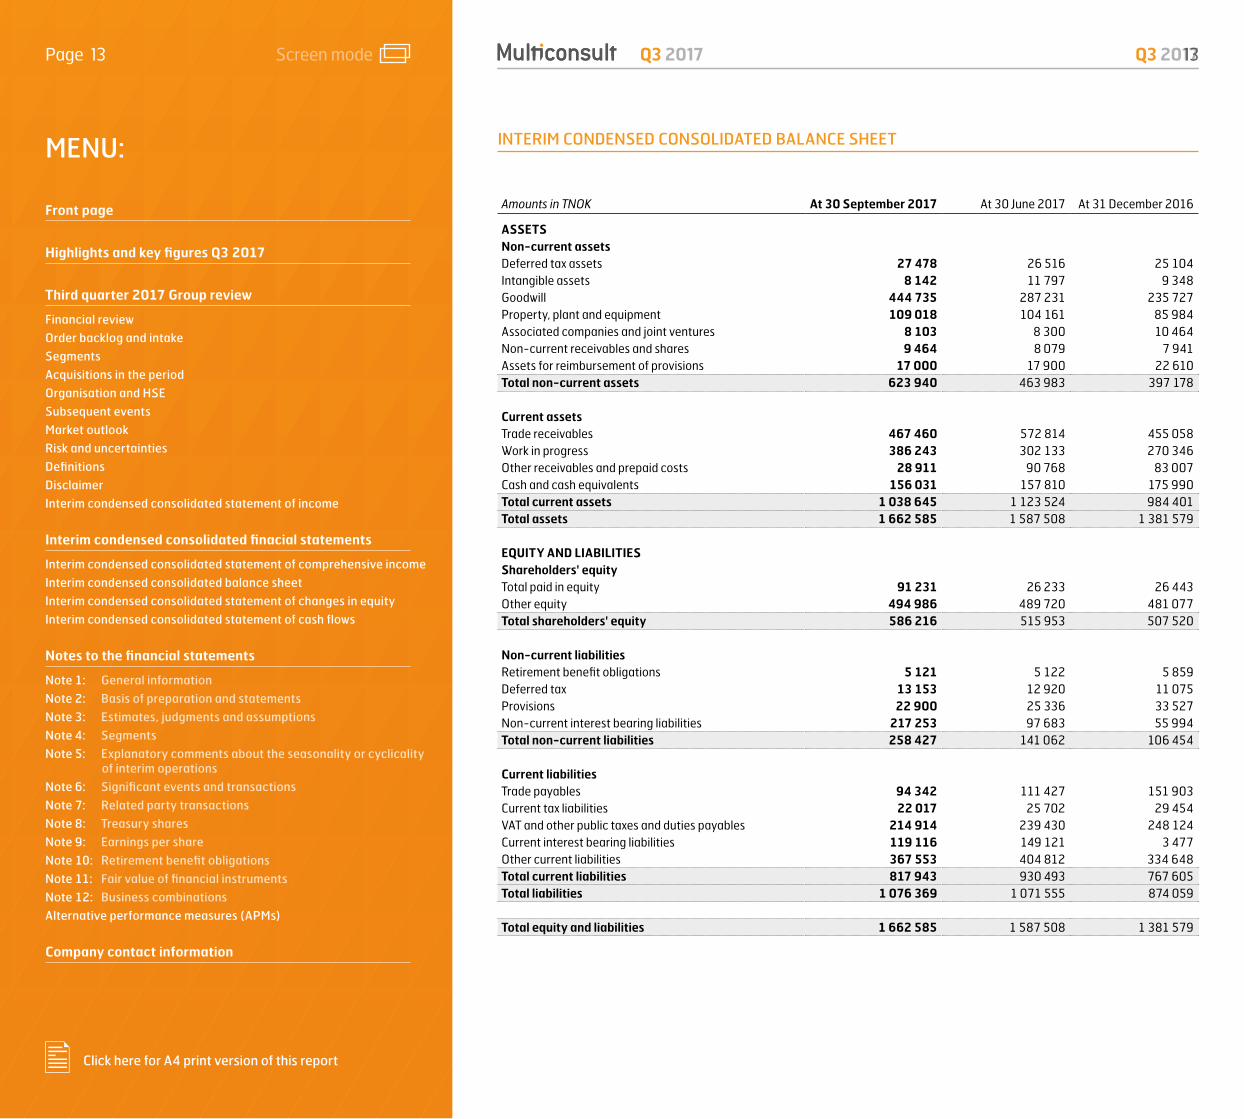
INTERIM CONDENSED CONSOLIDATED BALANCE SHEET
Amounts in TNOK At 30 September 2017 At 30 June 2017 At 31 December 2016
ASSETS Non-current assets Deferred tax assets 27 478 26 516 25 104Intangible assets 8 142 11 797 9 348Goodwill 444 735 287 231 235 727Property, plant and equipment 109 018 104 161 85 984Associated companies and joint ventures 8 103 8 300 10 464Non-current receivables and shares 9 464 8 079 7 941Assets for reimbursement of provisions 17 000 17 900 22 610Total non-current assets 623 940 463 983 397 178
Current assets Trade receivables 467 460 572 814 455 058Work in progress 386 243 302 133 270 346Other receivables and prepaid costs 28 911 90 768 83 007Cash and cash equivalents 156 031 157 810 175 990Total current assets 1 038 645 1 123 524 984 401Total assets 1 662 585 1 587 508 1 381 579 EQUITY AND LIABILITIES Shareholders' equity Total paid in equity 91 231 26 233 26 443Other equity 494 986 489 720 481 077Total shareholders' equity 586 216 515 953 507 520 Non-current liabilities Retirement benefit obligations 5 121 5 122 5 859Deferred tax 13 153 12 920 11 075Provisions 22 900 25 336 33 527Non-current interest bearing liabilities 217 253 97 683 55 994Total non-current liabilities 258 427 141 062 106 454 Current liabilities Trade payables 94 342 111 427 151 903Current tax liabilities 22 017 25 702 29 454VAT and other public taxes and duties payables 214 914 239 430 248 124Current interest bearing liabilities 119 116 149 121 3 477Other current liabilities 367 553 404 812 334 648Total current liabilities 817 943 930 493 767 605Total liabilities 1 076 369 1 071 555 874 059 Total equity and liabilities 1 662 585 1 587 508 1 381 579
MENU:
Front page
Highlights and key figures Q3 2017
Third quarter 2017 Group review
Financial review
Order backlog and intake
Segments
Acquisitions in the period
Organisation and HSE
Subsequent events
Market outlook
Risk and uncertainties
Definitions
Disclaimer
Interim condensed consolidated statement of income
Interim condensed consolidated finacial statements
Interim condensed consolidated statement of comprehensive income
Interim condensed consolidated balance sheet
Interim condensed consolidated statement of changes in equity
Interim condensed consolidated statement of cash flows
Notes to the financial statements
Note 1: General information
Note 2: Basis of preparation and statements
Note 3: Estimates, judgments and assumptions
Note 4: Segments
Note 5: Explanatory comments about the seasonality or cyclicality of interim operations
Note 6: Significant events and transactions
Note 7: Related party transactions
Note 8: Treasury shares
Note 9: Earnings per share
Note 10: Retirement benefit obligations
Note 11: Fair value of financial instruments
Note 12: Business combinations
Alternative performance measures (APMs)
Company contact information
Q3 2017
Click here for A4 print version of this report
Page 13 Screen mode 13 Q3 20171: Level 1 anchor2#: Level 2 anchor2#: Level 3 anchor
14
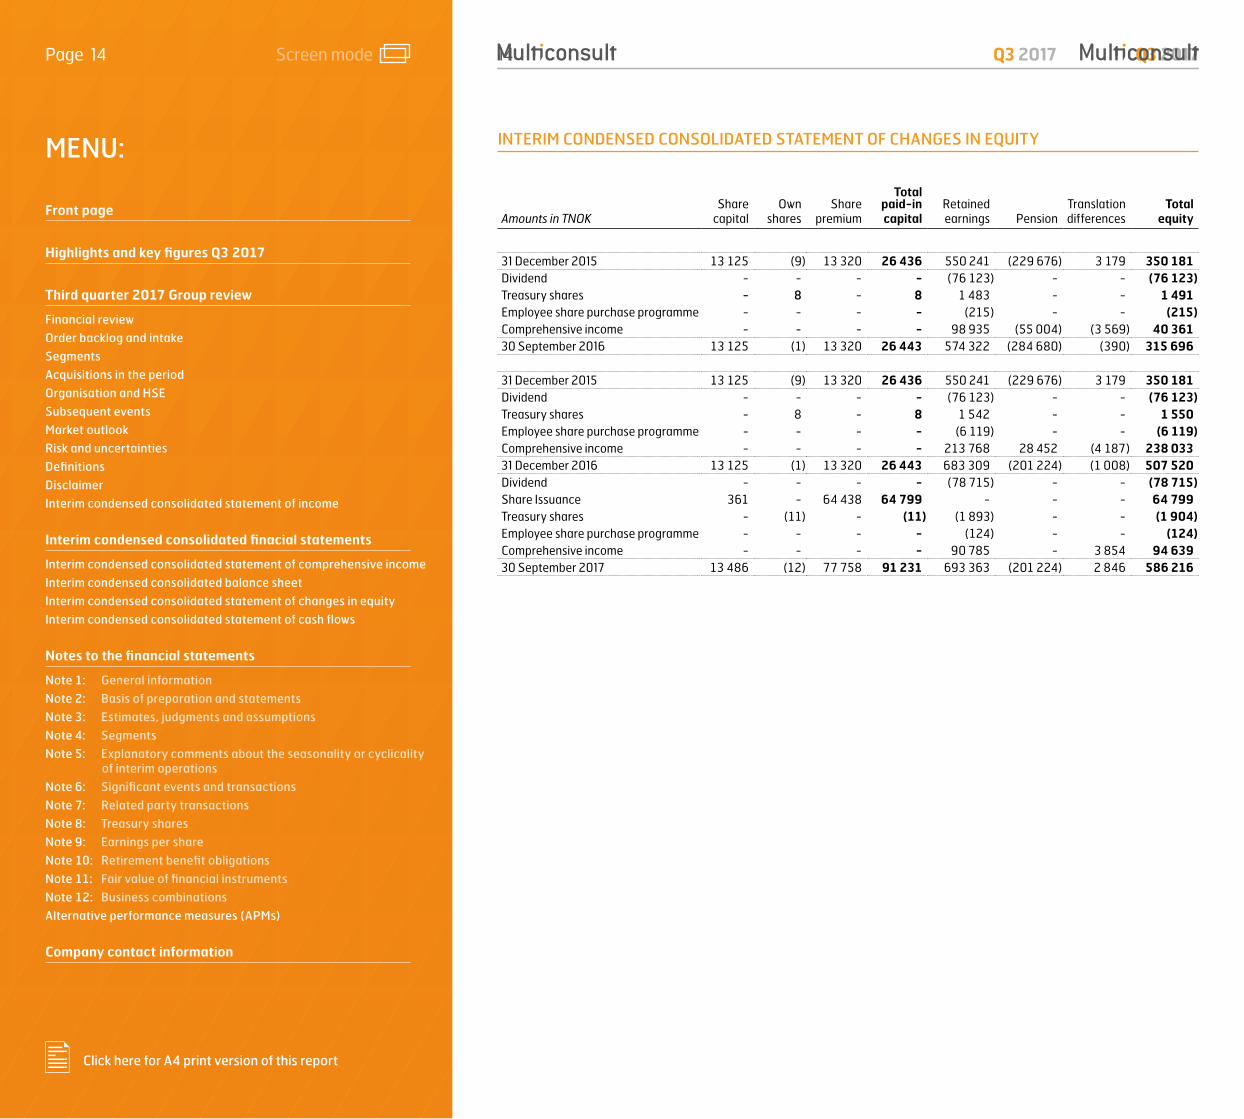
INTERIM CONDENSED CONSOLIDATED STATEMENT OF CHANGES IN EQUITY
Amounts in TNOK Share capital
Ownshares
Share premium
Total paid-in capital
Retained earnings Pension
Translation differences
Total equity
31 December 2015 13 125 (9) 13 320 26 436 550 241 (229 676) 3 179 350 181 Dividend - - - - (76 123) - - (76 123)Treasury shares - 8 - 8 1 483 - - 1 491 Employee share purchase programme - - - - (215) - - (215)Comprehensive income - - - - 98 935 (55 004) (3 569) 40 361 30 September 2016 13 125 (1) 13 320 26 443 574 322 (284 680) (390) 315 696 31 December 2015 13 125 (9) 13 320 26 436 550 241 (229 676) 3 179 350 181 Dividend - - - - (76 123) - - (76 123)Treasury shares - 8 - 8 1 542 - - 1 550 Employee share purchase programme - - - - (6 119) - - (6 119)Comprehensive income - - - - 213 768 28 452 (4 187) 238 033 31 December 2016 13 125 (1) 13 320 26 443 683 309 (201 224) (1 008) 507 520 Dividend - - - - (78 715) - - (78 715)Share Issuance 361 - 64 438 64 799 - - - 64 799 Treasury shares - (11) - (11) (1 893) - - (1 904)Employee share purchase programme - - - - (124) - - (124) Comprehensive income - - - - 90 785 - 3 854 94 639 30 September 2017 13 486 (12) 77 758 91 231 693 363 (201 224) 2 846 586 216
MENU:
Front page
Highlights and key figures Q3 2017
Third quarter 2017 Group review
Financial review
Order backlog and intake
Segments
Acquisitions in the period
Organisation and HSE
Subsequent events
Market outlook
Risk and uncertainties
Definitions
Disclaimer
Interim condensed consolidated statement of income
Interim condensed consolidated finacial statements
Interim condensed consolidated statement of comprehensive income
Interim condensed consolidated balance sheet
Interim condensed consolidated statement of changes in equity
Interim condensed consolidated statement of cash flows
Notes to the financial statements
Note 1: General information
Note 2: Basis of preparation and statements
Note 3: Estimates, judgments and assumptions
Note 4: Segments
Note 5: Explanatory comments about the seasonality or cyclicality of interim operations
Note 6: Significant events and transactions
Note 7: Related party transactions
Note 8: Treasury shares
Note 9: Earnings per share
Note 10: Retirement benefit obligations
Note 11: Fair value of financial instruments
Note 12: Business combinations
Alternative performance measures (APMs)
Company contact information
Q3 2017
Click here for A4 print version of this report
Page 14 Screen mode Q3 201714 1: Level 1 anchor2#: Level 2 anchor2#: Level 3 anchor

15
INTERIM CONDENSED CONSOLIDATED STATEMENT OF CASH FLOWS
Amounts in TNOK Q3 2017 Q3 2016 YTD 2017 YTD 2016 FY 2016
Cash flows from operating activities Profit before tax 9 582 32 649 118 220 163 602 287 732 Income taxes paid (4 802) (6 488) (38 376) (63 755) (60 412)Depreciation, amortization and impairment 12 076 11 234 34 677 32 416 43 205 Results from associated companies and joint ventures (179) (23) (778) (4 043) (4 053)Non cash pension cost - 6 590 - (389) (110 238)Sub total operating activities 16 678 43 962 113 744 127 831 156 233 Changes in working capital 17 283 334 (132 650) (144 115) (66 066)Net cash flow from operating activities 33 961 44 296 (18 906) (16 284) 90 167
Cash flows from investment activities Net purchase and sale of fixed assets and financial non-current assets (7 829) (8 444) (31 384) (28 920) (37 872)Proceeds/payments related to equity accounted investments 339 847 339 847 847 Net cash effect of business combinations (114 029) (0) (170 907) (20 255) (64 260)Net cash flow used in investment activities (121 519) (7 597) (201 952) (48 328) (101 285)
Cash flows from financing activities Change in interest-bearing liabilities 89 565 (45 471) 276 899 31 519 46 525 Paid dividends - - (78 715) (76 123) (76 123)Sale treasury shares 455 - 455 - 42 607 Purchase treasury shares (2 044) - (2 598) - (50 339)Net cash flow from financing activities 87 976 (45 471) 196 041 (44 604) (37 329) Foreign currency effects on cash and cash equivalents (2 197) (1 387) 4 859 (6 938) (8 516) Net increase/decrease in cash and cash equivalents (1 779) (10 159) (19 959) (116 154) (56 964)Cash and cash equivalents at the beginning of the period 157 810 126 959 175 990 232 954 232 954 Cash and cash equivalents at the end of the period 156 031 116 800 156 031 116 800 175 990
MENU:
Front page
Highlights and key figures Q3 2017
Third quarter 2017 Group review
Financial review
Order backlog and intake
Segments
Acquisitions in the period
Organisation and HSE
Subsequent events
Market outlook
Risk and uncertainties
Definitions
Disclaimer
Interim condensed consolidated statement of income
Interim condensed consolidated finacial statements
Interim condensed consolidated statement of comprehensive income
Interim condensed consolidated balance sheet
Interim condensed consolidated statement of changes in equity
Interim condensed consolidated statement of cash flows
Notes to the financial statements
Note 1: General information
Note 2: Basis of preparation and statements
Note 3: Estimates, judgments and assumptions
Note 4: Segments
Note 5: Explanatory comments about the seasonality or cyclicality of interim operations
Note 6: Significant events and transactions
Note 7: Related party transactions
Note 8: Treasury shares
Note 9: Earnings per share
Note 10: Retirement benefit obligations
Note 11: Fair value of financial instruments
Note 12: Business combinations
Alternative performance measures (APMs)
Company contact information
Q3 2017
Click here for A4 print version of this report
Page 15 Screen mode 15 Q3 20171: Level 1 anchor2#: Level 2 anchor2#: Level 3 anchor
16
NOTES TO THE FINANCIAL STATEMENTS
NOTE 1: General information
The Company and the GroupMulticonsult ASA (the company) is a Norwegian public limited liability company listed on Oslo Børs. The company and its subsidiaries (together the Multiconsult group/the group) are
among the leading suppliers of consultancy and design services in Norway and the Nordic region. The group has subsidiaries outside the Nordic region in Poland, UK and Singapore.
NOTE 2: Basis of preparation and statements
Basis for preparationThe financial statements are presented in NOK, rounded to the nearest thousand, unless otherwise stated. As a result of rounding adjustments, the figures in one or more rows or columns included in the financial statements and notes may not add up to the total of that row or column.
StatementsThese interim condensed consolidated financial statements for the third quarter of 2017 have been prepared in accordance with IAS 34 as approved by the EU. They have not been audited. They do not include all of the information required for full annual financial statements of the group and should be read in conjunction with the consolidated financial statements for 2016. The accounting policies applied are consistent with those applied and described in the consolidated annual financial statements for 2016, which are available upon request from the company’s registered office at Nedre Skøyenvei 2, 0276 Oslo and at www.multiconsult.no.
These interim condensed consolidated financial statements for the third quarter of 2017 were approved by the Board of Directors and the CEO on 8 November 2017.
Accounting policiesThe group prepares its consolidated annual financial statements in accordance with IFRS as adopted by the EU (International Financial Reporting Standards - IFRS). References to IFRS in these financial statements refer to IFRS as approved by the EU. The accounting policies adopted are consistent with those of the previous financial year.
At the time of approval for issue of these interim condensed consolidated financial statements, some new standards, amendments to standards and interpretations have been published, but are not yet effective and have not been applied in preparing these consolidated financial statements. Those that may be relevant for the group are described in note 2 to the annual consolidated financial statements for 2016.
NOTE 3: Estimates, judgments and assumptions
The preparation of interim condensed consolidated financial statements requires management to make judgements, estimates and assumptions that affect the application of accounting policies and the reported amounts of assets and liabilities, income and expense. Actual results may differ from these estimates. In preparing these interim condensed consolidated financial statements, significant judgements made by management in applying the group’s accounting policies and the key sources of estimation uncertainty were the same as those applied to the annual consolidated financial statements for 2016 (see especially note 2).
MENU:
Front page
Highlights and key figures Q3 2017
Third quarter 2017 Group review
Financial review
Order backlog and intake
Segments
Acquisitions in the period
Organisation and HSE
Subsequent events
Market outlook
Risk and uncertainties
Definitions
Disclaimer
Interim condensed consolidated statement of income
Interim condensed consolidated finacial statements
Interim condensed consolidated statement of comprehensive income
Interim condensed consolidated balance sheet
Interim condensed consolidated statement of changes in equity
Interim condensed consolidated statement of cash flows
Notes to the financial statements
Note 1: General information
Note 2: Basis of preparation and statements
Note 3: Estimates, judgments and assumptions
Note 4: Segments
Note 5: Explanatory comments about the seasonality or cyclicality of interim operations
Note 6: Significant events and transactions
Note 7: Related party transactions
Note 8: Treasury shares
Note 9: Earnings per share
Note 10: Retirement benefit obligations
Note 11: Fair value of financial instruments
Note 12: Business combinations
Alternative performance measures (APMs)
Company contact information
Q3 2017
Click here for A4 print version of this report
Page 16 Screen mode Q3 201716 2#: Level 2 anchor2#: Level 3 anchor
1: Notes to the financial statements

17
NOTE 4: Segments
Refer to note 5 to the consolidated annual financial statements for 2016 for more information on the segments.
The group has three geographical reporting segments as well as a segment for LINK arkitektur. Revenues and expenses are
reported in the segment with reference to where the employee is employed. The cost of administrative services, rent of premises, depreciation and so forth is allocated to the segments.
Q3 2017
Amounts in TNOKGreater
Oslo Area Regions Norway
Inter-national
LINK arkitektur
Not allocated
Elimi-nations Total
External revenues 300 092 225 969 43 474 116 228 (6 612) - 679 152 Internal revenues 3 439 - 6 696 6 049 1 868 (18 051) - Total operating revenues 303 531 225 969 50 170 122 277 (4 744) (18 051) 679 152 Net operating revenues 255 583 215 814 37 804 105 994 (6 383) - 608 813 Operating expenses 246 920 208 636 36 185 100 272 (5 777) - 586 235 EBITDA 8 664 7 179 1 620 5 723 (606) - 22 579 Depreciation, amortisation, impairment 3 700 6 288 417 1 667 5 - 12 076 EBIT 4 964 891 1 203 4 056 (611) - 10 503 Associates and joint ventures 191 - (12) - - - 179
Receivables 1) 384 850 229 290 76 476 188 246 2 682 (15 864) 865 679 Number of employees 1 187 842 205 476 135 - 2 845
1) Receivables includes accounts receivables (before provision for loss) and accrued revenues.
Q3 2016
Amounts in TNOKGreater
Oslo Area Regions Norway
Inter-national
LINK arkitektur
Not allocated
Elimi-nations Total
External revenues 311 213 224 781 25 962 70 944 (1 023) - 631 876 Internal revenues 2 107 - 9 183 5 274 130 (16 694) - Total operating revenues 313 320 224 781 35 144 76 218 (893) (16 694) 631 876 Net operating revenues 256 698 208 023 22 357 69 150 (1 868) - 554 360 Operating expenses 230 373 195 297 18 440 65 581 (894) - 508 798 EBITDA 26 325 12 725 3 917 3 568 (974) - 45 561 Depreciation, amortisation, impairment 3 266 6 428 416 1 125 - - 11 234 EBIT 23 059 6 298 3 501 2 444 (974) - 34 327 Associates and joint ventures 125 - (102) - - 23
Receivables 1) 314 505 233 360 39 765 98 820 2 218 (7 222) 681 446 Number of employees 881 792 124 343 121 - 2 261
1) Receivables includes accounts receivables (before provision for loss) and accrued revenues.
MENU:
Front page
Highlights and key figures Q3 2017
Third quarter 2017 Group review
Financial review
Order backlog and intake
Segments
Acquisitions in the period
Organisation and HSE
Subsequent events
Market outlook
Risk and uncertainties
Definitions
Disclaimer
Interim condensed consolidated statement of income
Interim condensed consolidated finacial statements
Interim condensed consolidated statement of comprehensive income
Interim condensed consolidated balance sheet
Interim condensed consolidated statement of changes in equity
Interim condensed consolidated statement of cash flows
Notes to the financial statements
Note 1: General information
Note 2: Basis of preparation and statements
Note 3: Estimates, judgments and assumptions
Note 4: Segments
Note 5: Explanatory comments about the seasonality or cyclicality of interim operations
Note 6: Significant events and transactions
Note 7: Related party transactions
Note 8: Treasury shares
Note 9: Earnings per share
Note 10: Retirement benefit obligations
Note 11: Fair value of financial instruments
Note 12: Business combinations
Alternative performance measures (APMs)
Company contact information
Q3 2017
Click here for A4 print version of this report
Page 17 Screen mode 17 Q3 20172#: Level 2 anchor2#: Level 3 anchor

18
YTD 2017
Amounts in TNOKGreater
Oslo Area Regions Norway
Inter-national
LINK arkitektur
Not allocated
Elimi-nations Total
External revenues 1 077 725 (807 506) (134 460) 403 559 (10 976) - 2 412 274 Internal revenues 12 014 - 29 497 14 355 3 960 (59 826) - Total operating revenues 1 089 739 807 506 163 957 417 914 (7 016) (59 826) 2 412 274 Net operating revenues 914 474 765 841 130 560 345 220 (8 647) - 2 147 449 Operating expenses 839 017 717 500 111 982 329 381 (5 801) - 1 992 079 EBITDA 75 457 48 341 18 578 15 839 (2 846) - 155 370 Depreciation, amortisation, impairment 10 976 18 024 1 488 4 200 (19) - 34 670 EBIT 64 481 30 317 17 090 11 639 (2 828) - 120 700 Associates and joint ventures 348 - 430 - - - 778
Receivables 1) 384 850 229 290 76 476 188 246 2 682 (15 864) 865 679 Number of employees 1 187 842 205 476 135 - 2 845
1) Receivables includes accounts receivables (before provision for loss) and accrued revenues.
YTD 2016
Amounts in TNOKGreater
Oslo Area Regions Norway
Inter-national
LINK arkitektur
Not allocated
Elimi-nations Total
External revenues 1 079 051 758 517 71 170 268 226 4 840 - 2 181 805 Internal revenues 8 836 - 24 579 13 763 4 527 (51 705) - Total operating revenues 1 087 887 758 517 95 749 281 989 9 367 (51 705) 2 181 804 Net operating revenues 882 939 710 160 66 240 252 805 7 025 - 1 919 170 Operating expenses 762 609 649 716 59 965 243 452 7 635 - 1 723 378 EBITDA 120 330 60 444 6 275 9 352 (610) - 195 792 Depreciation, amortisation, impairment 9 348 18 571 1 312 3 186 - - 32 416 EBIT 110 983 41 874 4 964 6 167 (610) - 163 377 Associates and joint ventures 335 - 3 708 - - - 4 043
Receivables 1) 314 505 233 360 39 765 98 820 2 218 (7 222) 681 446 Number of employees 881 792 124 343 121 - 2 261
1) Receivables includes accounts receivables (before provision for loss) and accrued revenues.
MENU:
Front page
Highlights and key figures Q3 2017
Third quarter 2017 Group review
Financial review
Order backlog and intake
Segments
Acquisitions in the period
Organisation and HSE
Subsequent events
Market outlook
Risk and uncertainties
Definitions
Disclaimer
Interim condensed consolidated statement of income
Interim condensed consolidated finacial statements
Interim condensed consolidated statement of comprehensive income
Interim condensed consolidated balance sheet
Interim condensed consolidated statement of changes in equity
Interim condensed consolidated statement of cash flows
Notes to the financial statements
Note 1: General information
Note 2: Basis of preparation and statements
Note 3: Estimates, judgments and assumptions
Note 4: Segments
Note 5: Explanatory comments about the seasonality or cyclicality of interim operations
Note 6: Significant events and transactions
Note 7: Related party transactions
Note 8: Treasury shares
Note 9: Earnings per share
Note 10: Retirement benefit obligations
Note 11: Fair value of financial instruments
Note 12: Business combinations
Alternative performance measures (APMs)
Company contact information
Q3 2017
Click here for A4 print version of this report
Page 18 Screen mode Q3 201718 1: Level 1 anchor2#: Level 2 anchor2#: Level 3 anchor

19
Year 2016
Amounts in TNOKGreater
Oslo Area Regions Norway
Inter-national
LINK arkitektur
Not allocated
Elimi-nations Total
External revenues 1 466 774 1 026 004 104 642 369 580 1 070 - 2 968 069 Internal revenues 12 598 - 35 112 17 409 5 500 (70 619) - Total operating revenues 1 479 372 1 026 004 139 754 386 989 6 570 (70 619) 2 968 069 Net operating revenues 1 197 326 960 560 97 036 346 126 3 573 - 2 604 621 Operating expenses 1) 1 057 524 900 600 84 208 332 015 (102 516) - 2 271 832 EBITDA 139 801 59 960 12 828 14 111 106 089 - 332 788 Depreciation, amortisation, impairment 14 675 22 668 1 696 4 166 - - 43 205 EBIT 125 125 37 292 11 132 9 945 106 089 - 289 584 Associates and joint ventures 513 - 3 539 - - - 4 053
Receivables 2) 324 411 221 657 53 014 152 188 3 312 (18 241) 736 341 Number of employees 879 793 130 420 122 - 2 344
1) Gain of settlement of defined benefit pension plan of NOK 107.3 million is included as decreased operating expenses, not allocated2) Receivables includes accounts receivables (before provision for loss) and accrued revenues
An adjustment to the business area definitions was implemented from 1 January 2017 in response to recent market developments. The new business areas and the respective operating revenues
for the third quarter and year to date 2017 are presented in the table below.
Operating revenues per business area:
Amounts in TNOK Q3 2017 YTD 2017
Buildings & Properties 319 592 1 142 061 Industry 42 656 152 932 Oil & Gas 18 602 85 214 Renewable Energy 94 903 319 380 Transportation 152 252 557 840 Water & Environment 51 147 154 849 Total 679 152 2 412 275
Buildings & Properties include advisory and engineering at all stages of a construction project for all types of buildings. The business area provides services such as demand- and feasibility studies, sketch pre-project, detailed design and follow-up during the construction period, and real estate consultancy. The focus is on sustainable and long-term solutions. LINK arkitektur is included.
Industry offers complete, interdisciplinary advisory and engineering services in all project phases. Services include investigations, development of projects, project management, design and procurement, construction with all technical systems, construction management and follow-up, and commissioning.
Oil & Gas provides services throughout the whole value chain, from early phase studies through FEED (Front End Engineering Design) to detailed engineering and delivery for both onshore and offshore projects. Services provided onshore are within terminal and production facilities, facilities and constructions, harbour and marine constructions, underground warehouses, land-based pipelines and landfills, and electrical substations. Services provided offshore are within oil and gas rigs and
platforms, concrete marine constructions, modules and structures for rigs and platforms, seabed installations, arctic climate technology for floating and subsea constructions, and noise and vibration measurement among others.
Renewable Energy covers the entire project life cycle in hydropower, transmission and distribution, land-based wind power, , solar energy, and. Services provided are from start-up and preliminary studies to detailed design and construction management, commissioning and operational shutdown.
Transportation largely includes advisory of planning safe and forward-looking transport systems. The business area covers road, rail, airport, harbor and channel transport systems.
Water & Environment includes services in all phases of the lifetime of a project including inspections, engineering, operation and maintenance, and remediation and demolition. The focus is on sustainable development of the environment through advisory within Greenhouse gas emissions, flood and slide protection, water and drains, blue-green structures and pollution of air, water and soil.
MENU:
Front page
Highlights and key figures Q3 2017
Third quarter 2017 Group review
Financial review
Order backlog and intake
Segments
Acquisitions in the period
Organisation and HSE
Subsequent events
Market outlook
Risk and uncertainties
Definitions
Disclaimer
Interim condensed consolidated statement of income
Interim condensed consolidated finacial statements
Interim condensed consolidated statement of comprehensive income
Interim condensed consolidated balance sheet
Interim condensed consolidated statement of changes in equity
Interim condensed consolidated statement of cash flows
Notes to the financial statements
Note 1: General information
Note 2: Basis of preparation and statements
Note 3: Estimates, judgments and assumptions
Note 4: Segments
Note 5: Explanatory comments about the seasonality or cyclicality of interim operations
Note 6: Significant events and transactions
Note 7: Related party transactions
Note 8: Treasury shares
Note 9: Earnings per share
Note 10: Retirement benefit obligations
Note 11: Fair value of financial instruments
Note 12: Business combinations
Alternative performance measures (APMs)
Company contact information
Q3 2017
Click here for A4 print version of this report
Page 19 Screen mode 19 Q3 20171: Level 1 anchor2#: Level 2 anchor2#: Level 3 anchor

20
NOTE 5: Explanatory comments about the seasonality or cyclicality of interim operations
The group’s net operating revenues are affected by the number of working days within each reporting period while employee expenses are recognised for full calendar days. The number of working days in a month is affected by public holidays and vacations. The timing of public holidays (e.g. Easter) during
quarters and whether they fall on weekends or weekdays impacts revenues. Generally, the company’s employees are granted leave during Easter and Christmas. The summer holidays primarily impact the month of July and the third quarter.
NOTE 6: Significant events and transactions
Multiconsult ASA acquired 100% of the shares in Iterio AB on 7 March 2017. See note 12 for further information.
The Annual General Meeting on 11 May 2017 resolved payment of ordinary dividends related to the 2016 financial year of NOK 78.7 million (NOK 3.0 per share) that was paid to the shareholders registered on 11 May 2017.
Multiconsult ASA acquired 100% of the shares in Hjellnes Consult AS and Johs Holt AS on 25 September 2017. See note 12 for further information. The Board of Directors resolved on 30 August 2017 an increase of the share capital. At 25 September 2017 the share capital increase was registered in the Norwegian Register of Business Enterprises, and the capital increase has thus been completed. After the issuance of the new shares the share capital of Multiconsult ASA is NOK 13 485 197 divided into 26 970 394 shares, each with a nominal value of NOK 0.50.
NOTE 7: Related party transactions
See note 22 to the consolidated financial statements for 2016 for a description of related parties and related parties transactions in 2016.
Among the Company’s shareholders Stiftelsen Multiconsult (the Foundation) is considered to be a related party according to IFRS due to its ownership and influence. The Foundation had a shareholding of 18.7% at 31 December 2016 and 19.4% at 30 September 2017.
NOTE 8: Treasury shares
In 2015 Multiconsult ASA introduced a share purchase programme for its employees. Through the share purchase programme the company offers its employees shares in Multiconsult ASA with a discount of 20%. Shares purchased through the programme are subject to a two-year lock-up period.
The company had a holding of treasury shares of 1 998 shares at 31 December 2016 and 24 201 shares at 30 September 2017.
As part of the share based bonus arrangement for group management for 2016, the group management have at total purchased and been allotted 7 248 Multiconsult shares. As stated in note 8 in the 2016 annual report, if defined targets are met, a part of the earned bonus will be paid in 2017 in the form of shares with a discount of 30% and a three year lock-in period. There is a maximum equivalent to four months’ salary for the CEO and two months’ salary for the other members of group management.
The treasury shares reduced equity by NOK 2.1 million at 30 September 2017, equvivalent to the purchase price of the shares.
MENU:
Front page
Highlights and key figures Q3 2017
Third quarter 2017 Group review
Financial review
Order backlog and intake
Segments
Acquisitions in the period
Organisation and HSE
Subsequent events
Market outlook
Risk and uncertainties
Definitions
Disclaimer
Interim condensed consolidated statement of income
Interim condensed consolidated finacial statements
Interim condensed consolidated statement of comprehensive income
Interim condensed consolidated balance sheet
Interim condensed consolidated statement of changes in equity
Interim condensed consolidated statement of cash flows
Notes to the financial statements
Note 1: General information
Note 2: Basis of preparation and statements
Note 3: Estimates, judgments and assumptions
Note 4: Segments
Note 5: Explanatory comments about the seasonality or cyclicality of interim operations
Note 6: Significant events and transactions
Note 7: Related party transactions
Note 8: Treasury shares
Note 9: Earnings per share
Note 10: Retirement benefit obligations
Note 11: Fair value of financial instruments
Note 12: Business combinations
Alternative performance measures (APMs)
Company contact information
Q3 2017
Click here for A4 print version of this report
Page 20 Screen mode Q3 201720 1: Level 1 anchor2#: Level 2 anchor2#: Level 3 anchor

21
NOTE 9: Earnings per share
For the periods presented there are no dilutive effects on profits or number of shares.Basic and diluted earnings per share are consequently equal.
Q3 2017 Q3 2016 YTD 2017 YTD 2016 FY 2016
Profit for the period (in TNOK) 7 751 24 324 90 785 123 260 213 769Average no. shares 26 281 729 26 246 442 26 255 365 26 241 979 26 243 164Earnings per share (NOK) 0.29 0.93 3.46 4.70 8.15
NOTE 10: Retirement benefit obligations
For a description of the corporate pension schemes see note 11 to the consolidated financial statements for 2016.
The company has with effect from 31 December 2016 settled the defined benefit pension plan for employees in Multiconsult ASA and Multiconsult Norge AS. A new defined contribution pension plan now covers all the employees in the two companies. Other
defined benefit pension plans in the group still exist for four employees in LINK arkitektur AS and one individual agreement in Multiconsult ASA.
Refer to note 11 to the consolidated annual financial statements for 2016 for further information on the group’s pension plans.
NOTE 11: Fair value of financial instruments
The group’s financial instruments are interest bearing debt, accounts receivables and other receivables, cash and cash equivalents and accounts payables. It is assumed that the
book value is a good approximation of fair value for the group’s financial instruments.
Non-current and current interest bearing liabilities:
Amounts in TNOK
NOK 30 September
2017
NOK 30 June
2017
NOK 31 December
2016
Local currency
30 September 2017
Local currency
30 June 2017
Local currency
31 December 2016
Local currency
Multiconsult ASA 320 455 241 993 50 000 320 455 241 993 50 000 NOKMulticonsult UK - - 5 837 - - 550 GBPMulticonsult Asia - - 897 - - 150 SGDMulticonsult Polska - 700 457 - 309 222 PLNLINK arkitektur AS 11 198 - - 11 198 - - NOKLINK arkitektur AB 1 409 1 428 - 1 438 1 438 - SEKaarhus arkitekterne 3 307 2 683 2 279 2 625 2 177 1 865 DKKTotal 336 369 246 804 59 470 - - -
The group owns a limited amount of shares and participations available for sale (NOK 0.5 million), and it is assumed that the book value is a good estimate of fair value. Fair value of
derivatives (currency swaps) were recorded with an unrealised loss (liability) of NOK 0.3 million at 30 September 2017 (NOK 0.3 million at 30 June 2017).
MENU:
Front page
Highlights and key figures Q3 2017
Third quarter 2017 Group review
Financial review
Order backlog and intake
Segments
Acquisitions in the period
Organisation and HSE
Subsequent events
Market outlook
Risk and uncertainties
Definitions
Disclaimer
Interim condensed consolidated statement of income
Interim condensed consolidated finacial statements
Interim condensed consolidated statement of comprehensive income
Interim condensed consolidated balance sheet
Interim condensed consolidated statement of changes in equity
Interim condensed consolidated statement of cash flows
Notes to the financial statements
Note 1: General information
Note 2: Basis of preparation and statements
Note 3: Estimates, judgments and assumptions
Note 4: Segments
Note 5: Explanatory comments about the seasonality or cyclicality of interim operations
Note 6: Significant events and transactions
Note 7: Related party transactions
Note 8: Treasury shares
Note 9: Earnings per share
Note 10: Retirement benefit obligations
Note 11: Fair value of financial instruments
Note 12: Business combinations
Alternative performance measures (APMs)
Company contact information
Q3 2017
Click here for A4 print version of this report
Page 21 Screen mode 21 Q3 20171: Level 1 anchor2#: Level 2 anchor2#: Level 3 anchor

22
NOTE 12: Business combinations
Hjellnes Consult AS:On 25 September 2017, Multiconsult ASA acquired all the shares of Hjellnes Consult AS for NOK 151.8 million. The acquisition was settled in cash and in Multiconsult shares. 65 percent of the purchase price was settled with cash and 35 percent was settled with shares. External transaction related costs are expensed as part of other operating expenses of NOK 1.9 million.
Hjellnes Consult AS employs more than 230 engineers and is localised in Oslo. In 2016 the company had total revenues of NOK 266.2 million and profit before tax of NOK 12.9 million.
Hjellnes Consult AS provides multidisciplinary consulting services and have extensive expertise in buildings, plants, infrastructure and environment.
Multiconsult and Hjellnes Consult AS have been operating in the same industry for a long time and the companies fit well together, both strategically, professionally and culturally. Combining forces increases the interdisciplinary capacity and expertise within the core business areas Buildings & Properties, Transportation, as well as Water & Environment. Multiconsult plans to exploit this to take new market shares and increase the competitiveness of the company’s strategic investments in urbanism and healthcare, in line with the company’s 3-2-1 GO strategic objectives.
Hjellnes Consult AS is consolidated in the group balance sheet as of 30 September 2017.
Net assets of Hjellnes Consult AS acquired at the time of acquisition:
Amounts in TNOK
Assets 73 207Liabilities 47 117Net identifiable assets and liabilities 26 090
Excess values:Goodwill 125 710Net assets 151 800Settled with Multiconsult shares 53 459Cash and cash equivalents 3 197Net cash (95 144)
The acquisition generated an excess value of NOK 125.7 million. The excess value is allocated to goodwill and is related to the competence of the staff. The purchase price allocation is preliminary.
Johs Holt AS:On 25 September 2017, Multiconsult ASA acquired all the shares of Johs Holt AS for NOK 32.2 million. The acquisition was settled in cash and in Multiconsult shares. 65 percent of the purchase price was settled with cash and 35 percent was settled with shares. External transaction related costs are expensed as part of other operating expenses of NOK 0.4 million.
Johs Holt AS has 27 employees. In 2016 the company had total revenues of NOK 35 million and profit before tax of NOK 3.5 million.
Johs Holt AS provides consulting services for all types of bridges and other heavy structures.
Net assets of Johs Holt AS acquired at the time of acquisition:
Amounts in TNOK
Assets 11 658Liabilities 7 058Net identifiable assets and liabilities 4 600
Excess values:Goodwill 27 600Net assets 32 200Settled with Multiconsult shares 11 340Cash and cash equivalents 1 975Net cash (18 885)
The acquisition generated an excess value of NOK 27.6 million. The excess value is allocated to goodwill and is related to the competence of the staff. The purchase price allocation is preliminary.
Johs Holt AS is consolidated in the group balance sheet as of 30 September 2017.
Iterio AB:On 7 March 2017, Multiconsult ASA acquired all the shares of Iterio AB for NOK 52.6 million (SEK 55.5 million). The acquisition was settled in cash and financed through Multiconsult’s existing credit facilities. External transaction related costs are expensed as part of other operating expenses of NOK 0.5 million. The acquisition is a first step towards Multiconsult’s strategic objective of developing a multidisciplinary business in Sweden.
Iterio AB are engineering consultants with focus on planning and construction. They are mainly involved with project and design management as well as data coordination. Their core expertise is within geotechnics, environment and traffic and they have a solid customer base. The company was established in 2011 and employs more than 70 engineers across offices in Stockholm, Gothenburg and Malmø. Iterio AB is a valuable addition and will be a good fit with LINK arkitektur’s and Multiconsult group’s existing presence and commitment in Sweden and Scandinavia.
MENU:
Front page
Highlights and key figures Q3 2017
Third quarter 2017 Group review
Financial review
Order backlog and intake
Segments
Acquisitions in the period
Organisation and HSE
Subsequent events
Market outlook
Risk and uncertainties
Definitions
Disclaimer
Interim condensed consolidated statement of income
Interim condensed consolidated finacial statements
Interim condensed consolidated statement of comprehensive income
Interim condensed consolidated balance sheet
Interim condensed consolidated statement of changes in equity
Interim condensed consolidated statement of cash flows
Notes to the financial statements
Note 1: General information
Note 2: Basis of preparation and statements
Note 3: Estimates, judgments and assumptions
Note 4: Segments
Note 5: Explanatory comments about the seasonality or cyclicality of interim operations
Note 6: Significant events and transactions
Note 7: Related party transactions
Note 8: Treasury shares
Note 9: Earnings per share
Note 10: Retirement benefit obligations
Note 11: Fair value of financial instruments
Note 12: Business combinations
Alternative performance measures (APMs)
Company contact information
Q3 2017
Click here for A4 print version of this report
Page 22 Screen mode Q3 201722 1: Level 1 anchor2#: Level 2 anchor2#: Level 3 anchor

23
Net assets of Iterio AB acquired at the time of acquisition:
Amounts in TSEK
Assets 26 580Liabilities 13 383Net identifiable assets and liabilities 13 197
Excess values:Goodwill 42 303Net assets 55 500Cash and cash equivalents 5 472Net cash (50 028)
The acquisition generated an excess value of SEK 42.3 million. The excess value is allocated to goodwill and is related to the competence of the staff. SEK 5.5 million of the purchase price was paid in the second quarter. The purchase price allocation is preliminary.
Iterio AB is consolidated into the group accounts as of 1 March 2017.
ALTERNATIVE PERFORMANCE MEASURES (APMS)
Multiconsult uses alternative performance measures for periodic and annual financial reporting in order to provide a better understanding of the group’s underlying financial performance.
Items excluded from underlying EBITDA and EBIT:The company has with effect from 1 January 2017 settled the defined benefit pension plan. The settlement resulted in a positive P&L effect and Multiconsult has defined that this effect of NOK 107.3 million lower salary expense is excluded from the underlying results in 2016.
Underlying EBITDA and EBIT:
Amounts in MNOK (except percentage) Q3 2017 Q3 2016 YTD 2017 YTD 2016 FY 2016
Net operating revenues 608.8 554.4 2 147.4 1 919.2 2 604.6Reported employee benefit expenses 473.8 405.3 1 631.8 1 410.4 1 841.6Curtailment of defind benefit pension plan - - - - (107.3)Underlying employee benefit expenses 473.8 405.3 1 631.8 1 410.4 1 948.9Reported other operating expenses 112.4 103.5 360.3 313.0 430.2Underlying other operating expenses 112.4 103.5 360.3 313.0 430.2EBITDA underlying 22.6 45.6 155.4 195.8 225.5Depreciation, amortisation and impairments 12.1 11.2 34.7 32.4 43.2EBIT, underlying 10.5 34.3 120.7 163.4 182.3EBITDA margin (%), underlying 3.7% 8.2% 7.2% 10.2% 8.7%EBIT margin (%), underlying 1.7% 6.2% 5.6% 8.5% 7.0%
Net interest bearing debt:
Amounts in MNOK Q3 2017 Q3 2016 YTD 2017 YTD 2016 FY 2016
Non-current interest bearing liabilities 217.3 39.8 217.3 39.8 56.0Current interest bearing liabilities 119.1 2.1 119.1 2.1 3.5Cash and cash equivalents 156.0 116.8 156.0 116.8 176.0Net interest bearing debt1 180.3 (74.9) 180.3 (74.9) (116.5)
1) Negative is asset.
MENU:
Front page
Highlights and key figures Q3 2017
Third quarter 2017 Group review
Financial review
Order backlog and intake
Segments
Acquisitions in the period
Organisation and HSE
Subsequent events
Market outlook
Risk and uncertainties
Definitions
Disclaimer
Interim condensed consolidated statement of income
Interim condensed consolidated finacial statements
Interim condensed consolidated statement of comprehensive income
Interim condensed consolidated balance sheet
Interim condensed consolidated statement of changes in equity
Interim condensed consolidated statement of cash flows
Notes to the financial statements
Note 1: General information
Note 2: Basis of preparation and statements
Note 3: Estimates, judgments and assumptions
Note 4: Segments
Note 5: Explanatory comments about the seasonality or cyclicality of interim operations
Note 6: Significant events and transactions
Note 7: Related party transactions
Note 8: Treasury shares
Note 9: Earnings per share
Note 10: Retirement benefit obligations
Note 11: Fair value of financial instruments
Note 12: Business combinations
Alternative performance measures (APMs)
Company contact information
Q3 2017
Click here for A4 print version of this report
Page 23 Screen mode 23 Q3 20171: Level 1 anchor2#: Level 2 anchor2#: Level 3 anchor

24 Design/layout: H
augvar AS
Nedre Skøyen vei 2, 0276 OsloP O Box 265 Skøyen, 0213 OsloTelephone 21 58 50 00Fax 21 58 50 01
[email protected] no 910 253 158
MENU:
Front page
Highlights and key figures Q3 2017
Third quarter 2017 Group review
Financial review
Order backlog and intake
Segments
Acquisitions in the period
Organisation and HSE
Subsequent events
Market outlook
Risk and uncertainties
Definitions
Disclaimer
Interim condensed consolidated statement of income
Interim condensed consolidated finacial statements
Interim condensed consolidated statement of comprehensive income
Interim condensed consolidated balance sheet
Interim condensed consolidated statement of changes in equity
Interim condensed consolidated statement of cash flows
Notes to the financial statements
Note 1: General information
Note 2: Basis of preparation and statements
Note 3: Estimates, judgments and assumptions
Note 4: Segments
Note 5: Explanatory comments about the seasonality or cyclicality of interim operations
Note 6: Significant events and transactions
Note 7: Related party transactions
Note 8: Treasury shares
Note 9: Earnings per share
Note 10: Retirement benefit obligations
Note 11: Fair value of financial instruments
Note 12: Business combinations
Alternative performance measures (APMs)
Company contact information
Click here for A4 print version of this report
Page 24 Screen mode 2#: Level 3 anchor
1: Company contact information2#: Level 2 anchor


![Danfoss - 1. Программирование · 2015. 4. 6. · кнопкой [quick menu] и выбором "q3 Настройки функций", "q3-1 Общие настройки"](https://img.dokumen.tips/doc/110x75/5fc44da42bdf101fb12570dd/danfoss-1-2015-4-6-quick.jpg)