Embed Size (px)
Citation preview

Mental Illness in
Jails Report
Compensation Board
20
16
November 1,
2016

1
Compensation Board Mental Illness in Jails Report (2016)
Authority: Virginia Acts of Assembly, 2016, Chapter 780
§53.1-83.1, §53.1-84 and §53.1-85, Code of Virginia
Item 70J “The Compensation Board shall provide an annual report on the number and diagnoses of inmates with mental illnesses in local and regional jails, the treatment services provided, and expenditures on jail mental health programs. The report shall be prepared in cooperation with the Virginia Sheriffs Association, the Virginia Association of Regional Jails, the Virginia Association of Community Services Boards, and the Department of Behavioral Health and Developmental Services (DBHDS) and shall be coordinated with the data submissions required for the annual jail cost report. Copies of this report shall be provided by November 1 of each year to the Governor, Director, Department of Planning and Budget, and the Chairmen of the Senate Finance and House Appropriations Committees.”
Executive Summary: In the month of June, 2016 the Commonwealth of Virginia supported 60
local and regional jails and jail farms. Of this number there are 24 county jails, 12 city jails, 23 regional jails and 1 jail farm. City and county jails are operated under the authority of the sheriff in that locality. The jail farm is operated under the authority of the locality it serves by an appointed superintendent. Regional jails are operated under the authority of a regional jail board or authority consisting of at least the sheriff and one other representative from each participating jurisdiction.
A survey of mental illness in Virginia jails was initially developed by DBHDS and staff of the Senate Finance Committee and Compensation Board. The Compensation Board posted the mental health survey on its website in July 2016 for completion by local and regional jails. With the support of the Virginia Sheriffs’ Association and the Virginia Association of Regional Jails, the Compensation Board received surveys from 59 out of 60 local and regional jails, excluding the Danville City Farm which noted that it does not hold mentally ill offenders. The data in this report is as reported to the Compensation Board by the local and regional jails in their 2016 mental health surveys, submitted as of July 22, 2016. The goal of the survey was to provide information to the Virginia General Assembly, the Compensation Board and the DBHDS regarding the incidence of mental illness among individuals incarcerated in Virginia jails, characteristics of this population and methods by which jails seek to manage mental illness within their facility. Survey questions directed jail personnel to report data as reflected for the month of June 2016, with the exception of treatment expenditures which were reported for the entire fiscal year (July 1, 2015 – June 30, 2016). Significant changes to the

2
survey instrument this year include the addition of questions that identify: 1) numbers of mentally ill inmates that are homeless, 2) numbers of mentally ill inmates that are veterans; 3) whether jails screen inmates held solely on simple marijuana possession charges; and 4) whether jails’ procedures for screening and assessments are adjusted for booking over weekends/holidays. Although there is reporting on federal and out of state inmates average daily population this year, the data regarding inmates with mental illness is reflective only of local and state responsible inmates housed in local and regional jails.
Acknowledgement: The Compensation Board would like to express its appreciation to the
Sheriffs, Regional Jail Superintendents, and all jail staff involved in the collection and reporting of the data requested in the 2016 Mental Illness in Jails Survey. The Board and Staff are thankful for the cooperation and efforts of jail leadership and staff in this reporting process.
Note: The Danville City Farm did not respond to the survey, as they indicated that all mentally ill offenders are held at the city jail, which is operated separately by the city sheriff. The Farm housed an average daily population of 129 offenders in June, 2016.

3
Survey Background The Compensation Board developed a mental illness survey for completion by all local and regional jails requesting statistical information for the month of June, 2016. Information relating to screening and assessment, diagnoses, housing, and most serious offense type of mentally ill inmates was collected by the survey instrument. The survey also collected data regarding inmates’ access to mental health programs and assistance in the facility, including medication and treatment services. Additionally, the survey is used to identify the providers of screening/assessment and treatment in each facility, whether they are private mental health professionals, Community Services Board (CSB) staff, or jail staff. Jails also reported how inmate mental health data is collected and stored, as well as the amount of mental health and/or Crisis Intervention Team training provided to the jail staff, if any. Finally, jails were asked to provide the fiscal year cost of all mental health services and medications. Data gleaned from surveys of 59 out of 60 local and regional jails is included in this report. A copy of the survey instrument is included in Appendix A.
Population & Demographics in Jails Based upon LIDS data for the month of June, 2016 there was an average daily inmate population (ADP) of 28,415 in jails in the Commonwealth of Virginia (1 jail was excluded from this report). Of these, 7,950 were state responsible (SR) inmates. A state responsible inmate (SR) is any person convicted of one or more felony offenses and (a) the sum of consecutive effective sentences for felonies, committed on or after January 1, 1995, is (i) more than twelve months or (ii) one year or more, or (b) the sum of consecutive effective sentences for felonies, committed before January 1, 1995, is more than two years. An additional 19,071 were local responsible (LR) inmates. A local responsible inmate (LR) is any person arrested on a state warrant and incarcerated in a local correctional facility prior to trial, any person convicted of a misdemeanor offense and sentenced to a term in a local correctional facility, any person convicted of a felony offense on or after January 1, 1995 and given an effective sentence of (i) twelve months or less or (ii) less than one year, or any person convicted of one or more felony offenses committed before January 1, 1995, and sentenced to less than two years. The remaining 225 of the ADP were local ordinance violators. Unlike SR and LR offenders, who have been arrested on a state warrant, offenders held for ordinance violations have been arrested on a local warrant, having been charged with an offense specific to that locality which may or may not also appear in the code of Virginia. The ADP of federal and out of state inmates was 1,169; however these inmates are not included in the jails’ reporting or in the analysis of any statistics in this report. Therefore the average daily population included for analysis in this report is 27,246. Of these 27,246 inmates, 40% were pre-trial and 60% were post-conviction. Pre-trial refers to inmates held in a local jail awaiting trial. Post-conviction refers to inmates who have been found guilty of one or more criminal charges, with or without additional pending charges, and are serving sentence in the jail or awaiting transfer to a Department of Corrections (DOC) facility. Of the 27,246 ADP, 16.07% were female, 83.85% were male and .08% were an unknown gender.

4
Table 1: Jail Population Percentages-Average Daily Population
Year Pretrial Post-Con Female Male
2016 40% 60% 16.07% 83.85%
2015 40% 60% 15% 85%
2014 39% 61% 14% 86%
2013 55% 45% 23% 77%
2012 32% 68% 14% 86%
From this point forward in the report, statistics will be noted that refer to the percentages of certain populations that are mentally ill. Where these statistics are cited, staff has calculated percentages using inmate counts, not the average daily inmate population. The annual survey submitted by jails requires them to indicate the number of inmates mentally ill within their facility for a specific month. To most accurately make comparisons between this population and the general population, specific inmate counts within the jails for the same time period would be required. The following are the counts of the general population used to calculate mental illness percentages in this section: Total, 39,888; Female, 7,306; Male, 32,544; and Unknown, 38. Of the female population count, 25.79% was reported to be mentally ill. Of the male population count, 14.35% was reported as having a mental illness. Of the total general population count, 16.43% was known or suspected to be mentally ill. Table 2 includes the percentage of the female/male general population diagnosed as mentally ill for the current as well as previous 4 years.
Table 2: Percentage of Female/Male and Total General Population with Mental Illness Using Inmate Counts
Year Female Male Total
2016 25.79% 14.35% 16.43%
2015 25.29% 13.63% 16.81%
2014 20.87% 12.43% 13.95%
2013 16.13% 12.64% 13.45%
2012 14.40% 10.35% 11.07%
Note: Regional percentages of the total ADP: Central, 38.28%; Western, 29.38%; Eastern, 32.34%. Note: Beginning with the 2014 Mental Illness in Jails Survey, mental illness percentages were calculated using inmate counts, and not average daily populations. In Table 2, 2013 and 2012 have been recalculated using counts instead of ADP. Note: The population count used to calculate mental illness percentages is the number of inmates confined long enough to have received a mental health assessment by a qualified mental health professional, should a screening indicate that an assessment was necessary. The determination of whether or not an inmate was confined long enough to have been assessed is made based upon each jail’s answer to question 20b of the survey. The count also excludes inmates held solely on a drunk in public or simple drug possession charge for jails which indicated in questions 4b and 4d that they would not screen these inmates. Note: Total General Population Inmate Count = 47,147; Projected General Population Inmate Count incarcerated long enough to be assessed = 39,888. Note: The total inmate count includes inmates counted one time for each jail in which they were held during the month of June, 2016.

5
Mental Illness Statistics Mental illness is defined as an individual who has been diagnosed with schizophrenia or a delusional disorder, bi-polar or major depressive, mild depression, an anxiety disorder, post-traumatic stress disorder (PTSD), or any other mental illness as set out by the Diagnostic & Statistical Manual of Mental Disorders (DSM-V), published by the American Psychiatric Association, or those inmates who are suspected of being mentally ill but have received no formal diagnosis.
There were a total of 6,554 inmates known or suspected to be mentally ill in jails during the month of June, 2016. Of these mentally ill inmates, 28.75% were female and 71.25% were male, and 48.95% were pre-trial and 51.05% were post-conviction.
A serious mental illness includes diagnoses of schizophrenia/delusional, bi-polar/major depressive or post-traumatic stress disorder. Survey responses indicate that 51.21% of the mentally ill population and 8.41% of the general population have been diagnosed as having a serious mental illness.
Table 3: Number of Inmates with Mental Illness
Year Num Inmates with MI Female % Male % Pre-Trial % Post-Con %
2016 6,554 28.75% 71.25% 48.95% 51.05%
2015 7,054 29.43% 70.57% 45.92% 54.08%
2014 6,787 27.04% 72.96% 49.90% 50.10% 2013 6,346 27.80% 72.20% 48.12% 51.88%
2012 6,322 23.16% 76.84% 47.33% 52.67%
2011 6,481 28.30% 71.70% 45.55% 57.66%
2010 4,867 26.81% 73.19% n/a n/a
2009 4,278 27.07% 72.93% n/a n/a
2008 4,879 n/a n/a n/a n/a
6
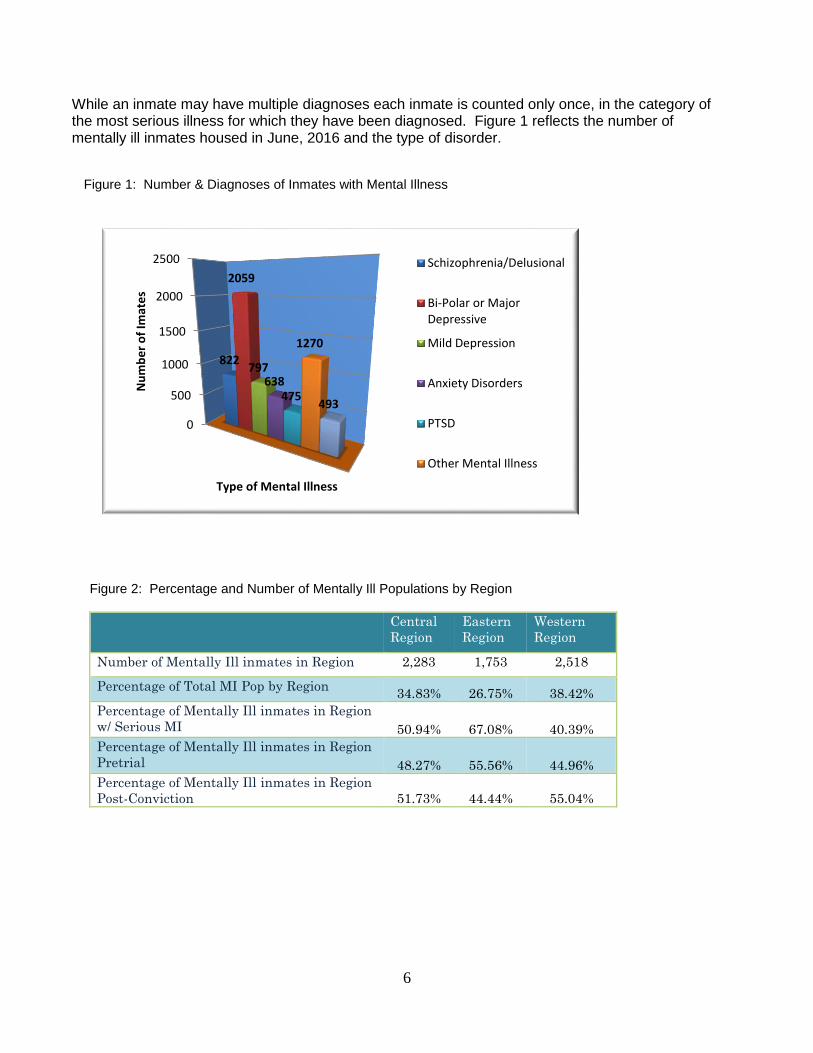
While an inmate may have multiple diagnoses each inmate is counted only once, in the category of the most serious illness for which they have been diagnosed. Figure 1 reflects the number of mentally ill inmates housed in June, 2016 and the type of disorder.
Figure 1: Number & Diagnoses of Inmates with Mental Illness
Figure 2: Percentage and Number of Mentally Ill Populations by Region
Central
Region
Eastern
Region
Western
Region
Number of Mentally Ill inmates in Region 2,283 1,753 2,518
Percentage of Total MI Pop by Region 34.83% 26.75% 38.42%
Percentage of Mentally Ill inmates in Region
w/ Serious MI 50.94% 67.08% 40.39%
Percentage of Mentally Ill inmates in Region
Pretrial 48.27% 55.56% 44.96%
Percentage of Mentally Ill inmates in Region
Post-Conviction 51.73% 44.44% 55.04%
0
500
1000
1500
2000
2500
822
2059
797 638
475
1270
493
Nu
mb
er
of
Imat
es
Type of Mental Illness
Schizophrenia/Delusional
Bi-Polar or MajorDepressive
Mild Depression
Anxiety Disorders
PTSD
Other Mental Illness

7
Figure 3 shows the number and percentage that each mental illness represents in both the Female and Male mentally ill populations.
Figure 3: Number & Percentage of M/F Mentally Ill Population Diagnoses
A diagnosis of bi-polar/major depressive continues to be the most prevalent for both males and females. In this year’s survey, a diagnosis of bi-polar/major depressive accounted for 31.42% of all reported mental illness.
The general population inmate count used to calculate the percentages of mental illness in this section is 39,888.
Table 4: Percentage of the General Population with Mental Illness/Serious Mental Illness
Year Mental Illness Serious Mental Illness
2016 16.43% 8.41%
2015 16.81% 7.87%
2014 13.95% 7.50%
2013 13.45% 7.53%
2012 11.07% 5.33%
2011 12.08% 5.99%
Note: Beginning with the 2014 Mental Illness in Jails Survey, mental illness percentages were calculated using inmate counts, not average daily populations. Note: The population counts used to calculate mental illness percentages are the number of inmates confined long enough to have received a mental health assessment by a qualified mental health professional, should a screening indicate that an assessment was necessary. The determination of whether or not an inmate was confined long enough to have been assessed is made based upon the jails answer to question 20a of the survey. This count also excludes inmates held solely on a drunk in public or simple drug possession charge for jails who indicated in questions 4b and 4d that they would not screen these inmates. Note: Total General Population Inmate Count = 47,147; Projected General Population Inmate Count incarcerated long enough to be assessed = 39,888. Note: The percentage of mentally ill inmates in the total general population without excluding inmates which the jails indicated would typically not have been assessed would have been 13.90%. The percentage of seriously mentally ill inmates in the total general population without excluding inmates which the jails indicated would typically not have been assessed would have been 7.12%.
Schizo/
Delusional
Bi-
Polar/Major
Depressive
Mild
Depression
Anxiety
Disorders
PTSD
Other
Mental
Illness
Mentally
Ill w/no
Diag
Female 146 729 224 187 155 298 145
Male 676 1330 573 451 320 972 348
Female 7.75% 38.69% 11.89% 9.93% 8.23% 15.82% 7.70%
Male 14.48% 28.48% 12.27% 9.66% 6.85% 20.81% 7.45%

8
Veterans and Homeless New to the survey this year were questions regarding inmates’ veteran and homelessness status. Collection of this data is a step toward quantifying a connection between mental illness and certain outside factors. The data regarding veteran and homelessness status is as reported to the jail by the inmates and not all jails currently collect this data. Therefore these figures are likely an incomplete representation of the numbers of veterans and homeless incarcerated in jails.
Out of 818 inmates identifying themselves as veterans, 264, or 32.27%, were identified by the jail as having a mental illness. Of the veteran group, 157, or 19.19%, were identified by the jail as having a mental illness as well as a co-occurring substance abuse disorder.
Out of 908 inmates identifying themselves as being homeless, 290, or 35.45%, were identified by the jail as having a mental illness. Of the homeless group, 205, or 25.06%, were identified by the jail as having a mental illness as well as a co-occurring substance abuse disorder.
Screenings & Assessments
Screening The purpose of a mental health screening is to make an initial determination of an individual’s mental health status, using a standardized, validated instrument. Out of all reporting jails, 51 of 59, or 86.44%, conduct a mental health screening for all inmates upon admission to the jail. The provider conducting mental health screenings, as well as the screening instrument used, may differ between facilities. The Brief Jail Mental Health Screen is the instrument used most often (49.15% of jails who screen).
Figure 4 shows the percentage of screenings conducted by each provider.
Figure 4: Provider of Jail Mental Health Screenings.
Jail Officers 40%
Jail MH Staff 17%
Other MH Prof 43%

9
Table 5: Percentage of Jails That Reported All Inmates Screened for MI at Admission
Year Percentage
2016 86.44%
2015 91.38%
2014 94.74%
2013 89.66%
2012 77.42%
2011 85.71%
Note: “Other Mental Health Professionals” includes psychiatrists, medical doctors, nursing staff, etc. Note: A copy of the Brief Jail Mental Health Screen may be found in Appendix D

10
Assessment
Dependent upon the results of an initial mental health screening, a comprehensive mental health assessment may also be conducted. A comprehensive mental health assessment is a review of a client’s clinical condition conducted by a trained mental health or medical professional which
provides an in depth determination of a person’s mental health status and treatment needs.
44 jails, or 75.86%, conduct assessments on all inmates who receive a positive screening for mental illness.
13 jails, or 22.41%, conduct assessments only on inmates with acute symptoms of mental illness.
1 jail reported that they do not conduct assessments at all.
13 jails reported that their procedures are adjusted over the weekends or on holidays. Most of these jails reported that they do continue to screen, during booking, but assessments are not conducted during the weekend unless jail staff deems it to be an acute case.
As with initial screenings, the type of individual conducting comprehensive mental health assessments, as well as the method of assessment, differs between facilities. Comprehensive assessments are conducted by the types of mental health providers shown in Figure 5.
Figure 5: Provider of Jail Comprehensive Mental Health Assessment.
Jail MH Staff 19%
CSB 39%
Other MH Prof 42%
11
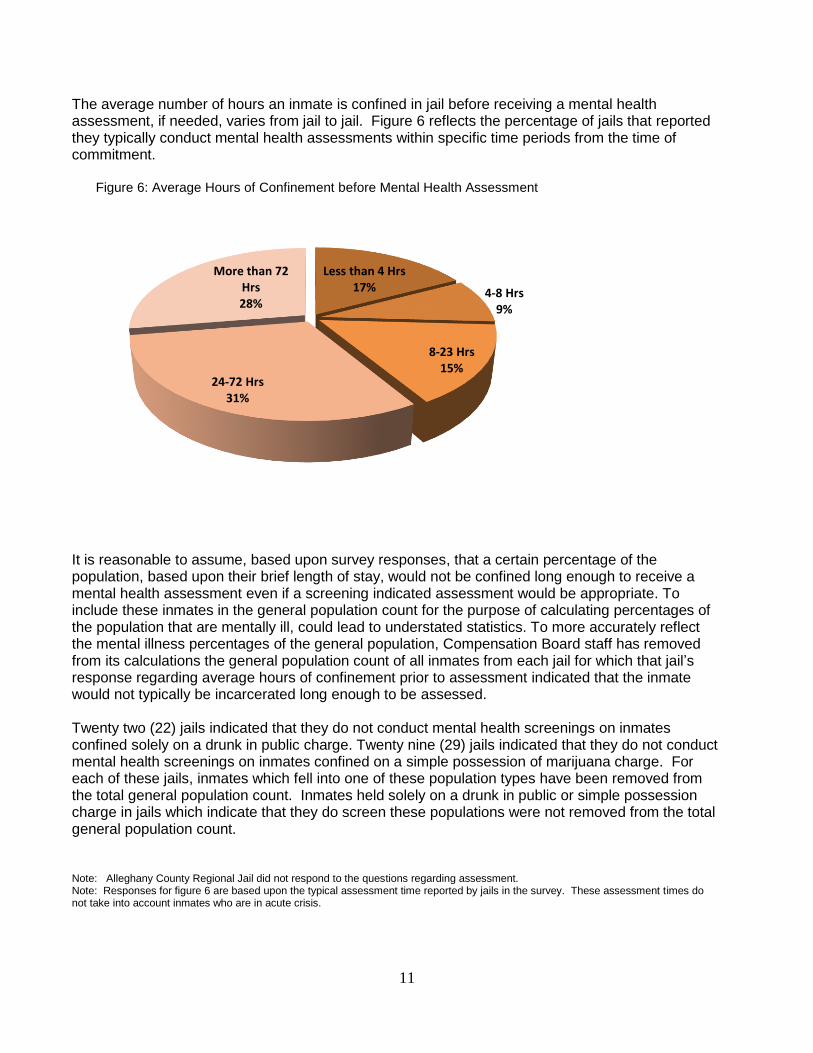
The average number of hours an inmate is confined in jail before receiving a mental health assessment, if needed, varies from jail to jail. Figure 6 reflects the percentage of jails that reported they typically conduct mental health assessments within specific time periods from the time of commitment.
Figure 6: Average Hours of Confinement before Mental Health Assessment
It is reasonable to assume, based upon survey responses, that a certain percentage of the population, based upon their brief length of stay, would not be confined long enough to receive a mental health assessment even if a screening indicated assessment would be appropriate. To include these inmates in the general population count for the purpose of calculating percentages of the population that are mentally ill, could lead to understated statistics. To more accurately reflect the mental illness percentages of the general population, Compensation Board staff has removed from its calculations the general population count of all inmates from each jail for which that jail’s response regarding average hours of confinement prior to assessment indicated that the inmate would not typically be incarcerated long enough to be assessed. Twenty two (22) jails indicated that they do not conduct mental health screenings on inmates confined solely on a drunk in public charge. Twenty nine (29) jails indicated that they do not conduct mental health screenings on inmates confined on a simple possession of marijuana charge. For each of these jails, inmates which fell into one of these population types have been removed from the total general population count. Inmates held solely on a drunk in public or simple possession charge in jails which indicate that they do screen these populations were not removed from the total general population count.
Note: Alleghany County Regional Jail did not respond to the questions regarding assessment. Note: Responses for figure 6 are based upon the typical assessment time reported by jails in the survey. These assessment times do not take into account inmates who are in acute crisis.
Less than 4 Hrs 17% 4-8 Hrs
9%
8-23 Hrs 15%
24-72 Hrs 31%
More than 72 Hrs 28%

12
Housing
The housing of mentally ill inmates differs from jail to jail.
21 out of 59 reporting jails have mental health units or bed areas separate from the General Population. In these 21 jails, there are 280 beds for Females and 671 beds for Males.
Jails reported that a total of 2,928 beds would be needed to house all inmates with non-acute mental illness in mental health beds or units, which would currently require 1,977 additional beds.
Of the 6,554 identified mentally ill inmates, 881 were housed in isolation. 25 of the 42 jails that housed mentally ill inmates in isolated or segregated cells did not operate a Mental Health Unit (407 inmates). If a mental health unit existed in the facility, it is possible that these inmates may not have had to be housed in isolation.
19 jails have noted that they would consider hosting a state-funded Mental Health Residential Treatment Program.
There is no state funded Mental Health Residential Treatment Program operating within jail facilities at this time.
A temporary detention order (TDO) may be issued by a court or magistrate if an individual meets the criteria as set out by § 19.2-169.6. and/or § 37.2-809. Prior to the issuance of a TDO an evaluation must be conducted by the local Community Services Board or their designee. Within 72 hours from the issuance of a TDO a hearing must be held to determine whether there is justification for a psychiatric commitment.
A total of 13 inmates were housed in jails more than 72 hours following the issuance of a TDO during the month of June, 2016.
Note: 2014 Virginia Acts of Assembly, Chapters 691 and 761, increased the maximum number of hours an individual may be held under temporary detention prior to a hearing from 48 hours to 72. Note: Language of § 19.2-169.6. and § 37.2-809 may be found in Appendix Q.

13
Mental Health Treatment Services Provided
Mental health treatment services offered, as well as providers of those services, differ from jail to jail. Some jails may have a full time psychiatrist or general practice physician (MD) to attend to mental health needs and dispense psychotropic medications; other jails may contract with an outside psychiatrist/general practice physician (MD) to provide services on certain days of each month, etc. Nursing staff may also provide mental health treatment. Treatment Hours & Providers In 2016 Community Service Boards (CSBs) were reported to provide the most significant portion of mental health treatment in jails. This was a shift from private contractors having been the largest reported provider in 2015. Over the last few years the data reported in the survey reflects continual shifts in largest provider of treatment between private contractors and the CSBs. Community Services Boards have a statutory requirement to evaluate inmates for whom a temporary detention
order is being sought (§37.2-809), however they have no statutory obligation to provide treatment in
the jail, and not all of the CSBs have the resources to provide services beyond their statutory requirements. The shifts in prevalence of treatment provided from CSBs v. private contractors may be related to biannual changes in the budget and resources of the CSBs.
Although on average the CSB is the most often used provider of mental health treatment, use of the local CSB as the primary treatment provider is most prevalent in jails in the Central Region (see Appendix C for a list of jails). In the Eastern and Western Regions the largest overall provider of treatment is still private contractors. This may also be due to the budget and/or resource constraints of the local CSBs in those regions, or may be by preference of the local or regional jail. Community Services Boards are both state and locally funded so their ability to provide services may vary greatly.
Figure 7: Average Number of Treatment Hours per Type of Provider in June, 2016
Provider
Central
Region
Western
Region
Eastern
Region
Psychiatrists 30.45 18.78 28.94
Medical
Doctors 3.68 6.33 5.28
Jail Mental
Health Staff 34.73 13.28 128.00
Community
Services Board 364.64 20.39 84.11
Private
Contractors 81.18 35.61 142.83
Provider
Average # of MH
Trtmt Hrs Provided
Psychiatrists 26.36
Medical Doctors 5
Jail Mental Health
Staff
57.02
Community Services
Board
170.74
Private Contractors 86.17

14
The information provided below is for the month of June, 2016.
A total of 20,027 treatment hours were provided in 58 of 59 jails, including treatment by any provider included in Figure 7. This is an increase of 6,260 hours over 2015 (13,767).
All data reflected in Figures 7, 8 and 9 and Tables 6 and 7 are for a mentally ill population of 6,503 plus a population of 4,757 inmates reported to have a substance abuse disorder without co-occurring mental illness.
In addition to in-jail treatment, 41 jails reported providing follow-up case management for mentally ill inmates after their release from the jail. Hours related to follow-up case management are not included in any figures in this section. Specific information regarding type of post-release assistance is not currently collected by the survey.
Figure 8 reflects the hours of treatment given by provider
Figure 8: Hours of Treatment Provided
The 2016 top five jails with the highest number of hours of treatment provided for the month reported in the survey were: Alexandria City Jail (4,327), Riverside Regional Jail (2,140), Prince William-Manassas Regional Jail (2,082), Fairfax County Jail (1,640) and Arlington County Jail (708).
Table 6: Historical Treatment Hours
Year Psychiatrist MD Jail MH Staff CSB Private Contractor
2016 1,529 290 3,307 9,903 4,998
2015 1,411 235 1,246 4,810 6,061
2014 1,125 309 1,715 5,649 3,700
2013 1,235 212 2,667 5,935 6,744
2012 1,316 406 1,436 7,204 7,013
2011 1,160 260 4,286 6,681 5,351
2010 1,309 202 2,666 4,760 2,484
2009 1,008 229 2,673 9,336 2,163
2008 251 100 520 1,872 935
0
2000
4000
6000
8000
10000
1529
290
3307
9903
4998
Ho
urs
of
Tre
atm
en
t
Treatment Provider
Psychiatrist
MD
Jail MH Staff
CSB
Priv Contractors

15
Figure 9 shows the percentage that each provider comprises of the total treatment hours reported. Figure 9: Providers of Treatment
Table 7: Historical Percentage of Treatment by Provider
Year Psychiatrists MD Mental Health Staff Private Contractors CSB
2016 8% 1% 17% 25% 49%
2015 10% 2% 9.% 44% 35%
2014 7% 2% 10% 23% 58%
2013 7% 2% 16% 40% 35%
2012 8% 2% 8% 40% 42%
2011 7% 1% 24% 30% 38%
2010 11% 2% 23% 22% 42%
2009 7% 1% 17% 14% 61%
Note: Alleghany County Regional Jail did not submit responses to the survey question regarding provider of treatment.
Psychiatrist 8%
MD 1%
Jail MH Staff 17%
CSB 49%
Priv Contractors
25%

16
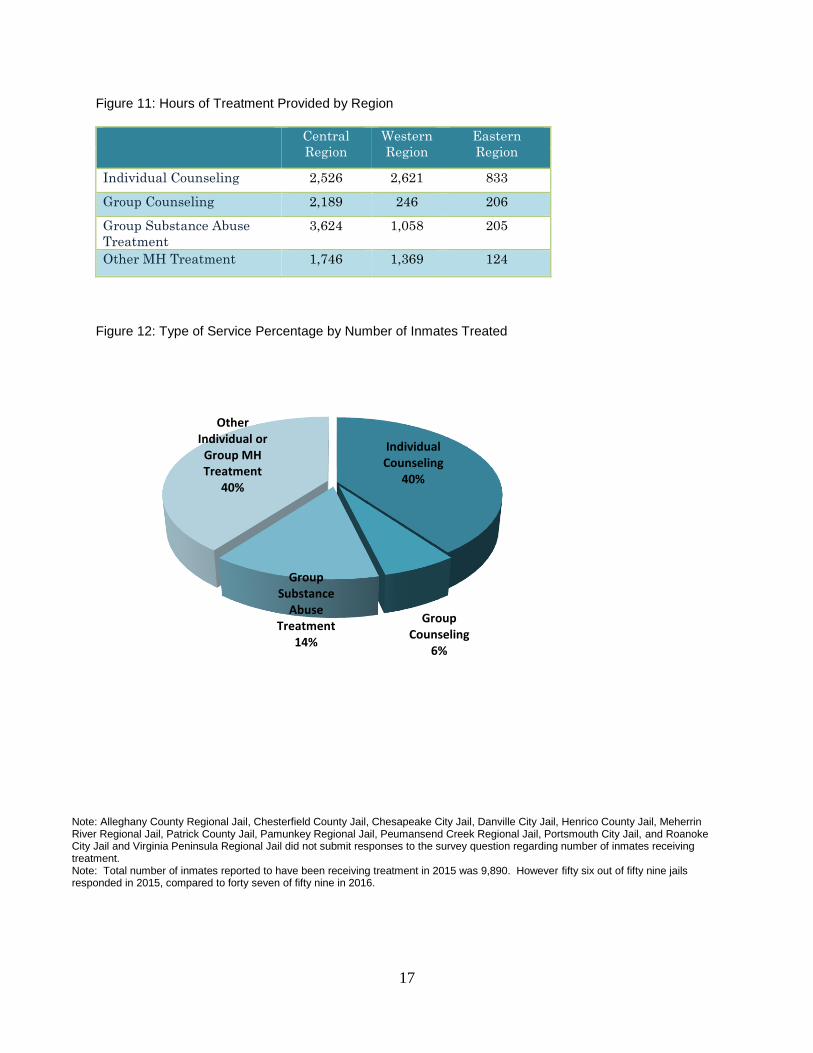
Treatment Services An inmate may receive multiple types of treatment. Treatment may be given by any of the providers referenced previously in Figure 7 (psychiatrists, medical doctors, jail mental health staff, community services board, private contractors). Treatment includes any individual/group counseling or substance abuse services, but does not include dispensing of medication. Forty-seven (47) of the 59 reporting jails provided data on the number of inmates receiving treatment services in the categories shown below in their facilities. All inmate numbers reflected in Figures 10, 11, and 12 are from a general population of 32,845 and a mentally ill population of 5,395.
8,042 inmates received an individual type of mental health or substance abuse treatment during the month of June, 2016 (indicating some inmates received multiple types of treatment).
Figure 10: Type of Treatment Provided
Not all facilities provide all of the above services
0
500
1000
1500
2000
2500
3000
3500 3220
500
1121
3201
Inm
ate
s R
ece
ivin
g Tr
eat
me
nt
Treatment Provided
Individual Counseling
Group Counseling
Group Substance AbuseTreatment
Other Individual or GroupMH Treatment
17
Figure 11: Hours of Treatment Provided by Region
Central
Region
Western
Region
Eastern
Region
Individual Counseling 2,526 2,621 833
Group Counseling 2,189 246 206
Group Substance Abuse
Treatment
3,624 1,058 205
Other MH Treatment 1,746 1,369 124
Figure 12: Type of Service Percentage by Number of Inmates Treated
Note: Alleghany County Regional Jail, Chesterfield County Jail, Chesapeake City Jail, Danville City Jail, Henrico County Jail, Meherrin River Regional Jail, Patrick County Jail, Pamunkey Regional Jail, Peumansend Creek Regional Jail, Portsmouth City Jail, and Roanoke City Jail and Virginia Peninsula Regional Jail did not submit responses to the survey question regarding number of inmates receiving treatment. Note: Total number of inmates reported to have been receiving treatment in 2015 was 9,890. However fifty six out of fifty nine jails responded in 2015, compared to forty seven of fifty nine in 2016.
Individual Counseling
40%
Group Counseling
6%
Group Substance
Abuse Treatment
14%
Other Individual or
Group MH Treatment
40%

18
Medication Some inmates with mental illness require the assistance of psychotropic medications. Psychotropic refers to mood altering drugs which affect mental activity, behavior, or perception. Often these medications are provided and dispensed by the jail. However, as noted in the survey, there are certain medications that some jails do not provide. In certain cases an inmate’s medication may be delivered to the jail by a 3rd party, such as a physician treating the offender pre-incarceration, or a family member authorized by the jail to bring the necessary prescribed medication.
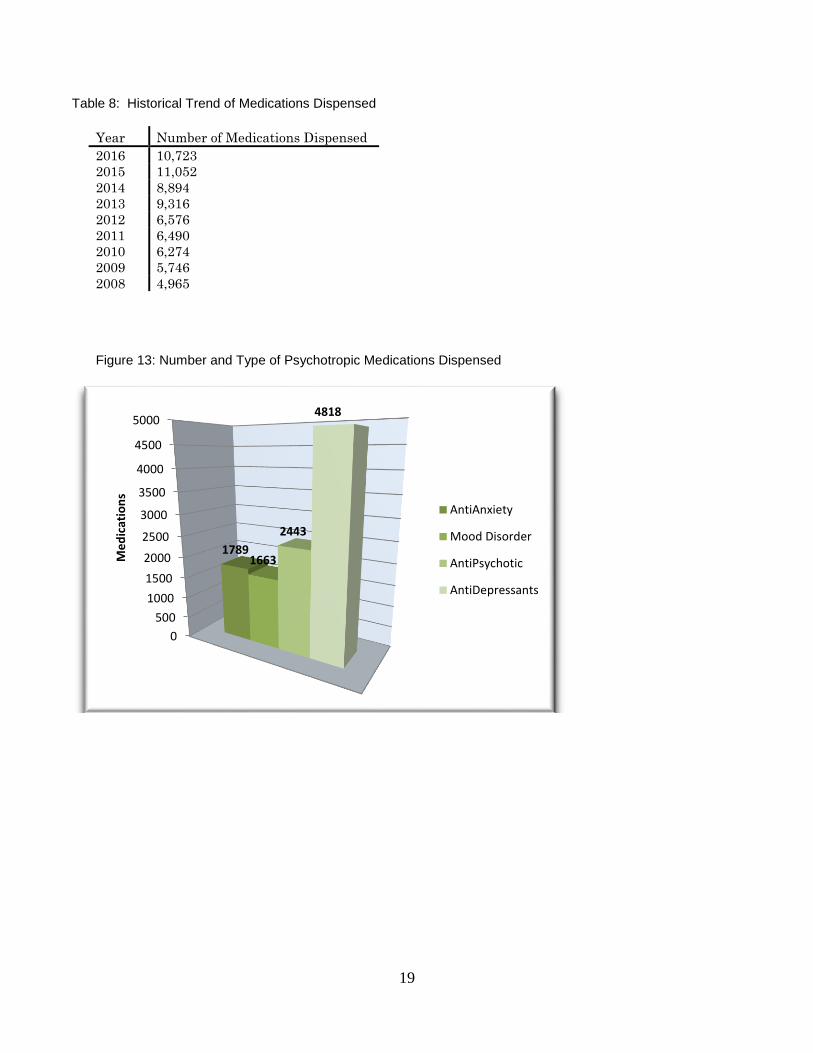
Psychotropic medications are broken down into 4 categories: antipsychotic, mood stabilizer/anticonvulsant, anti-depressant and anti-anxiety.
Antipsychotic medications include drugs such as: Haldol, Zyprexa, Risperdal, Seroquel, Triliafon, Prolixin, Thorazine, Abilify, Geodon, Clozaril
Mood Stabilizer/Anticonvulsant medications include drugs such as: Depakote, Lithium, Tegretal, Topamax, and Trileptal
Anti-depressant medications include drugs such as: Prozac, Zoloft, Lexapro, Wellbutrin, Paxil, Elavil, Pamelor, and Desyrel
Anti-anxiety medications include drugs such as: Ativan, Xanax, Librium and Valium During June, 2016 there were 10,723 prescriptions for psychotropic medications being dispensed in local and regional jails. The number of medications administered may exceed the number of inmates receiving treatment, as an inmate may be taking more than one medication. There were 329 fewer distributed medications reported in 2016 than in 2015 (11,052). It has been noted by several jails that it is less expensive to provide mentally ill inmates medication than it is to provide treatment services.
A total of 1,623 jail inmates with mental illness refused psychotropic medication. This is 24.76% of the mentally ill population (there is no current statute that gives jails the authority to forcibly administer medications). In the 2016 survey, jails were asked to report their procedure when an inmate refuses medications. Responses varied, but the most commonly reported actions taken were: require the inmate to sign a refusal form; refer the inmate to the psychiatrist or other qualified mental health professional for counseling; and monitor inmate for changes in behavior.
19
Table 8: Historical Trend of Medications Dispensed
Year Number of Medications Dispensed
2016 10,723
2015 11,052
2014 8,894
2013 9,316
2012 6,576
2011 6,490
2010 6,274
2009 5,746
2008 4,965 Figure 13: Number and Type of Psychotropic Medications Dispensed
0
500
1000
1500
2000
2500
3000
3500
4000
4500
5000
1789 1663
2443
4818
Me
dic
atio
ns
AntiAnxiety
Mood Disorder
AntiPsychotic
AntiDepressants
20
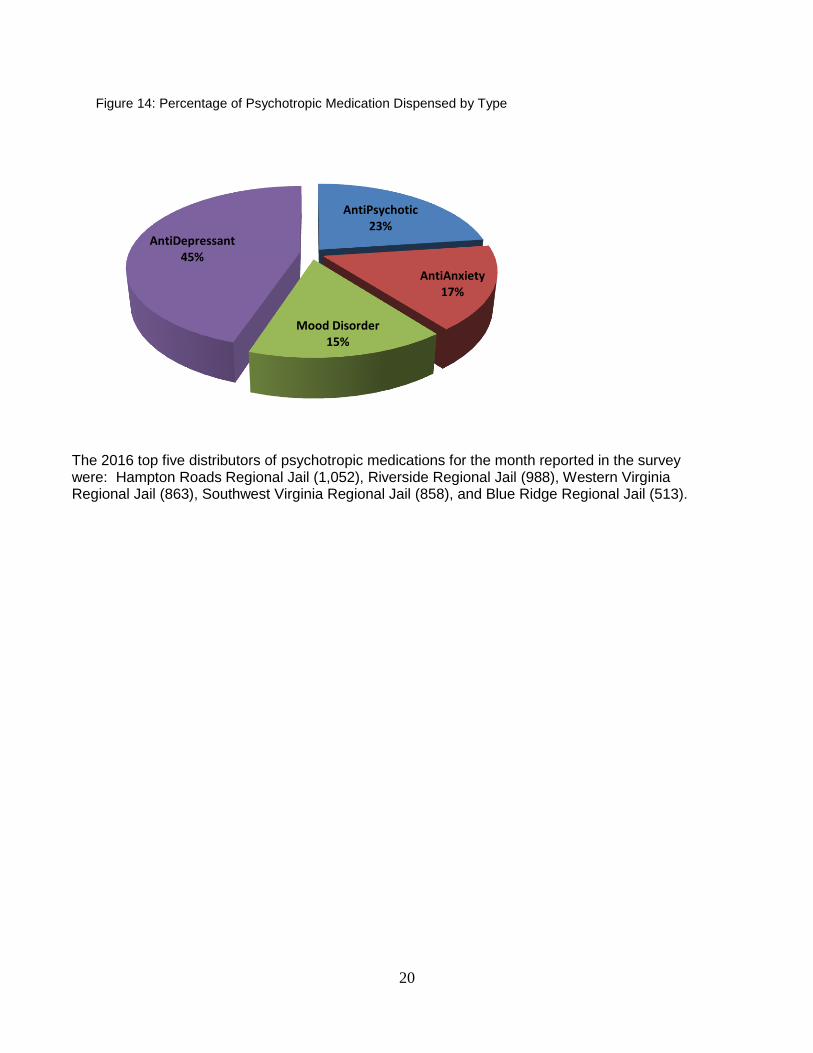
Figure 14: Percentage of Psychotropic Medication Dispensed by Type
The 2016 top five distributors of psychotropic medications for the month reported in the survey were: Hampton Roads Regional Jail (1,052), Riverside Regional Jail (988), Western Virginia Regional Jail (863), Southwest Virginia Regional Jail (858), and Blue Ridge Regional Jail (513).
AntiPsychotic 23%
AntiAnxiety 17%
Mood Disorder 15%
AntiDepressant 45%

21
Substance Abuse/Special Education
Of the 6,554 inmates with mental illness, 3,204 had a co-occurring substance use/abuse disorder, or about 48.89% of the mentally ill jail population.
Those inmates with co-occurring mental illness and substance use/abuse disorder comprised 8.03% of the general jail population.
4,757 inmates without mental illness were reported to have substance use/abuse disorders, representing about 11.93% of the general population.
As illustrated earlier in Figure 12, 14% of all inmates receiving jail provided treatment services are receiving group substance abuse treatment.
The general population inmate count used to calculate the percentages of mental illness in this section is 39,888.
Federal regulations mandate that all correctional facilities provide access to special education for inmates. During the month of June, 2016, 155 inmates were receiving special education.
Note: The population counts used to calculate mental illness percentages are the number of inmates confined long enough to have received a mental health assessment by a qualified mental health professional, should a screening indicate that an assessment was necessary. The determination of whether or not an inmate was confined long enough to have been assessed is made based upon the jails answer to question 20b of the survey. This count also excludes inmates held solely on a drunk in public or simple drug possession charge in jails which indicated in questions 4b and 4d that they would not screen these inmates.

22
Mental Illness & Offense Type
For each inmate identified as mentally ill, jails were asked to note the most serious offense type on which the offender was held. The following are the offense types, listed in order of severity: violent felony, drug felony, non-violent felony, violent misdemeanor, drug misdemeanor, and non-violent misdemeanor. Most serious offense classification is based on the most serious offense with which an inmate is currently charged, and not necessarily of which the inmate is ultimately convicted.
Of the 6,554 inmates with mental illness, jails reported the most serious offense type for 99.33%, or 6,510 of them. Of the inmates for whom the most serious offense type was reported, 80.58% had felony offenses, 16.85% were held on misdemeanor offenses and 2.57% were held on ordinance offenses. Table 9: Percentage of Mental Illness by Offense Type-Crime Type
Year Felony Misdemeanor Ordinance
2016 80.58% 16.85% 2.57%
2015 75.85% 22.04% 2.12%
2014 76.96% 20.68% 2.36%
2013 69.70% 26.93% 3.38%
2012 73.39% 24.02% 2.60%
2011 76.95% 20.96% 2.09%
Table 10: Percentage of Most Serious Offense-Crime Type of the General Population
Year Felony Misdemeanor Ordinance
2016 67% 29% 4%

23
Figure 15 illustrates the percentage each offense type comprises of the total mentally ill population reported in question 8 of the survey, which references Most Serious Offense. The count of mentally ill inmates used for this graph does not include 167 inmates held for ordinance violations.
Figure 15: Percentage of Mental Illness by Most Serious Offense Type (Crime Severity)
Figure 16 illustrates the percentage each offense type comprises of the total general population.
Figure 16: Percentage of General Population by Most Serious Offense Type (Crime Severity)
Violent 29%
Non Violent 51%
Drug 20%
Violent Count 17%
NonViolent Count 65%
Drug Count 18%

24
Figure 17 illustrates the percentage each offense comprises of each diagnosis.
Figure 17: Mental Illness Categories & Offense Type
Felony
Violent
Felony
Drug
Felony
Non-
Violent
Mis
Violent
Mis
Drug
Mis
Non-
Violent
ORD
Schizophrenia/Delusional 32.29% 11.18% 36.06% 3.02% 2.39% 12.81% 2.26%
Bi-Polar/Major Depressive
24.81% 15.90% 41.51% 2.28% 3.32% 10.30% 1.88%
Mild Depression 23.33% 16.75% 36.60% 2.73% 2.85% 14.27% 3.47%
Anxiety Disorder 19.15% 20.41% 36.26% 2.83% 3.14% 13.66% 4.55%
PTSD 25.00% 19.13% 36.17% 2.84% 3.41% 10.42% 3.03%
Other Mental Illness 27.38% 18.36% 37.45% 3.09% 1.71% 9.26% 2.76%
Mentally Ill w/ No Diagnosis 16.23% 19.07% 46.65% 1.22% 3.65% 12.37% 0.81%
Figure 18 illustrates the regional offense type percentage of mentally ill inmates for whom most serious offense type was reported.
Figure 18: Mental Illness and Offense Type Percentage by Region
Central
Region
Western
Region
Eastern
Region
Felony 75.94% 88.92% 78.87%
Misdemeanor 19.62% 10.06% 19.14%
Ordinance 4.44% 1.02% 1.99%
Figure 19 illustrates the regional crime type percentage of mentally ill inmates for whom most serious offense type was reported. This table does not include inmates whose most serious offense was an ordinance violation.
Figure 19: Mental Illness and Crime Type Percentage by Region
Central
Region
Western
Region
Eastern
Region
Violent 27.33% 33.52% 23.27%
Non-Violent 46.82% 51.59% 47.58%
Drug 19.58% 14.49% 23.43%
25
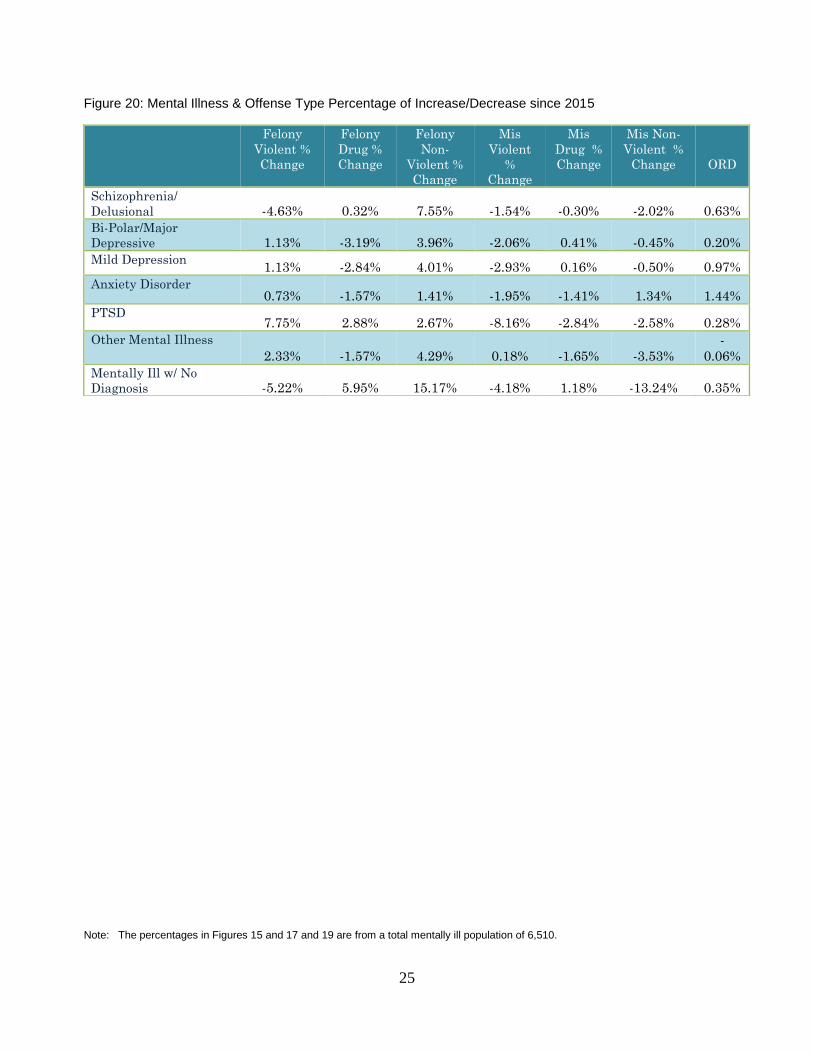
Figure 20: Mental Illness & Offense Type Percentage of Increase/Decrease since 2015
Note: The percentages in Figures 15 and 17 and 19 are from a total mentally ill population of 6,510.
Felony
Violent %
Change
Felony
Drug %
Change
Felony
Non-
Violent %
Change
Mis
Violent
%
Change
Mis
Drug %
Change
Mis Non-
Violent %
Change
ORD
Schizophrenia/
Delusional -4.63% 0.32% 7.55% -1.54% -0.30% -2.02% 0.63%
Bi-Polar/Major
Depressive 1.13% -3.19% 3.96% -2.06% 0.41% -0.45% 0.20%
Mild Depression 1.13% -2.84% 4.01% -2.93% 0.16% -0.50% 0.97%
Anxiety Disorder 0.73% -1.57% 1.41% -1.95% -1.41% 1.34% 1.44%
PTSD 7.75% 2.88% 2.67% -8.16% -2.84% -2.58% 0.28%
Other Mental Illness
2.33% -1.57% 4.29% 0.18% -1.65% -3.53%
-
0.06%
Mentally Ill w/ No
Diagnosis -5.22% 5.95% 15.17% -4.18% 1.18% -13.24% 0.35%
26
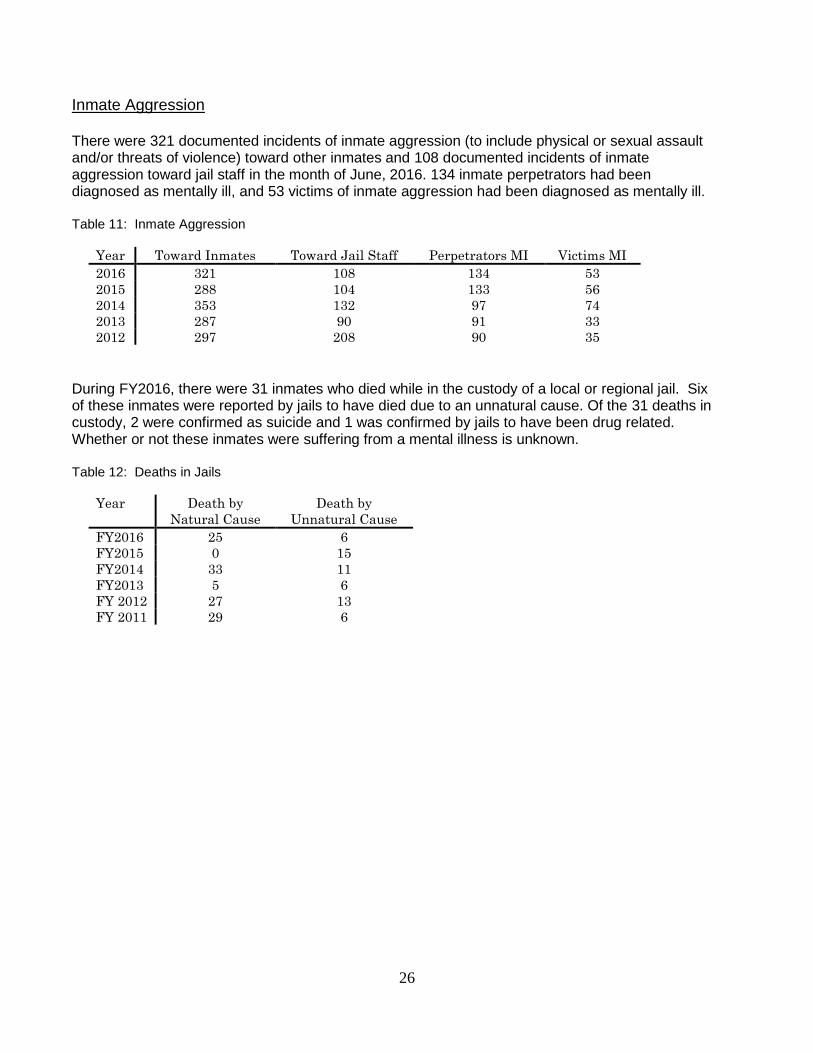
Inmate Aggression There were 321 documented incidents of inmate aggression (to include physical or sexual assault and/or threats of violence) toward other inmates and 108 documented incidents of inmate aggression toward jail staff in the month of June, 2016. 134 inmate perpetrators had been diagnosed as mentally ill, and 53 victims of inmate aggression had been diagnosed as mentally ill.
Table 11: Inmate Aggression
Year Toward Inmates Toward Jail Staff Perpetrators MI Victims MI
2016 321 108 134 53
2015 288 104 133 56
2014 353 132 97 74
2013 287 90 91 33
2012 297 208 90 35
During FY2016, there were 31 inmates who died while in the custody of a local or regional jail. Six of these inmates were reported by jails to have died due to an unnatural cause. Of the 31 deaths in custody, 2 were confirmed as suicide and 1 was confirmed by jails to have been drug related. Whether or not these inmates were suffering from a mental illness is unknown. Table 12: Deaths in Jails
Year Death by
Natural Cause
Death by
Unnatural Cause
FY2016 25 6
FY2015 0 15
FY2014 33 11
FY2013 5 6
FY 2012 27 13
FY 2011 29 6

27
Treatment Expenditures
The following reflects the cost of all mental health treatment, including medications, as reported by the jails for FY16. Some jails provided estimated or pro-rated annual costs; total figures have not been audited. Seven jails did not report cost information for medications; seven jails did not report the cost of mental health services, excluding medications.
The total reported cost of all psychotropic medications administered was $3.7 million.
The total reported cost of mental health services, excluding medication but including medical doctors and nursing, was $10.3 million.
Total cost of mental health treatment was estimated at approximately $14 million in FY16, with 70.28% of these costs funded by the locality, 10.43% funded by the state, 1.37% funded by the federal government, 17.92% by other funding sources.
Table 13: Treatment Expenditures
Year
Medication
MH Services
Total Cost
2016 $3.7 million $10.3 million $14 million
2015 $5.1 million $9.1 million $14.2 million
2014 $3.6 million $9.1 million $12.7 million
2013 $2.7 million $8 million $10.7 million
2012 $3.7 million $9.6 million $13.3 million
Note: Botetourt County Jail, Charlotte County Jail, Henrico County Jail, Meherrin River Regional Jail, Pamunkey Regional Jail, Prince William-Manassas Regional Jail, reported a mentally ill population with medications dispensed but did not report the cost of medications. Note: Botetourt County Jail, Charlotte County Jail, Fauquier County Jail, Hampton City Jail, Henry County Jail, Prince William-Manassas Regional Jail and Western Virginia Regional Jail reported that mental health services were provided but did not report the cost of such services.

28
Jail Staff & Maintenance of Mental Health Data Depending on the operational capacity of the jail, the number of staff members, including jail officer/sworn deputies and civilian personnel, ranges from 18 to 557.
40 of 55 reporting jails provide mental health training to each new jail officer/deputy prior to his/her initial assignment to the jail. Of these jails, there is an average of 6.89 hours of mental health training provided per jail officer/deputy. Five jails provide 20 hours or greater of mental health training per jail officer/deputy prior to initial assignment.
31 of 55 reporting jails require jail officers/deputies to complete additional training in mental health topics annually. Of these jails, jail officers/deputies are required to complete an average of 3.53 hours of training in mental health topics each year.
Forty three (43) jails indicated that their jail’s electronic inmate management system includes mental health screening items, while 7 jails indicated that their electronic inmate management system includes inmate psychiatric diagnoses.
Commonwealth of Virginia Economic Factors While questions addressing local economic factors are not included in the Mental Illness in Jails survey, economic factors outside of the jail can certainly affect an individual’s access to mental health treatment and medications both within the jail and in the community. .
In CY2015 the state median income was $47,549. Across localities this ranges from median incomes as low as $28,116 to as high as $122,238. Comparisons between income data provided by the Weldon Cooper Center for Public Service and survey responses indicate a possible relationship between higher locality median incomes and mental health treatment provided in the jails that serve these localities. The top 5 jails reporting the highest number of mental health treatment hours in this year’s survey were Alexandria City Jail, Riverside Regional Jail, Prince William-Manassas Regional Jail, Fairfax County Jail and Arlington County Jail. With the exception of Riverside Regional Jail, these top providers of treatment hours had at least one participating jurisdiction in the top ten localities with the highest median incomes in the Commonwealth. These same four jails however are neither in the top five list of jails with the largest general inmate population nor in the top five list of jails with the largest reported number of mentally ill inmates. Additionally, four of the five jails with the highest reported number of mentally ill inmates are also in the top five list of dispensers of psychotropic medication. Numerous jails have indicated that medication is less expensive than other forms of treatment.
Note: Alleghany County Regional Jail, Botetourt County Jail, Henrico County Jail and Pamunkey Regional Jail did not provide responses to the questions regarding number of jail staff, Crisis Intervention Team Training and mental health training provided to jail staff annually. Note: Statewide demographic information was provided by the University of Virginia’s Weldon Cooper Center for Public Service.

29
Crisis Intervention Teams
The Department of Criminal Justice Services (DCJS) and the Department of Behavioral Health and Developmental Services (DBHDS) collaborate to support and administer Crisis Intervention Team (CIT) programs across the commonwealth. At its core, CIT provides 1) law enforcement crisis intervention training to enhance response to individuals exhibiting signs of a mental illness; 2) a forum to promote effective systems change and problem solving regarding interaction between the criminal justice and mental health care systems; and 3) improved community-based solutions to enhance access to services for individuals with mental illness. Successful CIT programs improve officer and consumer safety, reduce inappropriate incarceration and redirect individuals with mental illness from the criminal justice system to the health care system when to do so is consistent with the needs of public safety. Although CIT training is primarily for law enforcement, it is also offered to other first responders such as Fire and EMS, mental health staff, correctional officers, and others. In local and regional jails, the primary purpose of the CIT training is to help jail officers recognize when a person may be suffering from a mental illness, to give them a better awareness of the needs of individuals with mental illness and to give them the tools and strategies needed for de-escalation in a situation where a mentally ill offender appears to be in crisis. Forty five (45) of 55 reporting jails have jail officers/deputies who have completed Crisis Intervention Team (CIT) training. Of these jails, an average of 40.49 jail officers/deputies in each jail has completed CIT training, an increase of 37% from 2015 (29.44). Seven jails reported that at least half of their total staff has completed CIT training. CIT Programs are comprised of three components: a community engagement component, a training component, and an access to services component. The access to services component is typically achieved though Crisis Assessment Sites. To date, 28 CIT Assessment Site Programs operate out of 32 CIT Assessment Site locations. Assessment Sites are designed to enable police officers or sheriffs’ deputies to take a person experiencing a mental health crisis for quick and appropriate mental health assessment and linkage to treatment in lieu of arrest or jail. Additional information about Crisis Assessment Sites (including funding, assessment time and outcomes) may be reviewed in DBHDS’s FY2015 report at http://www.dbhds.virginia.gov/library/forensics/ofo%20%202015%20assess%20site%20annual%20report.pdf
Note: Alleghany County Regional Jail, Botetourt County Jail, Henrico County Jail and Pamunkey Regional Jail did not provide responses to the questions regarding number of jail staff, Crisis Intervention Team Training and mental health training provided to jail staff annually.

30
Final Remarks & Future Measures
Sheriffs and Jail Superintendents were notified in June, 2016 of survey deadlines and instructions, and were directed to an advanced copy of the mental health survey posted to the Compensation Board website. There were several updates to the survey instrument this year, the most notable is the collection of the number of veterans and homeless in each jail, as well as whether they have a mental illness and/or substance abuse disorder. Every year jails in Virginia face the challenge of identifying and adequately treating inmates with mental illness while maintaining a safe and disciplined jail environment. To assist in addressing the issue of mental illness in jails, the 2016 General Assembly allocated $1 million in FY17 and $2.5 million in FY18 to the Department of Criminal Justice Services (DCJS) to establish pilot programs in jails to provide services to mentally ill inmates and/or pre-incarceration crisis intervention jail diversion services. Nineteen jails submitted proposals to participate in the pilot program. Preliminary proposals submitted were reviewed and evaluated by DCJS, DBHDS, and the Compensation Board based upon the criteria as set forth in Item 398 of the 2016 Appropriation Act. As of September 22, 2016 the recommended pilot sites are as follows: Chesterfield County Jail, Hampton Roads Regional Jail, Middle River Regional Jail, Prince William-Manassas Regional Jail, Richmond City Jail, and Western Virginia Regional Jail. The selected jails are required to submit full proposals to DCJS for final approval prior to the awarding of funds in January, 2017.
The Compensation Board, with input and assistance from DBHDS and other appropriate executive agencies, the Virginia Sheriffs’ Association and the Virginia Association of Regional Jails, and staff of the Senate Finance and House Appropriations Committees will continue to review the survey instrument on an annual basis and make improvements and updates as needed. Further details of data gleaned from the 2016 mental illness survey and summarized in this report, including the survey instrument and organization of jail regions, are available in the appendices of this document. Data in this report continues to be utilized by DBHDS and other state agencies, along with the staff of the Senate Finance and House Appropriations Committee, for research, as well as to assist in the development of funding needs analysis for jail mental health treatment, jail diversion programs, expansion of Crisis Intervention Teams and post-confinement follow-up care.
31
APPENDICES
Appendix A: 2016 Virginia Local & Regional Jail Survey: Assessment and Treatment of
Inmates with Mental Illness Appendix B: Jail Regions Appendix C: Number & Diagnoses of Inmate Mental Illness in Jails Appendix D: Average Hours of Confinement Before Eligible for MH Assessment Appendix E: MH Screenings of Inmates Drunk in Public or Simple Drug Possession Appendix F: Veterans and Homeless Appendix G: Jails with a Mental Health Housing Unit Appendix H: Hours of Mental Health Services Provided Appendix I: Type of Mental Health Treatment Services Provided Appendix J: Mental Health Medication Dispensed Appendix K: Most Serious Offense of Inmates with Mental Illness in Jails Appendix L: Incidents of Inmate Aggression Appendix M: Mental Health Treatment Expenditures Appendix N: Brief Jail MH Screen Appendix O: CIT Programs & Assessment Sites

32
Appendix P: Amendments to Prior Years Appendix Q: Relevant Links

33
Appendix A: 2016 Mental Illness in Jails Survey
Virginia Local and Regional Jails Survey:
Assessment and Treatment of Inmates with Mental Illness
**Please do not attempt to complete this survey before July 1, 2016.**
The Virginia Sheriffs’ Association and the Virginia Association of Regional Jails have reviewed this survey, and encourage
their members to respond. Our goal is to provide information to the Compensation Board, the Virginia General Assembly,
and the Dept. of Behavioral Health and Developmental Services (DBHDS), regarding jail resource needs for appropriately
identifying and managing inmates with mental illness.
Below are a list of definitions that may be helpful in completion of this survey.
ADP: Average Daily Population of the jail. This information may be obtained from the LIDS Technician.
BHA: Behavioral Health Authority
Co-occurring disorder: (dual diagnosis) – a comorbid condition in which an individual is suffering from a
mental illness and substance abuse problem.
Clinical Diagnosis: a Diagnostic and Statistical Manual of Mental Disorder – Fourth Edition (DSMV)
Axis I or Axis II disorder/condition. In general, clinical diagnosis are determined by psychiatrists, licensed
clinical psychologists, licensed clinical social workers, or licensed professional counselors.
CSB: Community Services Board
DBHDS: Department of Behavioral Health and Developmental Services
Group Mental Health Counseling: Meeting of a group of individuals with a mental health clinician for
the purpose of providing psycho-education about various mental health topics and/or to provide group
feedback and support with regard to mental health issues. Examples could include stress management,
anger management, coping with depression, or NAMI meeting.
Group Substance Abuse Treatment: Meeting of a group of individuals with a substance abuse clinician
for the purpose of providing psycho education about various substance abuse topics and/or to provide group
feedback and support with regard to substance abuse issues. Examples could include AA meeting, NA
meeting, or relapse prevention groups.
Individual Counseling: one on one session with licensed professional with the expressed purpose of
improving the individual’s understanding of their issues, enhancing their ability to cope with issues,
and aiding them in the development of healthy coping skills.
MH: Mental Health
Mental health screening instrument: an instrument utilized to make an initial determination of an
individual’s mental health status, using standardized, validated instrument.
34
Two common types of screening instruments include, but are not limited to, the Brief Jail Mental Health
Screen (BJMHS) and the Jail Admission Screening Assessment Test (JASAT). The standard booking
questions related to mental health issues are not considered a screening instrument.
Mental health services: any type of service that helps treat or control an individual’s mental health
disorder(s). These can include but are not limited to individual mental health counseling, group mental
health counseling, case management, or other types of individual or group mental health treatment. Many
mental health services also address co-occurring substance-related disorders (see definition).
Mental Illness: conditions that disrupt a person's thinking, perceptions, feeling, mood, ability to relate to
others and/or daily functioning.
Most Serious Offense: Question 9 asks that you report an inmates’ offense type using their most serious
offense. Offense severity should be ranked as follows: Felony-Violent, Felony-Drug, Felony-Nonviolent,
Misdemeanor-Violent, Misdemeanor-Drug, Misdemeanor-Nonviolent
Professional mental health assessment: A review of a client’s clinical condition conducted by a trained
mental health or medical professional which provides an in depth determination of a person’s mental health
status and treatment needs.
Psychiatrist: a psychiatrist is a medical doctor who specializes and is certified in treating mental health
disorders.
Psychotropic medications: psychotropic medications are commonly used to treat mental health disorders
and are those which are capable of affecting the mind, emotions and behavior of an individual.
Qualified Mental Health Professional (QMHP): This definition may be reviewed from the website of
DBHDS. http://dbhds.virginia.gov/library/quality%20risk%20management/qmhp.pdf
Special Education Inmates: The Federal Government requires jails to provide Special Education to
inmates in need of it.
Substance abuse: a maladaptive pattern of substance use leading to clinically significant impairment or
distress.
Validated instrument: questionnaire which has undergone a validation procedure to show that it
accurately measures what it aims to do, regardless of who responds, when they respond, and to whom they
respond. The Brief Jail Mental Health Screen and the JASAT are examples of validated instruments.
35
Please provide the data for your jail by July 13, 2016.
Thank you for completing this survey. (Please be sure not to use commas in any numeric field)
Name of Jail/ADC:
Address: City: State: Zip:
Phone:
Fax:
Email address:
Sheriff/Chief Administrator:
Name of contact person completing survey:
Phone number of contact person:
Email address for contact person:
**Please do not attempt to answer questions 1-3. Compensation Board staff will populate this data from
your LIDS-CORIS June Financials**
1. The total ADP of the jail for June 2016 was inmates. Of the jail’s June 2016 ADP were female
and were male.
2. Please indicate below the ADP of inmates from each category that are included in Question 1 above:
o State responsible
o Local responsible
o Ordinance Violators
o Federal
o Other (excluding HEM)
Total (should match total ADP in Question 1)
3. Please indicate below the ADP of inmates from each category that are included in Question 1 above:
o Pre-trial
o Post-conviction
Total (should match total ADP in Question 1)
4a. The number of inmates charged with public intoxication housed in the jail during the month of June, 2016 was
.
4b. Are inmates charged with only public intoxication evaluated for mental illness or substance abuse?
36
o Yes
o No
4c. The number of inmates charged with possession of marijuana (simple possession) housed in the jail during the
month of June, 2016 was .
o Yes
o No
4d. Are inmates charged with only possession of marijuana (simple possession) evaluated for mental illness or
substance abuse?
o Yes
o No
5. Jail inmates with Substance Use/Abuse Disorders: There were inmates known or suspected to have
Substance Abuse Disorders but who have no clinically diagnosed or suspected, mental illness, in the jail during
the month of June 2016.
6. Special Education Jail Inmates. There were inmates receiving special education during the month of
June 2016.
7. Please indicate the number of inmates with mental illness in each of the categories below. Please count each
inmate only once for this item (unduplicated counts), counting only the most serious or prominent
diagnosis for that inmate. (Do not include federal or out-of-state contract inmates.) Be sure to indicate the
total number of inmate days for each category.
The LIDS June Payment Details Report can provide a pretrial jail roster to assist in separating pretrial from
post conviction inmates, as well as data on the number of inmate days. (May financials must be
certified/approved before June may be generated).
Please be sure to only include inmate days in the ‘Total Inmate Days’ not inmate counts. The final column is
not a sum of the counts in the first four columns.
Mental Illness Category
Females
(Pretrial)
in jail in
June 2016
Females
(PostConviction)
in jail in
June 2016
Males
(Pretrial)
in jail in
June 2016
Males
(PostConviction)
in jail in
June 2016
Total
Inmate
Days
Inmates with Schizophrenia, Schizoaffective Disorder
or Delusional Disorder
Inmates with Bipolar Disorder or Major Depressive
Disorder
Inmates with Dysthymic Disorder (mild depression)

37
Inmates with Anxiety Disorder
Post Traumatic Stress Disorder (PTSD)
Inmates with other mental illness diagnosis
Inmates believed by history, behavior or other
indicators to be mentally ill, for whom no clinical
diagnosis is available
Total number of inmates diagnosed with or
suspected to have a mental illness in this jail during
the month of June 2016
8.Please indicate the offense type of the mentally ill inmates in each category. Report the inmates’ offense type
using their most serious offense, for current confinement. (Do not include federal or out-of-state contract
inmates.)
In order to accurately complete this question the mental health staff must either provide the LIDS Technician
with a list of mentally ill inmates (this list does not need to include diagnoses) so that they may provide the
mental health staff with a most serious offense for each offender, or access LIDS themselves to determine the
most serious offense.
Mental Illness Category Ord
Viol
Mis
Nonviolent
Mis
Violent
Mis
Drug Felony
Nonviolent
Felony
Violent
Felony
Drug
Inmates with Schizophrenia, Schizoaffective
Disorder or Delusional Disorder
Inmates with Bipolar Disorder or Major
Depressive Disorder
Inmates with Dysthymic Disorder (mild
depression)
Inmates with Anxiety Disorder
Post Traumatic Stress Disorder (PTSD)
Inmates with other mental illness diagnosis
Inmates believed by history, behavior, or
other indicators to be mentally ill, for whom
no clinical diagnosis is available
Total number of inmates diagnosed with or
suspected to have a mental illness in this
jail during the month of June 2016
9a.During the month of June 2016, there were a total of inmates clinically diagnosed with co-occurring
mental illness and substance abuse disorder in the jail.
9b. During the month of June 2016 there were a total of inmates who were veterans, of which were
mentally ill and of which were clinically diagnosed with co-occurring mental illness and substance
abuse disorder.

38
9c. During the month of June 2016 there were a total of inmates who were homeless, of which were
mentally ill and of which were clinically diagnosed with co-occurring mental illness and substance
abuse disorder.
10. A total of jail inmates clinically diagnosed with mental illness were housed in medical isolation cells, or
other segregation cells in the jail during the month of June 2016 and spent a total of days in
isolation/segregation.
11. Does your jail have one or more mental health housing units or bed areas that are physically separated from
the general population and distinct from other medical bed units?
o Yes
o No
12. If your jail has a mental health unit or bed area, indicate the number of mental health treatment beds in that area:
o Total beds for male inmates with mental illness
o Total beds for female inmates with mental illness
o N/A
13. A total of mental health beds would be needed at this jail during the month of June 2016, to house all
inmates with mental illness in mental health beds or units.(This number should include all inmates
identified in Question 12).
14. Does your jail conduct a mental health screening upon admission, in addition to standard booking questions,
for some or all inmates?
(Check the item that applies to your jail.)
o All new admissions are screened for mental illness.
o Some new admissions are screened for mental illness.
(Estimated percentage of inmates screened) %)
o No, our jail does not screen for mental illness on admission.
o If screenings are not done at admission, when are they conducted?
15. Jail mental health screenings are conducted by: Check all that apply
o Jail Officers
o Jail MH Staff
o Other MH professional
Note: “Jail MH Staff” are employees of the jail and therefore this category should not include any
contracted personnel. Contracted MH staff should be considered “Other MH professional”.
16. If your jail conducts a mental health screening, does the jail use a validated screening instrument, in addition
to standard booking questions, with all inmates?
o Yes

39
o No
17a. If so, what is the validated screening instrument used?
o Brief Jail MH Screen
o Jail Admission Screening Assessment Test (JASAT)
o Other validated jail MH screening instrument:
17b. Name of Instrument:
17c. Are there any other methods of screening for Mental Health issues in your jail? If so, please describe.
18. Indicate whether or not inmates suspected of having a mental illness receive a professional mental health
assessment, following screening, or when needed. (check one)
o All inmates with a positive screening are referred for professional mental health assessment.
o Professional mental health assessments are only conducted when inmates have acute symptoms of mental
illness.
o Professional mental health assessments are not conducted.
19. Professional mental health assessments of jail inmates are conducted by: (please mark all that apply.)
o Jail licensed MH/medical staff
o Private, contract MDs or other MH professionals
o CSB staff
20a. A total of inmates remained housed at this jail for more than 48 hours, following the issuance of a
court order to a state hospital for psychiatric commitment (Temporary Detention Orders) during the month of
June 2016.
20b. What is the average time period an inmate is confined before receiving a professional mental health
assessment? (Note: This response should not take into account assessments conducted as a result of an acute
mental health crisis.) o =<4 hours
o 4-8 hours
o 8-23 hours
o 24-72 hours
o >72 hours
o No answer given
o Additional Comments
20c. Are the jails’ screening and assessment procedures adjusted over weekends/holidays?
o Yes
o No
20d. If yes, please explain:
21. Please indicate the CSB/BHA that provides MH prescreening services for psychiatric commitment (Temporary
Detention Orders) for this jail.

40
o The CSB/BHA that serves the county/city where our jail is located provides prescreening services for jail
inmates. Name of CSB/BHA:
o Both the CSB/BHA that serves the county/city where our jail is located and other CSB’s in the region that
is served by our jail provide MH prescreening for psychiatric commitment
22. CSB prescreenings for psychiatric commitment (Temporary Detention Orders) for this jail are done via video:
o Always
o Sometimes
o Never
23. If your jail has a consulting or staff psychiatrist (MD), indicate the number of hours of psychiatrist
consultation time provided at your jail, during the month of June 2016. A total of hours of psychiatrist
time were provided during the month of June 2016.
If your jail has a consulting or staff psychiatrist (MD) please provide their name, even if no services were
provided during the month of June.
Psychiatrist’s name(s) or group name
24. If the jail has a general practice, or staff MD, please enter the total number of hours of that MD’s time
devoted to the provision of mental health treatment (medication prescribing and monitoring) for the month of
June 2016. A total of hours of general MD time were devoted to mental health treatment during the
month of June 2016.
If your jail has a general practice (MD) please provide their name, even if no services were provided during
the month of June.
General Practice MD’s name or group name
25. What percentage of your jail’s general or psychiatric MD consultations are provided by a remote video (MD)
consultant:
o The jail does not use remote video MD services for mental health assessments and/or treatment.
o The jail uses remote video MD services for less than 50% of mental health assessments and/or
treatment
o Yes, the jail uses remote video MD services for more than 50% of mental health assessments and/or
treatment.
26a. Are inmates with diagnosed mental illness provided with follow up case management or discharge planning
services upon release from your jail?
o Yes
o No
26b. Type of Services Provided

41
27. Jail Medication Formulary: Section 53.1-126 of the Code of Virginia requires that sheriffs and regional jail
superintendents "...purchase at prices as low as reasonably possible all foodstuffs... and medicine as may be
necessary" for the care of the inmates in their jails. Is your jail’s purchase of psychotropic medication limited
by Section 53.1-126?
o Yes
o No
28. The jail’s formulary is set by:
a. Contract general medical services provider (Name of contractor providing medication)
b. Special contract with local or national pharmacy (Name of local or national pharmacy)
c. Other
29. List the numbers of inmates who received each type of psychotropic medication treatment at your jail during
the month of June 2016:
If an inmate received medication from more than one category, please count that inmate in each relevant
category. Some inmates receive treatment with more than one type of medication; the number of medications
administered in June may exceed the number of inmates receiving treatment.
Please count an inmate for each type of antipsychotic or mood stabilizer medication he or she receives, and
count only once for all types of antidepressant or antianxiety medication, even if the inmate received more
than one type of antidepressant or antianxiety medication.
Medication Categories Total number of Jail Inmates receiving each medication for
treatment of mental illness
I. Antipsychotic medications
Total number of inmates treated
with each brand or type of
medication
Please place an X in this column if
the jail does not provide this
medication
Haldol/haloperidol
Zyprexa/olanzapine
Risperdal/risperidone
Seroquel/quetiapine
Triliafon/perphenazine
Prolixin/fluphenazine
Thorazine/chlorpromazine
Abilify/aripiprazole

42
Geodon/ziprasidone
Clozaril/clozapine
Other antipsychotic medication(s)
II. Mood Stabilizer/Anticonvulsant
medications for major Mood Disorder
Total number of inmates treated with
each medication brand/type
Please place an X in this column if the
jail does not provide this medication
Depakote/Depakene/valproic acid
Lithobid/lithium carbonate
Tegretal/carbamazepine
Topamax/topiramate
Trileptal
Other mood disorder medication(s)
III. Antidepressant medications Total number of inmates treated with
this category of medication Please place an X in this column if the
jail does not provide this medication
(Examples: Prozac/fluoxetine,
Zoloft/sertraline, Lexapro, escitalopram,
Wellbutrin/bupropion, Paxil/paroxetine,
Elavil, amitriptyline, Pamelor/nortriptyline,
Desyrel/trazodone, etc.)
IV. Antianxiety medications (Examples: Ativan/lorazepam,
Xanax/alprazolam,
Librium/chlordiazipoxide,
Valium/diazepam, etc.)
30a. A total of jail inmates clinically diagnosed with mental illness refused prescribed psychotropic
medication treatment during the month of June 2016.
30b. Please note the jail’s procedure when an inmate refuses to take prescribed medication.
Questions 31 through 33 should be answered using data from the entire Fiscal Year 2016
31. Total cost for all psychotropic medications administered at your jail during Fiscal Year 2016: $
(Check one: estimated cost; actual, prorated cost)
32. Total cost for all mental health services (excluding medications, but including MDs and nursing)
provided by the jail during Fiscal Year 2016: $
(Check one: estimated cost; actual, prorated cost)
33. Indicate the amount of funding from each of the sources below for the amounts listed in questions 31 and 32.

43
o Commonwealth of Virginia (state) Funds: $
o Federal funds: $
o Local funds: $
o Other funds: $
o Total funds: $ (Should equal the sum of questions 31 & 32)
(Check one: funding sources are estimated funding sources are actual)
34. Does, or would the jail dispense psychotropic medications provided free of charge by the CSBs, DBHDS, or
private provider, when the jail’s MD has approved the medication for a particular inmate?
o Yes we currently accept such medications, under the proper circumstances
o No, we do not currently accept such medications
o Yes, we would accept such medications under the proper circumstances
o No, we would not consider accepting such medications
35. Indicate the numbers of inmates who received each of the following types of mental/behavioral health
treatment delivered by all mental health services providers, for the month of June 2016.
Treatment Category Number Treated Hours of Treatment Provided
Individual counseling
Group mental health counseling
Group Substance Abuse treatment
Other types of individual or group mental health treatment
36. Please indicate the total number of hours of mental/behavioral health treatment provided by each of the
below entities during the month of June 2016. Please only include nursing treatment time, do not include
time spent distributing medications. Please do not include the hours of treatment provided by
psychiatrists or other MDs in this section. Number of hours here should match number of hours in
question 36.
Treatment Provider Number of Treatment Hours
Jail mental health treatment staff (jail employees)
Community Services Board (CSB/BHA) staff
(Please include CSB staff assigned full-time to the jail. Not
employees of the jail)
Private contractors, including jail medical contractor (e.g., PHS,
CMS)
Total number of hours of individual or group mental health
counseling provided to inmates at your jail for the month of
June 2016
37. Please indicate if your jail/locality would consider hosting a state-funded Mental Health Residential Treatment
Program
o Yes, would consider housing a MH Residential Treatment program in the jail or jail complex.
0

44
o No, would not support housing a MH Residential Treatment program in the jail or jail complex.
38. Please indicate the number of documented incidents of inmate aggression, (to include physical or sexual assault
and/or threats of violence). There were documented incidents of inmate aggression toward other
inmates and documented incidents toward jail staff during the month of June 2016. Of these incidents
inmate perpetrators had been clinically diagnosed as mentally ill, and victims of inmate
aggression had been clinically diagnosed as mentally ill.
39. Please indicate the mental health data source used by your jail for responding to this survey. (Please mark all
that apply).
o Mental Health Module of Jail Management System
o Other Mental Health Management System
o Access/Excel Database
o Paper Forms
o Other
Additional Comments
40. Please enter the name of the jail’s electronic inmate management system
41. Does the jail’s electronic inmate management system include MH screening items?
o Yes
o No
42. Does the jail’s electronic inmate management system include inmate psychiatric diagnoses?
o Yes
o No
43. Please indicate who is responsible for maintaining mental health data, including but not limited to data used to
respond to this survey. (Please mark all that apply).
o Jail licensed MH/medical staff
o CSB staff
o Private, contract MDs or other MH professionals
o Jail Officers
44. The total number of staff employed at this jail is .
45. A total of hours of mental health training is provided to each new jail officer/deputy, prior to his/her
initial assignment to the jail.
46. Jail Officers/Deputies are required to complete hours of annual training in mental health topics each
year.

45
47. A total of officers/deputies on the jail staff have completed DCJS Certified 40-Hr Crisis Intervention
Team (CIT) training.
Comments: Please include any remarks you wish regarding the management of inmates with mental illness
in your jail
.
If you have any questions about this survey, please phone Kari Bullock at 804-371-4299 (SCB) or email
[email protected]. If you should experience any technical difficulties, please contact Anne
Wilmoth at 804-225-3307(SCB) or email [email protected].
Thank you for your participation in this important work.

46
Appendix B: Jail Regions
Central Region
Albemarle-Charlottesville Regional Jail Peumansend Creek Regional Jail
Alexandria Detention Center Prince William-Manassas Detention Center
Arlington County Detention Facility Rappahannock-Shenandoah-Warren Regional Jail
Central Virginia Regional Jail Rappahannock Regional Jail
Charlotte County Jail Richmond City Jail
Chesterfield County Jail Rockingham-Harrisonburg Regional
Culpeper County Jail
Fairfax Adult Detention Center
Fauquier County Jail
Henrico County Jail
Loudoun County Adult Detention Center
Meherrin River Regional Jail
Northwestern Regional Jail
Northern Neck Regional Jail
Page County Jail
Pamunkey Regional Jail
Western Region
Alleghany County Regional Jail
Blue Ridge Regional Jail Authority
Montgomery County Jail
New River Valley Regional Jail
Botetourt-Craig Jail Patrick County Jail
Bristol City Jail Piedmont Regional Jail
Danville City Jail Pittsylvania County Jail
Danville City Jail Farm Roanoke City Jail
Franklin County Jail Roanoke County Jail
Henry County Jail Rockbridge Regional Jail
Martinsville City Jail
Middle River Regional Jail
Southwest VA Regional Jail
Western VA Regional Jail

47
Eastern Region
Accomack County Jail Norfolk City Jail
Gloucester County Jail Portsmouth City Jail
Hampton Roads Regional Jail Western Tidewater Regional Jail
Lancaster County Jail Virginia Beach City Jail
Middle Peninsula Regional Jail
Riverside Regional Jail
Southampton County Jail
Southside Regional Jail
Sussex County Jail
Virginia Peninsula Regional Jail
Chesapeake City Jail
Hampton City Jail
Newport News City Jail

48
Appendix C: Number & Diagnoses of Inmate Mental Illness in Jails
Jail
Num
Jail Name
Schizophrenia
or Delusional
Disorder
Bipolar or
Major
Depressive
Mild
Depression
Anxiety
Disorder
PTSD
Other
Mental
Illness
Mentally Ill
with No
Diagnosis
Total
MI
Pop
Total with
SMI
(Schiz,
Bipolar,
PTSD)
001 Accomack County Jail 5 12 1 1 2 1 0 22 19
003 Albemarle-Charlottesville
Regional Jail
11
66
4
19
9
49
3
161
86
005 Alleghany County Regional Jail 4 20 0 8 2 9 8 51 26
013 Arlington County Jail 52 74 16 1 9 39 3 194 135
023 Botetourt County Jail 1 27 10 15 2 5 0 60 30
037 Charlotte County Jail 0 2 2 0 0 0 1 5 2
041 Chesterfield County Jail 0 36 6 8 1 6 0 57 37
047 Culpeper County Adc 5 9 14 14 3 0 0 45 17
059 Fairfax Adult Detention Center 33 54 21 9 17 37 22 193 104
061 Fauquier County Jail 4 8 0 12 1 0 2 27 13
067 Franklin County Jail 0 0 0 0 0 0 0 0 0
069 Northwestern Regional Jail 27 25 37 29 23 80 0 221 75
073 Gloucester County Jail 4 6 0 7 1 1 1 20 11
087 Henrico County Jail 23 46 2 3 20 104 0 198 89
089 Henry County Jail 1 21 33 15 0 0 0 70 22
103 Lancaster Correctional Center 0 1 0 0 0 0 3 4 1
107 Loudoun County Adult Detention 8 35 2 10 6 10 67 138 49
119 Middle Peninsula Regional 1 12 5 0 1 21 3 43 14
121 Montgomery County Jail 5 17 58 13 3 2 1 99 25
131 Eastern Shore Regional Jail 3 0 6 4 2 4 0 19 5
135 Piedmont Regional Jail 11 48 0 10 13 7 0 89 72
137 Central Virginia Regional Jail 3 19 0 14 0 11 0 47 22
139 Page County Jail 0 8 31 28 0 16 11 94 8
141 Patrick County Jail 4 8 20 3 0 7 2 44 12
143 Pittsylvania County Jail 5 14 9 4 7 8 19 66 26
153 Pr. William/Manassas Regional 29 42 30 5 1 5 11 123 72
161 Roanoke County/Salem Jail 0 0 13 16 0 2 0 31 0
163 Rockbridge Regional Jail 0 8 21 7 1 1 3 41 9
165 Rockingham-Harrisonburg
Regional Jail
11
22
5
6
7
16
3
70
40
175 Southampton County Jail 1 2 0 0 0 0 0 3 3
183 Sussex County Jail 0 2 0 2 1 0 1 6 3
193 Northern Neck Regional Jail 2 13 0 3 0 0 0 18 15
460 Pamunkey Regional Jail 9 14 24 0 0 0 0 47 23

49
Jail
Num
Jail Name
Schizophrenia
or Delusional
Disorder
Bipolar or
Major
Depressive
Mild
Depression
Anxiety
Disorder
PTSD
Other
Mental
Illness
Mentally Ill
with No
Diagnosis
Total
MI
Pop
Total with
SMI
(Schiz,
Bipolar,
PTSD)
465 Riverside Regional Jail 97 111 75 15 22 1 0 321 230
470 Virginia Peninsula Regional 8 35 1 2 0 8 1 55 43
475 Hampton Roads Regional Jail 75 245 0 37 39 67 0 463 359
480 New River Regional Jail 2 17 17 7 9 20 18 90 28
485 Blue Ridge Regional Jail 38 92 16 56 42 50 0 294 172
490 Peumansend Creek Regional 0 1 1 1 0 0 0 3 1
491 Southside Regional Jail 2 6 0 2 1 1 2 14 9
492 Southwest Virginia Regional Jail 16 143 116 48 27 88 25 463 186
493 Middle River Regional Jail 24 53 27 16 28 24 36 208 105
494 Western Virginia Regional Jail 11 78 27 18 25 102 144 405 114
495 Meherrin River Regional Jail 4 20 19 6 3 3 0 55 27
496 RSW Regional Jail 3 42 0 11 6 18 0 80 51
510 Alexandria Detention Center 19 36 2 7 14 51 1 130 69
520 Bristol City Jail 7 7 22 11 5 0 0 52 19
550 Chesapeake City Jail 19 122 0 33 24 0 0 198 165
590 Danville City Jail 14 4 17 1 0 0 0 36 18
620 Western Tidewater Regional 21 15 1 0 12 56 2 107 48
630 Rappahannock Regional Jail 17 37 0 19 9 83 14 179 63
650 Hampton Correctional Facility 10 9 7 0 1 4 0 31 20
690 Martinsville City Jail 12 1 13 5 0 0 0 31 13
700 Newport News City Jail 14 21 17 6 5 14 11 88 40
710 Norfolk City Jail 27 29 20 28 14 39 0 157 70
740 Portsmouth City Jail 8 10 5 3 1 0 0 27 19
760 Richmond City Jail 51 102 0 5 12 28 0 198 165
770 Roanoke City Jail 46 67 8 18 27 147 75 388 140
810 Virginia Beach Correction Ctr 15 85 16 17 17 25 0 175 117
Totals 822 2059 797 638 475 1270 493 6554 3356

50
Appendix D: Average Hours of Confinement Before Eligible for MH Assessment
Jail Num Jail Name
Typical Confinement Time
Until MH Assessment
001 Accomack County Jail More than 72 Hours
003 Albemarle-Charlottesville Regional Jail More than 72 Hours
005 Alleghany Regional Jail No Answer Given
013 Arlington County Djail 8-23 Hrs
023 Botetourt County Jail More than 72 Hours
037 Charlotte County Jail 24-72 Hrs
041 Chesterfield County Jail 24-72 Hrs
047 Culpeper County Adc Less than 4 Hrs
059 Fairfax Adult Detention Center 8-23 Hrs
061 Fauquier County Jail 4-8 Hrs
067 Franklin County Jail Less than 4 Hrs
069 Northwestern Regional Jail More than 72 Hours
073 Gloucester County Jail 4-8 Hrs
087 Henrico County Jail More than 72 Hours
089 Henry County Jail 8-23 Hrs
103 Lancaster Correctional Center 4-8 Hrs
107 Loudoun County Adult Detention More than 72 Hours
119 Middle Peninsula Regional 4-8 Hrs
121 Montgomery County Jail 8-23 Hrs
131 Eastern Shore Regional Jail 24-72 Hrs
135 Piedmont Regional Jail More than 72 Hours
137 Central Virginia Regional Jail 24-72 Hrs
139 Page County Jail 24-72 Hrs
141 Patrick County Jail Less than 4 Hrs
143 Pittsylvania County Jail Less than 4 Hrs
153 Pr. William/Manassas Regional 24-72 Hrs
161 Roanoke County/Salem Jail 8-23 Hrs
163 Rockbridge Regional Jail Less than 4 Hrs
165 Rockingham-Harrisonburg Regional Jail 8-23 Hrs
175 Southampton County Jail More than 72 Hours
183 Sussex County Jail 24-72 Hrs
193 Northern Neck Regional Jail 4-8 Hrs
460 Pamunkey Regional Jail More than 72 Hours
465 Riverside Regional Jail More than 72 Hours
470 Virginia Peninsula Regional More than 72 Hours
475 Hampton Roads Regional Jail Less than 4 Hrs
480 New River Regional Jail More than 72 Hours
485 Blue Ridge Regional Jail 24-72 Hrs
490 Peumansend Creek Regional 24-72 Hrs
491 Southside Regional Jail 8-23 Hrs
492 Southwest Virginia Regional Jail More than 72 Hours

51
Jail Num Jail Name
Typical Confinement Time
Until MH Assessment
493 Middle River Regional Jail 24-72 Hrs
494 Western Virginia Regional Jail 8-23 Hrs
495 Meherrin River Regional Jail 24-72 Hrs
496 Rsw Regional Jail 24-72 Hrs
510 Alexandria Detention Center 8-23 Hrs
520 Bristol City Jail Less than 4 Hrs
550 Chesapeake City Jail More than 72 Hours
590 Danville City Jail Less than 4 Hrs
620 Western Tidewater Regional 24-72 Hrs
630 Rappahannock Regional Jail More than 72 Hours
650 Hampton Correctional Facility More than 72 Hours
690 Martinsville City Jail 24-72 Hrs
700 Newport News City Jail 24-72 Hrs
710 Norfolk City Jail Less than 4 Hrs
740 Portsmouth City Jail 24-72 Hrs
760 Richmond City Jail 24-72 Hrs
770 Roanoke City Jail 24-72 Hrs
810 Virginia Beach Correction Ctr Less than 4 Hrs

52
Appendix E: MH Screenings of Inmates Drunk in Public or Simple Drug Possession
Jail Num Jail Name
DIP Screened for
MI Y/N
Poss Screened
for MI Y/N
001 Accomack County Jail y y
003 Albemarle-Charlottesville Regional Jail y y
005 Alleghany Regional Jail no response no response
013 Arlington County Detention Facility y n
023 Botetourt County Jail n n
037 Charlotte County Jail y y
041 Chesterfield County Jail y y
047 Culpeper County Adc y y
059 Fairfax Adult Detention Center n n
061 Fauquier County Jail n n
067 Franklin County Jail y n
069 Northwestern Regional Jail n n
073 Gloucester County Jail n n
087 Henrico County Jail y y
089 Henry County Jail n n
103 Lancaster Correctional Center n n
107 Loudoun County Adult Detention y y
119 Middle Peninsula Regional y y
121 Montgomery County Jail y y
131 Eastern Shore Regional Jail n n
135 Piedmont Regional Jail n n
137 Central Virginia Regional Jail y n
139 Page County Jail y y
141 Patrick County Jail n n
143 Pittsylvania County Jail n n
153 Pr. William/Manassas Regional n n
161 Roanoke County/Salem Jail y y
163 Rockbridge Regional Jail n n
165 Rockingham-Harrisonburg Regional Jail y n
175 Southampton County Jail n n
183 Sussex County Jail n n
193 Northern Neck Regional Jail n y
460 Pamunkey Regional Jail n n
465 Riverside Regional Jail n n
470 Virginia Peninsula Regional y y
475 Hampton Roads Regional Jail y y
480 New River Regional Jail n n
485 Blue Ridge Regional Jail y n
490 Peumansend Creek Regional y y
491 Southside Regional Jail y y
492 Southwest Virginia Regional Jail y y

53
Jail Num Jail Name
DIP Screened for
MI Y/N
Poss Screened
for MI Y/N
493 Middle River Regional Jail y n
494 Western Virginia Regional Jail y y
495 Meherrin River Regional Jail y y
496 Rsw Regional Jail n n
510 Alexandria Detention Center y y
520 Bristol City Jail y y
550 Chesapeake City Jail y y
590 Danville City Jail y y
620 Western Tidewater Regional y n
630 Rappahannock Regional Jail y y
650 Hampton Correctional Facility n y
690 Martinsville City Jail n n
700 Newport News City Jail y n
710 Norfolk City Jail y y
740 Portsmouth City Jail y n
760 Richmond City Jail y y
770 Roanoke City Jail y y
810 Virginia Beach Correction Ctr y y

54
Appendix F: Veteran and Homeless Inmates
Jail
Num Jail Name Vets
Vets
w/MI
Vets
w/MI &
SA Homeless
Homeless
w/MI
Homeless
w/MI &
SA
001 Accomack County Jail 4 2 2 2 2 1
003 Albemarle-Charlottesville Regional Jail 8 6 4 30 12 9
005 Alleghany County Regional Jail 0 0 0 0 0 0
013 Arlington County Detention Facility 17 17 17 100 44 42
023 Botetourt County Jail 5 1 0 0 0 0
037 Charlotte County Jail 0 0 0 0 0 0
041 Chesterfield County Jail 17 3 0 25 3 0
047 Culpeper County Adc 6 2 1 4 1 1
059 Fairfax Adult Detention Center 45 2 2 140 18 12
061 Fauquier County Jail 3 1 1 0 0 0
067 Franklin County Jail 3 0 0 0 0 0
069 Northwestern Regional Jail 34 13 10 38 18 12
073 Gloucester County Jail 1 1 0 3 2 2
087 Henrico County Jail 37 8 8 61 8 8
089 Henry County Jail 0 0 0 0 0 0
103 Lancaster Correctional Center 1 0 0 0 0 0
107 Loudoun County Adult Detention 6 6 6 5 5 5
119 Middle Peninsula Regional 1 1 1 3 3 3
121 Montgomery County Jail 5 4 3 2 2 1
131 Eastern Shore Regional Jail 1 1 0 2 1 0
135 Piedmont Regional Jail 6 6 6 0 0 0
137 Central Virginia Regional Jail 17 8 0 0 0 0
139 Page County Jail 0 0 0 0 0 0
141 Patrick County Jail 1 1 1 0 0 0
143 Pittsylvania County Jail 2 2 0 0 0 0
153 Pr. William/Manassas Regional 42 1 1 15 1 0
161 Roanoke County/Salem Jail 2 0 0 2 1 1
163 Rockbridge Regional Jail 1 1 1 1 1 1
165 Rockingham-Harrisonburg Regional Jail 2 0 0 8 1 1
175 Southampton County Jail 0 0 0 0 0 0
183 Sussex County Jail 5 1 1 1 1 1
193 Northern Neck Regional Jail 0 0 0 1 1 0
460 Pamunkey Regional Jail 0 0 0 0 0 0
465 Riverside Regional Jail 30 4 4 0 0 0
470 Virginia Peninsula Regional 1 1 0 2 2 2
475 Hampton Roads Regional Jail 83 35 2 18 11 3
480 New River Regional Jail 3 3 3 4 4 4
485 Blue Ridge Regional Jail 68 31 25 54 29 14
490 Peumansend Creek Regional 1 0 0 2 0 0
491 Southside Regional Jail 7 2 0 0 0 0
492 Southwest Virginia Regional Jail 25 12 6 42 16 10
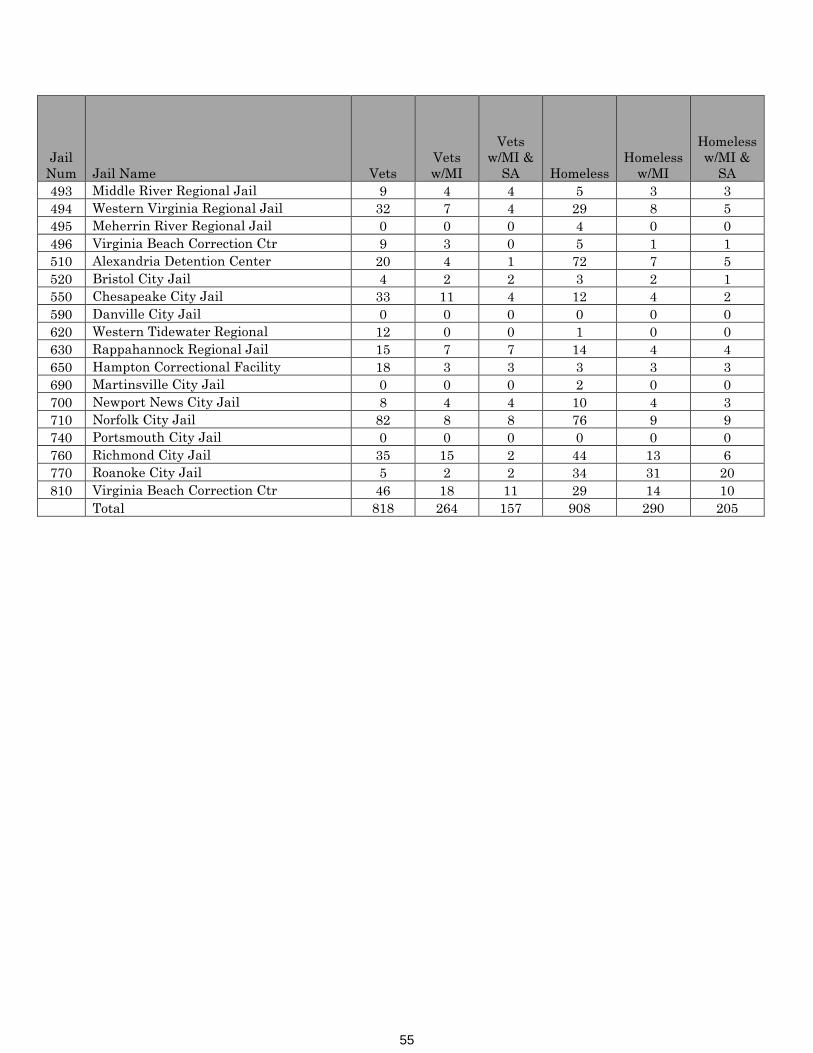
55
Jail
Num Jail Name Vets
Vets
w/MI
Vets
w/MI &
SA Homeless
Homeless
w/MI
Homeless
w/MI &
SA
493 Middle River Regional Jail 9 4 4 5 3 3
494 Western Virginia Regional Jail 32 7 4 29 8 5
495 Meherrin River Regional Jail 0 0 0 4 0 0
496 Virginia Beach Correction Ctr 9 3 0 5 1 1
510 Alexandria Detention Center 20 4 1 72 7 5
520 Bristol City Jail 4 2 2 3 2 1
550 Chesapeake City Jail 33 11 4 12 4 2
590 Danville City Jail 0 0 0 0 0 0
620 Western Tidewater Regional 12 0 0 1 0 0
630 Rappahannock Regional Jail 15 7 7 14 4 4
650 Hampton Correctional Facility 18 3 3 3 3 3
690 Martinsville City Jail 0 0 0 2 0 0
700 Newport News City Jail 8 4 4 10 4 3
710 Norfolk City Jail 82 8 8 76 9 9
740 Portsmouth City Jail 0 0 0 0 0 0
760 Richmond City Jail 35 15 2 44 13 6
770 Roanoke City Jail 5 2 2 34 31 20
810 Virginia Beach Correction Ctr 46 18 11 29 14 10
Total 818 264 157 908 290 205
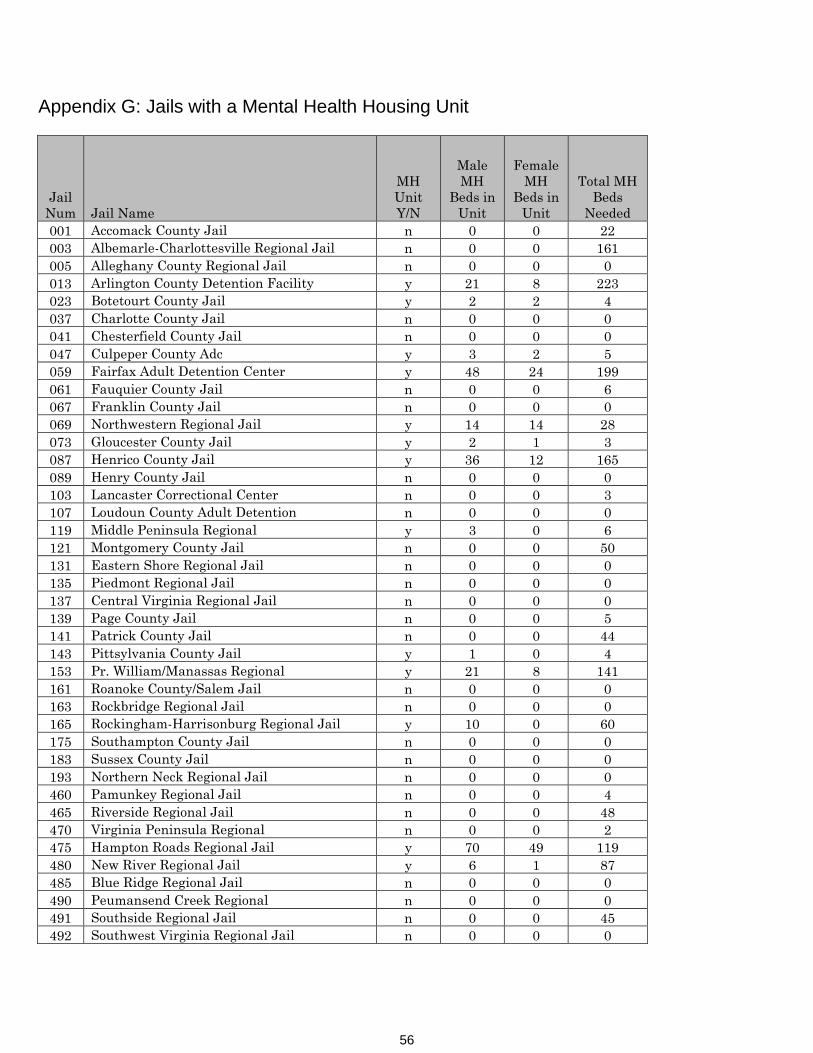
56
Appendix G: Jails with a Mental Health Housing Unit
Jail
Num Jail Name
MH
Unit
Y/N
Male
MH
Beds in
Unit
Female
MH
Beds in
Unit
Total MH
Beds
Needed
001 Accomack County Jail n 0 0 22
003 Albemarle-Charlottesville Regional Jail n 0 0 161
005 Alleghany County Regional Jail n 0 0 0
013 Arlington County Detention Facility y 21 8 223
023 Botetourt County Jail y 2 2 4
037 Charlotte County Jail n 0 0 0
041 Chesterfield County Jail n 0 0 0
047 Culpeper County Adc y 3 2 5
059 Fairfax Adult Detention Center y 48 24 199
061 Fauquier County Jail n 0 0 6
067 Franklin County Jail n 0 0 0
069 Northwestern Regional Jail y 14 14 28
073 Gloucester County Jail y 2 1 3
087 Henrico County Jail y 36 12 165
089 Henry County Jail n 0 0 0
103 Lancaster Correctional Center n 0 0 3
107 Loudoun County Adult Detention n 0 0 0
119 Middle Peninsula Regional y 3 0 6
121 Montgomery County Jail n 0 0 50
131 Eastern Shore Regional Jail n 0 0 0
135 Piedmont Regional Jail n 0 0 0
137 Central Virginia Regional Jail n 0 0 0
139 Page County Jail n 0 0 5
141 Patrick County Jail n 0 0 44
143 Pittsylvania County Jail y 1 0 4
153 Pr. William/Manassas Regional y 21 8 141
161 Roanoke County/Salem Jail n 0 0 0
163 Rockbridge Regional Jail n 0 0 0
165 Rockingham-Harrisonburg Regional Jail y 10 0 60
175 Southampton County Jail n 0 0 0
183 Sussex County Jail n 0 0 0
193 Northern Neck Regional Jail n 0 0 0
460 Pamunkey Regional Jail n 0 0 4
465 Riverside Regional Jail n 0 0 48
470 Virginia Peninsula Regional n 0 0 2
475 Hampton Roads Regional Jail y 70 49 119
480 New River Regional Jail y 6 1 87
485 Blue Ridge Regional Jail n 0 0 0
490 Peumansend Creek Regional n 0 0 0
491 Southside Regional Jail n 0 0 45
492 Southwest Virginia Regional Jail n 0 0 0
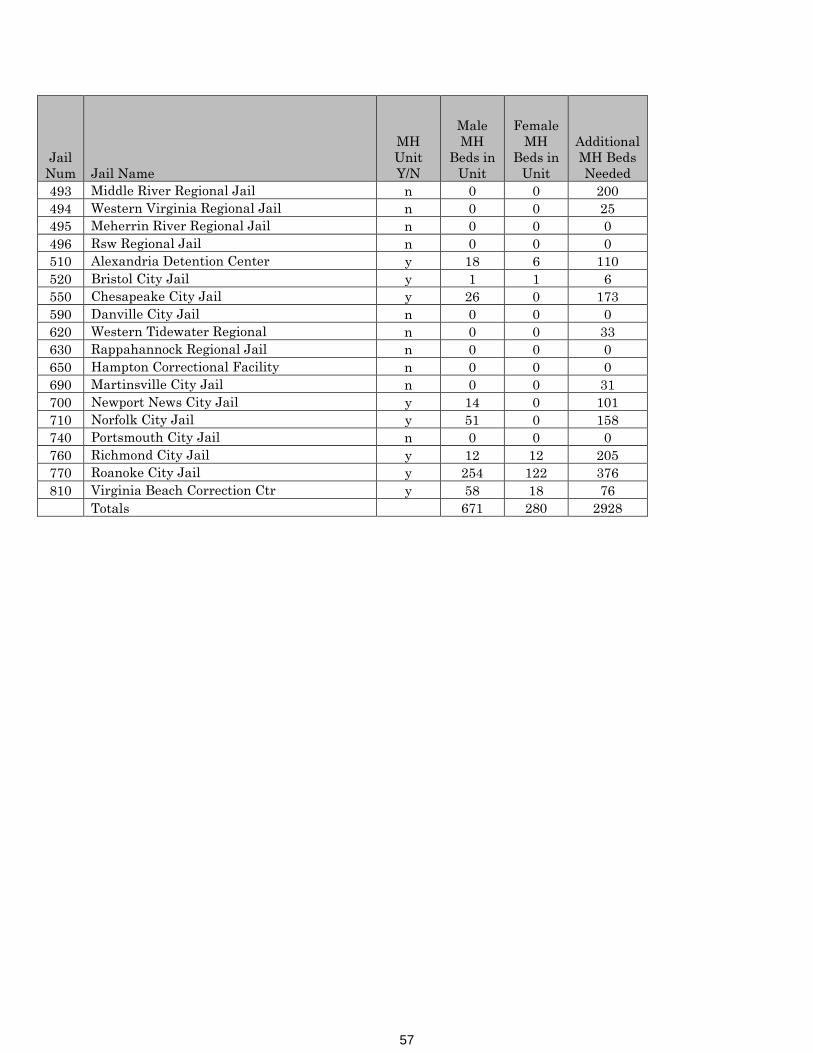
57
Jail
Num Jail Name
MH
Unit
Y/N
Male
MH
Beds in
Unit
Female
MH
Beds in
Unit
Additional
MH Beds
Needed
493 Middle River Regional Jail n 0 0 200
494 Western Virginia Regional Jail n 0 0 25
495 Meherrin River Regional Jail n 0 0 0
496 Rsw Regional Jail n 0 0 0
510 Alexandria Detention Center y 18 6 110
520 Bristol City Jail y 1 1 6
550 Chesapeake City Jail y 26 0 173
590 Danville City Jail n 0 0 0
620 Western Tidewater Regional n 0 0 33
630 Rappahannock Regional Jail n 0 0 0
650 Hampton Correctional Facility n 0 0 0
690 Martinsville City Jail n 0 0 31
700 Newport News City Jail y 14 0 101
710 Norfolk City Jail y 51 0 158
740 Portsmouth City Jail n 0 0 0
760 Richmond City Jail y 12 12 205
770 Roanoke City Jail y 254 122 376
810 Virginia Beach Correction Ctr y 58 18 76
Totals 671 280 2928

58
Appendix H: Hours of Mental Health Treatment Services Provided
Jail
Num Jail Name
Hours of Pysc
Time
Hrs of MD
devoted to
MH
Hrs of Trtmt
Prov by Jail
MH Staff
Hrs of
Trtmt Prov
by CSB
Hrs of Trtmt
Prov by Priv
Cont
Total
Hours
001 Accomack County Jail 20 1 0 20 48 89
003 Albemarle-Charlottesville Regional Jail 227 34 312 40 0 613
013 Arlington County Detention Facility 0 0 0 469 240 709
023 Botetourt County Jail 22 0 0 0 0 22
037 Charlotte County Jail 0 0 0 4 0 4
041 Chesterfield County Jail 24 4 0 23 0 51
047 Culpeper County Adc 0 0 36 12 48 96
059 Fairfax Adult Detention Center 104 0 0 1536 0 1640
061 Fauquier County Jail 8 1 0 0 0 9
067 Franklin County Jail 0 0 0 0 0 0
069 Northwestern Regional Jail 14 6 78 0 0 98
073 Gloucester County Jail 0 8 2 22 0 32
087 Henrico County Jail 16 0 0 0 0 16
089 Henry County Jail 15 5 0 3 0 23
103 Lancaster Correctional Center 0 4 0 0 0 4
107 Loudoun County Adult Detention 24 16 0 450 0 490
119 Middle Peninsula Regional 3 4 360 320 5 692
121 Montgomery County Jail 4 1 0 11 8 24
131 Eastern Shore Regional Jail 6 0 6 4 0 16
135 Piedmont Regional Jail 40 24 0 0 2 66
137 Central Virginia Regional Jail 9 3 0 0 0 12
139 Page County Jail 2 2 8 0 8 20
141 Patrick County Jail 0 8 24 8 24 64
143 Pittsylvania County Jail 0 0 160 0 0 160
153 Pr. William/Manassas Regional 16 1 251 658 1156 2082
161 Roanoke County/Salem Jail 12 0 4 190 12 218
163 Rockbridge Regional Jail 0 4 0 2 0 6
165 Rockingham-Harrisonburg Regional Jail 16 0 0 58 8 82
175 Southampton County Jail 0 4 0 0 0 4
183 Sussex County Jail 0 0 0 0 0 0
193 Northern Neck Regional Jail 0 3 0 160 0 163
460 Pamunkey Regional Jail 2 0 0 94 0 96
465 Riverside Regional Jail 96 0 1520 68 456 2140
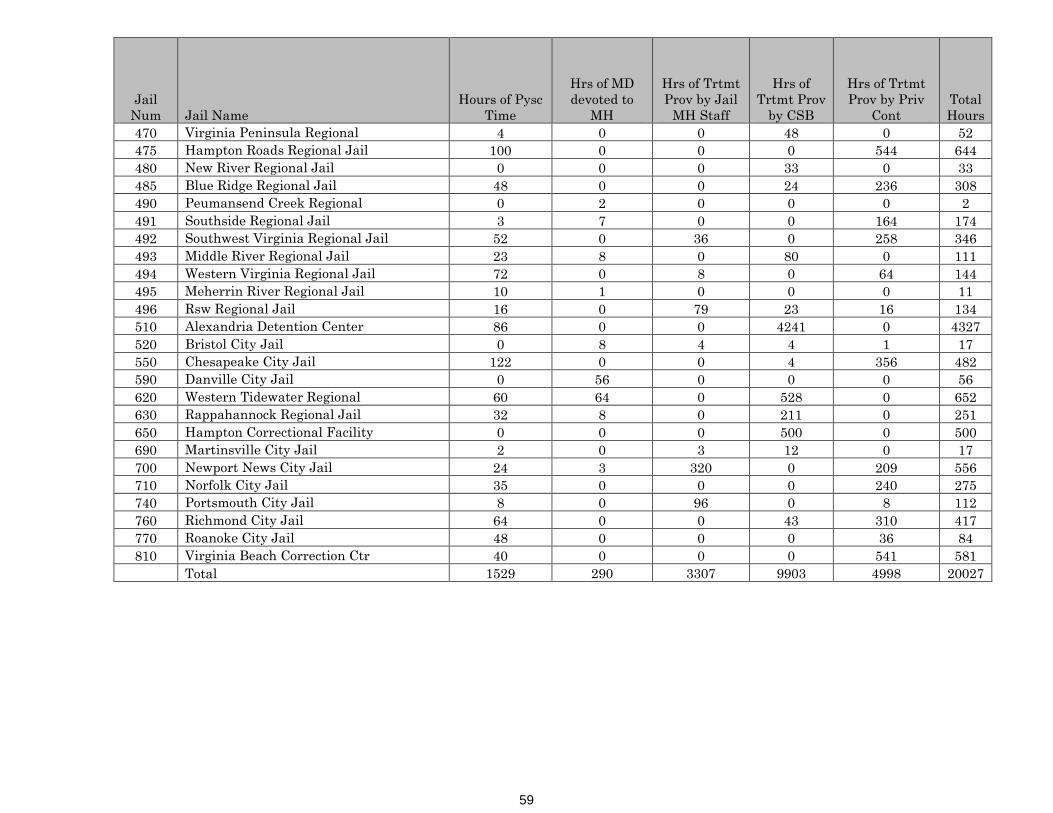
59
Jail
Num Jail Name
Hours of Pysc
Time
Hrs of MD
devoted to
MH
Hrs of Trtmt
Prov by Jail
MH Staff
Hrs of
Trtmt Prov
by CSB
Hrs of Trtmt
Prov by Priv
Cont
Total
Hours
470 Virginia Peninsula Regional 4 0 0 48 0 52
475 Hampton Roads Regional Jail 100 0 0 0 544 644
480 New River Regional Jail 0 0 0 33 0 33
485 Blue Ridge Regional Jail 48 0 0 24 236 308
490 Peumansend Creek Regional 0 2 0 0 0 2
491 Southside Regional Jail 3 7 0 0 164 174
492 Southwest Virginia Regional Jail 52 0 36 0 258 346
493 Middle River Regional Jail 23 8 0 80 0 111
494 Western Virginia Regional Jail 72 0 8 0 64 144
495 Meherrin River Regional Jail 10 1 0 0 0 11
496 Rsw Regional Jail 16 0 79 23 16 134
510 Alexandria Detention Center 86 0 0 4241 0 4327
520 Bristol City Jail 0 8 4 4 1 17
550 Chesapeake City Jail 122 0 0 4 356 482
590 Danville City Jail 0 56 0 0 0 56
620 Western Tidewater Regional 60 64 0 528 0 652
630 Rappahannock Regional Jail 32 8 0 211 0 251
650 Hampton Correctional Facility 0 0 0 500 0 500
690 Martinsville City Jail 2 0 3 12 0 17
700 Newport News City Jail 24 3 320 0 209 556
710 Norfolk City Jail 35 0 0 0 240 275
740 Portsmouth City Jail 8 0 96 0 8 112
760 Richmond City Jail 64 0 0 43 310 417
770 Roanoke City Jail 48 0 0 0 36 84
810 Virginia Beach Correction Ctr 40 0 0 0 541 581
Total 1529 290 3307 9903 4998 20027

60
Appendix I: Type of Mental Health Treatment Services Provided
Jail
Num Jail Name
Num Rcvd
Indiv
Counslg
Num Rcvd
Group
Cnslg
Group SA
Trtmt
Num Rcvd
Other
Trtmt
Total Number of
Inmates Receiving
Treatment
001 Accomack County Jail 34 0 0 0 34
003 Albemarle-Charlottesville Regional Jail 215 40 125 10 390
013 Arlington County Detention Facility 63 98 36 129 326
023 Botetourt County Jail 0 0 0 0 0
037 Charlotte County Jail 2 0 0 0 2
047 Culpeper County Adc 29 8 8 8 53
059 Fairfax Adult Detention Center 199 60 76 14 349
061 Fauquier County Jail 0 0 0 10 10
067 Franklin County Jail 0 0 0 0 0
069 Northwestern Regional Jail 251 12 0 0 263
073 Gloucester County Jail 12 6 4 0 22
089 Henry County Jail 20 0 0 0 20
103 Lancaster Correctional Center 0 0 75 0 75
107 Loudoun County Adult Detention 5 0 63 123 191
119 Middle Peninsula Regional 104 0 22 48 174
121 Montgomery County Jail 11 0 36 0 47
131 Eastern Shore Regional Jail 14 0 0 0 14
135 Piedmont Regional Jail 5 0 0 0 5
137 Central Virginia Regional Jail 32 0 0 0 32
139 Page County Jail 4 40 40 10 94
143 Pittsylvania County Jail 46 48 32 5 131
153 Pr. William/Manassas Regional 167 0 43 220 430
161 Roanoke County/Salem Jail 3 20 90 0 113
163 Rockbridge Regional Jail 0 0 0 5 5
165 Rockingham-Harrisonburg Regional Jail 48 68 34 80 230
175 Southampton County Jail 0 0 0 0 0
183 Sussex County Jail 1 0 15 0 16
193 Northern Neck Regional Jail 65 11 34 0 110
465 Riverside Regional Jail 140 0 80 26 246
475 Hampton Roads Regional Jail 0 0 0 388 388
480 New River Regional Jail 26 0 0 0 26
485 Blue Ridge Regional Jail 248 0 0 40 288
491 Southside Regional Jail 18 0 54 54 126
492 Southwest Virginia Regional Jail 190 0 31 0 221

61
Jail
Num Jail Name
Num Rcvd
Indiv
Counslg
Num Rcvd
Group
Cnslg
Group SA
Trtmt
Num Rcvd
Other
Trtmt
Total Number of
Inmates Receiving
Treatment
493 Middle River Regional Jail 217 22 0 11 250
494 Western Virginia Regional Jail 17 0 20 19 56
496 Rsw Regional Jail 79 10 6 0 95
510 Alexandria Detention Center 166 17 16 137 336
520 Bristol City Jail 8 0 0 0 8
620 Western Tidewater Regional 138 33 40 0 211
630 Rappahannock Regional Jail 176 7 58 0 241
650 Hampton Correctional Facility 6 0 11 0 17
690 Martinsville City Jail 15 0 14 0 29
700 Newport News City Jail 241 0 39 241 521
710 Norfolk City Jail 0 0 19 0 19
760 Richmond City Jail 205 0 0 0 205
810 Virginia Beach Correction Ctr 0 0 0 1623 1623
Totals 3220 500 1121 3201 8042

62
Appendix J: Mental Health Medication Dispensed
Jail
Num Jail Name
Inmates
Receiving
AntiPsychotic
Meds
Inmates
Receiving
Mood
Disorder
Meds
Inmates
Receiving
AntiDepressant
Meds
Inmates
Receiving
AntiAnxiety
Meds
Inmates
Refused
Meds
Total Meds
Dispensed
001 Accomack County Jail 6 6 19 3 3 34
003 Albemarle-Charlottesville Regional Jail 46 26 130 6 5 208
005 Alleghany County Regional Jail 0 0 0 0 0 0
013 Arlington County Detention Facility 27 3 0 37 14 67
023 Botetourt County Jail 17 45 31 3 0 96
037 Charlotte County Jail 8 2 3 3 0 16
041 Chesterfield County Jail 10 2 38 4 0 54
047 Culpeper County Adc 15 9 10 2 1 36
059 Fairfax Adult Detention Center 80 23 139 26 11 268
061 Fauquier County Jail 10 19 20 10 0 59
067 Franklin County Jail 0 0 0 0 0 0
069 Northwestern Regional Jail 62 49 142 74 3 327
073 Gloucester County Jail 2 4 16 5 1 27
087 Henrico County Jail 28 103 140 195 0 466
089 Henry County Jail 37 9 59 0 0 105
103 Lancaster Correctional Center 3 1 2 2 0 8
107 Loudoun County Adult Detention 19 13 15 6 0 53
119 Middle Peninsula Regional 21 14 29 2 4 66
121 Montgomery County Jail 6 2 9 1 0 18
131 Eastern Shore Regional Jail 7 3 18 0 2 28
135 Piedmont Regional Jail 55 35 107 31 71 228
137 Central Virginia Regional Jail 41 29 116 3 4 189
139 Page County Jail 7 3 6 7 1 23
141 Patrick County Jail 21 8 12 6 2 47
143 Pittsylvania County Jail 3 9 19 0 0 31
153 Pr. William/Manassas Regional 59 37 43 15 15 154
161 Roanoke County/Salem Jail 14 11 32 3 0 60
163 Rockbridge Regional Jail 6 4 19 0 1 29
165
Rockingham-Harrisonburg Regional
Jail 30 24 74 34 0 162
175 Southampton County Jail 3 2 4 0 0 9
183 Sussex County Jail 0 8 7 2 0 17
193 Northern Neck Regional Jail 12 8 34 6 0 60
460 Pamunkey Regional Jail 40 24 62 5 0 131

63
Jail
Num Jail Name
Inmates
Receiving
AntiPsychotic
Meds
Inmates
Receiving
Mood
Disorder
Meds
Inmates
Receiving
AntiDepressant
Meds
Inmates
Receiving
AntiAnxiety
Meds
Inmates
Refused
Meds
Total Meds
Dispensed
465 Riverside Regional Jail 357 96 465 70 0 988
470 Virginia Peninsula Regional 33 20 52 0 1 105
475 Hampton Roads Regional Jail 219 228 332 273 100 1052
480 New River Regional Jail 40 41 93 38 0 212
485 Blue Ridge Regional Jail 99 54 229 131 23 513
490 Peumansend Creek Regional 1 1 2 0 0 4
491 Southside Regional Jail 9 5 14 1 0 29
492 Southwest Virginia Regional Jail 157 104 444 153 9 858
493 Middle River Regional Jail 68 35 120 50 3 273
494 Western Virginia Regional Jail 77 170 400 216 553 863
495 Meherrin River Regional Jail 15 3 53 1 0 72
496 Rsw Regional Jail 38 43 71 25 9 177
510 Alexandria Detention Center 22 15 59 0 14 96
520 Bristol City Jail 14 7 24 0 1 45
550 Chesapeake City Jail 51 27 57 50 61 185
590 Danville City Jail 16 5 35 16 0 72
620 Western Tidewater Regional 35 23 28 0 9 86
630 Rappahannock Regional Jail 24 23 32 10 14 89
650 Hampton Correctional Facility 56 33 19 0 0 108
690 Martinsville City Jail 22 1 5 1 0 29
700 Newport News City Jail 32 21 39 25 28 117
710 Norfolk City Jail 58 25 125 93 153 301
740 Portsmouth City Jail 10 8 16 15 0 49
760 Richmond City Jail 143 18 236 51 128 448
770 Roanoke City Jail 45 53 208 78 5 384
810 Virginia Beach Correction Ctr 107 69 305 1 374 482
Totals 2443 1663 4818 1789 1623 10713

64
Appendix K: Most Serious Offense of Inmates with Mental Illness in Jails
Jail
Num Jail Name
Inmates whose
Most Serious
Offense
Reported as a
Felony
Inmates
whose Most
Serious
Offense
Reported as a
Misdemeanor
Inmates
whose Most
Serious
Offense
Reported as
Violent
Inmates whose
Most Serious
Offense
Reported as
Drug Related
Inmates
whose Most
Serious
Offense is
Non-Violent
Total
Inmates
Reported
001 Accomack County Jail 20 2 7 1 13 22
003
Albemarle-Charlottesville
Regional Jail 149 12 60 26 82 161
005 Alleghany County Regional Jail 42 9 10 11 28 51
013
Arlington County Detention
Facility 154 48 53 46 107 202
023 Botetourt County Jail 35 8 9 8 26 64
037 Charlotte County Jail 5 0 3 2 0 5
041 Chesterfield County Jail 22 35 1 0 56 57
047 Culpeper County Adc 2 10 1 0 11 13
059 Fairfax Adult Detention Center 161 35 59 25 98 199
061 Fauquier County Jail 9 8 3 12 2 25
067 Franklin County Jail 0 0 0 0 0 0
069 Northwestern Regional Jail 141 26 35 67 60 222
073 Gloucester County Jail 11 9 5 2 14 20
087 Henrico County Jail 163 35 58 22 111 198
089 Henry County Jail 46 24 12 0 58 70
103 Lancaster Correctional Center 3 0 3 0 0 3
107
Loudoun County Adult
Detention 126 12 41 30 64 138
119 Middle Peninsula Regional 24 17 9 4 28 43
121 Montgomery County Jail 51 47 15 18 66 99
131 Eastern Shore Regional Jail 18 0 4 0 14 18
135 Piedmont Regional Jail 50 39 43 23 26 89
137 Central Virginia Regional Jail 1 33 6 19 9 46
139 Page County Jail 67 13 25 10 40 80
141 Patrick County Jail 15 10 8 5 13 44
143 Pittsylvania County Jail 23 34 5 14 38 57
153 Pr. William/Manassas Regional 104 17 42 14 65 121
161 Roanoke County/Salem Jail 17 14 6 1 23 31
163 Rockbridge Regional Jail 41 0 13 16 13 41
165
Rockingham-Harrisonburg
Regional Jail 54 14 12 12 33 70
175 Southampton County Jail 2 1 3 0 0 3

65
Jail
Num Jail Name
Inmates whose
Most Serious
Offense
Reported as a
Felony
Inmates
whose Most
Serious
Offense
Reported as a
Misdemeanor
Inmates
whose Most
Serious
Offense
Reported as
Violent
Inmates whose
Most Serious
Offense
Reported as
Drug Related
Inmates
whose Most
Serious
Offense is
Non-Violent
Total
Inmates
Reported
193 Northern Neck Regional Jail 14 4 6 3 9 18
460 Pamunkey Regional Jail 9 26 3 14 18 47
465 Riverside Regional Jail 286 35 117 61 142 321
470 Virginia Peninsula Regional 50 5 15 1 35 55
475 Hampton Roads Regional Jail 443 17 182 54 224 463
480 New River Regional Jail 85 2 33 22 31 87
485 Blue Ridge Regional Jail 253 55 96 93 108 308
490 Peumansend Creek Regional 2 1 1 1 1 6
491 Southside Regional Jail 11 3 1 1 12 14
492
Southwest Virginia Regional
Jail 431 25 126 159 177 459
493 Middle River Regional Jail 96 118 55 59 102 217
494 Western Virginia Regional Jail 364 40 75 85 213 405
495 Meherrin River Regional Jail 53 3 20 10 25 56
496 Rsw Regional Jail 76 4 14 25 38 80
510 Alexandria Detention Center 85 45 40 20 75 131
520 Bristol City Jail 47 5 4 23 25 52
550 Chesapeake City Jail 192 7 41 67 91 199
590 Danville City Jail 34 2 3 3 30 36
620 Western Tidewater Regional 101 6 40 18 44 107
630 Rappahannock Regional Jail 151 26 60 47 62 179
650 Hampton Correctional Facility 49 12 12 6 43 61
690 Martinsville City Jail 30 1 9 2 20 31
700 Newport News City Jail 73 12 36 6 54 87
710 Norfolk City Jail 148 9 67 13 93 157
740 Portsmouth City Jail 24 2 12 2 12 27
760 Richmond City Jail 147 31 67 32 79 178
770 Roanoke City Jail 326 49 64 48 201 377
810 Virginia Beach Correction Ctr 105 39 36 18 84 154
Totals 5246 1097 1786 1282 3151 6510

66
Appendix L: Incidents of Inmate Aggression
Jail
Num Jail Name
Num of Incidents
of Inmate
Aggression twd
Other Inmates
Num of Incidents
of Inmate
Aggression twd
Jail Staff
Num of
Perpetrators
MI
Num of
Victims MI
001 Accomack County Jail 5 0 3 1
003 Albemarle-Charlottesville Regional Jail 5 9 7 1
005 Alleghany County Regional Jail 0 0 0 0
013 Arlington County Detention Facility 0 0 0 0
023 Botetourt County Jail 0 0 0 0
037 Charlotte County Jail 0 0 0 0
041 Chesterfield County Jail 3 1 0 0
047 Culpeper County Adc 2 2 2 0
059 Fairfax Adult Detention Center 18 9 8 1
061 Fauquier County Jail 0 0 0 0
067 Franklin County Jail 0 0 0 0
069 Northwestern Regional Jail 3 2 4 0
073 Gloucester County Jail 1 0 0 0
087 Henrico County Jail 0 0 0 0
089 Henry County Jail 1 0 0 0
103 Lancaster Correctional Center 0 0 0 0
107 Loudoun County Adult Detention 9 5 5 1
119 Middle Peninsula Regional 0 3 2 0
121 Montgomery County Jail 0 0 0 0
131 Eastern Shore Regional Jail 1 0 0 1
135 Piedmont Regional Jail 2 0 0 0
137 Central Virginia Regional Jail 0 0 0 0
139 Page County Jail 0 0 0 0
141 Patrick County Jail 3 0 5 0
143 Pittsylvania County Jail 0 0 0 0
153 Pr. William/Manassas Regional 34 9 11 4
161 Roanoke County/Salem Jail 1 0 0 0
163 Rockbridge Regional Jail 2 1 2 1
165 Rockingham-Harrisonburg Regional Jail 0 0 0 0
175 Southampton County Jail 0 0 0 0
183 Sussex County Jail 0 0 0 0
193 Northern Neck Regional Jail 0 0 0 0
460 Pamunkey Regional Jail 0 0 0 0
465 Riverside Regional Jail 6 4 1 2

67
Jail
Num Jail Name
Num of Incidents
of Inmate
Aggression twd
Other Inmates
Num of Incidents
of Inmate
Aggression twd
Jail Staff
Num of
Perpetrators
MI
Num of
Victims MI
470 Virginia Peninsula Regional 23 0 2 1
475 Hampton Roads Regional Jail 6 9 28 15
480 New River Regional Jail 11 3 0 1
485 Blue Ridge Regional Jail 7 7 6 2
490 Peumansend Creek Regional 7 0 0 0
491 Southside Regional Jail 1 2 1 0
492 Southwest Virginia Regional Jail 11 2 2 0
493 Middle River Regional Jail 8 2 3 1
494 Western Virginia Regional Jail 10 1 1 3
495 Meherrin River Regional Jail 0 0 0 0
496 Rsw Regional Jail 10 0 0 2
510 Alexandria Detention Center 1 1 1 1
520 Bristol City Jail 7 1 4 1
550 Chesapeake City Jail 7 0 5 1
590 Danville City Jail 2 0 0 0
620 Western Tidewater Regional 0 1 1 0
630 Rappahannock Regional Jail 56 21 0 0
650 Hampton Correctional Facility 0 2 0 0
690 Martinsville City Jail 0 0 0 0
700 Newport News City Jail 5 0 0 1
710 Norfolk City Jail 21 3 11 9
740 Portsmouth City Jail 1 5 4 0
760 Richmond City Jail 13 0 8 0
770 Roanoke City Jail 0 2 2 0
810 Virginia Beach Correction Ctr 18 1 5 3
Totals 321 108 134 53
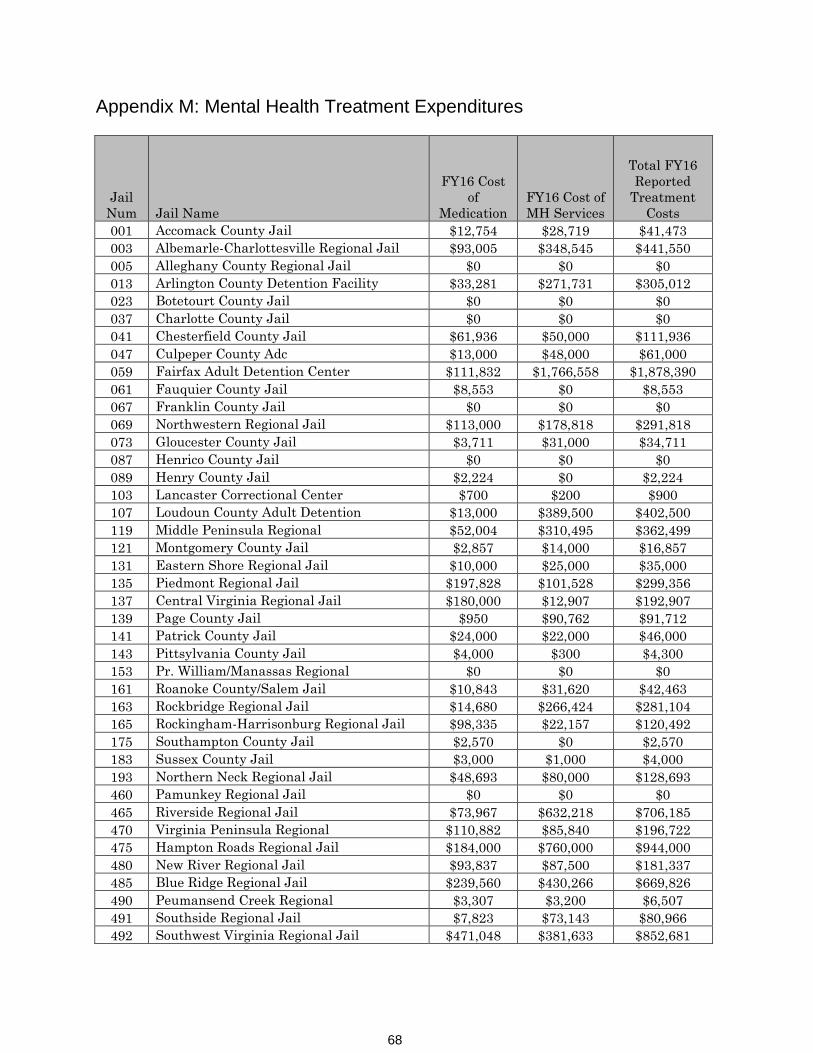
68
Appendix M: Mental Health Treatment Expenditures
Jail
Num Jail Name
FY16 Cost
of
Medication
FY16 Cost of
MH Services
Total FY16
Reported
Treatment
Costs
001 Accomack County Jail $12,754 $28,719 $41,473
003 Albemarle-Charlottesville Regional Jail $93,005 $348,545 $441,550
005 Alleghany County Regional Jail $0 $0 $0
013 Arlington County Detention Facility $33,281 $271,731 $305,012
023 Botetourt County Jail $0 $0 $0
037 Charlotte County Jail $0 $0 $0
041 Chesterfield County Jail $61,936 $50,000 $111,936
047 Culpeper County Adc $13,000 $48,000 $61,000
059 Fairfax Adult Detention Center $111,832 $1,766,558 $1,878,390
061 Fauquier County Jail $8,553 $0 $8,553
067 Franklin County Jail $0 $0 $0
069 Northwestern Regional Jail $113,000 $178,818 $291,818
073 Gloucester County Jail $3,711 $31,000 $34,711
087 Henrico County Jail $0 $0 $0
089 Henry County Jail $2,224 $0 $2,224
103 Lancaster Correctional Center $700 $200 $900
107 Loudoun County Adult Detention $13,000 $389,500 $402,500
119 Middle Peninsula Regional $52,004 $310,495 $362,499
121 Montgomery County Jail $2,857 $14,000 $16,857
131 Eastern Shore Regional Jail $10,000 $25,000 $35,000
135 Piedmont Regional Jail $197,828 $101,528 $299,356
137 Central Virginia Regional Jail $180,000 $12,907 $192,907
139 Page County Jail $950 $90,762 $91,712
141 Patrick County Jail $24,000 $22,000 $46,000
143 Pittsylvania County Jail $4,000 $300 $4,300
153 Pr. William/Manassas Regional $0 $0 $0
161 Roanoke County/Salem Jail $10,843 $31,620 $42,463
163 Rockbridge Regional Jail $14,680 $266,424 $281,104
165 Rockingham-Harrisonburg Regional Jail $98,335 $22,157 $120,492
175 Southampton County Jail $2,570 $0 $2,570
183 Sussex County Jail $3,000 $1,000 $4,000
193 Northern Neck Regional Jail $48,693 $80,000 $128,693
460 Pamunkey Regional Jail $0 $0 $0
465 Riverside Regional Jail $73,967 $632,218 $706,185
470 Virginia Peninsula Regional $110,882 $85,840 $196,722
475 Hampton Roads Regional Jail $184,000 $760,000 $944,000
480 New River Regional Jail $93,837 $87,500 $181,337
485 Blue Ridge Regional Jail $239,560 $430,266 $669,826
490 Peumansend Creek Regional $3,307 $3,200 $6,507
491 Southside Regional Jail $7,823 $73,143 $80,966
492 Southwest Virginia Regional Jail $471,048 $381,633 $852,681

69
Jail
Num Jail Name
FY16 Cost
of
Medication
FY16 Cost of
MH Services
Total FY16
Reported
Treatment
Costs
493 Middle River Regional Jail $125,404 $234,005 $359,409
494 Western Virginia Regional Jail $83,570 $177,640 $261,210
495 Meherrin River Regional Jail $0 $0 $0
496 Rsw Regional Jail $78,000 $118,000 $196,000
510 Alexandria Detention Center $24,206 $1,002,703 $1,026,909
520 Bristol City Jail $24,500 $8,000 $32,500
550 Chesapeake City Jail $56,000 $218,000 $274,000
590 Danville City Jail $67,908 $0 $67,908
620 Western Tidewater Regional $124,792 $235,472 $360,264
630 Rappahannock Regional Jail $290,000 $280,000 $570,000
650 Hampton Correctional Facility $1,948 $0 $1,948
690 Martinsville City Jail $550 $23,277 $23,827
700 Newport News City Jail $26,764 $151,000 $177,764
710 Norfolk City Jail $69,364 $201,903 $271,267
740 Portsmouth City Jail $8,265 $65,260 $73,525
760 Richmond City Jail $92,646 $256,700 $349,346
770 Roanoke City Jail $48,812 $189,754 $238,566
810 Virginia Beach Correction Ctr $260,000 $570,000 $830,000
Total $3,683,909 $10,276,778 $13,960,687

70
Appendix N: CIT Program & Assessment Sites
Crisis Intervention Teams (CIT) and Assessment
Sites
27
12
10
23
20
24
29
4
1137
236
18
5 9
34
2631
32
21
14
31
35
1517
197
28
406
38
30
25
168
22
1339
33
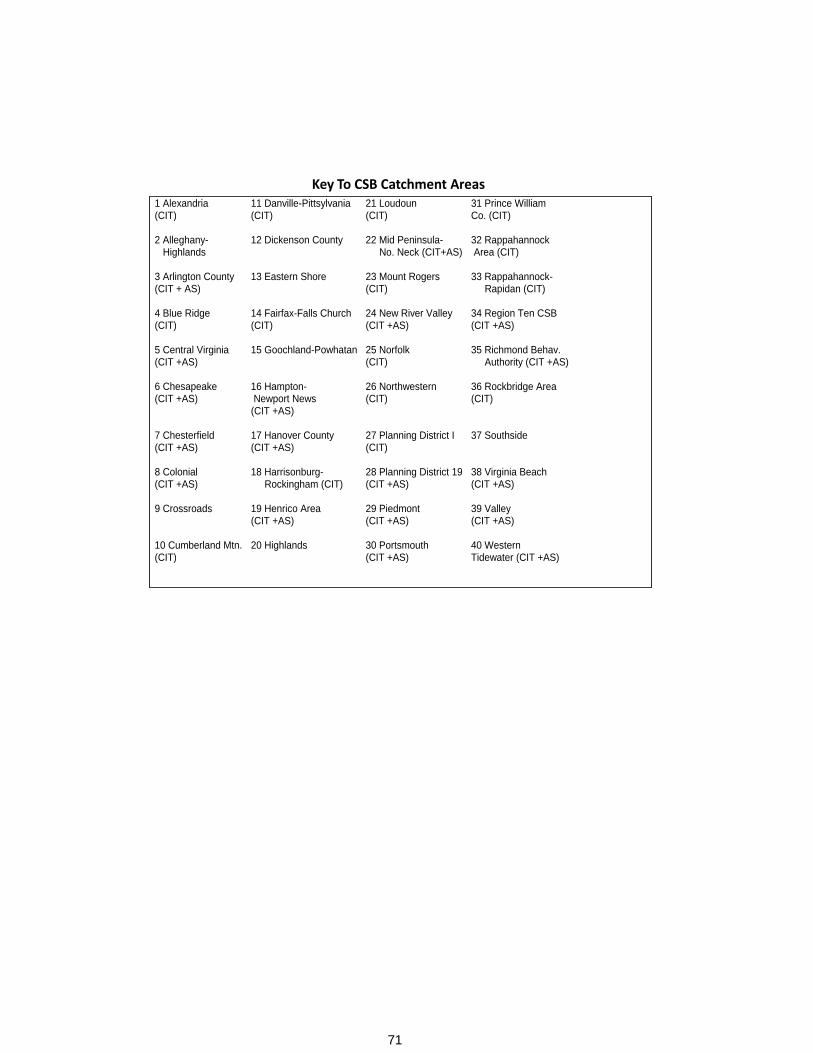
71
1 Alexandria 11 Danville-Pittslyvania 21 Loudoun 31 Prince William Co. 2 Alleghany- Highlands
12 Dickenson County 22 Mid Peninsula- No. Neck
32 Rappahannock Area
3 Arlington County 13 Eastern Shore 23 Mount Rogers 33 Rappahannock- Rapidan
4 Blue Ridge 14 Fairfax-Falls Church 24 New River Valley 34 Region Ten CSB 5 Central Virginia 15 Goochland-Powhatan 25 Norfolk 35 Richmond Behav.
Authority 6 Chesapeake 16 Hampton-
Newport News 26 Northwestern 36 Rockbridge Area
7 Chesterfield 17 Hanover County 27 Planning District I 37 Southside 8 Colonial 18 Harrisonburg-
Rockingham 28 Planning District 19 38 Virginia Beach
9 Crossroads 19 Henrico Area 29 Piedmont 39 Valley 10 Cumberland Mtn. 20 Highlands 30 Portsmouth 40 Western Tidewater
1 Alexandria (CIT)
11 Danville-Pittsylvania (CIT)
21 Loudoun (CIT)
31 Prince William Co. (CIT)
2 Alleghany- Highlands
12 Dickenson County 22 Mid Peninsula- No. Neck (CIT+AS)
32 Rappahannock Area (CIT)
3 Arlington County (CIT + AS)
13 Eastern Shore 23 Mount Rogers (CIT)
33 Rappahannock- Rapidan (CIT)
4 Blue Ridge (CIT)
14 Fairfax-Falls Church (CIT)
24 New River Valley (CIT +AS)
34 Region Ten CSB (CIT +AS)
5 Central Virginia (CIT +AS)
15 Goochland-Powhatan 25 Norfolk (CIT)
35 Richmond Behav. Authority (CIT +AS)
6 Chesapeake (CIT +AS)
16 Hampton- Newport News (CIT +AS)
26 Northwestern (CIT)
36 Rockbridge Area (CIT)
7 Chesterfield (CIT +AS)
17 Hanover County (CIT +AS)
27 Planning District I (CIT)
37 Southside
8 Colonial (CIT +AS)
18 Harrisonburg- Rockingham (CIT)
28 Planning District 19 (CIT +AS)
38 Virginia Beach (CIT +AS)
9 Crossroads 19 Henrico Area (CIT +AS)
29 Piedmont (CIT +AS)
39 Valley (CIT +AS)
10 Cumberland Mtn. (CIT)
20 Highlands 30 Portsmouth (CIT +AS)
40 Western Tidewater (CIT +AS)
Key To CSB Catchment Areas


72
Appendix P: Amendments to Prior Years There are no amendments to prior years survey data this year.

73
Appendix Q: Relevant Links
Virginia Crisis Intervention Team Coalition
http://www.vacitcoalition.org/
Virginia Association of Community Services Boards
http://www.vacsb.org/index.htm
Community Services Board 2015 Annual Report
http://www.vacsb.org/Misc/FINAL_2015%20AR.pdf
Office of the Inspector General “A Review of Mental Health Services in Local and Regional
Jails-2014”
https://osig.virginia.gov/media/2409/20140113jailstudyreport.pdf
NAMI Virginia-National Alliances on Mental Illness in Virginia
http://namivirginia.org/
Code of Virginia 19.2-169.6
http://law.lis.virginia.gov/vacode/title19.2/chapter11/section19.2-169.6/
Code of Virginia 37.2-809
http://law.lis.virginia.gov/vacode/title37.2/chapter8/section37.2-809/