Embed Size (px)
Citation preview
MEMORANDUM November 11, 2013
TO: Board Members
FROM: Terry B. Grier, Ed.D.
Superintendent of Schools
CONTACT: Carla Stevens, 713-556-6700
SUBJECT: APEX LEARNING ONLINE INSTRUCTION, 2011–2012 AND 2012–2013
Attached is the Apex Learning Online Instruction report for 2011–2012 and 2012–2013.
Introduced in every HISD high school in January 2010, Apex Learning is the largest online
provider of secondary curriculum in the district. The program was established to support
seniors in credit recovery and has grown to offer students in grades 6–12 options for completing
both credit recovery and original credit courses, including reviews for state-mandated exams
and honors coursework through Advanced Placement courses. This report documents usage
and academic achievement associated with courses completed through Apex Learning in 2011–
2012 and 2012–2013.
Some of the highlights are as follows:
In 2012–2013, 6,730 HISD students completed 12,872 online courses through Apex
Learning, down from the 6,792 students who completed 14,073 online courses through
Apex Learning in 2011–2012. Apex Learning was the provider for 66 percent of all online
courses completed in HISD in 2011–2012 and 81 percent of all online courses completed in
HISD in 2012–2013.
In 2011–2012, HISD twelfth graders completed 40 percent of the Apex Learning courses
and in 2012–2013, they completed 45 percent of the courses. HISD seventh-graders
completed Apex Learning courses for the first time in 2012–2013.
HISD students who took an Apex Learning course and a Texas Assessment of Knowledge
and Skills (TAKS) test in the same year generally achieved comparable rates of meeting the
TAKS standard but lower rates of being commended for their performance than did all other
HISD students taking the test the same year.
Students who took an Apex Learning course and a State of Texas Assessment of Academic
Readiness/End of Course (STAAR/EOC) exam in the same subject the same year generally
achieved a rating of satisfactory at similar or better rates than did all other HISD students
taking the same test that year but they generally had lower percentages of achieving an
advanced rating.
In 2011–2012, 27 percent of HISD graduates took at least one Apex Learning course.
Ninety-three percent of HISD twelfth graders who completed an Apex Learning course also
graduated while 91 percent of all HISD twelfth graders graduated.
HISD students completed 302 Advanced Placement (AP) courses through Apex Learning in
2011–2012 and 86 AP courses through Apex Learning in 2012–2013. In 2011–2012, 157 of
the AP courses were associated with an AP exam, 80 exams were taken, and Apex
students earned passing scores (scores of 3 or higher) on eight (10 percent) of them. In
2012–2013, 42 Apex Learning AP courses were associated with an AP exam, 18 AP tests
were completed, and Apex Learning students earned passing scores on four (22 percent) of
them.

Should you have any further questions, please contact Carla Stevens in Research and
Accountability at 713-556-6700.
TBG
Attachment cc: Superintendent’s Direct Reports Chief School Officers Richard Cruz Jaime Castaneda Jeanine Wilson School Support Officers

RESEARCHE d u c a t i o n a l P r o g r a m R e p o r t
D E PA R T M E N T O F R E S E A R C H A N D A C C O U N TA B I L I T YH O U S T O N I N D E P E N D E N T S C H O O L D I S T R I C T
Apex Learning Online Instruction,
2011–2012 and 2012–2013

2013 Board of Education
Anna EastmanPRESIDENT
Juliet StipecheFIRST VICE PRESIDENT
Manuel Rodriguez, Jr.SECOND VICE PRESIDENT
Rhonda Skillern-JonesSECRETARY
Michael L. LuncefordASSISTANT SECRETARY
Paula HarrisLawrence MarshallGreg MeyersHarvin C. Moore
Terry B. Grier, Ed.D.SUPERINTENDENT OF SCHOOLS
Carla StevensASSISTANT SUPERINTENDENTDEPARTMENT OF RESEARCH AND ACCOUNTABILITY
Lissa Heckelman, Ph.D.RESEARCH SPECIALIST
Harry M. SeligRESEARCH MANAGER
Houston Independent School DistrictHattie Mae White Educational Support Center4400 West 18th StreetHouston, Texas 77092-8501
www.houstonisd.org
It is the policy of the Houston Independent School District not to discriminate on the basis of age, color, handicap or disability, ancestry, national origin, marital status, race, religion, sex, veteran status, or political affiliation in its educational or employment programs and activities.

HISD Research and Accountability__________________________________________________________________________ 1
APEX LEARNING ONLINE INSTRUCTION, 2011–2012 AND 2012–2013
Executive Summary Evaluation Description Apex Learning is the largest provider of secondary digital curriculum in Houston Independent School District (HISD). Introduced in January 2010 through Graduation Laboratories (Grad Labs) located at each high school, the program has grown from providing seniors with opportunities to recover credits required for graduation to providing secondary students with options for completing both recovery and original credit courses in grades 6–12. This report continues the documentation of usage, graduation rates and academic performance associated with Apex Learning courses begun at its inception in 2010. It also addresses the completion of Apex Learning Texas Assessment of Knowledge and Skills (TAKS) and other providers’ State of Texas Assessment of Academic Readiness (STAAR) review courses, courses offered only at schools that elect to fund the services to support students who need to retake state-mandated tests. Finally, with the addition of Apex Learning Advanced Placement (AP) course options in HISD, this report provides information about program usage and student performance on the associated AP exams compared with the performance of all other students who took AP tests in the district. Highlights In 2012–2013, 6,730 HISD students completed 12,872 online courses through Apex Learning, down
from the 6,792 students who completed 14,073 online courses through Apex Learning in 2011–2012. Apex Learning courses comprised 66 percent of all online courses completed in HISD in 2011–2012 and 81 percent of all online courses completed in 2012–2013.
The number of courses completed through Apex Learning increased as the grade level of students
rose. In 2011–2012, twelfth graders took 40 percent of the completed Apex Learning courses and in 2012–2013, they completed 45 percent of the courses. Seventh-graders completed Apex Learning courses for the first time in 2012–2013.
In 2012–2013, more Apex Learning courses were completed in Spanish than in any of the core academic areas. Of the core academic areas, the most courses were completed in social studies and the fewest were completed in mathematics.
Students who took an Apex Learning course and a TAKS examination in the same subject the same year generally achieved comparable rates of meeting the TAKS standard but lower rates of being commended for their performance than did all other HISD students. In 2012–2013, there were no significant differences between the TAKS performance of Apex Learning students and the performance of all other HISD students in meeting the standard on any of the eleventh-grade tests or for being commended on performance on the science test, but significantly fewer Apex Learning students achieved commended status on the reading, mathematics, and social studies tests than did all other HISD students.

HISD Research and Accountability__________________________________________________________________________ 2
In both 2011–2012 and 2012–2013, Apex Learning students who took an Apex Learning course and a State of Texas Assessment of Academic Readiness/End of Course (STAAR/EOC) examination in the same subject the same year had performances that either exceeded or did not differ significantly from the performance of all other HISD students in achieving satisfactory ratings on the tests. Apex Learning students had significantly higher rates than all other HISD students of achieving a satisfactory rating on the 2011–2012 English I-reading and world geography exams and on the 2012–2013 geometry test. On the STAAR/EOC exams the same years, they had lower percentages of achieving an advanced rating on all but one of the tests (2011–2012 world geography). The differences were significant for the 2011–2012 algebra I test and for the 2012–2013 English II-reading, geometry, chemistry, world geography, and world history tests.
In 2011–2012, 93 percent of twelfth-grade students who took an Apex Learning course graduated while 91 percent of all HISD twelfth graders graduated the same year. Apex Learning students had lower rates of graduating through the recommended and distinguished graduation plans and a higher rate of graduating through the minimum/Individualized Education Plan (IEP) plans than did all students in HISD.
One TAKS review course was completed through Apex Learning in 2011–2012 and three were completed in 2012–2013, too few to allow reports of student performance on the TAKS retests. No STAAR/EOC review courses were completed through Apex Learning in the same time period.
HISD students completed 302 Advanced Placement (AP) courses through Apex Learning in 2011–2012, 77 percent of all online AP courses completed, and 86 courses in 2012–2013, 75 percent of all online AP courses completed in the district.
HISD students earned credit in 157 Apex Learning AP courses associated with an AP exam and they took 80 associated AP exams in 2011–2012. In 2012–2013, students took 42 Apex Learning AP courses associated with an exam and 18 AP tests. Apex Learning students earned passing scores (a score of 3 or more) on 10 percent of the AP exams they took in 2011–2012 while all other HISD students passed 31 percent of the tests. In 2012–2013, Apex Learning students passed 22 percent of the AP exams they took in association with an Apex Learning AP test.
Recommendations Apex Learning offers a broad range of options for HISD students to complete coursework outside
traditional school hours and spaces. The program is now well established in the district and provides a growing percentage of the courses completed online. It is recommended that the district continue to fully support this program in its efforts to provide students diverse options for completing graduation requirements.
Though Apex Learning supports students in meeting passing standards on standardized tests, it is
less successful in supporting commended or advanced ratings, including passing rates on Advanced Placement tests. It is recommended that the program be bolstered to better support high achievement on tests associated with the online courses.

HISD Research and Accountability__________________________________________________________________________ 3
Administrative Response
The implementation of Graduation Labs was instrumental in HISD’s increased graduation rate. Evidence of this is the fact that 27% of HISD 2011–2012 graduating seniors completed at least one Apex Learning course in their senior year. Additionally, expanding the use of the APEX Learning courseware beyond credit recovery has resulted in positive outcomes for students in need of remediation and original credit. The utilization of APEX Learning courseware as a remediation tool for students in need of passing state-mandated tests was introduced as an alternative to supporting students outside of the regular school day. Although the data was insufficient to determine the impact of the APEX TAKS review courses on student test performance, exposure to APEX courseware content has proven to be beneficial for students who took the Exit-Level TAKS and STAAR/EOC exams. Next steps for improving this program include the development of targeted courses designed to prepare students for select state-mandated tests. The conclusion that APEX Learning students have had less success in demonstrating high achievement in content mastery can be attributed to the low reading levels among students who are assigned to the Graduation Labs. For many students, achieving basic mastery of assessment objectives is challenging and requires multiple approaches toward remediation. A similar situation exists among the students who took an AP course in APEX and scored significantly lower than the other HISD students who took the same exam. This can be attributed to the decreased exposure to rigorous course content prior to taking the AP course in APEX. Therefore, many of these students took the course and the exam without the requisite skills for success. Next steps for improving this program include collaboration with the Advanced Academics department to outline a hybrid approach toward using the APEX Learning courseware for AP courses. The introduction of the STAAR/EOC exams and the subsequent decision of the Curriculum, Instruction, and Assessment department to limit the number of online courses taken for original credit can be attributed to the drop in usage of APEX Learning courses between 2011–2012 and 2012–2013. Because online learning options will remain as an avenue for students to successfully satisfy graduation requirements, increased efforts of departments working collaboratively (i.e. Curriculum, Advanced Academics, Virtual Schools, etc.) to increase advanced levels of student achievement is warranted.

HISD Research and Accountability__________________________________________________________________________ 4
Introduction The Apex Learning program is a comprehensive set of digital courses designed to meet the needs of several groups of secondary students, specifically, those who struggle to meet academic requirements, those who are high-performing but not sufficiently challenged, and those whose circumstances prevent them from attending traditional classes regularly enough to complete them. According to literature from the company, “Apex Learning comprehensive courses enable schools to meet these challenges by making rigorous content accessible and engaging through the use of active learning strategies and opt-in scaffolding delivered at students’ differing levels of academic readiness” (Apex Learning, 2013a, page 4). Houston Independent School District (HISD) began using Apex Learning courses in January 2010 through its newly established Graduation Laboratories (Grad Labs) located at each high school. Courses were available for seniors seeking credit recovery to allow them to graduate from high school. Over time more of the resources available through Apex Learning were made available to HISD students. In the 2012–2013 academic year, students in grades 6–12 accessed courses designed for credit recovery and original credit, including Advanced Placement (AP courses). In addition, individual schools contracted for the option to provide Apex Learning courses that allowed their students to review before taking state-mandated exams. This report documents the prevalence of Apex Learning courses in HISD and indicators of academic achievement associated with them. Further, it indicates the prevalence of the students’ use of Apex Learning courses and courses through other providers for reviews for state-mandated tests. And finally, it provides documentation of completion of AP Apex Learning courses and completers’ scores on the associated AP exams, compared with the AP exam scores of HISD students who did not take the AP courses online.
Methods Data Collection and Analysis Data for online courses were drawn from Chancery, using a “z” in the special explanations field.
Courses with the provider HIL (Houston Instructor Led) and records associated with schools outside HISD were not included in the totals. Not all students who completed courses, including some who earned passing grades, earned credit, for example, some students received credit for the same courses through other providers. Results were reported for the number of courses completed and totals for courses in which students earned credit were reported separately.
Numbers of courses were counted using local course names in order to capture information about
original credit, credit recovery and review courses for state-mandated tests. Numbers of AP courses were counted using state numbers that began with “A.”
Chi Square Test of Independence analyses were used for the results of criterion referenced tests (the state-mandated exams), and independent samples t-test analyses were used for the results of norm-referenced tests (the Advanced Placement exams).
HISD Research and Accountability__________________________________________________________________________ 5
Texas Assessment of Knowledge and Skills (TAKS) scores for Chi Square Test of Independence analyses were limited to students with scores on the standard version of the tests. For each test, HISD students who took the test were divided into two groups: those who had taken an Apex Learning course in the subject of the test in the same year and those who had not taken an Apex Learning course in the subject that year. Two Chi Square tests were run for each examination, one for the two groups of students meeting the state standard or not and the other for their achieving commended status on the test or not.
State of Texas Assessment of Academic Readiness End of Course (STAAR EOC) scores for Chi Square Test of Independence analyses were limited to students in ninth-grade or lower in 2011–2012 and students in tenth grade or lower in 2012–2013 with scores on the standard versions of the tests. Students who had taken an Apex Learning course associated with a STAAR exam the same year of the test were included and their results were compared with those of other HISD students in the same grades who had taken the same test the same year.
Advanced Placement (AP) scores were provided by the College Board. The performance of students who had taken a course through Apex Learning that was associated with preparation for an Advanced Placement exam (i.e., the second semester of a full year AP course or completion of an AP course normally completed in a single semester) was compared with the performance of all other HISD students who had not taken the AP course online and who had taken the same test the same year. Independent samples t-tests were run to compare Apex Learning students’ results with those of other students in HISD who took the same test only for examinations with a minimum of 30 scores in each group. Of all the AP tests taken in association with Apex Learning courses, only the AP Psychology exam in 2011–2012 had enough scores for the analysis.
Data Limitations The data file for online records contains duplicate records in several ways. For example, some students received credit for original credit and credit recovery for the same course; some students were registered for the same course twice, with a different amount of credit for each registration; and some students received duplicate credit for a course entered more than once with slightly different names or numbers. Registrars at the individual schools are tasked with “cleaning” the records to assure that they indicate the correct number of credits that a student earned and the credits documented in the historical file were credited to students, so all courses, including those in duplicate records, were included in the data for this report. The numbers of students who took courses, however, are unduplicated. An additional limitation is that, due to sample sizes, the AP analysis was conducted on scores for only one AP test, the 2011–2012 Psychology exam, so the results may not be generalizable.
Results
What were the 2012–2013 participation rates in the Apex Learning program and in other online curriculum options within HISD, and how do the rates compare with rates from 2011–2012?
In 2012–2013, 8,055 HISD students completed 15,939 online courses. Of these students, 6,730
completed 12,872 courses through Apex Learning; 1,760 took 3,067 courses through other online

HISD Research and Accountability__________________________________________________________________________ 6
providers, and 435 of the students took courses through Apex Learning and through another online provider. Of the 2012–2013 students who completed courses online, 7,405 completed courses with a single provider, 618 finished courses with two providers, 31 took courses with three providers, and one completed courses with four providers.
The number of completed HISD online courses increased from 13,024 to 21,247 (63 percent) from 2010–2011 to 2011–2012 and decreased to 15,939 (25 percent) in 2012–2013. Courses completed through Apex Learning increased from 8,716 to 14,073 (61 percent) and then decreased to 12,872 (nine percent) over the same years. The number of students completing courses through Apex Learning decreased from 6,792 in 2011–2012 to 6,730 in 2012–2013 (one percent). The number of courses completed through Apex Learning and through other online providers is depicted in Figure 1. Table 1 (page 19) provides an overview of HISD online courses from 2010–2011 through 2012–2013.
Figure 1. Number of online courses by provider, 2010–2011 through 2012–2013
While the total number of online courses completed between 2011–2012 and 2012–2013 decreased by 25 percent, the percentage of Apex Learning (including APEXIS Apex Instructor Supplemented) courses increased from 66 percent of all completed online courses in 2011–2012 to 81 percent in 2012–2013. Numbers and percentages of online courses for all providers are illustrated in Figure 2 (page 7) and detailed in Table 2 (page 20).

HISD Research and Accountability__________________________________________________________________________ 7
Figure 2. Percentage of all online courses provided by Apex Learning
and other online providers, 2010–2011 to 2012–2013
The number of completed online courses designated as credit recovery, the original intent for selecting the Apex Learning program for HISD, is depicted in Figure 3. The number of credit recovery courses has increased each year, though, as seen in Table 1 (page 19), the percentage of completed online credit recovery courses declined between 2010–2011 and 2012–2013 as the options for available courses increased. Fifty-three (53) percent of Apex Learning courses and 20 percent of courses from other online providers were designated as credit recovery in 2010–2011 while in 2012–2013, 48 percent of Apex Learning courses and 12 percent of courses from other online providers were identified as credit recovery.
Figure 3. Number of online credit recovery courses by provider, 2010–2011 through 2012–2013

HISD Research and Accountability__________________________________________________________________________ 8
As seen in Figure 4 and in Table 1 (page 19), HISD students earned credit in a large majority of the
courses that they completed online. Credit was awarded in 94 to 97 percent of completed Apex Learning courses and in 92 to 94 percent of courses through all other providers. Overall, credit was awarded in 96 percent of courses in 2010–2011, 94 percent of courses in 2011–2012, and 94 percent of courses taken in 2012–2013.
Figure 4. Number of online course which HISD students completed and in which they earned credit, by provider, 2010–2011 to 2012–2013
The number of courses completed through Apex Learning increased as the grade level of students rose. A comparison of the number of Apex Learning courses taken in 2011–2012 and 2012–2013, by grade level, can be seen in Figure 5 (page 9). More detail on courses completed at each grade level can be found in Table 3 (page 20). A similar comparison of the number of students completing online courses at each grade level is in Table 4 (page 21). While the overall number of students completing Apex Learning courses declined slightly from 2011–2012 to 2012–2013 (one percent), the number of eleventh-graders increased three percent, the number of twelfth-graders increased four percent, and in 2012–2013, seventh-graders appeared as Apex Learning online course completers for the first time.

HISD Research and Accountability__________________________________________________________________________ 9
Figure 5. Number of Apex Learning courses by grade level,
2011–2012 and 2012–2013
In 2011–2012, 40 percent of Apex Learning courses were taken by students in grade 12, the students originally served by the program, and in 2012–2013, students in grade 12 took 45 percent of the Apex Learning courses. As shown in Figure 6, the percentage of Apex Learning courses completed by twelfth-graders was consistently higher than the percentage of courses twelfth-graders took with other online providers.
Figure 6. Percentage of online courses completed by twelfth-graders,
by provider, 2010–2011 to 2012–2013

HISD Research and Accountability__________________________________________________________________________ 10
The average number of courses completed by students who took courses online in 2012–2013 was 1.9 courses through Apex Learning, 2.2 courses with other providers, and 2.0 courses with all providers. The average number of online courses that students who took online courses in each grade level completed can be found in Table 5 (page 21). The number of courses completed by students who took Apex Learning courses in 2012–2013 ranged from one to 22.
In 2012–2013, 54 HISD schools (42 high schools, including North Forest High School, a school new
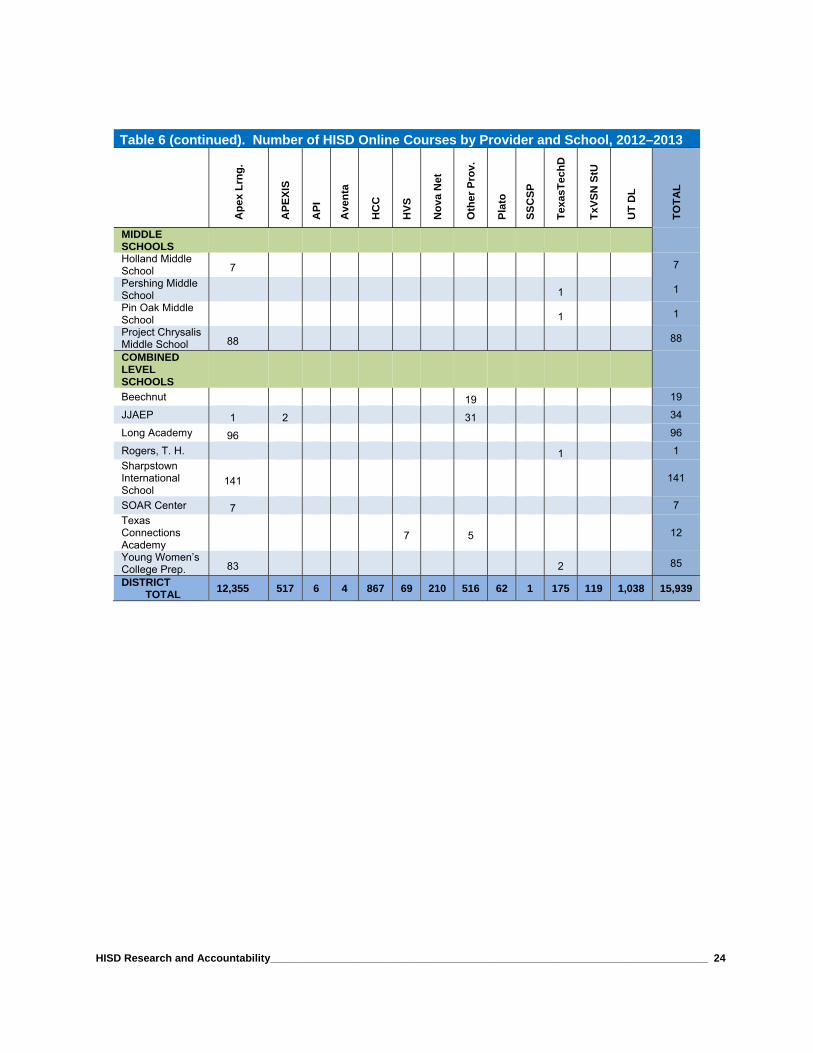
to HISD in the summer of 2013, four middle schools, and eight combined level schools) recorded students’ completion of online courses. Of the 54 schools, 47 reported courses completed through Apex Learning; those indicating that none of the online courses were through Apex Learning included two high schools (North Forest High School and Mt. Carmel Academy), two middle schools (Pershing Middle School and Pin Oak Middle School) and three combined level schools (Beechnut, Rogers, and Texas Connections Academy). The 2012–2013 online providers and the associated course completions at each school are listed in Table 6 (pages 22–24).
At the schools reporting online courses, the percentage of Apex Learning courses ranged from zero percent to 100 percent in both 2011–2012 and 2012–2013. The number and percentage of online courses completed through Apex Learning at each school is shown in Table 7 (pages 25–27).
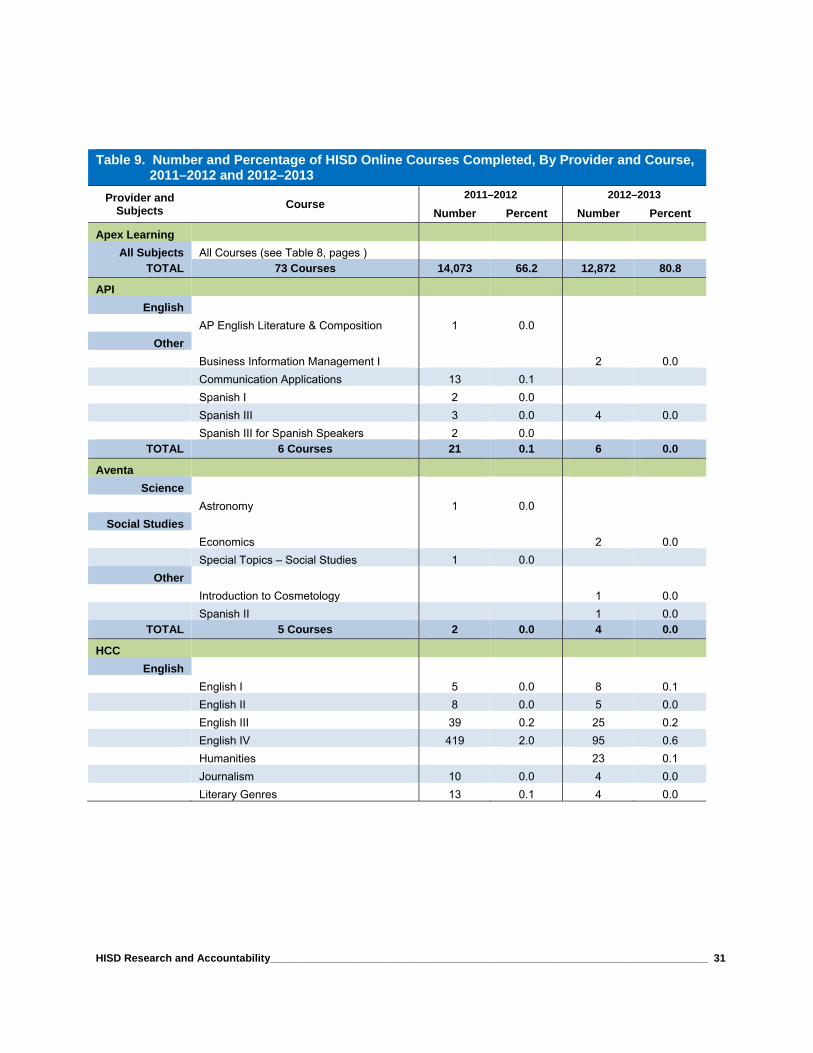
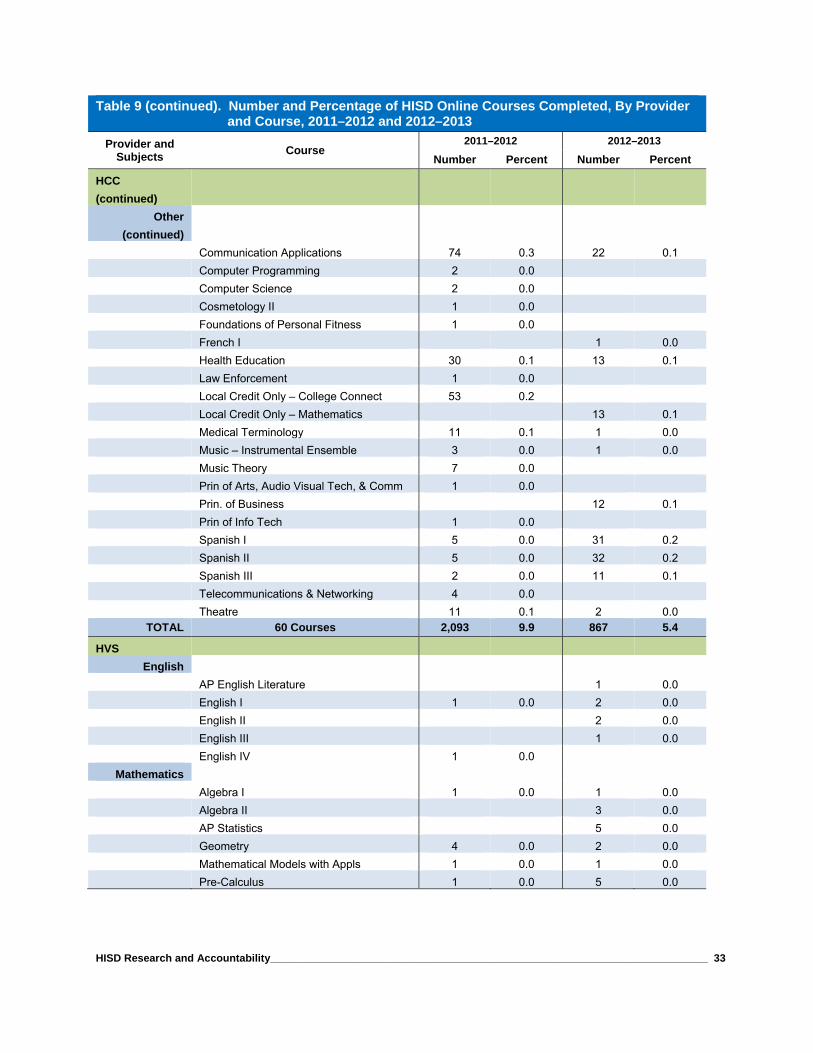
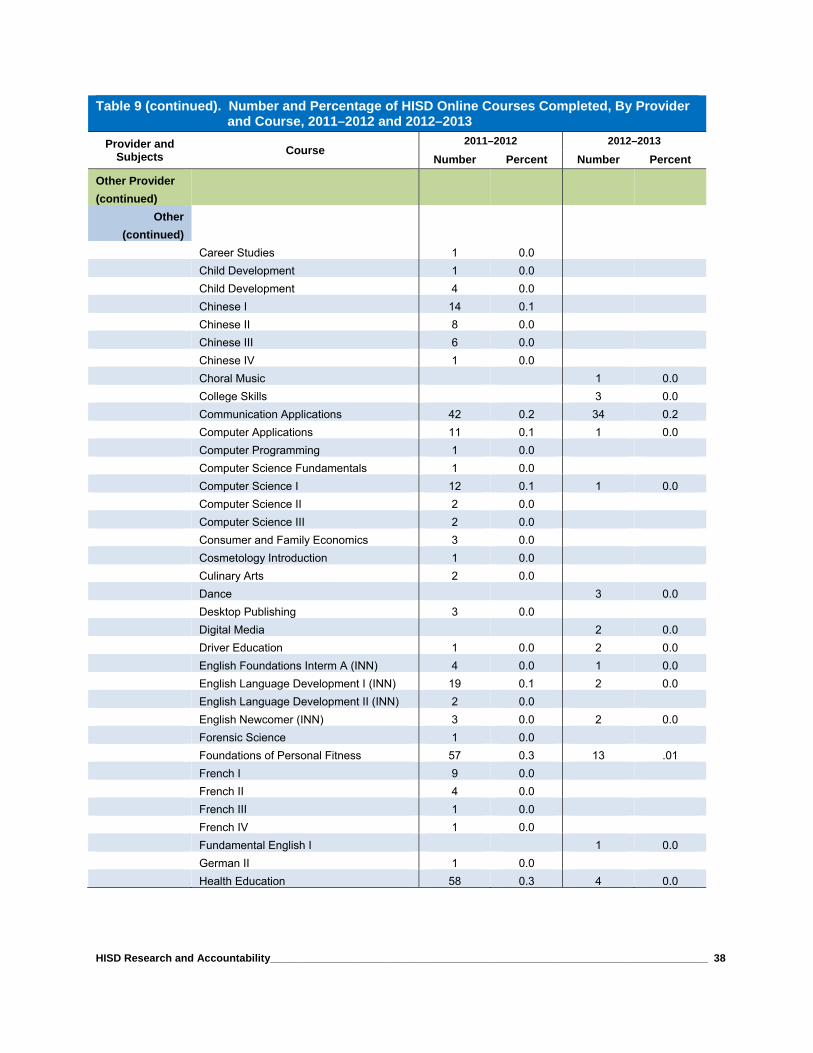
Course names and number completed through Apex Learning in 2011–2012 and 2012–2013 appear in Table 8 (pages 28–30), and course names and number completed through each other online provider is given in Table 9 (pages 31–45). In 2012–2103, more courses, for both Apex Learning and all other online providers, were completed in Spanish than in any of the core academic areas. Of the core academic areas, the most courses were completed in social studies and the fewest were completed in mathematics. Figure 7 (page 11) depicts the number of courses completed in each subject; Spanish courses are separated from the grouping of other courses for the illustration.

HISD Research and Accountability__________________________________________________________________________ 11
Figure 7. Number of online courses completed, by provider and subject, 2012–2013.
What were the 2012–2013 Texas Assessment of Knowledge and Skills (TAKS) and State of Texas Assessment of Academic Readiness/End of Course (STAAR/EOC) results of students utilitizing Apex Learning services compared with the results of all other students in the district and compared with results from 2011–2012?
Texas Assessment of Knowledge and Skills (TAKS) results of Apex Learning students (students who
took at least one Apex Learning course in the content tested) and all other HISD students are listed in Table 10 (page 46). Students who took an Apex Learning course and a TAKS examination in the same subject the same year generally achieved comparable rates of meeting the TAKS standard but lower rates of being commended for their performance. The comparison of achievement for students in grade 11 in 2012–2013 is shown in Figure 8 (page 12); the results for tenth- and eleventh-graders in 2011–2012 followed the same trends.

HISD Research and Accountability__________________________________________________________________________ 12
Figure 8. Percent meeting standard and percent commended on the April 2013 TAKS,
comparing results of students who took an Apex Learning course in the subject of the test with results of all other HISD students
* Differences were statistically significant.
Chi-square analyses of the comparisons between Apex Learning student performance and the
performance of all other HISD students on the associated 2011–2012 and 2012–2013 TAKS tests are shown in Table 11 (page 47). In 2011–2012, there were no significant differences between Apex Learning students and all other HISD students in percent meeting the standard for tenth-graders in mathematics or for eleventh-graders in reading, science, or social studies. Significantly fewer tenth-grade Apex Learning students than other HISD students met the standard in reading, mathematics, and science and significantly fewer eleventh-grade Apex Learning students than other HISD students met the standard in mathematics. Significantly fewer Apex Learning students than all other HISD students achieved a commended performance in every subject for both grades. In 2012–2013, there were no significant differences between the TAKS performance of Apex Learning students and the performance of all other HISD students in meeting the standard on any of the eleventh-grade tests or for being commended on performance on the science test. Significantly fewer Apex Learning students achieved commended status on the reading, mathematics, and social studies tests than did all other HISD students. The effect sizes for the significant relationships were very small.

HISD Research and Accountability__________________________________________________________________________ 13
Figure 9 and Figure 10 (page 14), respectively, illustrate the percentage of satisfactory and advanced
ratings achieved by Apex Learning students who took a course in the subject of a 2012–2013 STAAR/EOC examination compared with the performance of all other HISD students who took the same tests. STAAR/EOC test results for the two groups are detailed in Table 12 (pages 48–49). Apex Learning students had higher percentages of achieving satisfactory ratings than all other HISD students on all of the tests except two, English II-writing and world geography. The percentage of advanced ratings was low for all groups depicted, but Apex Learning students had lower percentages than all other HISD students had on each of the examinations.
Figure 9. Percent achieving satisfactory rating on the Spring 2013 STAAR/EOC examinations, comparing results of students who took an Apex Learning course in the subject
of the test with results all other HISD students
* Differences were statistically significant.

HISD Research and Accountability__________________________________________________________________________ 14
Figure 10. Percent achieving advanced rating on the Spring 2013 STAAR/EOC examinations, comparing results of students who took an Apex Learning course in the subject
of the test with results all other HISD students
* Differences were statistically significant.
Chi square analyses of the differences in 2011–2012 and 2012–2013 STAAR/EOC performance,
shown in Table 13 (page 50), indicated that Apex Learning students achieved a rating of satisfactory in percentages that either significantly exceeded or were not significantly different from the results of all other HISD students. Apex Learning students achieved significantly higher percentages of satisfactory ratings on the 2011–2012 English I-reading and world geography tests and on the 2012–2013 geometry exam. In achieving an advanced score, Apex Learning students had significantly lower or not significantly different percentages compared with all other HISD students. Apex Learning students had significantly lower percentages of achieving an advanced rating on the 2011–2012 algebra I test and the 2012–2013 English II-reading, geometry, chemistry, world geography, and world history tests. Effect sizes of all the significant relationships were very small.
What were graduation rates for HISD twelfth graders enrolled in Apex Learning courses? In 2011–2012, 2,615 of the 2,805 twelfth graders who took an Apex Learning course (93 percent)
graduated from high school. For comparison, 91 percent of all HISD twelfth-graders graduated that year (the most recent year for which data are available). Graduation types for the Apex Learning students and for all HISD students are shown in Table 14 (page 51). HISD had a higher percentage of graduates through the recommended and distinguished plans (75 percent and six percent, respectively) than Apex Learning students did (67 percent and four percent respectively), and Apex Learning students had a higher percentage of graduates through the Minimum/Individualized

HISD Research and Accountability__________________________________________________________________________ 15
Education Plan (IEP) plan (29 percent) than HISD had (19 percent). Twenty-seven (27) percent of HISD 2011–2012 graduating seniors completed at least one Apex Learning course in their senior year.
How many TAKS and STAAR/EOC review courses were completed through licences purchased by individual HISD campuses in 2011–2012 and 2012–2013? A total of 14 review courses for state-mandated tests were completed online between 2011–2012 and
2012–2013. One TAKS review course was completed through Apex Learning in 2011–2012 and three were completed in 2012–2013. No STAAR/EOC review courses were completed through Apex Learning in the same time period. Other providers were associated with six TAKS courses and one STAAR/EOC course in 2011–2012 and three courses for STAAR/EOC in 2012–2013. More detail about the online courses completed for state-mandated tests can be found in Table 15 (page 51). Test results are not reported for fewer than five students.
How many and which Advanced Placement (AP) courses were completed through Apex Learning and through other online providers in HISD in 2011–2012 and 2012–2013? In 2011–2012, HISD students completed 392 Advanced Placement (AP) courses online; 302 of the
courses (77 percent) were through Apex Learning. In 2012–2013, the number of AP courses completed online in HISD dropped to 115 (a 71 percent drop). The number of online AP courses completed through Apex Learning dropped to 86, a 72 percent drop, and the number completed through other providers dropped to 29, a 68 percent drop. Numbers of online AP courses and providers for 2011–2012 and 2012–2013 can be found in Table 16 (page 52). Information about online AP courses completed through Apex Learning by school and by course can be found in Table 17 (pages 52–56) and detail on online AP courses completed through other providers is in Table 18 (page 57).
The number of AP courses completed online, by subject and provider, in 2011–2012 and 2012–2013 is illustrated in Figure 11 (page 16). More courses were completed in AP social studies than in other AP subjects both years, and Apex Learning provided the largest number of AP social studies courses. Apex Learning also provided the largest proportion of AP Spanish, AP science, and AP English courses each year. Though the numbers were small, other online providers were used more often than Apex Learning for AP mathematics and other AP courses (computer science and art history).

HISD Research and Accountability__________________________________________________________________________ 16
Figure 11. AP courses by subject and provider, 2011–2012 and 2012–2013
At what rates did HISD students who took an Apex Learning AP class pass the associated AP exam (with a score of three or higher) in 2011–2012 and 2012–2013, and how did those rates compare with rates of all other HISD students who took the same exam the same year? In 2011–2012, 153 students earned credit in 157 Apex Learning AP courses that are associated with
an AP examination; 39 students earned credit in 42 of the courses in 2012–2013, a reduction of 73 percent in the number of Apex Learning courses associated with an AP test. See Table 17 (pages 52–56) for more detail on the AP courses that students took through Apex Learning.
Students who completed 80 of the eligible 157 Apex Learning AP courses in 2011–2012 (51 percent) and those who completed 18 of the eligible 42 Apex Learning AP courses in 2012–2013 (42 percent) took the associated AP examination in the same year the course was completed. Of the students who took the associated examination, 10 percent passed (received a score of 3 or higher) in 2011–2012 and, though numbers were low, 22 percent passed in 2012–2013 (Table 19, page 58). For comparison, 31 percent of HISD students earned passing scores on their AP tests in 2011–2012 and 33 percent earned passing scores in 2012–2013.
With the exception of performance on the AP Spanish language examination, Apex Learning students had uniformly low rates of passing the AP tests they took. A statistical analysis of performance on the 2011–2012 AP psychology examination, the only test with enough scores for the analysis, indicated that Apex Learning students scored significantly lower than did all other students in HISD who took

HISD Research and Accountability__________________________________________________________________________ 17
the test the same year. The effect size on the relationship was very large. Complete results of the comparison are shown in Table 20 (page 59).
Discussion Apex Learning is the largest provider of online courses in HISD, and the percentage of online courses that HISD students are completing through Apex Learning is increasing. Twenty-seven (27) percent of HISD 2011–2012 graduating seniors completed at least one Apex Learning course in their senior year and 93 percent of twelfth-graders who took an Apex Learning course graduated (compared with a 91 percent graduation rate for all of HISD), testament to how broadly the resource is used and contributes to HISD students graduating. Passing rates on state-mandated tests are also well supported through the program. Too few TAKS review courses were completed through Apex Learning to impact an overall pass rate, however, sufficient numbers of students took Apex Learning content-based courses that were tested through the state examinations. In 2012–2013, eleventh-grade Apex Learning students (those who took an Apex Learning course in a subject tested the same year) generally performed about the same as all HISD students in meeting the standard on all TAKS exams for eleventh grade. On STAAR/EOC, 2012–2013 Apex Learning students achieved satisfactory scores on all but one test of ninth- and tenth-grade content at generally the same rates that all other HISD students did, and on the one exception, geometry, they had significantly higher rates of achieving a satisfactory rating. On the other hand, Apex Learning students have had less success in demonstrating high achievement in content mastery. For TAKS, eleventh-grade students in 2012–2013 achieved a commended rating at about the same rate as other students in HISD on the science test, but they had significantly lower rates of being commended in reading, mathematics or social studies. For the 2012–2013 STAAR/EOC tests, Apex Learning students earned a lower percentage of advanced ratings on every test and the differences were significant for English II-reading, geometry, chemistry, world geography, and world history. On AP examinations, with the exception of the Spanish language test, Apex Learning students had lower rates of achieving a passing score (a score of 3 or higher) than did other HISD students who took the same test. For the 2011–2012 psychology exam, the AP exam with the largest number of Apex Learning student scores, Apex Learning students scored significantly lower than the other HISD students who took the same exam did, and this relationship yielded the only high effect size of all the relationships included in this report. Online course usage dropped between 2011–2012 and 2012–2013, by nine percent for Apex Learning courses and by 58 percent for all other providers. The drop was smaller for Apex Learning, perhaps due to its availability and success in supporting students meeting graduation requirements. Online usage dropped precipitously for online AP courses, by 72 percent for Apex Learning and by 68 percent for all other online providers, perhaps as a result of the low rates of student scores that could be awarded college credit. These results suggest that the Apex Learning program could explore ways to better support students who have the motivation to achieve at high levels as the program continues providing all HISD students access to effective alternate ways to meet graduation requirements.

HISD Research and Accountability__________________________________________________________________________ 18
References Apex Learning. (May 2013a). Academic outcomes increase for at-risk and drop-out recovery students.
Seattle, WA: Apex Learning Inc. Retrieved from http://marketing.apexlearning.com/acton/attachment/1261/1261:f-020c/0/s-0afd-1305/-/l-9cc6/l-9cc6:15f/?utm_medium=email&utm_source=Act-On+Software&utm_content=email&utm_campaign=Study%20results%3A%20Apex%20Learning%20proven%20to%20increase%20learning%20gains&utm_term=Ohio%20Life%20Skills%20Centers&cm_mmc=Act-On%20Software-_-email-_-Study%20results%3A%20Apex%20Learning%20proven%20to%20increase%20learning%20gains-_-Ohio%20Life%20Skills%20Centers
Apex Learning. (May 2013b). Academic outcomes increase for at-risk and drop-out recovery students. Seattle, WA: Apex Learning Inc. Retrieved from http://marketing.apexlearning.com/acton/attachment/1261/1261:f-020b/0/s-0afd-1305/-/l-9cc6/l-9cc6:15f/?utm_medium=email&utm_source=Act-On+Software&utm_content=email&utm_campaign=Study%20results%3A%20Apex%20Learning%20proven%20to%20increase%20learning%20gains&utm_term=Dorchester%20School%20District%20Two&cm_mmc=Act-On%20Software-_-email-_-Study%20results%3A%20Apex%20Learning%20proven%20to%20increase%20learning%20gains-_-Dorchester%20School%20District%20Two
Department of Research and Accountability. (May 2011). Apex credit recovery initiative report, 2009–2010. Houston, TX: Houston Independent School District.
Department of Research and Accountability. (January 2012). Advanced Placement (AP) report: 2010–2011. Houston, TX: Houston Independent School District.
Department of Research and Accountability. (June 2012). Grad Labs – Apex credit recovery initiative, 2009–2010 and 2010–2011. Houston, TX: Houston Independent School District.
Department of Research and Accountability. (July 2012). District and school State of Texas Assessments of Academic Readiness (STAAR) end of course performance report: Spring 2012. Houston, TX: Houston Independent School District.
Department of Research and Accountability. (November 2012). Advanced Placement (AP) report: 2011–2012. Houston, TX: Houston Independent School District.
Houston Independent School District (November 2011). High School Master Catalog: 2011–2012. Houston, TX: Houston Independent School District.

HISD Research and Accountability__________________________________________________________________________ 19
Table 1. Number and Percentage of HISD Online Course Completions, 2010–2011 to 2012–2013
2010–2011 2011–2012 2012–2013
Number Percent Number Percent Number Percent
Apex Learning Courses 8,716 66.9 14,073 66.2 12,872 80.8
Credit Recovery 4,619 53.0 6,106 43.4 6,118 47.5
Original Credit 1,912 21.9 6,648 47.2 6,678 51.9
Dual Credit 1 0.0 2 0.0 0 0.0
Advanced Placement (AP) 99 1.1 302 2.1 86 1.0
STAAR Review NA NA 0 0.0 0 0.0
TAKS Review 2 0.0 1 0.0 3 0.0
Courses for which Credit Was Awarded 8,458 97.0 13,217 93.9 12,099 94.0
Other Online Provider Courses 4,308 33.1 7,174 33.8 3,067 19.2
Credit Recovery 857 19.9 722 10.1 362 11.8
Original Credit 17 0.4 86 1.2 61 2.0
Dual Credit 50 1.2 212 3.0 97 3.2
Advanced Placement (AP) 51 1.2 90 1.3 29 1.0
STAAR Review NA NA 1 0.0 3 0.1
TAKS Review 1 0.0 6 0.1 3 0.1
Courses for which Credit Was Awarded 4,029 93.5 6,773 94.4 2,835 92.4
TOTAL HISD Online Course Completions 13,024 100.0 21,247 100.0 15,939 100.0
Source: Chancery online courses files, 2010–2011 through 2012–2013

HISD Research and Accountability__________________________________________________________________________ 20
Table 2. HISD Online Course Providers and Number and Percentage of Completed Courses, 2010–2011 to 2012–2013
2010–2011 2011–2012 2012–2013
Number Percent Number Percent Number Percent
Apex Learning Courses (including APEXIS) 8,716 66.9 14,073 66.2 12,872 80.8
API (American Preparatory Institute) 38 0.3 21 0.1 6 0.0
Aventa 2 0.0 4 0.0
HCC (Houston Community College) 1,082 8.3 2,093 9.9 867 5.4
HVS 163 1.3 110 0.5 69 0.4
Nova Net 437 3.4 378 1.8 210 1.3
Other Provider 574 4.4 2,285 10.8 516 3.2
Penn Foster 5 0.0
Plato 122 0.9 40 0.2 62 0.4
SSCSP 13 0.1 6 0.0 1 0.0
Texas TechD (Texas Tech Distance
Learning Program) 189 1.5 351 1.7 175 1.1
TxVSN StU (Texas Virtual School Network) 382 2.9 105 0.5 119 0.7
UT DL (University of Texas) 1,308 10.0 1,778 8.4 1,038 6.5
TOTAL HISD Online Course Completions 13,024 100.0 21,247 100.0 15,939 100.0
Table 3. HISD Online Courses Completed, by Provider and Grade Level, 2011–2012 and 2012–2013
Apex Learning Other Providers All Providers
Grade 2011–2012
2012–2013
Differ-ence
2011–2012
2012–2013
Differ-ence
2011–2012
2012–2013
Differ-ence
6 0 0 0 0 0 0 0 0 0
7 0 19 19 2 0 -2 2 19 17
8 142 107 -35 408 3 -405 550 110 -440
9 1,760 1,278 -482 2,035 671 -1,364 3,795 1,949 -1,846
10 2,685 2,147 -538 1,396 647 -749 4,081 2,794 -1,287
11 3,847 3,583 -264 1,987 925 -1,062 5,834 4,508 -1,326
12 5,639 5,738 99 1,346 821 -525 6,985 6,559 -426
TOTAL 14,073 12,872 -1,201 7,179 3,067 -4,112 21,247 15,939 -5,308

HISD Research and Accountability__________________________________________________________________________ 21
Table 4. HISD Students Completing Online Courses, by Provider and Grade Level, 2011–2012 and 2012–2013
Apex Learning Other Providers All Providers
Grade 2011–2012
2012–2013
Differ-ence
2011–2012
2012–2013
Differ-ence
2011–2012
2012–2013
Differ-ence
6 0 0 0 0 0 0 0 0 0
7 0 15 15 1 0 -1 1 15 14
8 81 59 -22 125 3 -122 206 62 -144
9 847 718 -129 640 328 -312 1,442 1,021 -421
10 1,296 1,208 -88 518 324 -194 1,747 1,469 -278
11 1,763 1,809 46 852 512 -340 2,462 2,206 -256
12 2,805 2,921 116 761 593 -168 3,304 3,282 -22
TOTAL 6,792 6,730 -62 2,897 1,760 -1,137 9,162 8,055 -1,107
Note: Some students completed online courses through both Apex Learning and Other Providers.
Table 5. Average Number of Online Courses Per HISD Student Who Took at Least One Online Course, by Provider and Grade Level, 2011–2012 and 2012–2013
Apex Learning Other Providers All Providers
Grade 2011–2012
2012–2013
Differ-ence
2011–2012
2012–2013
Differ-ence
2011–2012
2012–2013
Differ-ence
6 NA NA NA NA NA NA NA NA NA
7 NA 1.3 NA 2.0 NA NA 2.0 1.3 -0.7
8 1.8 1.8 0.0 3.3 1.0 -2.3 2.7 1.8 -0.9
9 2.1 1.8 -0.3 3.2 2.2 -1.0 2.7 1.9 -0.8
10 2.0 1.8 -0.2 2.7 2.4 -0.3 2.3 1.9 -0.4
11 2.2 2.0 -0.2 2.3 2.3 0.0 2.3 2.0 -0.3
12 2.0 2.0 0.0 1.8 2.1 0.3 2.1 2.0 -0.1
TOTAL 2.1 1.9 -0.2 2.5 2.2 -0.3 2.3 2.0 -0.3
Note: Some students completed online courses through both Apex Learning and Other Providers.

HISD Research and Accountability__________________________________________________________________________ 22
Table 6. Number of HISD Online Courses by Provider and School, 2012–2013
Ap
ex L
rng
.
AP
EX
IS
AP
I
Ave
nta
HC
C
HV
S
No
va N
et
Oth
er P
rov.
Pla
to
SS
CS
P
Tex
asT
ech
D
TxV
SN
StU
UT
DL
TO
TA
L
HIGH SCHOOLS
Advanced Virtual Academy 936 43 4 983
Austin High School 327 54 8 65 454
Bellaire High School 649 6 24 13 203 52 2 15 964
Carnegie Vanguard HS 21 1 22
Challenge High School 421 4 78 2 4 509
Chavez High School 348 2 10 360
Davis High School 414 2 2 62 480
DeBakey HSHP 78 3 58 2 2 10 153
East Early College High School
99 153 252
Eastwood Academy for Academic Achievement
74 65 5 73 217
Empowerment College Prep High School
18 1 16 5 9 49
Energized for STEM HS SE 42 42
Energized for STEM HS SW 59 59
Furr High School 359 359
Hope Academy 22 1 23
Houston Academy for International Studies
152 2 1 98 1 3 257
Houston Math, Science & Tech. Center
884 214 26 59 13 687 1,883
HSLECJ 306 16 1 1 14 338
HSPVA 22 9 16 15 62
Jones High School 192 192
Jordan High School for Careers
28 1 7 2 3 41

HISD Research and Accountability__________________________________________________________________________ 23
Table 6 (continued). Number of HISD Online Courses by Provider and School, 2012–2013
Ap
ex L
rng
.
AP
EX
IS
AP
I
Ave
nta
HC
C
HV
S
No
va N
et
Oth
er P
rov.
Pla
to
SS
CS
P
Tex
asT
ech
D
TxV
SN
StU
UT
DL
TO
TA
L
HIGH SCHOOLS (continued)
Kashmere High School 45 45
Lamar High School 853 32 78 1 964
Lee High School 572 5 1 5 85 71 739
Liberty High School 68 1 6 2 4 81
Madison High School 273 2 2 10 13 87 387
Milby High School 603 6 1 4 1 44 3 1 663
Mount Carmel Academy 15 5 69 1 90
North Forest High School 3 3
North Houston Early College High School
219 33 252
REACH Charter High School 31 31
Reagan High School 398 10 1 1 29 8 447
Scarborough High School 629 29 56 12 726
Sharpstown High School 597 58 2 9 666
Sterling High School 266 4 1 25 296
Waltrip High School 159 12 6 2 1 7 4 191
Washington High School 174 20 3 1 12 210
Westbury High School 191 11 28 1 6 237
Westside High School 524 19 107 10 2 12 23 3 700
Wheatley High School 135 11 2 112 260
Worthing High School 412 412
Yates High School 332 1 4 11 348
HISD Research and Accountability__________________________________________________________________________ 24
Table 6 (continued). Number of HISD Online Courses by Provider and School, 2012–2013
Ap
ex L
rng
.
AP
EX
IS
AP
I
Ave
nta
HC
C
HV
S
No
va N
et
Oth
er P
rov.
Pla
to
SS
CS
P
Tex
asT
ech
D
TxV
SN
StU
UT
DL
TO
TA
L
MIDDLE SCHOOLS
Holland Middle School 7 7
Pershing Middle School 1 1
Pin Oak Middle School 1 1
Project Chrysalis Middle School 88 88
COMBINED LEVEL SCHOOLS
Beechnut 19 19
JJAEP 1 2 31 34
Long Academy 96 96
Rogers, T. H. 1 1
Sharpstown International School
141 141
SOAR Center 7 7
Texas Connections Academy
7 5 12
Young Women’s College Prep. 83 2 85
DISTRICT TOTAL
12,355 517 6 4 867 69 210 516 62 1 175 119 1,038 15,939

HISD Research and Accountability__________________________________________________________________________ 25
Table 7. HISD Apex Learning Online Courses by School, 2011–2012 and 2012–2013
2011–2012 2012–2013 Difference
in Number
of Apex
Learning
Courses,
2011–2012
to 2012–
2013
Number
of Apex
Learning
Courses
Number
of All
Online
Courses
Percentage
of Apex
Learning
Courses
Number
of Apex
Learning
Courses
Number
of All
Online
Courses
Percentage
of Apex
Learning
Courses
HIGH SCHOOLS
Advanced Virtual Academy 590 592 99.7 936 983 95.2 346
Austin High School 287 362 79.3 327 454 72.0 40
Bellaire High School 452 2,165 20.9 649 964 67.3 197
Carnegie Vanguard HS 17 19 89.5 21 22 95.5 4
Challenge High School 648 955 67.9 421 509 82.7 -227
Chavez High School 653 1,457 44.8 348 360 96.7 -305
Davis High School 449 506 88.7 414 480 86.3 -35
DeBakey HSHP (026) 74 274 27.0 78 153 51.0 4
DeVry/Contemporary Learning Center High School (not an HISD 2012–2013 school)
27 27 100.0 NA
East Early College High School 32 98 32.7 99 252 39.3 67
Eastwood Academy for Academic Achievement
126 192 65.6 74 217 34.1 -52
Empowerment College Prep High School 7 30 23.3 18 49 36.7 11
Energized for STEM HS SE 133 133 100.0 42 42 100.0 -91
Energized for STEM HS SW NA 59 59 100.0 59
Furr High School 617 619 99.7 359 359 100.0 -258
Hope Academy 25 25 100.0 22 23 95.7 -3
Houston Academy for International Studies 128 131 97.7 152 257 59.1 24
Houston Math, Science & Tech. Center 698 1,324 52.7 884 1883 46.9 186
HSLECJ 256 261 98.1 306 338 90.5 50
HSPVA 142 188 75.5 22 62 35.5 -120
Jones High School 188 188 100.0 192 192 100.0 4
Jordan High School for Careers 20 37 54.1 28 41 68.3 8

HISD Research and Accountability__________________________________________________________________________ 26
Table 7 (continued). HISD Apex Learning Online Courses by School, 2011–2012 and 2012–2013
2011–2012 2012–2013 Difference
in Number
of Apex
Learning
Courses,
2011–2012
to 2012–
2013
Number
of Apex
Learning
Courses
Number
of All
Online
Courses
Percentage
of Apex
Learning
Courses
Number
of Apex
Learning
Courses
Number
of All
Online
Courses
Percentage
of Apex
Learning
Courses
HIGH SCHOOLS (continued)
Kashmere High School 43 44 97.7 45 45 100.0 2
Lamar High School 826 1,119 73.8 853 964 88.5 27
Lee High School 466 1,365 34.1 572 739 77.4 106
Liberty High School 94 162 58.0 68 81 84.0 -26
Madison High School 333 415 80.2 273 387 70.5 -60
Milby High School 565 587 96.3 603 663 91.0 38
Mount Carmel Academy 0 162 0.0 0 90 0.0 0
New Aspirations (not an HISD 2012–2013 school)
1,166 1,166 100.0 NA
North Forest High School (not an HISD school until July 1, 2013)
0 3 0.0 NA
North Houston Early College High School 58 779 7.4 219 252 86.9 161
REACH Charter High School 150 150 100.0 31 31 100.0 -119
Reagan High School 369 500 73.8 398 447 89.0 29
Scarborough High School 408 424 96.2 629 726 86.6 221
Sharpstown High School 986 1,087 90.7 597 666 89.6 -389
Sterling High School 163 167 97.6 266 296 89.9 103
Waltrip High School 398 609 65.4 159 191 83.2 -239
Washington High School 365 418 87.3 174 210 82.9 -191
Westbury High School 489 518 94.4 191 237 80.6 -298
Westside High School 582 698 83.4 524 700 74.9 -58
Wheatley High School 192 344 55.8 135 260 51.9 -57
Worthing High School 420 421 99.8 412 412 100.0 -8
Yates High School 261 276 94.6 332 348 95.4 71

HISD Research and Accountability__________________________________________________________________________ 27
Table 7 (continued). HISD Apex Learning Online Courses by School, 2011–2012 and 2012–2013
2011–2012 2012–2013 Difference in
Number of
Apex
Learning
Courses,
2011–2012 to
2012–2013
Number
of Apex
Learning
Courses
Number
of All
Online
Courses
Percentage
of Apex
Learning
Courses
Number
of Apex
Learning
Courses
Number
of All
Online
Courses
Percentage
of Apex
Learning
Courses
MIDDLE SCHOOLS
Clifton Middle School 0 4 0.0 0
Hamilton Middle School 0 1 0.0 0
Holland Middle School 7 7 100.0 7
Johnston Middle School 0 8 0.0 0
Lanier Middle School 0 31 0.0 0
Ortíz Middle School 17 17 100.0 -17
Pershing Middle School 0 6 0.0 0 1 0.0 0
Pin Oak Middle School 0 12 0.0 0 1 0.0 0
Project Chrysalis Middle School 116 116 100.0 88 88 100.0 -28
Stevenson Middle School 2 2 100.0 -2
COMBINED LEVEL SCHOOLS
Beechnut 2 3 66.7 0 19 0.0 -2
JJAEP 1 34 2.9 1
Long Academy 96 96 100.0 96
Rogers, T. H. 0 16 0.0 0 1 0.0 0
Sharpstown International School 15 17 88.2 141 141 100.0 126
SOAR Center 7 7 100.0 7
Texas Connections Academy 0 12 0.0 0
Young Women’s College Prep. 18 18 100.0 83 85 97.6 65
DISTRICT TOTAL 14,068 21,247 66.2 12,355 15,939 77.5 -1,713

HISD Research and Accountability__________________________________________________________________________ 28
Table 8. HISD Apex Learning Courses Completed, 2011–2012 and 2012–2013
Subject Course 2011–2012 2012–2013
Number Percent Number Percent
English
AP English Language & Composition 18 0.1 5 0.0
AP English Literature & Composition 7 0.0 9 0.1
Creative Writing 1 0.0
English I 525 3.7 392 3.0
English II 708 5.0 580 4.5
English III 617 4.4 618 4.8
English IV 738 5.2 661 5.1
Fundamental English 1 0.0
Practical Writing Skills 16 0.1 7 0.1
Reading Application & Study Skills 15 0.1 8 0.1
Reading I 3 0.0
Mathematics
Advanced Quantitative Reasoning 2 0.0
Algebra I For Virtual School Use Only 386 2.7 270 2.1
Algebra II 430 3.1 347 2.7
Algebra II, STAAR Modified 1 0.0
AP Calculus AB 4 0.0
AP Statistics 1 0.0 4 0.0
Early Colleges/Math1316 190 1.4 130 1.0
Earth and Space Mod 2 0.0
Economics FES Mod 1 0.0
Geometry 546 3.9 330 2.6
Health Education Alt 1 0.0
Life NRT Alt 1 0.0
Local Credit: Math 0312 1 0.0
Mathematical Models with Applications 28 0.2 18 0.1

HISD Research and Accountability__________________________________________________________________________ 29
Table 8 (continued). HISD Apex Learning Courses Completed, 2011–2012 and 2012–2013
Subject Course 2011–2012 2012–2013
Number Percent Number Percent
Science
AP Biology 50 0.4
AP Chemistry 2 0.0 16 0.1
AP Physics B 17 0.1 9 0.1
Biology 499 3.5 404 3.1
Chemistry 249 1.8 377 2.9
Earth And Space Science 4 0.0 3 0.0
Environmental Systems 1 0.0 3 0.0
IPC 188 1.3 144 1.1
Physics 39 0.3 233 1.8
Scientific Research and Design 163 1.2 132 1.0
Science Research & Design I 2 0.0
Social Studies
AP Comparative Government & Politics 14 0.1 4 0.0
AP Macro Economics 3 0.0 1 0.0
AP Psychology 72 0.5 4 0.0
AP United States History 11 0.1 11 0.1
Economics - Econ2301 Macro 698 5.0 675 5.2
Government 967 6.9 752 5.8
Micro Economics 2 0.0
Psychology 187 1.3 94 0.7
Sociology 1 0.0 41 0.3
U.S. History 549 3.9 535 4.2
World History 649 4.6 560 4.4
World Geography 560 4.0 513 4.0

HISD Research and Accountability__________________________________________________________________________ 30
Table 8 (continued). HISD Apex Learning Courses Completed, 2011–2012 and 2012–2013
Subject Course 2011–2012 2012–2013
Number Percent Number Percent
Other
Adventure/Outdoor Education 2 0.0
AP Spanish 103 0.7 21 0.2
Applied Music I 2 0.0
Arabic 1 0.0
Arabic I 1 0.0
Art I 4 0.0 9 0.1
Business Information Management II 1 0.0
Communication Applications 33 0.2 74 0.6
Foundations Of Personal Fitness 19 0.1 5 0.0
French I 68 0.5 59 0.5
French II 146 1.0 142 1.1
Health Education 849 6.0 850 6.6
Independent Study In Journalism I 1 0.0
Individual Sports 1 0.0 4 0.0
Music I History 74 0.5
Music Theory I 13 0.1
PE Substitution, Athletics 3 1 0.0
PE Substitution Non-District Program I 1 0.0
Physical Education IA 1 0.0
Principles Of Human Services 2 0.0
Principles Of Information Technology 6 0.0 7 0.1
Spanish I 1,698 12.1 1,739 13.5
Spanish II 1,897 13.5 1,698 13.2
Spanish III 6 0.0 343 2.7
TAKS Review 1 0.0 3 0.0
TOTAL 73 Courses 14,073 100.0 12,872 100.0
Note: Percentages may not total 100 percent due to rounding.
HISD Research and Accountability__________________________________________________________________________ 31
Table 9. Number and Percentage of HISD Online Courses Completed, By Provider and Course,
2011–2012 and 2012–2013
Provider and Subjects
Course 2011–2012 2012–2013
Number Percent Number Percent
Apex Learning
All Subjects All Courses (see Table 8, pages ) TOTAL 73 Courses 14,073 66.2 12,872 80.8
API
English
AP English Literature & Composition 1 0.0
Other
Business Information Management I 2 0.0
Communication Applications 13 0.1
Spanish I 2 0.0
Spanish III 3 0.0 4 0.0
Spanish III for Spanish Speakers 2 0.0 TOTAL 6 Courses 21 0.1 6 0.0
Aventa
Science
Astronomy 1 0.0
Social Studies
Economics 2 0.0
Special Topics – Social Studies 1 0.0
Other
Introduction to Cosmetology 1 0.0
Spanish II 1 0.0 TOTAL 5 Courses 2 0.0 4 0.0
HCC
English
English I 5 0.0 8 0.1
English II 8 0.0 5 0.0
English III 39 0.2 25 0.2
English IV 419 2.0 95 0.6
Humanities 23 0.1
Journalism 10 0.0 4 0.0
Literary Genres 13 0.1 4 0.0

HISD Research and Accountability__________________________________________________________________________ 32
Table 9 (continued). Number and Percentage of HISD Online Courses Completed, By Provider and Course, 2011–2012 and 2012–2013
Provider and Subjects
Course 2011–2012 2012–2013
Number Percent Number Percent
HCC
(continued)
Mathematics
Algebra I 13 0.1 7 0.0
Algebra II 48 0.2 44 0.3
Geometry 24 0.1 8 0.1
Independent Study 2 0.0
Local Credit Only – Math 0312 39 0.2
Local Credit Only – Math 1314 15 0.1
Mathematical Models 24 0.1 8 0.1
Pre-Calculus 37 0.2 11 0.1
Science
Anatomy and Physiology 3 0.0
Astronomy 93 0.4 9 0.1
Biology 11 0.1 4 0.0
Chemistry 17 0.1 13 0.1
Environmental Systems 29 0.1 31 0.2
IPC 8 0.0 5 0.0
Physics 21 0.1 8 0.1
Science Research and Design I 59 0.3 11 0.1
Scientific Research & Design II 9 0.0 6 0.0
Scientific Research & Design III 3 0.0
Social Studies
Economics – Macroeconomics 199 0.9 110 0.7
Psychology 46 0.2 23 0.1
Sociology 55 0.3 16 0.1
Special Topic 72 0.3 40 0.3
US Government 274 1.3 125 0.8
US History 140 0.7 45 0.3
World Geography 15 0.1 5 0.0
World History 13 0.1 13 0.1
Other
Accounting 1 0.0
Art I 37 0.2 11 0.1
Audio Video Production 1 0.0
Business Computer Info Systems 2 0.0 1 0.0
Business Info Management I 7 0.0 3 0.0
Business Info Management II 75 0.4
HISD Research and Accountability__________________________________________________________________________ 33
Table 9 (continued). Number and Percentage of HISD Online Courses Completed, By Provider and Course, 2011–2012 and 2012–2013
Provider and Subjects
Course 2011–2012 2012–2013
Number Percent Number Percent
HCC
(continued)
Other
(continued)
Communication Applications 74 0.3 22 0.1
Computer Programming 2 0.0
Computer Science 2 0.0
Cosmetology II 1 0.0
Foundations of Personal Fitness 1 0.0
French I 1 0.0
Health Education 30 0.1 13 0.1
Law Enforcement 1 0.0
Local Credit Only – College Connect 53 0.2
Local Credit Only – Mathematics 13 0.1
Medical Terminology 11 0.1 1 0.0
Music – Instrumental Ensemble 3 0.0 1 0.0
Music Theory 7 0.0
Prin of Arts, Audio Visual Tech, & Comm 1 0.0
Prin. of Business 12 0.1
Prin of Info Tech 1 0.0
Spanish I 5 0.0 31 0.2
Spanish II 5 0.0 32 0.2
Spanish III 2 0.0 11 0.1
Telecommunications & Networking 4 0.0
Theatre 11 0.1 2 0.0 TOTAL 60 Courses 2,093 9.9 867 5.4
HVS
English
AP English Literature 1 0.0
English I 1 0.0 2 0.0
English II 2 0.0
English III 1 0.0
English IV 1 0.0
Mathematics
Algebra I 1 0.0 1 0.0
Algebra II 3 0.0
AP Statistics 5 0.0
Geometry 4 0.0 2 0.0
Mathematical Models with Appls 1 0.0 1 0.0
Pre-Calculus 1 0.0 5 0.0

HISD Research and Accountability__________________________________________________________________________ 34
Table 9 (continued). Number and Percentage of HISD Online Courses Completed, By Provider and Course, 2011–2012 and 2012–2013
Provider and Subjects
Course 2011–2012 2012–2013
Number Percent Number Percent
HVS (continued)
Science
Biology 1 0.0 1 0.0
Chemistry 1 0.0 1 0.0
Environmental Systems 4 0.0
IPC 1 0.0
Physics 1 0.0 1 0.0
Social Studies
AP Macroeconomics 3 0.0
AP Psychology 2 0.0 3 0.0
AP US Government 14 0.1
AP US History 4 0.0
Economics – Macroeconomics 1 0.0
Government 1 0.0
US Government 3 0.0
World Geography 3 0.0 1 0.0
World History 1 0.0
Other
Art I 3 0.0
Communication Applications 22 0.1 16 0.1
Health Education 40 0.2 2 0.0
Music I History 2 0.0
PE Team Sports 1 0.0
Principles of Info Tech 2 0.0 4 0.0
Psychology 1 0.0
Reading Appls and Study Skills 2 0.0
Sociology 1 0.0
Spanish I 3 0.0
Touch Systems Data 1 0.0 TOTAL 36 Courses 110 0.5 69 0.4
Nova Net
English
English I 11 0.1 3 0.0
English II 16 0.1 7 0.0
English III 32 0.2 14 0.1
English IV 71 0.3 19 0.1
Mathematics
Algebra I 7 0.0 14 0.1
Algebra II 11 0.1 7 0.0
Geometry 13 0.1 13 0.1
Mathematical Models with Applications 7 0.0 4 0.0
Pre-Calculus 1 0.0 1 0.0

HISD Research and Accountability__________________________________________________________________________ 35
Table 9 (continued). Number and Percentage of HISD Online Courses Completed, By Provider and Course, 2011–2012 and 2012–2013
Provider and Subjects
Course 2011–2012 2012–2013
Number Percent Number Percent
Nova Net
(continued)
Science
Biology 38 0.2 10 0.1
Chemistry 14 0.1 10 0.1
Earth and Space Science 7 0.0
Environmental Systems 8 0.0 4 0.0
IPC 9 0.0 4 0.0
Physics 3 0.0
Social Studies
Economics 11 0.1 4 0.0
US Government 8 0.0 3 0.0
US History 7 0.0 4 0.0
World Geography 18 0.1 5 0.0
World History 7 0.0 10 0.1
Other
Anatomy and Physiology 1 0.0
Art I 2 0.0 2 0.0
Business Information Management 1 0.0
Communication Applications 68 0.3 71 0.4
French 2 0.0
Health Education 3 0.0 1 0.0
Medical Terminology 1 0.0
PE Substitution 1 0.0 TOTAL 28 Courses 378 1.8 210 1.3
Other Provider
English
AP English Language and Composition 6 0.0
AP English Literature and Composition 1 0.0
Creative Writing 1 0.0
English I 68 0.3 20 0.1
English I for Speakers of Other
Languages 7 0.0 2 0.0
English II 42 0.2 8 0.1
English II for Speakers of Other
Languages 12 0.1
English III 32 0.2 10 0.1

HISD Research and Accountability__________________________________________________________________________ 36
Table 9 (continued). Number and Percentage of HISD Online Courses Completed, By Provider and Course, 2011–2012 and 2012–2013
Provider and Subjects
Course 2011–2012 2012–2013
Number Percent Number Percent
Other Provider
(continued)
English
(continued)
English IV 9 0.0 7 0.0
Journalism 2 0.0 1 0.0
Journalism II: Newspaper 2 0.0
Literary Genres 2 0.0
Media Literacy: Speech 2 0.0
Public Speaking I 1 0.0
Reading I 17 0.1
Reading II 1 0.0 1 0.0
Reading III 2 0.0 1 0.0
Reading Applications and Study Skills 1 0.0
Technical Writing 1 0.0
Mathematics
Algebra I 187 0.9 21 0.1
Algebra II 83 0.4 27 0.2
AP Calculus AB 3 0.0
AP Statistics 4 0.0 1 0.0
Fundamentals of Math 1 0.0
Geometry 106 0.5 11 0.1
Independent Study Math 2 0.0 1 0.0
Mathematical Models with Applications 21 0.1 7 0.0
Pre-Calculus 29 0.1 2 0.0
Science
AP Biology 1 0.0 1 0.0
AP Chemistry 1 0.0 1 0.0
AP Physics B 1 0.0
Biology 108 0.5 21 0.1
Chemistry 61 0.3 10 0.1
Earth and Space Science 8 0.0 4 0.0
Environmental Systems 33 0.2 9 0.1
IPC 101 0.5 6 0.0
Physics 49 0.2 6 0.0
Scientific Research and Design 5 0.0
Social Studies
AP Human Geography 1 0.0
AP Macroeconomics 4 0.0
AP Psychology 1 0.0 3 0.0
AP US Government 7 0.0 1 0.0

HISD Research and Accountability__________________________________________________________________________ 37
Table 9 (continued). Number and Percentage of HISD Online Courses Completed, By Provider and Course, 2011–2012 and 2012–2013
Provider and Subjects
Course 2011–2012 2012–2013
Number Percent Number Percent
Other Provider
(continued)
Social Studies
(continued)
AP US History 6 0.0 1 0.0
AP World History 10 0.0
Economics 18 0.1 2 0.0
Psychology 4 0.0 2 0.0
Sociology 7 0.0
Special Topic Social Studies 55 0.3 31 0.2
US Government 19 0.1 5 0.0
US History 41 0.2 8 0.1
World Geography 37 0.2 17 0.1
World History 61 0.3 4 0.0
Other
Accounting I 1 0.0 1 0.0
Adventure/Outdoor Education 6 0.0
Aerobic Activities 7 0.0
Agric Mechanics & Metal Technologies 2 0.0
American Sign Language 1 0.0
AP Computer Science 1 0.0 5 0.0
AP History of Art 2 0.0 1 0.0
AP Spanish Language 1 0.0 1 0.0
Apparel 1 0.0
Applied Music I 5 0.0 2 0.0
Approved Sponsor: AVID IA 3 0.0 1 0.0
Approved Sponsor: Peer Asst IA 1 0.0
Arabic I 69 0.3 1 0.0
Arabic II 64 0.3 1 0.0
Arabic III 61 0.3
Arabic IV 1 0.0
Art I 43 0.2 9 0.1
Art II Drawing 2 0.0 2 0.0
Art II Photography 4 0.0
Art III Art History 2 0.0
Art IV Painting 1 0.0
Banking and Financial Services 1 0.0
Business Computer Information Systems 1 0.0
Business Information Management 12 0.1 5 0.0
Business Management 2 0.0
Career Connections 2 0.0 1 0.0
HISD Research and Accountability__________________________________________________________________________ 38
Table 9 (continued). Number and Percentage of HISD Online Courses Completed, By Provider and Course, 2011–2012 and 2012–2013
Provider and Subjects
Course 2011–2012 2012–2013
Number Percent Number Percent
Other Provider
(continued)
Other
(continued)
Career Studies 1 0.0
Child Development 1 0.0
Child Development 4 0.0
Chinese I 14 0.1
Chinese II 8 0.0
Chinese III 6 0.0
Chinese IV 1 0.0
Choral Music 1 0.0
College Skills 3 0.0
Communication Applications 42 0.2 34 0.2
Computer Applications 11 0.1 1 0.0
Computer Programming 1 0.0
Computer Science Fundamentals 1 0.0
Computer Science I 12 0.1 1 0.0
Computer Science II 2 0.0
Computer Science III 2 0.0
Consumer and Family Economics 3 0.0
Cosmetology Introduction 1 0.0
Culinary Arts 2 0.0
Dance 3 0.0
Desktop Publishing 3 0.0
Digital Media 2 0.0
Driver Education 1 0.0 2 0.0
English Foundations Interm A (INN) 4 0.0 1 0.0
English Language Development I (INN) 19 0.1 2 0.0
English Language Development II (INN) 2 0.0
English Newcomer (INN) 3 0.0 2 0.0
Forensic Science 1 0.0
Foundations of Personal Fitness 57 0.3 13 .01
French I 9 0.0
French II 4 0.0
French III 1 0.0
French IV 1 0.0
Fundamental English I 1 0.0
German II 1 0.0
Health Education 58 0.3 4 0.0

HISD Research and Accountability__________________________________________________________________________ 39
Table 9 (continued). Number and Percentage of HISD Online Courses Completed, By Provider and Course, 2011–2012 and 2012–2013
Provider and Subjects
Course 2011–2012 2012–2013
Number Percent Number Percent
Other Provider
(continued)
Other
(continued)
Health Education, Advanced 1 0.0
Hebrew I 8 0.0
Hindi I 2 0.0
Human Body Systems 1 0.0
Human Growth and Development 1 0.0
Individual and Family Life 2 0.0
Individual Sports (first time) 1 0.0
Individual Sports (second time) 2 0.0
Italian III 2 0.0
Japanese I 2 0.0
Keyboarding 2 0.0 4 0.0
Latin (Vergil) 2 0.0
Latin II 1 0.0
Latin III 2 0.0
Local Credit: College Skill Building 2 0.0
Local Credit: Foundations of Math 1 0.0
Local Credit: ROTC Drill 2 0.0
Local Credit: STAAR Review 1 0.0
Local Credit: TAKS Review 3 0.0
Local Credit: TAKS Math Prep 3 0.0
Mandarin Chinese I 1 0.0
Mandarin Chinese II 1 0.0
Media Technology Introduction 2 0.0
Medical Terminology 1 0.0
Money Matters 2 0.0
Music Choir I 9 0.0
Music Choir II 2 0.0
Music Instrumental Ensemble I 1 0.0
Music Orchestra I 2 0.0
Music Orchestra II 1 0.0
Music Vocal Ensemble I 3 0.0
Other Foreign Languages I 18 0.1 4 0.0
Other Foreign Languages II 17 0.1 4 0.0
Other Foreign Languages III 2 0.0 1 0.0
PE 2F Alt 1 0.0
PE Substitution: Athletics I 10 0.0

HISD Research and Accountability__________________________________________________________________________ 40
Table 9 (continued). Number and Percentage of HISD Online Courses Completed, By Provider and Course, 2011–2012 and 2012–2013
Provider and Subjects
Course 2011–2012 2012–2013
Number Percent Number Percent
Other Provider
(continued)
Other
(continued)
PE Substitution: Athletics II 2 0.0 1 0.0
PE Substitution: Athletics III 4 0.0
PE Substitution: Non-District Program I 13 0.1 7 0.0
PE Substitution: Non-District Program II 6 0.0 8 0.1
PE Substitution: Non-District Program III 2 0.0 2 0.0
PE Substitution: Non-District Program IV 3 0.0
Personal and Family Development 2 0.0
Physical Education IA 1 0.0
Principles of Agric, Food, & Nat
Resources 2 0.0
Principles of Busi, Marketing, & Finance 2 0.0
Principles of Health Science 2 0.0
Principles of Human Services 3 0.0
Principles of Information Technology 20 0.1 32 0.2
Principles of Marketing 3 0.0
Research in Info Tech Sol 1 0.0
Reserve Officers Training I 6 0.0 1 0.0
Robotics (INN) 3 0.0
Robotics and Automation 1 0.0
Small Animal Management 1 0.0
Spanish I 85 0.4 6 0.0
Spanish I for Spanish Speakers 13 0.1 45 0.3
Spanish II 15 0.1 11 0.1
Spanish II for Spanish Speakers 13 0.1 10 0.1
Spanish III 9 0.0 6 0.0
Spanish V 2 0.0
STAAR Review – English 3 0.0
Teacher Assistant 1 0.0
Team Sports 27 0.1 6 0.0
Technical Theatre 4 0.0
Technology Training 4 0.0
Telecommunications and Networking 1 0.0
Textile and Apparel Design 1 0.0
Theatre I 6 0.0 1 0.0
Theatre II 3 0.0
Theatre III 1 0.0
Touch Systems Data 52 0.2 2 0.0

HISD Research and Accountability__________________________________________________________________________ 41
Table 9 (continued). Number and Percentage of HISD Online Courses Completed, By Provider and Course, 2011–2012 and 2012–2013
Provider and Subjects
Course 2011–2012 2012–2013
Number Percent Number Percent
Other Provider
(continued)
Other
(continued)
Vocal Ensemble 1 0.0
Vocational for Life I 2 0.0
Vocational for Life II 2 0.0
Vocational for Life III 2 0.0
Web Design 1 0.0
Web Mastering 1 0.0
Welding 1 0.0
Yearbook 1 0.0 TOTAL 195 Courses 2,285 10.8 516 3.2
Penn Foster
Social Studies
World History 1 0.0
Other
Foundations of Personal Fitness 1 0.0
Journalism: Newspaper I 1 0.0
Local Credit: Foundations of Math 1 0.0
Theatre II 1 0.0 TOTAL 5 Courses 5 0.0 0 0.0
Plato
English
English I 1 0.0
English II 1 0.0
English III 2 0.0
English IV 1 0.0
Mathematics
Algebra II 1 0.0
Geometry 1 0.0
Science
Physics 19 0.1
Social Studies
Economics 4 0.0
US History 4 0.0
Other
Communication Applications 40 0.2 28 0.2 TOTAL 10 Courses 40 0.2 62 0.4

HISD Research and Accountability__________________________________________________________________________ 42
Table 9 (continued). Number and Percentage of HISD Online Courses Completed, By Provider and Course, 2011–2012 and 2012–2013
Provider and Subjects
Course 2011–2012 2012–2013
Number Percent Number Percent
SSCSP
Mathematics
Advanced Quantitative Reasoning 1 0.0
Algebra I 1 0.0
Social Studies
US History 1 0.0
Other
Communication Applications 1 0.0
Health Education 1 0.0
Spanish I 1 0.0
Spanish II 1 0.0 TOTAL 7 Courses 6 0.0 1 0.0
Texas TechD
English
English I 2 0.0
English II 2 0.0 2 0.0
English III 2 0.0 1 0.0
English IV 2 0.0
Mathematics
Algebra I 10 0.0 10 0.1
Algebra II 3 0.0 2 0.0
Geometry 3 0.0
Mathematical Models with Applications 1 0.0
Pre-Calculus 1 0.0 2 0.0
Science
Biology 2 0.0
Chemistry 1 0.0
Environmental Systems 2 0.0 2 0.0
Physics 3 0.0 3 0.0
Social Studies
Economics 13 0.1 14 0.1
Psychology 1 0.0
Sociology 2 0.0
US Government 18 0.1 22 0.1
US History 4 0.0
World Geography 3 0.0
World History 3 0.0 6 0.0

HISD Research and Accountability__________________________________________________________________________ 43
Table 9 (continued). Number and Percentage of HISD Online Courses Completed, By Provider and Course, 2011–2012 and 2012–2013
Provider and Subjects
Course 2011–2012 2012–2013
Number Percent Number Percent
Texas TechD
(continued)
Other
Art I 1 0.0
Business Image Management 2 0.0
Business Information Management I 7 0.0
Child Development 1 0.0
Communication Applications 59 0.3 40 0.3
Digital and Interactive Media 1 0.0
Foundations of Personal Fitness 1 0.0
French 1 0.0
Health Education 69 0.3 45 0.3
Music History 1 0.0 5 0.0
Physical Education IA 1 0.0
Principles of Information Technology 5 0.0 4 0.0
Principles of Technology 1 0.0 4 0.0
Principles of Technology: Tech Prep 1 0.0
Spanish I 22 0.1 1 0.0
Spanish II 24 0.1 1 0.0
Spanish III 84 0.4 2 0.0
Web Mastering 1 0.0 TOTAL 38 Courses 351 1.7 175 1.1
TxVSN StU
English
English II 1 0.0 3 0.0
English III 1 0.0
English IV 4 0.0
Reading I 1 0.0
Reading Applications and Study Skills 1 0.0
Mathematics
Advanced Quantitative Reasoning 1 0.0
Algebra I 3 0.0 4 0.0
Algebra II 4 0.0
AP Calculus BC 1 0.0 1 0.0
Mathematical Models with Applications 3 0.0
Pre-Calculus 3 0.0

HISD Research and Accountability__________________________________________________________________________ 44
Table 9 (continued). Number and Percentage of HISD Online Courses Completed, By Provider and Course, 2011–2012 and 2012–2013
Provider and Subjects
Course 2011–2012 2012–2013
Number Percent Number Percent
TxVSN StU
(continued)
Science
AP Biology 2 0.0
AP Environmental Science 1 0.0
Astronomy 2 0.0 2 0.0
Biology 1 0.0
Environmental Systems 2 0.0
Physics 2 0.0 2 0.0
Social Studies
AP US Government 15 0.1
Economics 3 0.0 12 0.1
Special Topics – Social Studies 2 0.0
US Government 1 0.0
World Geography 4 0.0
World History 1 0.0
Other
AP Spanish 1 0.0
Art I 4 0.0 2 0.0
Communication Applications 25 0.1 43 0.3
Digital and Interactive Media 5 0.0
Driver Education 2 0.0
Driver and Safety Education 2 0.0 1 0.0
Health Education 8 0.0 14 0.1
Latin II 3 0.0
Multimedia 1 0.0
Music I History 3 0.0
Principles of Information Technology 6 0.0 3 0.0
Spanish I 6 0.0 5 0.0
Spanish II 1 0.0 6 0.0 TOTAL 36 Courses 105 0.5 119 0.7
UT DL
English
English I 8 0.0 2 0.0
English II 2 0.0 1 0.0
English III 5 0.0
English IV 1 0.0

HISD Research and Accountability__________________________________________________________________________ 45
Table 9 (continued). Number and Percentage of HISD Online Courses Completed, By Provider and Course, 2011–2012 and 2012–2013
Provider and Subjects
Course 2011–2012 2012–2013
Number Percent Number Percent
UT DL
(continued)
Mathematics
Algebra I 11 0.1 6 0.0
Algebra II 7 0.0 1 0.0
Geometry 1 0.0
Mathematical Models with Applications 4 0.0 1 0.0
Pre-Calculus 2 0.0
Science
Biology 1 0.0
Chemistry 1 0.0 1 0.0
Environmental Systems 15 0.1 5 0.0
Social Studies
World Geography 6 0.0 1 0.0
World History 1 0.0
Other
Business Information Management I 2 0.0
Communication Applications 4 0.0 1 0.0
French I 2 0.0
French II 2 0.0
Health Education 6 0.0
Mandarin Chinese I 2 0.0
Mandarin Chinese II 2 0.0
Spanish I 763 3.6 465 2.9
Spanish II 866 4.1 390 2.4
Spanish III 72 0.3 156 1.0 TOTAL 23 Courses 1,778 8.4 1,038 6.5
GRAND TOTAL 21,247 100.0 15,939 100.00

HISD Research and Accountability__________________________________________________________________________ 46
Table 10. TAKS Performance of HISD Students Who Took a Course through Apex Learning and
Performance of All Other HISD Students, 2011–2012 and 2012–2013
2011–2012 2012–2013
Rdg Math Sci SocSt Rdg Math Sci SocSt
Apex
Learning
Grade
10 Total N Tested 268 220 143 237 NA NA NA NA
% Met Standard 85.8 76.4 59.4 91.6
N Met Standard 230 168 85 217
N Not Mtg.Stand. 38 52 58 20
% Commended 4.9 8.6 2.8 22.4
N Commended 13 19 4 53
N Not Comm. 255 201 139 184
HISD
(excluding
Apex
Learning)
Grade
10 Total Tested 9,422 9,379 9,411 9,166 NA NA NA NA
% Met Standard 90.3 75.2 74.0 95.0
N Met Standard 8,506 7,051 6,964 8,705
N Not Mtg.Stand. 916 2,328 2,447 461
% Commended 18.0 18.4 16.1 38.2
N Commended 1,696 1,722 1,512 3,500
N Not Comm. 7,726 7,657 7,899 5,666
Apex
Learning
Grade
11 Total Tested 362 201 165 438 270 193 207 438
% Met Standard 92.0 87.1 92.1 97.0 94.8 90.2 94.2 98.4
N Met Standard 333 175 152 425 256 174 195 431
N Not Mtg.Stand. 29 26 13 13 14 19 12 7
% Commended 14.1 23.4 12.7 49.5 11.1 13.0 14.0 53.7
N Commended 51 47 21 217 30 25 29 235
N Not Comm. 311 154 144 221 240 168 178 203
HISD
(excluding
Apex
Learning)
Grade
11 Total Tested 8,791 8,923 8,961 8,657 8,625 8,728 8,729 8,496
% Met Standard 92.3 91.3 94.1 98.3 93.8 88.7 95.2 98.0
N Met Standard 8,117 8,144 8,433 8,506 8,090 7,743 8,309 8,328
N Not Mtg.Stand. 674 779 528 151 535 985 420 168
% Commended 24.5 32.6 25.5 62.7 22.6 24.6 19.1 60.6
N Commended 2,150 2,913 2,289 5,431 1,946 2,148 1,671 5,150
N Not Comm. 6,641 6,010 6,672 3,226 6,679 6,580 7,058 3,346
Source: Source: State of Texas, Texas Assessment of Knowledge and Skills

HISD Research and Accountability__________________________________________________________________________ 47
Table 11. Results for Chi-Square Tests of the Differences in Performance on Texas Assessment of
Knowledge and Skills (TAKS) Tests between HISD Students Who Completed at Least One Apex Learning Course and HISD Students Who Did Not, 2011–2012 and 2012–2013
2011–2012 2012–2013
TAKS Test Chi-Square p Cramer’s V Chi-Square p Cramer’s V
Reading/ELA
Grade 10 NA
Met Standard Χ2(1, N=9,690) = 5.83 .02 .03
Commended Χ2(1, N=9,690) = 31.02 < .001 .06
Grade 11
Met Standard Χ2(1, N=9,153) = 0.06 .81 NA Χ2(1, N=8,895) = 0.47 .49 NA
Commended Χ2(1, N=9,153) = 20.47 < .001 .05 Χ2(1, N=8,895) = 19.87 < .001 .05
Mathematics
Grade 10 NA
Met Standard Χ2(1, N=9,599) = 0.16 .69 NA
Commended Χ2(1, N=9,599) = 13.69 < .001 .04
Grade 11
Met Standard Χ2(1, N=9,124) = 4.32 .04 .02 Χ2(1, N=8,921) = 0.39 .53 NA
Commended Χ2(1, N=9,124) = 7.70 .006 .03 Χ2(1, N=8,921) = 13.93 < .001 .04
Science
Grade 10 NA
Met Standard Χ2(1, N=9,554) = 15.43 < .001 .04
Commended Χ2(1, N=9,554) = 18.58 < .001 .04
Grade 11
Met Standard Χ2(1, N=9,126) = 1.15 .28 NA Χ2(1, N=8,936) = 0.43 .51 NA
Commended Χ2(1, N=9,126) = 14.08 < .001 .04 Χ2(1, N=8,936) = 3.46 .06 NA
Social Studies
Grade 10 NA
Met Standard Χ2(1, N=9,403) = 5.53 .02 .02
Commended Χ2(1, N=9,403) = 24.60 < .001 .05
Grade 11
Met Standard Χ2(1, N=9,095) = 3.53 .06 NA Χ2(1, N=8,934) = 0.31 .58 NA
Commended Χ2(1, N=9,095) = 30.83 < .001 .06 Χ2(1, N=8,934) = 8.44 .004 .03
Notes: Effect size conventions for Cramer’s V are: .10 indicates a small effect, .30 indicates a medium effect, and .50 indicates a large effect.

HISD Research and Accountability__________________________________________________________________________ 48
Table 12. STAAR EOC Performance of HISD Students Who Completed an Associated Course through Apex Learning and Performance of All Other HISD Students, 2011–2012 and 2012–2013
2011–2012 2012–2013
Eng I:R Eng I:W Eng I:R Eng II:R Eng I:W Eng II:W
Apex
Learning Total N Tested 67 67 67 59 68 60
% Satisfactory 77.6 52.2 67.2 76.3 44.1 38.3
N Satisfactory 52 35 45 45 30 23
N Not Satisfactory 15 32 22 14 38 37
% Advanced 7.5 0.0 4.5 6.8 0.0 0.0
N Advanced 5 0 3 4 0 0
N Not Advanced 62 67 64 55 68 60
HISD
(excluding
Apex
Learning)
Total Tested 11,437 11,447 12,916 10,394 13,317 10,426
% Satisfactory 58.9 47.1 59.3 71.2 42.5 45.0
N Satisfactory 6,739 5,389 7,663 7,404 5,655 4,688
N Not Satisfactory 4,698 6,058 5,253 2,990 7,662 5,738
% Advanced 6.1 2.6 8.6 17.2 1.7 2.1
N Advanced 695 295 1106 1791 233 222
N Not Advanced 10,742 11,152 11,810 8,603 13,084 10,204

HISD Research and Accountability__________________________________________________________________________ 49
Table 12 (continued). STAAR EOC Performance of HISD Students Who Completed an Associated Course through Apex Learning and Performance of All Other HISD Students, 2011–2012 and 2012–2013
2011–2012 2012–2013
Alg I Biol WGeog Alg I Geom Biol Chem WGeog WHist
Apex
Learning Total N Tested 28 47 43 20 59 50 65 48 61
% Satisfactory 75.0 91.5 88.4 80.0 94.9 88.0 78.5 66.7 67.2
N Satisfactory 21 43 38 16 56 44 51 32 41
N Not Satisfactory 7 4 5 4 3 6 14 16 20
% Advanced 0.0 2.1 11.6 10.0 5.1 4.0 1.5 2.1 0.0
N Advanced 0 1 5 2 3 2 1 1 0
N Not Advanced 28 46 38 18 56 48 64 47 61
HISD
(excluding
Apex
Learning)
Total Tested 11,014 10,212 10,836 11,817 8,978 12,458 9,158 12,338 9,901
% Satisfactory 78.9 84.1 72.9 75.4 81.9 82.4 76.1 71.0 62.4
N Satisfactory 8,688 8,590 7,904 8,906 7,353 10,263 6,971 8,764 6,174
N Not Satisfactory 2,326 1,622 2,932 2,911 1,625 2,195 2,187 3,574 3,727
% Advanced 14.3 8.3 9.6 14.9 15.2 11.4 9.7 11.3 7.4
N Advanced 1,573 846 1,043 1,758 1,367 1,418 888 1,390 735
N Not Advanced 9,441 9,366 9,793 10,059 7,611 11,040 8,270 10,948 9,166
Source: Source: State of Texas Assessment of Academic Readiness/End of Course Assessments Summary Report

HISD Research and Accountability__________________________________________________________________________ 50
Table 13. Results for Chi-Square Tests of the Differences in Performance on State of Texas Assessment of Academic Readiness End of Course (STAAR EOC) Tests between HISD Students Who Completed an Apex Learning Course Associated with the Test and All Other HISD Students Who Took the Exam, 2011–2012 and 2012–2013
2011–2012 2012–2013
STAAR EOC Test Chi-Square p Cramer’s V Chi-Square p Cramer’s V
English I
Reading I
Satisfactory Χ2(1, N=11,504) = 9.62 .002 .03 Χ2(1, N=12,983) = 1.70 .19 NA
Advanced Χ2(1, N=11,504) = 0.22 .64 NA Χ2(1, N=12,983) = 1.42 .23 NA
Writing I
Satisfactory Χ2(1, N=11,514) = 0.71 .40 NA Χ2(1, N=13,385) = 0.08 .78 NA
Advanced Χ2(1, N=11,514) = 1.77 .18 NA Χ2(1, N=13,385) = 1.21 .27 NA
English II
Reading II
Satisfactory Χ2(1, N=10,453) = 0.73 .39 NA
Advanced Χ2(1, N=10,453) = 4.51 .03 .02
Writing II
Satisfactory Χ2(1, N=10,486) = 1.06 .30 NA
Advanced Χ2(1, N=10,486) = 1.31 .25 NA
Mathematics
Algebra I
Satisfactory Χ2(1, N=11,042) = 0.25 .62 NA Χ2(1, N=11,837) = 0.23 .63 NA
Advanced Χ2(1, N=11,042) = 4.66 .03 .02 Χ2(1, N=11,837) = 0.38 .54 NA
Geometry
Satisfactory Χ2(1, N=9,037) = 6.72 .01 .03
Advanced Χ2(1, N=9,037) = 4.69 .03 .02
Science
Biology
Satisfactory Χ2(1, N=10,259) = 1.91 .17 NA Χ2(1, N=12,508) = 1.08 .30 NA
Advanced Χ2(1, N=10,259) = 2.34 .13 NA Χ2(1, N=12,508) = 2.70 .10 NA
Chemistry
Satisfactory Χ2(1, N=9,223) = 0.20 .66 NA
Advanced Χ2(1, N=9,223) = 4.93 .03 .02
Social Studies
World Geog.
Satisfactory Χ2(1, N=10,879) = 5.17 .02 .02 Χ2(1, N=12,386) = 0.44 .51 NA
Advanced Χ2(1, N=10,879) = 0.20 .66 NA Χ2(1, N=12,386) = 4.04 .04 .02
World History
Satisfactory Χ2(1, N=9,962) = 0.61 .44 NA
Advanced Χ2(1, N=9,962) = 4.89 .03 .02
Notes: Effect size conventions for Cramer’s V are: .10 indicates a small effect, .30 indicates a medium
effect, and .50 indicates a large effect.

HISD Research and Accountability__________________________________________________________________________ 51
Table 14. Number and Percentage of HISD Graduates, 2011–2012
Diploma Type Number Percent Apex Learning Recommended 1,748 66.8 Distinguished 110 4.2 Minimum/IEP 757 28.9
Apex Learning Total 2,615 100.0
All HISD Recommended 7,242 74.8 Distinguished 596 6.2 Minimum/IEP 1,846 19.1
All HISD Total 9,684 100.0 Source: TEA Standard Reports for 2011–2012 Note: Percentages may not total 100 due to rounding
Table 15. Number and Percentage of HISD Online STAAR EOC and TAKS Review Courses, by Provider and School, 2011–2012 and 2012–2013
2011–2012 2012–2013
Number Percent Number Percent
STAAR EOC Review
Apex Learning 0 0.0
Other Provider
Bellaire High School 1 12.5 2 33.3
Reagan High School 1 16.7
TAKS Review
Apex Learning
Advanced Virtual Academy 1 12.5 2 33.3
Houston Math, Science & Tech. Center 1 16.7
Other Provider
Bellaire High School 1 12.5
Lee High School 5 62.5
TOTAL State Test Review Courses 8 100.0 6 100.0

HISD Research and Accountability__________________________________________________________________________ 52
Table 16. HISD Online Course Providers for Advanced Placement (AP) Courses and Number and Percentage of Completed Courses, 2011–2012 and 2012–2013
2011–2012 2012–2013
Number Percent Number Percent
Apex Learning Courses 302 77.0 86 74.8
API (American Preparatory Institute) 1 0.3 0 0.0
HVS 23 5.9 9 7.8
Other Provider 49 12.5 16 13.9
TxVSN StU (Texas Virtual School
Network) 17 4.3 4 3.5
TOTAL HISD Advanced Placement (AP)
Online Course Completions 392 100.0 115 100.0
Table 17. Number of HISD Advanced Placement (AP) Apex Learning Courses Completed, by
School and AP Course, 2011–2012 and 2012–2013
2011–2012 2012–2013
School Name AP Course Number of
Courses
Percentage
of Courses
Number of
Courses
Percentage
of Courses
Advanced Virtual Academy AP SPAN LA A DLOC 1 0.3
AP SPAN LA B DLOC 1 0.3
Bellaire High School AP CAL AB A DLOC 1 0.3
Carnegie Vanguard HS AP ENG LA A DLOC 1 0.3
AP ENG LA B DLOC 1 1.2
AP STATIST A DLOC 1 0.3
Challenge High School AP SPAN LA A DLOC 44
AP SPAN LA B DLOC 24
DeBakey HSHP AP BIOL A CR 7 2.3
AP CAL AB A CR 2 0.7
AP CAL AB B CR 1 0.3
AP CHEM A CR 1 0.3
AP CHEM B CR 1 0.3
AP PHYSICS B A 2 0.7 2 2.3

HISD Research and Accountability__________________________________________________________________________ 53
Table 17 (continued). Number of HISD Advanced Placement (AP) Apex Learning Courses Completed, by School and AP Course, 2011–2012 and 2012–2013
2011–2012 2012–2013
School Name AP Course Number of
Courses
Percentage
of Courses
Number of
Courses
Percentage
of Courses
DeVry Contemporary Learning Center High School (not an HISD 2012–2013 school)
AP PHYS B A DLOC 1 0.3 NA NA
Eastwood Academy AP GOV&POL DLOC 1 1.2
AP SPAN LA B DLOC 1 1.2
Empowerment College Prep High School
AP PSYCH DLOC 2 0.7
Energized for STEM HS SE AP BIOL A DLOC 31 10.3
AP GOV&POL DLOC 4 4.7
AP SPAN LA B DLOC 10 11.6
AP GOV&POL DLCR 1 0.3
AP PHYS B A DLOC 2 2.3
AP PSYCH DLOC 45 14.9
AP SPAN LA A DLCR 2 2.3
AP SPAN LA B DLOC 2 0.7
AP US HIST A DLCR 2 0.7
AP US HIST A DLOC 3 3.5
AP US HIST B DLCR 3 3.5
Furr High School AP ENG LA A DLOC 1 0.3
AP ENG LIT A DLOC 1 0.3
AP ENG LIT B DLOC 1 1.2
AP PSYCH DLOC 1 0.3
AP SPAN LA A DLOC 2 0.7 1 1.2
AP SPAN LA B DLOC 3 1.0 1 1.2
AP US HIST B DLOC 1 0.3
Houston Academy for International Studies
AP ENG LA A DLOC 1 1.2
AP ENG LIT A DLCR 1 0.3
AP GOV&POL DLCR 1 0.3
AP PHYS B A DLCR 3 3.5
AP PHYS B B DLOC 1 1.2

HISD Research and Accountability__________________________________________________________________________ 54
Table 17 (continued). Number of HISD Advanced Placement (AP) Apex Learning Courses Completed, by School and AP Course, 2011–2012 and 2012–2013
2011–2012 2012–2013
School Name AP Course Number of
Courses
Percentage
of Courses
Number of
Courses
Percentage
of Courses
Houston Math, Science & Tech. Center
AP PHYS B A DLOC 1 0.3
AP PHYS B B DLOC 1 0.3
AP SPAN LA A DLOC 10 3.3 8 9.3
AP SPAN LA B DLOC 3 1.0 2 2.3
Jones High School AP PHYS B A DLOC 2 0.7
AP PHYS B B DLOC 2 0.7
Jordan High School for Careers AP MIC ECO DLOC 1 1.2
AP PSYCH DLOC 1 1.2
AP PHYS B B DLOC 1 1.2
Law Enforcement and Criminal Justice High School
AP PSYCH DLOC 7 2.3 3 3.5
Lee High School AP GOV&POL DLOC 1 1.2
AP MIC ECO-DLOC 1 1.2
AP US HIST A DLCR 2 0.7
Madison High School AP PHYS B A DLOC 1 0.3
AP PHYS B B DLCR 1 0.3
AP PHYS B B DLOC 1 0.3
Milby High School AP SPAN LA A DLOC 1 1.2
AP SPAN LA B DLOC 1 1.2
Mt. Carmel Academy AP STATISTICS A 2 2.3
AP STATISTICS B 2 2.3
North Houston Early College High School
AP ENG LA A DLCR 3 1.0
AP ENG LA B DLCR 8 2.6 2 2.3
AP ENG LAN B CR 1 0.3
AP ENG LIT B DLOC 1 1.2
AP SPAN LA A DLOC 1 1.2
AP US HIST A DLCR 4 4.7
Reagan High School AP PSYCH DLOC 16 5.3

HISD Research and Accountability__________________________________________________________________________ 55
Table 17 (continued). Number of HISD Advanced Placement (AP) Apex Learning Courses Completed, by School and AP Course, 2011–2012 and 2012–2013
2011–2012 2012–2013
School Name AP Course Number of
Courses
Percentage
of Courses
Number of
Courses
Percentage
of Courses
Scarborough High School AP GOV&POL DLOC 2 2.3
AP MAC ECO DLOC 2 0.7 1 1.2
AP PHYS B A DLOC 1 0.3 1.2
AP SPAN LA A DLOC 1 1.2
AP SPAN LA B DLOC 1 1.2
AP US HIST A DLOC 1 0.3
AP US HIST B DLOC 2 0.7
AP US HIST B DLCR 1 1.2
Sharpstown High School AP BIOL A DLCR 2 0.7
AP BIOL A DLOC 4 1.3
AP BIOL B DLOC 6 2.0
AP GOV&POL DLOC 9 3.0
AP PHYS B B DLOC 2 0.7
AP SPAN LA A DLOC 4 1.3
AP SPAN LA B DLOC 2 0.7
AP US HIST A DLOC 1 0.3
Sterling High School AP CHEM A DLOC 1 1.2
AP CHEM B DLOC 1 1.2
AP ENG LA A DLOC 2 0.7
AP ENG LA B DLOC 1 0.3 1 1.2
AP ENG LIT A DLOC 3 3.5
AP ENG LIT B DLOC 1 0.3
AP GOV&POL DLOC 1 0.3
AP MAC ECO DLOC 1 0.3
AP US HIST A DLOC 1 0.3
AP US HIST B DLOC 1 0.3
Waltrip High School AP PSYCHOLOGY 1 0.3

HISD Research and Accountability__________________________________________________________________________ 56
Table 17 (continued). Number of HISD Advanced Placement (AP) Apex Learning Courses Completed, by School and AP Course, 2011–2012 and 2012–2013
2011–2012 2012–2013
School Name AP Course Number of
Courses
Percentage
of Courses
Number of
Courses
Percentage
of Courses
Washington High School AP ENG LA B DLCR 1 0.3
AP ENG LIT A DLOC 1 1.2
AP ENG LIT B DLOC 1 1.2
AP SPAN LA A DLCR 1 0.3
AP SPAN LA B DLOC 1 1.2
AP SPAN LA A DLOC 2 0.7
Westside High School AP PHYS B A DLOC 1 0.3
AP SPAN LA A DLOC 2 0.7
AP SPAN LA B DLOC 2 0.7
Wheatley High School AP ENG LIT A DLOC 1 1.2
AP ENG LIT B DLOC 2 0.7 1 1.2
AP GOV&POL DLCR 1 0.3
Worthing High School AP ENG LIT A DLCR 1 0.3
AP ENG LIT B DLOC 1 0.3
AP GOV&POL DLOC 1 0.3
Yates High School AP PHYS B A DLOC 1 0.3
TOTAL 302 100.0 86 100.0
Note: Percentages may not total 100 due to rounding.
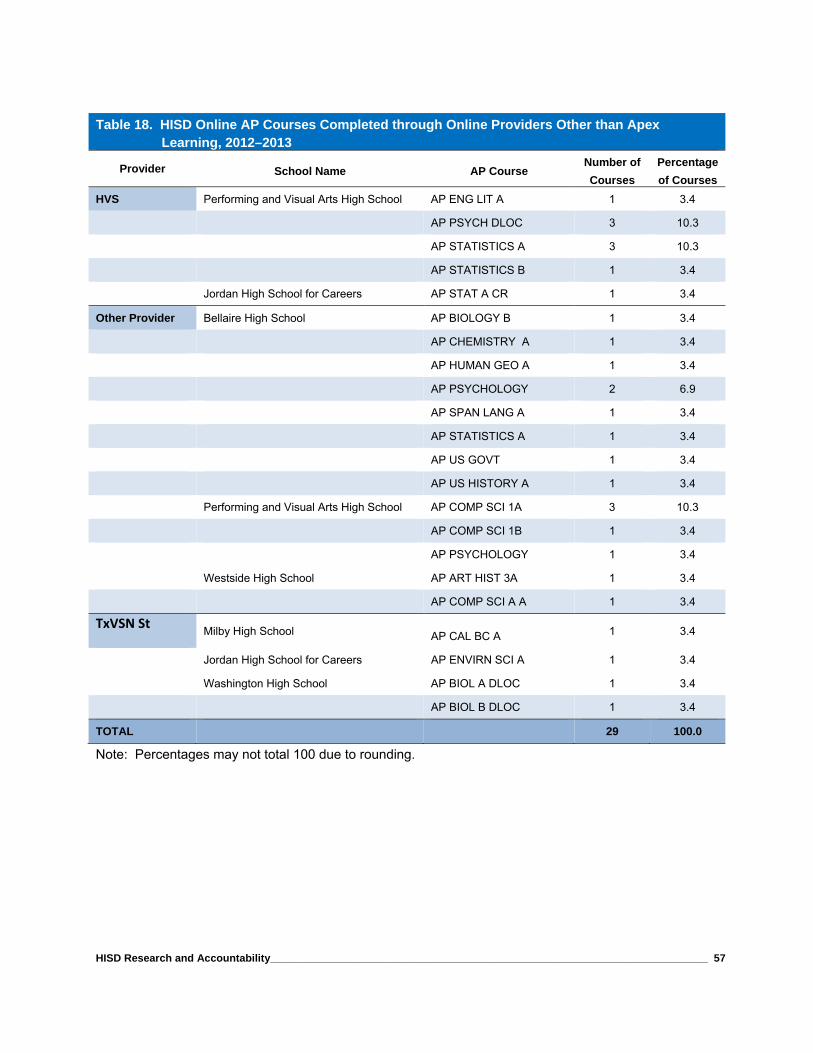
HISD Research and Accountability__________________________________________________________________________ 57
Table 18. HISD Online AP Courses Completed through Online Providers Other than Apex Learning, 2012–2013
Provider School Name AP Course Number of
Courses
Percentage
of Courses
HVS Performing and Visual Arts High School AP ENG LIT A 1 3.4
AP PSYCH DLOC 3 10.3
AP STATISTICS A 3 10.3
AP STATISTICS B 1 3.4
Jordan High School for Careers AP STAT A CR 1 3.4
Other Provider Bellaire High School AP BIOLOGY B 1 3.4
AP CHEMISTRY A 1 3.4
AP HUMAN GEO A 1 3.4
AP PSYCHOLOGY 2 6.9
AP SPAN LANG A 1 3.4
AP STATISTICS A 1 3.4
AP US GOVT 1 3.4
AP US HISTORY A 1 3.4
Performing and Visual Arts High School AP COMP SCI 1A 3 10.3
AP COMP SCI 1B 1 3.4
AP PSYCHOLOGY 1 3.4
Westside High School AP ART HIST 3A 1 3.4
AP COMP SCI A A 1 3.4
TxVSN St Milby High School AP CAL BC A 1 3.4
Jordan High School for Careers AP ENVIRN SCI A 1 3.4
Washington High School AP BIOL A DLOC 1 3.4
AP BIOL B DLOC 1 3.4
TOTAL 29 100.0
Note: Percentages may not total 100 due to rounding.

HISD Research and Accountability__________________________________________________________________________ 58
Table 19. HISD Apex Learning Students Who Earned Credit in a Course Associated with an
AP Examination and Results on the Associated AP Exams, 2011–2012 and 2012–2013
2011–2012 2012–2013
Apex Learning
AP Course
Number of
Students
Awarded
Credit
through
Apex
Learning
Apex
Learning
Students
Who Took
the AP
Exam
Apex
Learning
Students
with AP
Score 3
or Higher
Number of
Students
Awarded
Credit
through
Apex
Learning
Apex
Learning
Students
Who Took
the AP
Exam
Apex
Learning
Students
with AP
Score 3 or
Higher
N % N % N % N % N % N %
Biology B 6 3.8 3 50.0 *
Calculus AB B 1 0.6 1 100.0 *
Chemistry B 10 23.8 10 100.0 0 0.0
English Language B 11 7.0 9 81.8 0 0.0 4 9.5 1 25.0 *
English Literature B 4 2.5 2 50.0 * 4 9.5 1 25.0 *
Government & Politics
14 8.9 1 7.1 * 4 9.5 1 100.0 *
Macroeconomics 2 1.3 1 50.0 * 1 2.4 0 0.0 NA
Microeconomics 2 4.8 0 0.0 NA
Physics B 6 3.8 0 0.0 NA 2 4.8 1 50.0 *
Psychology 72 45.9 52 72.2 1 1.9 4 9.5 2 50.0 *
Spanish Language B 37 23.6 9 24.3 6 66.7 6 14.3 2 33.3 *
Statistics 2 4.8 1 50.0 *
US History B 4 2.5 2 50.0 * 0.0 3 7.1 0 0.0 NA
TOTAL 157 100.0 80 51.0 8 10.0 42 100.0 18 41.9 4 22.2
Notes: Total numbers of students earning credits in courses are duplicated counts; 153 students took Apex Learning AP courses associated with an AP exam in 2011–2012 and 39 students took the courses in 2012–2013.
Percentages may not total 100 due to rounding. * Test scores are not reported for fewer than five students. Source: College Board

HISD Research and Accountability__________________________________________________________________________ 59
Table 20. Independent Sample t Test of HISD AP Psychology Examination Scores for Apex Learning and All Other HISD Students, 2011–2012
Groups N Mean Std. Deviation t p d
Apex Learning Students 52 1.06 0.31
Other HISD Students 495 2.47 1.56
t(397.1)=17.28 <.001 2.52
Note: Effect size conventions for d are: .2 is small, .5 is medium, and .8 is large.