Embed Size (px)
Citation preview

Northwest Energy Efficiency Alliance 421 SW Sixth Avenue, Suite 600, Portland, OR 97204
503.688.5400 | Fax 503.688.5447 neea.org | [email protected]
Memorandum
July 22, 2019
TO: Cost Effectiveness Advisory Committee (CEAC)
FROM: NEEA’s Retail Products Portfolio Team
CC: Susan Hermenet, Director, Emerging Technology, Planning & Evaluation
SUBJECT: Retail Products Portfolio (RPP) Savings and Cost Effectiveness Analysis for Scale Up Approval
NEEA will present its RPP strategies for Scale Up approval on Sept. 4 to the Regional Portfolio Advisory Committee (RPAC). Once RPP passes Scale Up, NEEA will report the program’s cost effectiveness as part of its Market Development programs.
This memo provides background information on the savings and cost effectiveness assumptions for CEAC members to review prior to the RPAC meeting. Please review the assumptions and send questions to [email protected]. NEEA staff will dedicate time to the Retail Products Portfolio program cost and benefits review at our CEAC meeting this upcoming October.
Attached are: • Appendix A: IMC Clothes Washers• Appendix B: IMC Refrigerators/Freezers• Appendix C: IMC Room Air Conditioners• Appendix D: Methodology Clothes Washers• Appendix E: Methodology Refrigerators/Freezers• Appendix F: Methodology Room Air Conditioners• Appendix G: Methodology Air Cleaners• Appendix H: Methodology Sound Bars• Appendix I: Draft Cost Effectiveness and Savings Values (Link to separate worksheet)
Below is a link to NEEA’s baseline review. https://neea.org/resources/retail-product-portfolio-evaluation-final-report
The following sections cover: I. Program Design
II. Savings and Cost Effectiveness Review Process

Northwest Energy Efficiency Alliance - 2 -
III. Overview of the assumptions and outputs used for Scale Up
I. Program DesignRPP is an innovative concept in energy efficiency program design, built off a long history of efforts specifically designed to transform the plug load and consumer electronics markets with a midstream, retailer-focused strategy. RPP coordinates closely with EPA ENERGY STAR® and works directly with corporate-level buying teams of national retailers to provide midstream incentives on qualified energy-efficient products. These incentives are intended to influence retail buying and stocking decisions and to drive market share, which the program uses to further influence manufacturing processes and higher product standards and specifications for each product.
In exchange for the incentives, retailers provide full-category sales data for all products in the portfolio. NEEA uses this sales data to conduct extensive analysis of the efficiency profile of each product category, as well as identify market trends and efficiency opportunities. Based on this data analysis, NEEA has identified specific market transformation intervention strategies that will best achieve energy savings for each product category. A total of five strategies have been identified, as follows:
Table 1: Program Design STRATEGY STRATEGY RATIONALE MIDSTREAM INCENTIVES Provide incentives to influence product assortment and affect
market share for the efficient version; obtain sales data sufficient to inform long-term strategies and support market analyses
EMERGING TECHNOLOGY Capitalize on cases where an innovation is expected that could affect the overall efficiency of a product
MEASUREMENT AND COMPLIANCE Address flaws in the specification itself through adjustments to test procedures or metrics that guide ENERGY STAR labeling
SPECIFICATION ADVANCEMENT Inform ENERGY STAR when data indicate a product has a high market share and the specification should be adjusted; leverage data to influence specification revision process
STANDARDS (For products with Federal standards) this strategy acknowledges the need to be prepared to engage in rulemakings and other processes associated with adjustments to Federal standards
II. Savings and Cost Effectiveness Review ProcessTo assess the strategies, NEEA developed methods to estimate savings rates, market adoption, total sales, and incremental costs. Throughout the process, NEEA has been reviewing its assumptions and methodologies with the Regional Technical Forum (RTF) Market Analysis Subcommittee, RTF staff, Apex

Northwest Energy Efficiency Alliance - 3 -
Analytics1, Energy Solutions2 and members of this committee to make sure the assessment is reasonable. Figure 1 shows some of the more significant reviews over time.
1 NEEA’s evaluator for the program. 2 NEEA’s contractor for program analysis, strategy development and data cleaning.

Northwest Energy Efficiency Alliance 421 SW Sixth Avenue, Suite 600, Portland, OR 97204
503.688.5400 | Fax 503.688.5447 neea.org | [email protected]
Figure 1: Timeline of Key Assumption Review
PG&E Lab tests (sound
bars & air cleaners)
CEAC annual review of
assumptions
CEAC annual review of
assumptions
CEAC annual review of
assumptions
RTF Market Analysis
Subcommittee (Efficiency Mix,
Market Definitions)
Clothes Washers
alignment with RTF Update
RTF Market Analysis
Subcommittee (Model
matching)
Refrigerators/ Freezers alignment with RTF Update
Apex review of NEEA's Market Transformation
Baseline approach
Cadmus will complete review of all cost
effectiveness inputs as well as NEEA's
long-term forecast assumptions.
Following this NEEA will review with CEAC.
Continued review of the Market
Transformation baseline assumptions, measure updates, etc.
Pacific Crest Labs completes field test of energy
consumption for televisions. RTF Market
Analysis Subcommittee (Market Size Estimation)
CEAC Incremental Cost
Methodology presentation

Northwest Energy Efficiency Alliance 421 SW Sixth Avenue, Suite 600, Portland, OR 97204
503.688.5400 | Fax 503.688.5447 neea.org | [email protected]
Currently, Cadmus is reviewing the cost effectiveness inputs and calculations in as well as NEEA’s forecast of the long-term savings potential (Appendix I). Cadmus should have the review done by August 30. Staff will present the results during the October 23 CEAC meeting. Other ongoing work includes:
• NEEA is working on a method to estimate total regional sales now that AHAM no longer produces regional reports. NEEA will review this method with the RTF Market Analysis Subcommittee in late August/early September.
• NEEA is field testing energy use of televisions. These tests will help eliminate gaps in the current Department of Energy (DOE) test method.
• The program is working with ENERGY STAR to update its specification for sound bars and air cleaners. Most products sold in these categories meet the respective specification.
• NEEA will continue to review its market transformation baseline assumptions based on the results from the 2019 evaluation.
III. Results for Scale Up Milestone Table 2 shows the inputs and results NEEA is using for Scale Up. The benefits and costs over 20 years add up to a benefit-cost ratio of approximately 1.7 using NEEA’s approach to measure cost effectiveness from a Total Resource Cost perspective. Because this program is dynamic with products and measures moving in and out of the portfolio, the cost effectiveness of the program will change over time. As a result, NEEA will regularly update the values as part of its due diligence. Each product category besides room air conditioners has a B/C ratio ≥ 1. Room air conditioners have a B/C ratio below 1 largely because there are not any models in the small configuration that meet the specification. As a result, NEEA is looking into emerging technology that would help make smaller units more efficient. Refrigerators, freezers and clothes washers also have measures with B/C ratios below 1; however, the benefit stream of the whole product category is greater than 1.

Northwest Energy Efficiency Alliance 421 SW Sixth Avenue, Suite 600, Portland, OR 97204
503.688.5400 | Fax 503.688.5447 neea.org | [email protected]
Table 2: Draft Long-term Savings Potential and Benefit-Cost Ratios
Short-term Strategy Long-term Strategy
20-Year Savings Potential (2020-
2039 aMW)
Total Resource Cost
Benefit/Cost Ratio
Refrigerators 75 1.0 Bottom-mount
Freezer Midstream Incentives New ES Spec 2022 Standard by 2025 Emerging Tech
25 51.0
Side-mount Freezer Midstream Incentives 31 0.6 Other/top-mount
Freezer Spec. Advancement 19 0.4
Freezers 4 1.1
Upright Midstream Incentives New ES Spec 2022 Standard by 2025 3 0.3
Compact Midstream Incentives New ES Spec Midstream Incentives Emerging Tech
0 1.6
Chest Midstream Incentives 3 15.9
Clothes Washers 109 2.9
Top-loading Midstream Incentives Fed Standard by 2025 95 7.0
Front-loading Measurement & Compliance
Measurement & Compliance 14 0.1
Room AC 2 0.2
≤ 7 kBTU Emerging Tech New ES Spec 2022 Standard by 2025 Emerging Tech
0 0.0
>7 kBTU < 10 kBTU Midstream Incentives 1 0.7
>10 kBTU Midstream Incentives 1 11.1
Televisions* 57 N/A
Ultra High Definition
Measurement & Compliance
Midstream Incentives ENERGY STAR Spec advancement
57 N/A
Sound bars** 1 N/A
Soundbars Measurement & Compliance
Midstream Incentives ENERGY STAR Spec advancement
1 N/A
Air Cleaners** 2 N/A
All Sizes Measurement & Compliance
Midstream Incentives ENERGY STAR Spec advancement
2 N/A
Note: These are draft values. Assumptions are under review by Cadmus. NEEA updates its analysis as new data become available such as program sales, period of analysis, administration costs and additions of new measures. As a result, values may change over time. *Although televisions are a part of the RPP program, NEEA is not including them in the cost effectiveness analysis at this time because of lack of accurate data on energy consumption using the existing DOE test method. In the meantime, NEEA is developing a test standard and conducting testing to estimate energy consumption based on a revised test method that DOE is expected to adopt in 2020. NEEA expects testing to run into late Q4 with results potentially by the end of the year. With the more real-world data, NEEA will be able to develop measures to assess savings and cost effectiveness.

Northwest Energy Efficiency Alliance - 7 -
**The program also did not include air cleaners and sound bars in the cost effectiveness assessment. In both cases, NEEA is working with ENERGY STAR to revise its specification levels. As is, most models sold meet the minimum requirements.

PRESENTED TO PRESENTED BY
Energy SolutionsNEEA
March 25, 2019
Incremental Measure Costs (IMC) of ENERGY STAR Clothes Washers
Ari MytelkaChristina Steinhoff

Presentation Overview
Introduction
Part 1: Preliminary Preparation• Data Collection and Cleaning• Product-Specific Research and Analysis
Part 2: Multiple Regression Analysis• Methods• Models
Part 3: Results
2

Background | Specification & Scope• ENERGY STAR specification v8 effective February 5, 2018
– 2017 National Market Penetration: 46%– In web-scraped model-weighted* data, we observed 50% ENERGY
STAR in Q1 2019
• Requires:– Integrated Modified Energy Factor (IMEF) greater than or equal to
the qualifying level specified for each product class– Integrated Water Factor (IWF) less than or equal to the qualifying
level specified for each product class– Connected units are permitted to qualify with 5% lower CEER
• Segments the room AC market into product classes based on: – Cubic feet of capacity– Load configuration (front-load or top-load)
3* Note that model-weighted data is not necessarily reflective of sales.

PART 1: PREPARATION

Data Collection | Web-Scraping
• Collected model information from seven retailers
• Filtered out commercial units and spare parts, resulting in the model counts on the right
• The unit count shows the number of unique models offered by a retailer, but the total unit count includes non-unique models offered by multiple retailers
• The web-scraping covered models comprising 96% of RPP sales from 2018-2019 and 86% of all RPP sales
Retailer Number of unitsBest Buy 171Costco 123Home Depot 133Kmart 74Lowes 125Sears 44Walmart 140TOTAL 810
5

Product Research | Buying GuidesAnalyzed five buying guides to examine:• Definition: What exactly is each feature?• Importance to consumers and “hype”: How much do consumers care
about this feature?• Effect on efficiency: What are its impacts on energy consumption?• Effect on price: How much does it impact price?
Results:• Selecting an appropriate load configuration (top or front) and size
(influenced by capacity and whether the unit is a stacked laundry center) are the most important consumer criteria.
• Of secondary importance are energy efficiency, controls, noise, and brand.
• For top-load washers, whether the unit uses an agitator can also be a consumer criterion.
6

Product Research | DOE TSDThe DOE’s 2012 Technical Support Document for clothes washers provides information on the likely methods for improving energy efficiency and the estimated manufacturing costs of energy efficiency as of 2012. Manufacturer costs might or might not be passed on to the consumer.
Potential technology pathways: – Improved motor efficiency– Adaptive control systems– Hot water circulation loop
7
Product Class IMC (2010 $)Top Load (CSL 6 to CSL 8) $60
Front Load (CSL 5 to CSL 8)* $76
* DOE did not analyze the installed costs of washers meeting the Most Efficient requirements. CSL 8 was the most efficient level analyzed, and it required efficiency similar to the ENERGY STAR level for top-load units and below the ENERGY STAR level for front-load units.

PART 2: MULTIPLE REGRESSION

Methods | Multiple Regression
9
Hedonic price modelingAssumes: 𝑃𝑃𝑃𝑃𝑃𝑃𝑃𝑃𝑃𝑃 ≈𝑓𝑓(𝐴𝐴𝐴𝐴𝑃𝑃𝑃𝑃𝐴𝐴𝐴𝐴𝐴𝐴𝑃𝑃 1,𝐴𝐴𝐴𝐴𝐴𝐴𝑃𝑃𝑃𝑃𝐴𝐴𝐴𝐴𝐴𝐴𝑃𝑃 2,𝐴𝐴𝐴𝐴𝐴𝐴𝑃𝑃𝑃𝑃𝐴𝐴𝐴𝐴𝐴𝐴𝑃𝑃 3 … )
Controlling for variables using multiple regressionGenerally: 𝑃𝑃𝑃𝑃𝑃𝑃𝑃𝑃𝑃𝑃 =𝛽𝛽0 + 𝛽𝛽1 𝑋𝑋1 + 𝛽𝛽2 𝑋𝑋2 … + 𝛽𝛽𝑝𝑝 𝑋𝑋𝑝𝑝 + 𝜖𝜖 $0
$500
$1,000
$1,500
$2,000
$0 $500 $1,000 $1,500 $2,000
Actu
al P
rice
Predicted Price
Ex. Hedonic Price Model
For example:– Price = Constant + βCap(Capacity) + βcolor(Color) + βESTAR(ESTAR)
– β for ESTAR estimates the effect of ESTAR on price, controlling for capacity (a numeric field) and color (a categorical field)
• Estimates coefficient (β) for each variable as well as the 95% confidence interval for that β value

Variable Selection | Prevalence • The web-scraped data do
not include complete feature information for all models, and for some features, information* is more prevalent than for others
• In selecting features to control for, we set a constraint that after adding all features, the regression model would retain at least 75% of the data
Sample Feature Prevalence %Retailer & Brand 100%Capacity 89%ENERGY STAR 85%Smart 50%Noise Reduction 30%Agitator 12% (25% of top-load)
*Feature information can be prevalent in a model even if the feature is not present
Is the unit “Smart”?
Online Description?
Is “Smart” Prevalent?
Yes “Wifi-connected” YesYes [Blank] NoNo “Not connected” YesNo [Blank] No

Variable Selection | Multicollinearity
• Analyzed the extent to which each candidate variable was correlated with the other variables
• Which variables have non-independent impacts on price?– Whether the unit was a combination washer-dryer had different
impacts on price depending on the capacity, so we added an interaction variable
• Which variables should be omitted because they are very collinear with a variable we will include? – Most features were minimally collinear– Weight and length/width/height were collinear with capacity
11

Variable Selection • The initial regression model controlled for capacity only, and
statistically-significant features were added if they met the prevalence constraint and improved the metric of adjusted R2
• Features were added according to a sequence determined by buying guide research, with the most important variables added earlier – one significant option was chosen from a set of collinear variables on the basis of adjusted R2
Sample buildup:Model Variables Feature Options Selected FeatureCapacity ESTAR ESTARCapacity, ESTAR Combination Unit Combination UnitCapacity, ESTAR, Combination Unit
Smart Controls None – not prevalent
Capacity, ESTAR, Combination Unit
Noise Reduction None – not prevalent
This process continues until all features have been tested.
Initial
…Final Model

Model | Summary TableFeatures Controlled Values Included
Capacity 0.7 – 8.8 cubic feetCombination Unit Combination Washer-Dryer or Washer
Color Black, Blue, Brown, Gray, Stainless, Metallic, Red, White, Other/Multi
Brand Bosch, Deco, Equator, Frigidaire, GE, Haier, Kenmore, LG, Maytag, Samsung, Whirlpool, or Other*
Retailer Best Buy, Costco, Home Depot, Kmart, Lowes, Sears, Walmart
13
Metric: Labeled (or matched to) ENERGY STARAdjusted R2: 0.6874 for front-load, 0.8043 for top-loadData % in Model: 93% for front-load, 94% for top-load
The front-load and top-load models used the same variables but fit to different data.
* Brands with less than 10 models captured in the web-scraped data were grouped to avoid overfitting.

PART 3: RESULTS

Results | Summary Table
Front Load Top LoadBasic IMC Estimate (ME FL, v8 TL) $82 $68
95% Confidence Interval - $59 to $223 $7 to $129Adv. IMC Estimate (ME+5% FL, ME TL) $471 $419
95% Confidence Interval $269 to $672 $67 to $770No. of Data Points – Washer Models 269 360
The results are similar ($66 for v8 TL, $386 for ME TL, $86 for ME FL, $470 for ME+5% FL) if we also control for whether the unit has noise reduction features, whether the unit has “smart” or programmable controls, whether the unit is portable, and (for top-load) whether the unit uses agitator or impeller technology.
These variables are less prevalent in the dataset, and controlling for any of them causes the overall model to retain < 75% of the data collected. None of these variables significantly improve the model’s predictive capability as measured by the adjusted R2 value.
15

APPENDIX

Appendix | Prices
17
Mean Median Min Max 1Q 3Q Std. Dev.$984 $944 $40 $4900 $663 $1260 $578

Appendix | TL Model Coefficients
18
Variable Value(Intercept) -118.73492ESTAR ME 418.538139ESTAR v8 68.0342524Capacity 126.441391Combination 966.026046Comb. x Cap. -32.447974Brand 1 -0.2956304Brand 2 137.323131Brand 3 69.9378049Brand 4 76.5276058
Variable ValueBrand 5 301.717819Brand 6 167.583472Brand 7 112.877859Brand 8 71.6239482Brand 9 165.953046Retailer 1 -72.112938Retailer 2 9.31074065Retailer 3 11.1963672Retailer 4 41.1178126Retailer 5 -36.689722
Variable ValueRetailer 6 265.7079Color 1 72.6944246Color 2 175.663548Color 3 224.662845Color 4 97.8339085Color 5 112.91188Color 6 17.552295

Appendix | FL Model Coefficients
19
Variable Value(Intercept) 547.341249ESTAR ME 81.9792327ESTAR ME+5% 470.655406Capacity 69.0766254Combination 414.145656Comb. x Cap. 181.627141Brand 2 -451.75869Brand 3 -977.67212Brand 4 -648.9252Brand 5 -316.26975
Variable ValueBrand 6 -538.69077Brand 7 -592.10596Brand 8 -448.73511Brand 9 -481.94587Brand 10 -127.09085Retailer 1 308.691026Retailer 2 -57.030178Retailer 3 40.1433302Retailer 4 -4.9372372Retailer 5 -333.89745
Variable ValueRetailer 6 107.828698Color 1 485.318107Color 2 639.110162Color 3 516.736142Color 4 357.913701Color 5 619.338485Color 6 447.329478Color 7 422.427783Color 8 630.924362

PRESENTED TO PRESENTED BY
Energy SolutionsNEEA
August 15, 2018
Incremental Measure Costs (IMCs) of ENERGY STAR Refrigeration Products
Ari Mytelka Phi Nguyen, PhDChristina Steinhoff

Presentation OverviewIntroduction
Part 1: Preliminary Preparation• Data Collection and Cleaning• Product-Specific Research and Analysis
Part 2: Multiple Regression Analysis• Methods• Models
Part 3: Results
Part 4: Matched Pairs Analysis
Part 5: Comparison to RPP Sales
2

Background | Specification & Scope
• ENERGY STAR specification v5.0 effective September 15, 2014– 2016 National Market Penetration: 48% for refrigerators, 35% for freezers
• In web-scraped model-weighted* data, 46% for refrigerators and 35% for freezers in Q2 2018
• Requires:– Energy consumption must be at least 10% lower than the maximum allowed
by the DOE standard– Connected units are permitted to qualify at 5% lower than the DOE maximum
• Likely technology pathways: – Improved insulation material or thickness– Improved compressor efficiency – Optimized gasket and door design– These technologies are not readily noticeable to a consumer, though
insulation thickness can be observed
3
* Note that model-weighted data is not necessarily reflective of sales.

PART 1: PREPARATION

Data Collection | Web-Harvesting
• Collected refrigerator and freezer model information from eight retailers
• Filtered out accessories and replacements parts, resulting in the model counts on the right
• The unit count shows the number of unique models offered by a retailer, but the total unit count includes non-unique models offered by multiple retailers
Retailer Number of unitsAJ Madison 730Best Buy 806Costco 123Home Depot 896Kmart 532Lowes 858Sears 459Walmart 344TOTAL 4,018
5

Data Collection | Product Classes
• Collected refrigerator and freezer models in seven categories, targeting the categories of interest to NEEA
• All categories except freezerless refrigerators had at least 100 models
Class Number of unitsTop-mount & Freezerless
1,265
Side-mount 664Bottom-mount 1,827Compact Ref. 537Chest* 172Upright 115Compact Fre.* 158
* Includes compact chest freezers.
6

Product Research | Buying GuidesAnalyzed six buying guides to examine:• Definition: What exactly is each feature?• Importance to consumers and “hype”: How much do consumers care about this
feature?• Effect on efficiency: What are its impacts on energy consumption?• Effect on price: How much does it impact price?
Systematic spreadsheet analysis to aid variable selection.
Results:• Selecting an appropriate capacity and freezer mount position are by
a large margin the most important consumer criteria.• Of secondary importance for refrigerators and freezers are
organizational features, brand, and temperature controls.• Some features that were relevant to refrigerators but generally
unimportant or irrelevant to freezers were a counter-depth design and through-the-door dispensers for ice and water.
7

PART 2: MULTIPLE REGRESSION

Methods | Multiple Regression
9
Hedonic price modeling• Assumes: 𝑃𝑃𝑃𝑃𝑃𝑃𝑃𝑃𝑃𝑃 ≈
𝑓𝑓(𝐴𝐴𝐴𝐴𝑃𝑃𝑃𝑃𝐴𝐴𝐴𝐴𝐴𝐴𝑃𝑃 1,𝐴𝐴𝐴𝐴𝐴𝐴𝑃𝑃𝑃𝑃𝐴𝐴𝐴𝐴𝐴𝐴𝑃𝑃 2,𝐴𝐴𝐴𝐴𝐴𝐴𝑃𝑃𝑃𝑃𝐴𝐴𝐴𝐴𝐴𝐴𝑃𝑃 3 … )
Controlling for variables using multiple regression• Generally: 𝑃𝑃𝑃𝑃𝑃𝑃𝑃𝑃𝑃𝑃 =
𝛽𝛽0 + 𝛽𝛽1 𝑋𝑋1 + 𝛽𝛽2 𝑋𝑋2 … + 𝛽𝛽𝑝𝑝 𝑋𝑋𝑝𝑝 + 𝜖𝜖
• Used in 2010-2012 WO17 Ex Ante Measure Cost Study
$0
$500
$1,000
$1,500
$2,000
$0 $500 $1,000 $1,500 $2,000
Actu
al P
rice
Predicted Price
Ex. Hedonic Price Model
• For example:– Price = Constant + βCapacity(Capacity) + βIce_Maker(Has_Ice_Maker) + βESTAR(ESTAR Qualified)– β for ESTAR estimates the effect of ESTAR on price, controlling for refrigerator capacity and
whether the unit has an ice maker
• Estimates coefficient (β) for each variable as well as the 95% confidence interval for that β value

Variable Selection | Prevalence • The web-scraped data do
not include complete feature information for all models, and for some features, information* is more prevalent than for others
• In selecting features to control for, we set a constraint that after adding all features, the regression model would retain at least 75% of the data for that product class
Sample Feature Bottom-Mount Ref. Prevalence %
Brand 100%Capacity 99%CEE Qualified 53%Counter Depth 76%Smart 44%Air Filter 33%
*Feature information can be prevalent in a model even if the feature is not present
Is the unit “Smart”?
Online Description?
Is “Smart” Prevalent?
Yes “Wifi-connected” YesYes [Blank] NoNo “Not connected” YesNo [Blank] No

Variable Selection | Multicollinearity
• Analyzed the extent to which each candidate variable was correlated with the other variables
• Which variables should be omitted because they are very collinear with a variable we will include?
– Most features were minimally collinear– The possible metrics for energy efficiency were very collinear with each other
need to select only one of ENERGY STAR, % less energy consumption than the maximum allowed by the DOE standard, and CEE qualification
11
Metric ENERGY STAR % Better than DOE CEE QualifiedPros • What consumer
sees• Simple
• Continuous variable
• Direct efficiency measure
• Subtler gradations than ENERGY STAR
Cons • Could be v4• Need to assume
unlabeled = not ENERGY STAR
• Not seen by consumer
• Not available for all units
• Not seen by consumer
• Not available for all units

Variable Selection • For each configuration, the initial regression model controlled for
capacity only, and statistically-significant features were added if they met the prevalence constraint and improved the metric of adjusted R2
• Features were added according to a sequence determined by buying guide research, with the most important variables added earlier – one significant option was chosen from a set of collinear variables on the basis of adjusted R2
Sample buildup for upright freezers:Model Variables Feature Options Selected FeatureCapacity ESTAR, % better
than DOEESTAR
Capacity, ESTAR Brand None – not significantCapacity, ESTAR Color, stainless steel None – not significantCapacity, ESTAR Has ice maker Has ice maker
This process continues until all features have been tested.
Initial
…Final Model

Models | Summary Table
Class Features Controlled Adjusted R2 Data % in Model
Metric
Top-mount & Freezerless
Capacity, brand, stainless steel, has ice maker
0.1999 87% ESTAR
Side-mount Capacity, brand, stainless steel, is counter-depth
0.5058 76% %
Bottom-mount Capacity, brand, has French door
0.2457 81% %
Compact Ref. Capacity, brand, color 0.3188 85% %Chest Capacity, brand 0.7659 77% %Upright Capacity, has ice maker 0.5551 78% ESTARCompact Fre. Capacity, brand 0.3862 87% %
13

PART 3: RESULTS

Results | Summary Table
Class IMC 95% Confidence Interval Estimate NTop-mount & Freezerless
$43 to $92 $68 1100
Side-mount $63 to $154 $108 504Bottom-mount - $155 to - $36 - $95 1475Compact Ref. - $82 to $17 - $32* 454Chest (includes compact units)
- $81 to $18 - $32* 132
Upright - $43 to $188 $73* 90Compact Fre. - $2 to $29 $13 137
* The result is not significant at the 90% confidence level, so thisIMC value should be used conservatively. All results are significant at 75% confidence.
15

Results | Comparison to DOE TSD1
16
Class 2007 ENERGY STAR v4 IMC
2018 v5 IMC Web-scrape Estimate
Top-mount $63 $68 ± $25Side-mount $208 $108 ± $45Bottom-mount - $31* - $95 ± $59Compact Ref. Not analyzed - $32 ± $50**Chest (includes compact units)
$121 - $32 ± $49**
Upright $107 $73 ± $115**Compact Fre. Not analyzed $13 ± $15
* DOE noted that the result was not statistically significant.** The result is not significant at the 90% confidence level.
1 DOE. Refrigerators Final Rule Technical Support Document. September 2011.

PART 4: MATCHED PAIR ANALYSES

For each configuration, models were selected for the matched pair analysis through the following process:1. Generate a list of brands that offer at least one pair of models with a “%
more efficient than DOE standard” difference of 5 percentage points or greater.
2. For each brand, plot capacity against the “% more efficient than DOE standard” and select pairs that have similar capacity while having a difference in efficiency of at least 5 percentage points.
– If there are multiple pairs for a given brand and capacity range, select models sold by the same retailer.
3. If there are fewer than 3 such pairs after checking all brands,* plot capacity against “% more efficient than DOE standard” for all units with that configuration, regardless of brand.
Matched Pair | Methods
18
This matches pairs of models according to the features most likely to have a significant impact on price. If capacities were identical, the prices were compared directly. Otherwise, prices were adjusted for capacity.
* This was only necessary for chest freezers and compact freezers.

Matched Pair | Top-Mount & Freezerless
19
Brand Capacity (cu. ft.)
% Better than Fed Std.
Price ($)
Retailer
GE 15.53 10.3% $587 AJ MadisonGE 15.53 0.4% $515 AJ Madison
Frigidaire 16.3 10.3% $719 AJ MadisonFrigidaire 16.3 0.1% $559 AJ MadisonWhirlpool 21.3 24.3% $1079 LowesWhirlpool 21.3 14.9% $944 LowesFrigidaire 18.0 17.2% $848 SearsFrigidaire 18.0 10.1% $830 Sears
The matched pairs analysis shows an average IMC for a ~10% decrease in energy use of $96, which is slightly higher than the $92 upper limit of the model’s 95% confidence interval.

Matched Pair | Side-Mount
20
Brand Capacity (cu. ft.)
% Better than Fed Std.
Price ($)
Retailer
Frigidaire 22.1 8.9% $1,149 KmartFrigidaire 22.1 0.1% $899 KmartFrigidaire 25.6 8.9% $1,260 LowesFrigidaire 25.6 0.1% $1,260 Best BuyGE 23.2 8.9% $1,349 SearsGE 23.2 0.0% $1,259 SearsWhirlpool 24.55 8.8% $1,170 Best BuyWhirlpool 24.53 0.0% $1,260 Best Buy
The matched pairs analysis shows an average IMC of $63, which is lower than the $108 prediction of the hedonic price model but within the 95% confidence interval.

Matched Pair | Bottom-Mount
21
Brand Capacity (cu. ft.)
% Better than Fed Std.
Price ($)
Retailer
Kenmore 28.5 44% $2000 KmartKenmore 28.5 9% $2000 KmartKenmore 18.7 20% $1100 SearsKenmore 18.7 13% $800 SearsWhirlpool 25.2 19% $1530 Best BuyWhirlpool 25.2 9% $1700 Best BuySamsung 27.8 14% $2600 Best BuySamsung 27.8 9% $2700 Best BuyFrigidaire 27.6 30% $1844 Home DepotFrigidaire 27.6 9% $2024 Home Depot
The matched pairs analysis shows an average IMC of -$30, which is slightly higher than the - $36 upper limit of the model but suggests a negative IMC is reasonable.

Matched Pair | Compact Refrigerator
22
Brand Capacity (cu. ft.)
% Better than Fed Std.
Price ($)
Retailer
Danby 7.3 22% $425 WalmartDanby 7.3 0% $410 Home DepotAvanti 3.1 36% $297 WalmartAvanti 3.1 0% $143 WalmartAvanti 4.4 10% $250 Best BuyAvanti 4.4 0% $220 Best BuyAvanti 1.7 17% $143 WalmartAvanti 1.7 0% $99 Walmart
The matched pairs analysis shows an average IMC of $61, which is much higher than the model IMC of - $32 and outside the confidence interval. The IMC for this product class may be less reliable than the IMCs for other product classes. Compact refrigerators are not incentivized through NEEA’s RPP program.

Matched Pair | Chest Freezer
23
Brand Capacity (cu. ft.)
% Better than Fed Std.
Price ($)
Capacity-normalized price ($)*
Retailer
Avanti 7.0 10.9% $240 $24 WalmartKoolatron 7.0 0.3% $277 $61 WalmartIgloo 5.1 21.8% $177 $20 WalmartHisense 5.1 0.0% $169 $12 WalmartAvanti 3.5 10.9% $238 $130 WalmartMidea 3.5 0.5% $199 $91 WalmartAvanti 2.1 10.8% $168 $103 SearsAvanti 11.0 2.0% $459 $120 SearsGE 10.6 10.7% $404 $78 LowesGE 7.0 0.4% $239 $23 Lowes
The matched pairs analysis shows an average IMC of $10, supporting the result that the IMC for chest freezers is small – the hedonic price model found the IMC for this category to not be statistically significant.* Using the regression coefficient found for chest freezer capacity

Matched Pair | Upright Freezer
24
Brand Capacity (cu. ft.)
% Better than Fed Std.
Price ($)
Capacity-normalized price ($)*
Retailer
Frigidaire 16.6 10% $579 $249 LowesFrigidaire 16.6 0% $691 $361 LowesKenmore 16.6 10% $800 $470 SearsKenmore 17.3 0% $580 $223 SearsKenmore 20.5 10% $930 $452 KmartKenmore 20.9 0% $620 $126 KmartWhirlpool 15.7 15% $602 $306 LowesWhirlpool 15.7 0% $619 $323 LowesKenmore 20.2 10% $550 $83 SearsKenmore 20.9 0% $620 $126 Sears
The matched pairs analysis shows an average IMC of $80, which is close to the model-predicted IMC of $73.* Using the regression coefficient found for upright freezer capacity

Matched Pair | Compact Freezer
25
Brand Capacity (cu. ft.)
% Better than Fed Std.
Price ($)
Capacity-normalized price ($)*
Retailer
Avanti 3.5 11% $238 $258 WalmartMidea 3.5 0% $199 $219 WalmartIgloo 5.1 22% $177 $160 Walmart
Koolatron 5.0 0% $245 $231 WalmartAvanti 2.9 17% $299 $333 Sears
Koolatron 3.0 12% $200 $231 Sears
The matched pairs analysis shows an average IMC of $23, which is within the confidence interval around the model-predicted IMC of $13.* Using the regression coefficient found for compact freezer capacity

PART 5: COMPARISON TO RPP SALES

Sales | Freezers
27
The freezer models included in the web-scrape effort constituted 66% of NEEA’s 2018 RPP sales, including 16 of the 20 top-selling models. However, the web collection did not include the top-selling model. It seems reasonable to believe that the scraped data include a representative selection of freezers.
Model numbers of top-selling freezers

Sales | Refrigerators
28
The refrigerator models included in the web-scrape effort accounted for 89% of NEEA’s 2018 RPP sales of standard-size refrigerators (including all of the top-selling 20 models) and 29% of the compact refrigerator sales (including only 6 of the top-selling 20 models). The scraped data include a representative sample of standard-size refrigerators but may not have a representative sample of compact refrigerators.

PRESENTED TO PRESENTED BY
Energy SolutionsNEEA
March 13, 2019
Incremental Measure Costs (IMC) of ENERGY STAR Room ACs
Ari Mytelka Phi Nguyen, PhDChristina Steinhoff

Presentation Overview
Introduction
Part 1: Preliminary Preparation• Data Collection and Cleaning• Product-Specific Research and Analysis
Part 2: Multiple Regression Analysis• Methods• Models
Part 3: Results
2
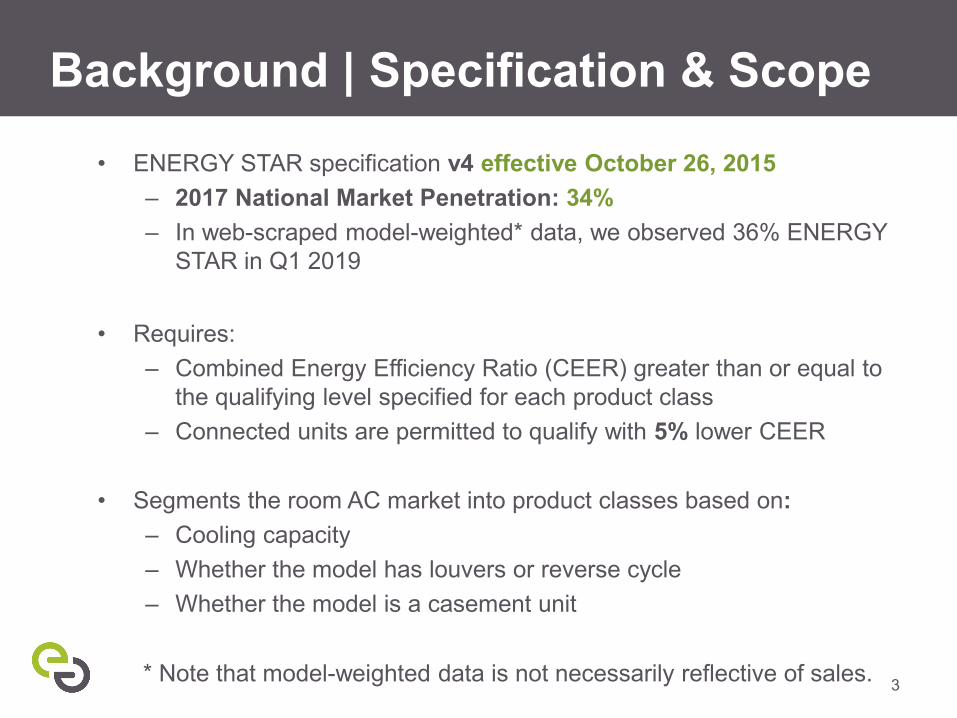
Background | Specification & Scope• ENERGY STAR specification v4 effective October 26, 2015
– 2017 National Market Penetration: 34%– In web-scraped model-weighted* data, we observed 36% ENERGY
STAR in Q1 2019
• Requires:– Combined Energy Efficiency Ratio (CEER) greater than or equal to
the qualifying level specified for each product class– Connected units are permitted to qualify with 5% lower CEER
• Segments the room AC market into product classes based on: – Cooling capacity– Whether the model has louvers or reverse cycle– Whether the model is a casement unit
3* Note that model-weighted data is not necessarily reflective of sales.

PART 1: PREPARATION

Data Collection | Web-Scraping
• Collected model information from seven retailers
• Filtered out accessories and replacements parts, resulting in the model counts on the right
• The unit count shows the number of unique room AC models offered by a retailer, but the total unit count includes non-unique models offered by multiple retailers
• The web-scraping collected all but one of the models sold through RPP and covered >99% of RPP sales
Retailer Number of unitsBest Buy 75Home Depot 243Kmart 292Lowes 72Sears 300Target 48Walmart 447TOTAL 1,477
5

Product Research | Buying GuidesAnalyzed five buying guides to examine:• Definition: What exactly is each feature?• Importance to consumers and “hype”: How much do consumers care
about this feature?• Effect on efficiency: What are its impacts on energy consumption?• Effect on price: How much does it impact price?
Results:• Selecting an appropriate cooling capacity and configuration (window or
through-the-wall*) are the most important consumer criteria.• Of secondary importance for refrigerators and freezers are energy
efficiency, controls, noise, and brand.• Some controls options, such as a programmable timer or a “sleep mode,”
might help save energy without impacting CEER.
6
* Many buying guides also list portable ACs as an option, but this IMC analysis does not cover portable ACs.

Product Research | DOE TSDThe DOE’s 2011 Technical Support Document for room AC provides information on the likely methods for improving energy efficiency and the estimated manufacturing costs of energy efficiency as of 2011. Manufacturer costs might or might not be passed on to the consumer.
Potential technology pathways: – Improved fan efficiency– Greater heat exchanger surface area– Efficient (possibly variable-speed) compressor
7
Product Class IMC (2009 $)6,000 BTU with louvers $538,000 BTU with louvers $8812,000 BTU with louvers $38
These IMCs are for the most common product classes and indicate the increase in manufacturer price from EL 3 (the current standard level) to EL 5 (the highest efficiency analyzed by DOE).

PART 2: MULTIPLE REGRESSION

Methods | Multiple Regression
9
Hedonic price modelingAssumes: 𝑃𝑃𝑃𝑃𝑃𝑃𝑃𝑃𝑃𝑃 ≈𝑓𝑓(𝐴𝐴𝐴𝐴𝑃𝑃𝑃𝑃𝐴𝐴𝐴𝐴𝐴𝐴𝑃𝑃 1,𝐴𝐴𝐴𝐴𝐴𝐴𝑃𝑃𝑃𝑃𝐴𝐴𝐴𝐴𝐴𝐴𝑃𝑃 2,𝐴𝐴𝐴𝐴𝐴𝐴𝑃𝑃𝑃𝑃𝐴𝐴𝐴𝐴𝐴𝐴𝑃𝑃 3 … )
Controlling for variables using multiple regressionGenerally: 𝑃𝑃𝑃𝑃𝑃𝑃𝑃𝑃𝑃𝑃 =𝛽𝛽0 + 𝛽𝛽1 𝑋𝑋1 + 𝛽𝛽2 𝑋𝑋2 … + 𝛽𝛽𝑝𝑝 𝑋𝑋𝑝𝑝 + 𝜖𝜖 $0
$500
$1,000
$1,500
$2,000
$0 $500 $1,000 $1,500 $2,000
Actu
al P
rice
Predicted Price
Ex. Hedonic Price Model
For example:– Price = Constant + βCap(Capacity) + βwindow(Window) + βESTAR(ESTAR)
– β for ESTAR estimates the effect of ESTAR on price, controlling for room AC capacity and whether the unit is installed in a window
• Estimates coefficient (β) for each variable as well as the 95% confidence interval for that β value

Variable Selection | Prevalence • The web-scraped data do
not include complete feature information for all models, and for some features, information* is more prevalent than for others
• In selecting features to control for, we set a constraint that after adding all features, the regression model would retain at least 75% of the data
Sample Feature Prevalence %Retailer & Brand 100%Cooling Capacity 99%Window/Wall Install 97%ENERGY STAR 84%Color 60%Decibels 34%Smart 30%
*Feature information can be prevalent in a model even if the feature is not present
Is the unit “Smart”?
Online Description?
Is “Smart” Prevalent?
Yes “Wifi-connected” YesYes [Blank] NoNo “Not connected” YesNo [Blank] No

Variable Selection | Multicollinearity
• Analyzed the extent to which each candidate variable was correlated with the other variables
• Which variables should be omitted because they are very collinear with a variable we will include? – Most features were minimally collinear– The possible metrics for energy efficiency (ENERGY STAR labeling,
CEER, annual energy consumption) were very collinear with each other, but ENERGY STAR labeling was the only prevalent energy efficiency metric
– Weight and length/width/height were collinear with cooling capacity
11

Variable Selection • The initial regression model controlled for capacity only, and
statistically-significant features were added if they met the prevalence constraint and improved the metric of adjusted R2
• Features were added according to a sequence determined by buying guide research, with the most important variables added earlier – one significant option was chosen from a set of collinear variables on the basis of adjusted R2
Sample buildup:Model Variables Feature Options Selected FeatureCapacity ESTAR ESTARCapacity, ESTAR Window/Wall Install Window/Wall InstallCapacity, ESTAR, Window/Wall Install
Smart controls None – not prevalent
Capacity, ESTAR, Window/Wall Install
Decibels None – not prevalent
This process continues until all features have been tested.
Initial
…Final Model

Model | Summary Table
Features Controlled Values IncludedCooling Capacity 1,200 – 28,000 BTU per hour
Window/Wall Install Window, Wall, or SliderBrand Frigidaire, Keystone, Friedrich, LG, GE, Amana,
Emerson, Whirlpool, or Other*Retailer Best Buy, Home Depot, Kmart, Lowes, Sears, Target,
Walmart
13
Metric: Labeled (or matched to) ENERGY STARAdjusted R2: 0.7311Data % in Model: 81%
* Brands with less than 50 models captured in the web-scraped data were grouped to avoid overfitting.

PART 3: RESULTS

Results | Summary Table
IMC Estimate - $19IMC 95% Confidence Interval - $38 to $0
No. of Data Points – Room AC Models 1,200
This suggests that consumers do not experience a large cost-based market barrier to purchasing ENERGY STAR room air conditioners.
The results are similar (in a range of -$30 to -$5) if we also control for color, whether the unit has “smart” or programmable controls, how loud the unit is when operating, and/or whether the unit has louvers. These variables are less prevalent in the dataset, and controlling for any of them causes the overall model to retain < 75% of the data collected. None of these variables significantly improve the model’s predictive capability as measured by the adjusted R2 value.
15

Results | Summary Table
≤ 7kBTU ≤ 10 kBTU > 10 kBTUENERGY STAR IMC
Estimate$54 $3 - $50
IMC 95% Confidence Interval
$30 to $78 - $17 to $22 - $84 to - $15
No. of Data Points (% of Bin)
235 (78%) 656 (84%) 544 (84%)
Adjusted R2 0.6432 0.6784 0.6933
Fitting the model to data on subsets of the market across cooling capacity bins, it seems that the IMC might be more likely to impact consumers for small units than for large units.
Retailers and manufacturers might have different marketing strategies for different capacity bins; the market for small-capacity units has more aggressive price competition, and the impact of ENERGY STAR on operating cost (which is a consumer consideration for room ACs) is smaller.
16

APPENDIX

Appendix | Room AC Prices
18
Mean Median Min Max 1Q 3Q Std. Dev.$468 $400 $90 $3154 $273 $580 $301

Appendix | Model Statistics
Residuals:
Residual standard error: 156 on 1180 degrees of freedom (230 observations deleted due to missingness) Multiple R-squared: 0.7354, Adjusted R-squared: 0.7311 F-statistic: 172.6 on 19 and 1180 DF, p-value: < 2.2e-16
19
Min 1Q Median 3Q Max-476 -64 -17 45 1931

Appendix | Model Coefficients
20
Variable Value(Intercept) -8.9839513ENERGY STAR -19.238342Cooling BTU 0.02996019Slider 128.444302Wall 176.302446Window -7.3036827Brand 1 57.4028299Brand 2 10.2406928Brand 3 596.415335Brand 4 64.4835722
Variable ValueBrand 5 89.2490407Brand 6 113.441909Brand 7 33.5072502Brand 8 -2.8436636Retailer 1 41.6954576Retailer 2 57.5981649Retailer 3 12.5652424Retailer 4 74.2570352Retailer 5 26.7279668Retailer 6 9.94190781

Northwest Energy Efficiency Alliance (NEEA) Retail ProductsPortfolio (RPP) Methodology Documentation for Residential Clothes
Washers
Table 1: Report Summary
Product Clothes WashersLast Updated: October 01, 2018Last Revised By: Phi Nguyen, PhD, Energy SolutionsReport Generated: October 02, 2018
1

1. Introduction
This automatically-generated document reports the methodologies and assumptions used to calculate the sales-weighted unit energy consumption (UEC) of residential clothes washers (by product class) for the Northwest EnergyEfficiency Alliance (NEEA) Retail Products Portfolio (RPP, also used interchangeably with ‘Retail Products Platform’)Program[1]. Since NEEA uses these calculated values to track and estimate long-term energy savings, it is importantthat the methodologies and assumptions are well-documented, transparent, and reproducible. This document isgenerated using R Markdown. The values reported in this document are retrieved from the same R source code usedto calculate energy savings and thus reflect the actual values used as of the report generation date. Manual revisionsto this document shall be tracked in Appendix Section A.1
2. Methodology
To calculate the sales-weighted UEC of each clothes washer product category, NEEA performs the following steps:
1. Acquire RPP sales data from RPP data provider (web portal)2. Identify model attributes (product configuration and energy efficiency metric)3. Modify/adjust the efficiency metric for NEEA-specific regional characteristics4. Calculate UEC for each model5. Weight model UECs by sales
The following sub-sections will discuss steps 1 through 4.
2.1 Sales Data
Sales data for the RPP program is managed on http://www.retailproductsplatform.com. NEEA and other program spon-sors have access to only the masked and aggregated data. For the purposes of energy savings calculations, NEEA usesthe sales by model dataset, which contains the brand and model number of each product sold through participatingretailers, and the quantity of units sold for that model in a given month (aggregated by month).
2.2 Model Attributes
In order to determine the energy usage characteristics for each clothes washer model, each model number (for a givenbrand) wasmapped tomodels in the ENERGYSTAR®Qualified Products List[2], U.S. Department of Energy ComplianceCertification Management System[3], and California Energy Commission Modernized Appliance Efficiency Database[4].The table below shows which attributes were used for determining model UEC:
Table 2: Table of Attributes
Attribute Equation Variable Source(s)
Integrated Modified Energy Factor IMEF [2][3][4]Volumetric Capacity (cu. ft.) V olume [2][3][4]Remaining Moisture Content (%) RMC [2][4]DOE Product Class (Configuration) - [2][3][4]
Created by Energy Solutions 2

2.3 Calculations
Unit Energy Consumption (UEC) in kWh per year (kWh/yr) for each clothes washer model was calculated using equa-tions derived from the U.S. Department of Energy (DOE) Test Procedure for Residential Clothes Washers[4]. For clotheswashers, the UEC is calculated as the summation of four components:
UEC = Emachine + Edryer + Estdby + EHW
Emachine, Energy used per year by the mechanical functions of the clothes washerEdryer , Energy used per year by a representative dryer (based on RMC of washer)Estdby , Energy used per year in standby mode by the washerEHW , Energy used per year to heat the water used by the washer (based on water usage of washer)
The four components are all interrelated; they are each components of the clothes washer efficiency metric, the inte-grated modified energy factor (IMEF). Each component is discussed in the subsequent section (a-d).
a. Machine Energy Use:
The machine energy use is the active-mode usage of the clothes washer machine. It is related to the energy used toagitate clothes and drain the drum. The metric is not linearly correlated with the IMEF because of a tradeoff betweenEmachine and Edryer . That is, the more energy used to drain the drum (i.e., through centrifugal force), the less energyis required to dry the clothes, and vice versa. Manufacturers may optimizeEmachine andEdryer to maximize the IMEF.The machine energy use per year is calculated by the following equation:
Emachine,RT F = emachine × cyclesRT F
emachine is the machine energy use per cycle, as used by the RTF (R. Firestone)[6]. It is not a readily available metric.In order to determine this value, DOE conducted product testing, the results of which can be found in U.S. DOETechnical Support Documents[4]. The values used by the RTF (Appendix Table) are based on DOE’s tests, whichvary by configuration (i.e., top- or front-loading) and IMEF bin.
cyclesRT F is the number of wash cycles per year specific to NEEA’s region. A constant value of 311 was identifiedin NEEA’s Clothes Washers Study[7] and is used for all clothes washer models.
b. Dryer Energy Use:
The dryer energy use is included in the UEC for this product because of the tradeoff between Emachine and Edryer .To put in other words, by including this term, NEEA includes in clothes washer UEC the additional energy that would berequired from drying due to an inefficient washer. Manufacturers may optimize Emachine and Edryer to maximize theIMEF. The dryer energy used per year is calculated by the following equation:
Edryer,RT F = (RMCadjusted,RT F − RMCF inal,RT F ) × weightdry,RT F × DEF RT F × fdryer,e
RMCadjusted,RT F is themodel remainingmoisture content, as acquired fromSection 2.3 through databasemapping,that is adjusted to real-world values based on a method submitted to the RTF[6]. The adjustment is linear: A ×RMC + B, where coefficients A and B are 1.247041 and 0.144436 (the slope and intercept), respectively.
RMCF inal,RT F is the final RMC of the model after drying. The RTF has advised NEEA to use the value of 0.04,consistent with a method submitted to the RTF[6].
weightdry,RT F is the total weight (in lbs) of clothes dried per year. The RTF determined this value to be 2342 basedon NEEA’s Clothes Washers Study[7].
Created by Energy Solutions 3

DEF RT F is the dryer efficiency factor (kWh/lb). The RTF determined this value to be 0.66 based on a methodsubmitted to the RTF[6].
fdryer,e is the fraction of electric to gas dryers in NEEA’s region. This factor is to remove the energy consumption usedby gas dryers since NEEA does not count gas savings. When this factor < 1, the UEC should be considered a“net UEC”. The RTF determined this value to be 0.95, which is based on NEEA’s Clothes Washer Study[7].
c. Standby Energy Use:
This standby energy use measures the non-active-mode energy consumption of the washer. Standby power usuallydepends on the features of the washer. For RPP, it is calculated bottom-up by the following equation:
Estdby = Pstdby × hoursstdby
1000Pstdby is the standby power of the washer model, as used by the RTF (R. Firestone)[6]. It is not a readily available
metric. In order to determine this value, DOE conducted product testing, the results of which can be found in U.S.DOE Technical Support Documents[4]. The values used by the RTF (Appendix Table) are based on DOE’s tests,which vary by configuration (i.e., top- or front-loading) and IMEF bin.
hoursstdby is the total annual hours in standby mode, 8465, as determined by U.S. DOE[4].
d. Hot Water Energy Use:
The hot water energy measures the energy required to heat water for clothes washing. The clothes washer itself doesnot typically heat the water; this is left to the home water heater. However, this value is included in the UEC becauseclothes washers determine how much hot water is used. To put in other words, by including this term, NEEA includesin clothes washer UEC the additional energy that would be required to heat additional water due to an water-inefficientwasher. Manufacturers reduce water consumption of washers to maximize the IMEF.
This component of the UEC is calculated differently than the above components (a-c); it uses a top-down approach.That is, it takes the total UEC that would be calculated from DOE values and removes the DOE components Estby ,Edryer,DOE , and Emachine,DOE . What is left is the how water energy use, as would be calculated from DOE values,EHW , which is then adjusted to NEEA values. The hot water energy used per year, as described above, is calculatedby the following equation:
EHW = [(V olume
IMEF×cyclesDOE)−Estby −Edryer,DOE −Emachine,DOE ]×
weightwash,RT F
weightwash,DOE
×fheater,e
V olume is the volumetric capacity, as acquired from Section 2.3 through database mapping, measured in cubic feet.The value is used to calculated total energy use from the IMEF.
IMEF is the model IMEF, as acquired from Section 2.3 through database mapping.cyclesDOE is the number of wash cycles per year assumbed by U.S. DOE[4]. This value is used to determine the
washer UEC as would be calculated by DOE in order to subtract Estby , Edryer,DOE , and Emachine,DOE ,thereby calculating hot water energy use.
Edryer,DOE is the dryer energy use (sub-section b), calculated with DOE assumptions[4] instead of RTF assumptions.For example, the DEF , DUF and weightdry,DOE are used to calculate this value. weightdry,DOE is de-termined by a table in the DOE Test Procedure, which is included for reference in the Appendix of this document.
Emachine,DOE is themachine energy use (sub-section a), calculated with the DOE assumption of 295 for cyclesDOE .The per-cycle machine energy use, emachine is the same for both Emachine,RT F and Emachine,DOE
weightwash,RT F is the total weight (in lbs) of clothes washed per year. This value is different than weightdry,RT F
because NEEA’s Clothes Washers Study[7] found that there are fewer clothes dried than washed (some clothesare hang-dried). The RTF determined this value to be 2505 based on NEEA’s Clothes Washers Study[7].
Created by Energy Solutions 4

weightwash,DOE is the total weight (in lbs) of clothes dried per year, as assumed by U.S. DOE. This is the same asweightwas,DOE and is determined by a table in the DOE Test Procedure, which is included for reference in theAppendix of this document.
fheater,e is the fraction of electric to gas water hears in NEEA’s region. This factor is to remove the energy consumptionused by gas water heaters since NEEA does not count gas savings. When this factor < 1, the UEC should beconsidered a “net UEC”. The RTF determined this value to be 0.59, which is based on RTF feedback (needsreference).
## Warning: package 'bindrcpp' was built under R version 3.4.4
Table 3: Table of Assumptions
Value Source
DOE Wash Cycles Per Year 295 [5]RTF Wash Cycles Per Year 311 [6]DOE Dryer Efficiency Factor (DEF) 0.5 [5]RTF Dryer Efficiency Factor (DEF) 0.66 [6]DOE Dryer Usage Factor (DUF) 0.91 [5]
RTF Dry Load Weight (lbs) 2342 [6]RTF Wash Load Weight (lbs) 2505 [7]DOE Final Remaining Moisture (RMC) 0.04 [5]RTF Final Remaining Moisture (RMC) 0.04 [6]RTF RMC Adjustment Curve Slope 1.247041 [6]
RTF RMC Adjustment Curve Intercept 0.144436 [6]Standby Hours 8465 [5]Fraction Electric Heater 0.59 [6]Fraction Electric Dryer 0.95 [6]
3. Sources
[1] Retail Products Platform Sales Data. http://www.retailproductsplatform.com
[2] ENERGY STAR® Qualified Products List. https://www.energystar.gov/productfinder/
[3] U.S. Department of Energy Compliance Certification Management System. https://www.regulations.doe.gov/certification-data
[4] California Energy Commission Modernized Appliance Efficiency Database. https://cacertappliances.energy.ca.gov
[5] U.S. Department of Energy Technical Support Document for Clothes Washers (2012). https://www.regulations.gov/document?D=EERE-2008-BT-STD-0019-0047
[6] R. Firestone Clothes Washer Calculations for Regional Technical Forum (2017).
[7] NEEA Clothes Washers Study.
Created by Energy Solutions 5

Appendix
A.1. List of Revisions
Date Description Author
October 1, 2018 Original Publication P. Nguyen, Energy Solutions
A.2. R Functions
UEC Calculation Function
CalculateRTFUEC <- function(IMEF = numeric(), Volume = numeric(),RMC = numeric(), Configuration = character(), Adjust_electric = TRUE,drycloth_table = rtf_drycloth_table, constants = washer_constants) {
# constantsDOE_cycles_pyear <- constants["DOE Wash Cycles Per Year"]RTF_cycles_pyear <- constants["RTF Wash Cycles Per Year"]DOE_DEF <- constants["DOE Dryer Efficiency Factor (DEF)"]RTF_DEF <- constants["RTF Dryer Efficiency Factor (DEF)"]DOE_DUF <- constants["DOE Dryer Usage Factor (DUF)"]RTF_dry_pounds <- constants["RTF Dry Load Weight (lbs)"]RTF_wash_pounds <- constants["RTF Wash Load Weight (lbs)"]DOE_RMC_remain <- constants["DOE Final Remaining Moisture (RMC)"]RTF_RMC_remain <- constants["RTF Final Remaining Moisture (RMC)"]RTF_RMC_adjust_slope <- constants["RTF RMC Adjustment Curve Slope"]RTF_RMC_adjust_int <- constants["RTF RMC Adjustment Curve Intercept"]stby_hours <- constants["Standby Hours"]frac_elec_heater <- constants["Fraction Electric Heater"]frac_elec_dryer <- constants["Fraction Electric Dryer"]
# RTF Calculatedif (is.na(Configuration) | is.na(IMEF) | is.na(RMC) | is.na(Volume)) {
standby_power <- NAmachine_pcycle <- NA
} else if ((Configuration == "Standard Top-loading") | (Configuration =="Compact Top-loading")) {if (IMEF < 1.3) {
standby_power <- 0machine_pcycle <- 0.26266667
} else if (IMEF < 1.35) {standby_power <- 2.3machine_pcycle <- 0.08116667
} else if (IMEF < 1.37) {standby_power <- 1.7machine_pcycle <- 0.08116667
} else if (IMEF >= 1.37) {standby_power <- 0.08machine_pcycle <- 0.08116667
Created by Energy Solutions 6

}} else if ((Configuration == "Standard Front-loading") | (Configuration ==
"Compact Front-loading")) {if (IMEF < 1.38) {
standby_power <- 2.3machine_pcycle <- 0.113
} else if (IMEF < 1.41) {standby_power <- 1.7machine_pcycle <- 0.113
} else if (IMEF < 1.5) {standby_power <- 0.08machine_pcycle <- 0.113
} else if (IMEF >= 1.5) {standby_power <- 0.08machine_pcycle <- 0.1606
}} else {
standby_power <- NAmachine_pcycle <- NA
}
# calculationsV <- rtf_drycloth_table["Volume"]LBS <- rtf_drycloth_table["lbs_per_year"]DOE_dry_pounds <- tail(LBS[Volume >= V], n = 1)# tail function just takes the correct value from the tableRMC_adjust <- (RMC * RTF_RMC_adjust_slope) + RTF_RMC_adjust_intDryer_pyear <- (RMC - DOE_RMC_remain) * DOE_DEF * DOE_DUF *
DOE_dry_poundsE_standby <- standby_power * stby_hours/1000E_machine <- machine_pcycle * RTF_cycles_pyearif (Adjust_electric) {
E_dryer <- (RMC_adjust - RTF_RMC_remain) * RTF_dry_pounds *RTF_DEF * frac_elec_dryer
E_HW <- (((Volume/IMEF) * DOE_cycles_pyear) - E_standby -(machine_pcycle * DOE_cycles_pyear) - Dryer_pyear) *(RTF_wash_pounds/DOE_dry_pounds) * frac_elec_heater
} else {E_dryer <- (RMC_adjust - RTF_RMC_remain) * RTF_dry_pounds *
RTF_DEFE_HW <- (((Volume/IMEF) * DOE_cycles_pyear) - E_standby -
(machine_pcycle * DOE_cycles_pyear) - Dryer_pyear) *(RTF_wash_pounds/DOE_dry_pounds)
}
RTF_UEC <- E_standby + E_machine + E_dryer + E_HWreturn(unname(RTF_UEC))
}
Created by Energy Solutions 7

A.3. Reference Tables
Table 5: RTF Assumption for Dryer Clothes Weight (lbs)
Volume lbs_per_year Volume lbs_per_year Volume lbs_per_year Volume lbs_per_year0.0 885.000 1.5 1376.470 3.0 2258.225 4.5 3154.4350.1 885.000 1.6 1434.290 3.1 2316.045 4.6 3212.2550.2 885.000 1.7 1492.110 3.2 2373.865 4.7 3270.0750.3 885.000 1.8 1549.930 3.3 2431.685 4.8 3327.8950.4 885.000 1.9 1607.750 3.4 2489.505 4.9 3385.7150.5 885.000 2.0 1665.570 3.5 2561.780 5.0 3443.5350.6 885.000 2.1 1723.390 3.6 2619.600 5.1 3501.3550.7 885.000 2.2 1781.210 3.7 2677.420 5.2 3559.1750.8 957.275 2.3 1839.030 3.8 2735.240 5.3 3616.9950.9 1015.095 2.4 1896.850 3.9 2793.060 5.4 3674.8151.0 1072.915 2.5 1969.125 4.0 2850.880 5.5 3747.0901.1 1130.735 2.6 2026.945 4.1 2908.700 5.6 3804.9101.2 1188.555 2.7 2084.765 4.2 2966.520 5.7 3862.7301.3 1246.375 2.8 2142.585 4.3 3024.340 5.8 3920.5501.4 1304.195 2.9 2200.405 4.4 3082.160 5.9 3978.370
Table 6: RTF Assumptions for Machine Energy Use
Top-Loaders Front-Loaders
IMEF MachineEnergy Use(kWh/cycle)
StandbyPower (W)
IMEF MachineEnergy Use(kWh/cycle)
StandbyPower (W)
< 1.30 0.2626667 0.00 < 1.38 0.1130 2.301.30 <= x <
1.350.0811667 2.30 1.38 <= x <
1.410.1130 1.70
1.35 <= x <1.37
0.0811667 1.70 1.41 <= x <1.50
0.1130 0.08
>= 1.37 0.0811667 0.08 >= 1.50 0.1606 0.08
Created by Energy Solutions 8

Northwest Energy Efficiency Alliance (NEEA) Retail ProductsPortfolio (RPP) Methodology Documentation for Residential
Refrigerators and Freezers
Table 1: Report Summary
Product Refrigerators and FreezersLast Updated: October 31, 2018Last Revised By: Ari Mytelka, Energy SolutionsReport Generated: November 27, 2018
1

1. Introduction
This automatically-generated document reports the methodologies and assumptions used to calculate the sales-weighted unit energy consumption (UEC) of residential refrigerators and freezers (by product class) for theNorthwest Energy Efficiency Alliance (NEEA) Retail Products Portfolio (RPP, also used interchangeably with ‘RetailProducts Platform’) Program[5]. Since NEEA uses these calculated values to track and estimate long-term energysavings, it is important that the methodologies and assumptions are well-documented, transparent, and reproducible.This document is generated using R Markdown. The values reported in this document are retrieved from the same Rsource code used to calculate energy savings and thus reflect the actual values used as of the report generation date.Manual revisions to this document shall be tracked in Appendix Section A.1
2. Methodology
To calculate the sales-weighted, volume-normalized UEC of each product category and efficiency tier, NEEA performsthe following steps:
1. Acquire RPP sales data from RPP data provider (web portal)2. Identify model attributes (product configuration and energy efficiency metric)3. Modify/adjust the efficiency metric for NEEA-specific regional characteristics4. Calculate UEC for each model5. Weight model UECs by sales6. Normalize for average volume by product class and efficiency tier
The following sub-sections will discuss steps 1 through 4 and 6.
2.1 Sales Data
Sales data for the RPP program is managed on http://www.retailproductsplatform.com. NEEA and other program spon-sors have access to only the masked and aggregated data. For the purposes of energy savings calculations, NEEA usesthe sales by model dataset, which contains the brand and model number of each product sold through participatingretailers, and the quantity of units sold for that model in a given month (aggregated by month).
2.2 Model Attributes
In order to determine the energy usage characteristics for each refrigerator/freezer model, each model number (for agiven brand) was mapped to models in the ENERGY STAR® Qualified Products List[3], U.S. Department of EnergyCompliance Certification Management System[6], and California Energy Commission Modernized Appliance EfficiencyDatabase[1]. If there was conflict between the values reported by the three sources for a given refrigerator model, thevalues listed in the ENERGY STAR® Qualified Products list were used. If a model was not qualified for ENERGYSTAR®, the values listed by the California Energy Commission were used. The table below shows the attributes usedfor determining volume-normalized Unit Energy Consumption (UEC):
Table 2: Table of Attributes
Attribute Equation Variable Source(s)
Adjusted Volume (cu. ft.) AV [1][3][6]Annual Energy Use (kWh/yr) AEC [1][3][6]DOE Product Class - [3][6]U.S. Federal Standard (kWh/yr) FedStd [1][3]
Created by Energy Solutions 2

2.3 Calculations
The volume-normalized UEC in kWh per year (kWh/yr) for each product class and tier was determined using modeldata. Each model’s UEC is reported as the Annual Energy Use (AEC), and the U.S. Department of Energy (DOE) setsa maximum allowed AEC as a function of the adjusted volume and product class of the unit[7]:
FedStd = k ∗ AV + c
FedStd, The DOE’s maximum allowed annual energy consumption in kWh/year
k, The adjusted volume coefficient for allowable energy consumption, see Appendix Section A.3 forvalues by product class
AV , Adjusted volume of the refrigerator or freezer in cubic feet
c, The constant for allowable energy consumption, see Appendix Section A.3 for values by product class
From the AEC and federal standard requirement, the model’s percent less energy use than the federal requirementcan be determined, and then the volume-normalized UEC is calculated by multiplying that value by the average federalstandard maximum AEC for the product class:
UECnorm = (FedStd − AEC
FedStd)tier × FedStdclass
UECnorm, Energy used per year, normalized over the product class and efficiency tier for volume
( F edStd−AECF edStd )tier , Percent less energy used than the standard, averaged over class and tier
FedStdclass, Federal standard maximum allowed energy consumption in kWh/yr, averaged over prod-uct class
The efficiency tier is determined based on qualification for the ENERGY STAR® v5 and ENERGY STAR® Most Effi-cient 2017-2018 measure levels. To qualify for ENERGY STAR® v5, a product must use at most 90% of the federalallowable maximum unless it qualifies under the Connected Product Criteria, in which case an additional 5% allowanceis permitted[2]. To qualify for ENERGY STAR® Most Efficient, an ENERGY STAR® refrigerator (freezers are ineligible)must use less than 637 kWh/year and either have a top-mounted freezer configuration or use at most 85% of the federalallowable maximum[4]. For freezers, units that use at most 85% of the federal requirement are also classified at a higherefficiency tier.
The product class is determined based on the listed product class if a match was found in the DOE Compliance Certi-fication Management System or the ENERGY STAR® Qualified Product List. If no match was found on those lists, theproduct class is determined based on the model attributes described in the California Energy Commission ModernizedAppliance Efficiency Database (see Appendix Section A.2 for the code to classify models from listed attributes).
3. Sources
[1] California Energy Commission Modernized Appliance Efficiency Database. https://cacertappliances.energy.ca.gov
[2] ENERGY STAR® Final Version 5.0 Residential Refrigerators and Freezers Specification. https://www.energystar.gov/sites/default/files/specs//private/ENERGY%20STAR%20Final%20Version%205.0%20Residential%20Refrigerators%20and%20Freezers%20Program%20Requirements.pdf
[3] ENERGY STAR® Qualified Products List. https://www.energystar.gov/productfinder/
[4] Refrigerator-freezers ENERGY STAR® Most Efficient 2018 Final Criteria. https://www.energystar.gov/sites/default/files/Refrigerator-Freezers%20ENERGY%20STAR%20Most%20Efficient%202018%20Final%20Criteria.pdf
Created by Energy Solutions 3
[5] Retail Products Platform Sales Data. http://www.retailproductsplatform.com
[6] U.S. Department of Energy Compliance Certification Management System. https://www.regulations.doe.gov/certification-data
[7] U.S. Department of Energy Direct Final Rule for Residential Refrigerators, Refrigerator-Freezers, and Freezers(2011). https://www.regulations.gov/document?D=EERE-2008-BT-STD-0012-0133
[8] U.S. Department of Energy Technical Support Document for Residential Refrigerators, Refrigerator-Freezers, andFreezers (2011). https://www.regulations.gov/document?D=EERE-2008-BT-STD-0012-0128
Created by Energy Solutions 4

Appendix
A.1. List of Revisions
Date Description Author
October 31, 2018 Original Publication A. Mytelka, Energy Solutions
A.2. R Functions
DOE Product Class Determination Function
for (i in 1:nrow(MASTER_PRODUCT)) {
if (isTRUE(MASTER_PRODUCT[i,"Refrigerator Style"] == "Wine Chiller")) {MASTER_PRODUCT[i,"DOE Product Class (CEC)"] <-
"non-federally-regulated wine chiller"}
# compact unitselse if (isTRUE(MASTER_PRODUCT[i,"Compact Refrigerator"] == "TRUE") |
isTRUE(MASTER_PRODUCT[i,"Total Volume (Cu. Ft.)"] <= 7.75)) {if (isTRUE(MASTER_PRODUCT[i,"Refrigerator Style"] == "Chest Freezer")) {
MASTER_PRODUCT[i,"DOE Product Class (CEC)"] <- "18"} else if (isTRUE(MASTER_PRODUCT[i,"Refrigerator Style"] ==
"Upright Freezer")) {if (isTRUE(MASTER_PRODUCT[i,"Refrigerator Defrost Type"] == "Manual")) {
MASTER_PRODUCT[i,"DOE Product Class (CEC)"] <- "16"} else {
MASTER_PRODUCT[i,"DOE Product Class (CEC)"] <- "17"}
} else if (isTRUE(MASTER_PRODUCT[i,"Refrigerator Style"] =="Internal Freezer")) {
MASTER_PRODUCT[i,"DOE Product Class (CEC)"] <- "11"} else if (isTRUE(MASTER_PRODUCT[i,"Refrigerator Defrost Type"] == "Manual")) {
MASTER_PRODUCT[i,"DOE Product Class (CEC)"] <- "11A"} else if (isTRUE(MASTER_PRODUCT[i,"Refrigerator Defrost Type"] ==
"Partial Automatic")) {MASTER_PRODUCT[i,"DOE Product Class (CEC)"] <- "12"
} else if (isTRUE(MASTER_PRODUCT[i,"Refrigerator Style"] =="Top Freezer w/o Ice thru door") |
isTRUE(MASTER_PRODUCT[i,"Refrigerator Style"] =="Top-Mounted Freezer")) {
if (isTRUE(MASTER_PRODUCT[i,"Automatic Ice Maker"] == "TRUE")) {MASTER_PRODUCT[i,"DOE Product Class (CEC)"] <- "13I"
} else {MASTER_PRODUCT[i,"DOE Product Class (CEC)"] <- "13"
}} else if (isTRUE(MASTER_PRODUCT[i,"Refrigerator Style"] ==
"Side-Mounted Freezer") |isTRUE(MASTER_PRODUCT[i,"Refrigerator Style"] ==
Created by Energy Solutions 5

"Side-by-Side w/o Ice thru door")) {if (isTRUE(MASTER_PRODUCT[i,"Automatic Ice Maker"] == "TRUE")) {
MASTER_PRODUCT[i,"DOE Product Class (CEC)"] <- "14I"} else {
MASTER_PRODUCT[i,"DOE Product Class (CEC)"] <- "14"}
} else if (isTRUE(MASTER_PRODUCT[i,"Refrigerator Style"] =="Bottom-Mounted Freezer") |
isTRUE(MASTER_PRODUCT[i,"Refrigerator Style"] =="Bottom Freezer w/o Ice thru do") |
isTRUE(MASTER_PRODUCT[i,"Refrigerator Style"] =="Bottom Freezer w/o Ice thru door")) {
if (isTRUE(MASTER_PRODUCT[i,"Automatic Ice Maker"] == "TRUE")) {MASTER_PRODUCT[i,"DOE Product Class (CEC)"] <- "15I"
} else {MASTER_PRODUCT[i,"DOE Product Class (CEC)"] <- "15"
}} else {
MASTER_PRODUCT[i,"DOE Product Class (CEC)"] <- "13A"}
}
# standard-size unitselse {
if (isTRUE(MASTER_PRODUCT[i,"Refrigerator Defrost Type"] == "Manual")) {if (isTRUE(MASTER_PRODUCT[i,"Refrigerator Style"] == "All-Refrigerator")){
MASTER_PRODUCT[i,"DOE Product Class (CEC)"] <- " 1A"} else {
MASTER_PRODUCT[i,"DOE Product Class (CEC)"] <- " 1"}
} else if (isTRUE(MASTER_PRODUCT[i,"Refrigerator Defrost Type"] =="Partial Automatic")) {
MASTER_PRODUCT[i,"DOE Product Class (CEC)"] <- " 2"} else if ((isTRUE(MASTER_PRODUCT[i,"Refrigerator Style"] ==
"Bottom-Mounted Freezer") &&isTRUE(MASTER_PRODUCT[i,"Through-The-Door Service"] == "TRUE")) |isTRUE(MASTER_PRODUCT[i,"Refrigerator Style"] ==
"Bottom Freezer w/Ice thru door")) {if (isTRUE(MASTER_PRODUCT[i,"Built-In Refrigerator"] == "TRUE")) {
MASTER_PRODUCT[i,"DOE Product Class (CEC)"] <- " 5A-BI"} else {
MASTER_PRODUCT[i,"DOE Product Class (CEC)"] <- " 5A"}
} else if ((isTRUE(MASTER_PRODUCT[i,"Refrigerator Style"] =="Bottom-Mounted Freezer")
&& !isTRUE(MASTER_PRODUCT[i,"Through-The-Door Service"] == "TRUE"))| isTRUE(MASTER_PRODUCT[i,"Refrigerator Style"] ==
"Bottom Freezer w/o Ice thru do") |isTRUE(MASTER_PRODUCT[i,"Refrigerator Style"] ==
"Bottom Freezer w/o Ice thru door")) {
Created by Energy Solutions 6

if (isTRUE(MASTER_PRODUCT[i,"Automatic Ice Maker"] == "TRUE")) {if (isTRUE(MASTER_PRODUCT[i,"Built-In Refrigerator"] == "TRUE")) {
MASTER_PRODUCT[i,"DOE Product Class (CEC)"] <- " 5I-BI"} else {
MASTER_PRODUCT[i,"DOE Product Class (CEC)"] <- " 5I"}
} else {if (isTRUE(MASTER_PRODUCT[i,"Built-In Refrigerator"] == "TRUE")) {
MASTER_PRODUCT[i,"DOE Product Class (CEC)"] <- " 5-BI"} else {
MASTER_PRODUCT[i,"DOE Product Class (CEC)"] <- " 5"}
}} else if ((isTRUE(MASTER_PRODUCT[i,"Refrigerator Style"] ==
"Side-Mounted Freezer") &&isTRUE(MASTER_PRODUCT[i,"Through-The-Door Service"] == "TRUE")) |isTRUE(MASTER_PRODUCT[i,"Refrigerator Style"] ==
"Side-by-Side w/Ice thru door")) {if (isTRUE(MASTER_PRODUCT[i,"Built-In Refrigerator"] == "TRUE")) {
MASTER_PRODUCT[i,"DOE Product Class (CEC)"] <- " 7-BI"} else {
MASTER_PRODUCT[i,"DOE Product Class (CEC)"] <- " 7"}
} else if ((isTRUE(MASTER_PRODUCT[i,"Refrigerator Style"] =="Side-Mounted Freezer") &&
!isTRUE(MASTER_PRODUCT[i,"Through-The-Door Service"] == "TRUE")) |isTRUE(MASTER_PRODUCT[i,"Refrigerator Style"] ==
"Side-by-Side w/o Ice thru door")) {if (isTRUE(MASTER_PRODUCT[i,"Automatic Ice Maker"] == "TRUE")) {
if (isTRUE(MASTER_PRODUCT[i,"Built-In Refrigerator"] == "TRUE")) {MASTER_PRODUCT[i,"DOE Product Class (CEC)"] <- " 4I-BI"
} else {MASTER_PRODUCT[i,"DOE Product Class (CEC)"] <- " 4I"
}} else {
if (isTRUE(MASTER_PRODUCT[i,"Built-In Refrigerator"] == "TRUE")) {MASTER_PRODUCT[i,"DOE Product Class (CEC)"] <- " 4-BI"
} else {MASTER_PRODUCT[i,"DOE Product Class (CEC)"] <- " 4"
}}
} else if (isTRUE(MASTER_PRODUCT[i,"Refrigerator Style"] =="Top-Mounted Freezer") &&
isTRUE(MASTER_PRODUCT[i,"Through-The-Door Service"] == "TRUE")) {MASTER_PRODUCT[i,"DOE Product Class (CEC)"] <- " 6"
} else if ((isTRUE(MASTER_PRODUCT[i,"Refrigerator Style"] =="Top-Mounted Freezer") &&
!isTRUE(MASTER_PRODUCT[i,"Through-The-Door Service"] == "TRUE")) |isTRUE(MASTER_PRODUCT[i,"Refrigerator Style"] ==
"Top Freezer w/o Ice thru door")) {
Created by Energy Solutions 7

if (isTRUE(MASTER_PRODUCT[i,"Automatic Ice Maker"] == "TRUE")) {if (isTRUE(MASTER_PRODUCT[i,"Built-In Refrigerator"] == "TRUE")) {
MASTER_PRODUCT[i,"DOE Product Class (CEC)"] <- " 3I-BI"} else {
MASTER_PRODUCT[i,"DOE Product Class (CEC)"] <- " 3I"}
} else {if (isTRUE(MASTER_PRODUCT[i,"Built-In Refrigerator"] == "TRUE")) {
MASTER_PRODUCT[i,"DOE Product Class (CEC)"] <- " 3-BI"} else {
MASTER_PRODUCT[i,"DOE Product Class (CEC)"] <- " 3"}
}} else if (isTRUE(MASTER_PRODUCT[i,"Refrigerator Style"] ==
"Upright Freezer")) {if (isTRUE(MASTER_PRODUCT[i,"Refrigerator Defrost Type"] == "Manual")) {
MASTER_PRODUCT[i,"DOE Product Class (CEC)"] <- " 8"} else {
if (isTRUE(MASTER_PRODUCT[i,"Automatic Ice Maker"] == "TRUE")) {if (isTRUE(MASTER_PRODUCT[i,"Built-In Refrigerator"] == "TRUE")) {
MASTER_PRODUCT[i,"DOE Product Class (CEC)"] <- " 9I-BI"} else {
MASTER_PRODUCT[i,"DOE Product Class (CEC)"] <- " 9I"}
} else {if (isTRUE(MASTER_PRODUCT[i,"Built-In Refrigerator"] == "TRUE")) {
MASTER_PRODUCT[i,"DOE Product Class (CEC)"] <- " 9-BI"} else {
MASTER_PRODUCT[i,"DOE Product Class (CEC)"] <- " 9"}
}}
} else if (isTRUE(MASTER_PRODUCT[i,"Refrigerator Style"] == "Chest Freezer")) {if (isTRUE(MASTER_PRODUCT[i,"Refrigerator Defrost Type"] == "Automatic")) {
MASTER_PRODUCT[i,"DOE Product Class (CEC)"] <- "10A"} else {
MASTER_PRODUCT[i,"DOE Product Class (CEC)"] <- "10"}
} else if (!is.na(MASTER_PRODUCT[i,"Refrigerator Style"])) {if (isTRUE(MASTER_PRODUCT[i,"Built-In Refrigerator"] == "TRUE")) {
MASTER_PRODUCT[i,"DOE Product Class (CEC)"] <- " 3A-BI"} else {
MASTER_PRODUCT[i,"DOE Product Class (CEC)"] <- " 3A"}
}}
}
A.3. Reference Tables
Created by Energy Solutions 8

Table 4: U.S. DOE Coefficients for the Federal Standard Requirement by Product Class
DOE ProductClass
AV Coefficient EquationConstant
1 7.99 2251A 6.79 193.62 7.99 2253 8.07 233.7
3-BI 9.15 264.9
3I 8.07 317.73I-BI 9.15 348.93A 7.07 201.6
3A-BI 8.02 228.54 8.51 297.8
4-BI 10.22 357.44I 8.51 381.8
4I-BI 10.22 441.45 8.85 317
5-BI 9.4 336.9
5I 8.85 4015I-BI 9.4 420.95A 9.25 475.4
5A-BI 9.83 499.96 8.4 385.4
7 8.54 432.87-BI 10.25 502.68 5.57 193.79 8.62 228.39I 8.62 312.3
9-BI 9.86 260.99I-BI 9.86 344.910 7.29 107.810A 10.24 148.111 9.03 252.3
11A 7.84 219.112 5.91 335.813 11.8 339.213I 11.8 423.213A 9.17 259.3
14 6.82 456.914I 6.82 540.915 11.8 339.215I 11.8 423.216 8.65 225.7
17 10.17 351.918 9.25 136.8
Created by Energy Solutions 9

Northwest Energy Efficiency Alliance (NEEA) Retail ProductsPortfolio (RPP) Methodology Documentation for Room Air
Conditioners
Table 1: Report Summary
Product Room Air ConditionersLast Updated: July 16, 2019Last Revised By: Ari Mytelka, Energy SolutionsReport Generated: July 16, 2019
1

1. Introduction
This automatically-generated document reports the methodologies and assumptions used to calculate the sales-weighted unit energy consumption (UEC) of room air conditioners (by product class) for the Northwest EnergyEfficiency Alliance (NEEA) Retail Products Portfolio (RPP, also used interchangeably with ‘Retail Products Platform’)Program[4]. Since NEEA uses these calculated values to track and estimate long-term energy savings, it is importantthat the methodologies and assumptions are well-documented, transparent, and reproducible. This document isgenerated using R Markdown. The values reported in this document are retrieved from the same R source code usedto calculate energy savings and thus reflect the actual values used as of the report generation date. Manual revisionsto this document shall be tracked in Appendix Section A.1.
2. Methodology
To calculate the sales-weighted UEC of each product category and efficiency tier, NEEA performs the following steps:
1. Acquire RPP sales data from RPP data provider (web portal)2. Identify model attributes (product features and energy efficiency metric)3. Modify/adjust the efficiency metric for NEEA-specific regional characteristics4. Calculate UEC for each model5. Weight model UECs by sales
The following sub-sections will discuss steps 1 through 4.
2.1 Sales Data
Sales data for the RPP program is managed on http://www.retailproductsplatform.com.[4] NEEA and other programsponsors have access to only the masked and aggregated data. For the purposes of energy savings calculations,NEEA uses the sales by model dataset, which contains the brand and model number of each product sold throughparticipating retailers, and the quantity of units sold for that model in a given month (aggregated by month).
2.2 Model Attributes
In order to determine the energy usage characteristics for each room AC model, each model number (for a givenbrand) was mapped to models in the ENERGY STAR Qualified Products List,[3] U.S. Department of Energy ComplianceCertification Management System,[7] and California Energy CommissionModernized Appliance Efficiency Database.[1] Ifthere was conflict between the values reported by the three sources for a given model, the values listed in the ENERGYSTAR Qualified Products list were used. If a model was not qualified for ENERGY STAR, the values listed by theCalifornia Energy Commission were used. The table below shows the attributes used for determining Unit EnergyConsumption (UEC):
Table 2: Table of Attributes
Attribute Equation Variable Source(s)
On-Mode Power (W) OP [1][3][7]Standby-Mode Power (W) SP [1][3]
Created by Energy Solutions 2

Attribute Equation Variable Source(s)
DOE Product Class - [3][7]
2.3 Calculations
Operation of room ACs is climate-dependent, so the UEC calculation incorporates information on the distribution of roomAC shipments and the average number of cooling degree days (CDD) across three cooling zones in the NEEA region.The ICF data portal details annual sales by cooling zone,[5] and the average CDD by cooling zone are determined byweighting the average CDD for each zone by ICF’s reported sales for that zone. The hourly average CDD for each zoneis taken from the Regional Technical Forum’s calculated values.[8]
For determining the on-mode operating hours in each cooling zone, a standard civil engineering equation relates thecooling effective full-load hours (assumed to be equivalent to the room AC operating hours) to the CDD:
EFLHzone = 31% × CDD × 24Td − 65
EFLHzone, Equivalent full-load hours, the annual on-mode operating hours of a typical room AC unit
CDD, The shipment-weighted average cooling degree days for the cooling zone
Td, The outdoor design temperature - the maximum hourly temperature after eliminating the hottest 1%of hours in a year, assumed to be 90 degrees Fahrenheit for all three cooling zones after on consideringtypical temperatures in Idaho, Montana, Oregon, and Washington
The constant 31% is a conversion factor to account for the fact that room ACs have reduced EFLHrelative to central AC because room AC units are typically only used while the room is occupied,[6] theconstant 24 refers to the number of hours per day, and the constant 65 is the standard assumed setpointtemperature in Fahrenheit.
After determining the average operating hours for each cooling zone, the following equation was used to calculate theaverage UEC by cooling zone:
UECzone = OP × EFLHzone + SP × (8766 − EFLHzone)
UECzone, The average UEC for a room AC unit in the given cooling zone
OP , The sales-weighted average on-mode power for the product class
EFLHzone, Equivalent full-load hours, the annual on-mode operating hours of a typical room AC unit
SP , The sales-weighted average standby-mode power for the product class
The constant 8766 refers to the number of hours per year, accounting for leap years.
Finally, the weighted average UEC across NEEA regions is calculated using weights of the total ICF-reported sales foreach cooling zone.
The efficiency tier is determined based on qualification for the ENERGY STAR v4 measure level.[2] Qualification for thismeasure level is determined based on product class and the combined energy efficiency ratio (CEER), see AppendixSection A.3 for a table listing the minimum required CEER for each product class.
The product class is determined based on the listed product class if a match was found in the DOE Compliance Certi-fication Management System or the ENERGY STAR Qualified Product List. If no match was found on those lists, theproduct class is determined based on the model attributes described in the California Energy Commission ModernizedAppliance Efficiency Database (see Appendix Section A.2 for the code to classify models from listed attributes).
Created by Energy Solutions 3

3. Sources
[1] California Energy Commission Modernized Appliance Efficiency Database. https://cacertappliances.energy.ca.gov
[2] ENERGY STAR Final Version 4.1 Residential Room Air Conditioners Specification. https://www.energystar.gov/sites/default/files/asset/document/ENERGY%20STAR%20Version%204.1%20Room%20Air%20Conditioners%20Specification.pdf
[3] ENERGY STAR Qualified Products List. https://www.energystar.gov/productfinder/
[4] ICF. January 2019. Program Sponsor Portal-NEEA. Sales By Model. 2015-2018 Total Sales Airconditioners. http://www.retailproductsplatform.com
[5] ICF. January 2019. Program Sponsor Portal-NEEA. Sales By Cooling Zone. 2018 Total Sales Airconditioners.http://www.retailproductsplatform.com
[6] IL TRM. February 8th, 2017. Illinois Statewide Technical Reference Manual – Volume 3: Residential Measures. Fullload hours for room AC is significantly lower than for central AC. The average ratio of FLH for Room AC (provided in RLWReport: Final Report Coincidence Factor Study Residential Room Air Conditioners, June 23, 2008) to FLH for CentralCooling for the same location (provided by AHRI: http://www.energystar.gov/ia/business/bulk_purchasing/bpsavings_calc/Calc_CAC.xls) is 31%.
[7] U.S. Department of Energy Compliance Certification Management System. https://www.regulations.doe.gov/certification-data
[8] Regional Technical Forum. 2019. RTF_ClimateZoneCalculations_v1_2.xlsx. NOAA Site Daily CDD weighted byHouseholds. https://rtf.nwcouncil.org/work-products/supporting-documents/climate-zones
Created by Energy Solutions 4

Appendix
A.1. List of Revisions
Date Description Author
December 31, 2018 Original Publication A. Mytelka, Energy SolutionsJanuary 2, 2019 Added RTF CDD Source A. Mytelka, Energy SolutionsFebruary 12, 2019 Edited CDD and Cooling Zone Sources A. Mytelka, Energy SolutionsJune 14, 2019 Removed out-of-date reference to AHAM A. Mytelka, Energy SolutionsJune 19, 2019 Added factor to convert CAC EFLH to RAC
EFLHA. Mytelka, Energy Solutions
July 16, 2019 Replaced indirect reference to IL TRMsource with direct reference
A. Mytelka, Energy Solutions
A.2. R Functions
DOE Product Class Determination Function
for (i in 1:nrow(MASTER_PRODUCT)) {
if (isTRUE(MASTER_PRODUCT[i, "Room.AC.Type"] == "Casement-Slider Room Air Condi")) {MASTER_PRODUCT[i,"Determined DOE Product Class (CEC)"] = "16"
} else {
if (isTRUE(MASTER_PRODUCT[i, "Heating.Capable"] == "Heat Pump Only")) {if (isTRUE(MASTER_PRODUCT[i, "Louvers."] %in% c("TRUE", "True", "true"))) {
if(isTRUE(MASTER_PRODUCT[i, "Cooling Capacity (BTU/h)"] < 20000)) {MASTER_PRODUCT[i,"Determined DOE Product Class (CEC)"] = "11"
} else if(isTRUE(MASTER_PRODUCT[i, "Cooling Capacity (BTU/h)"] > 20000)) {MASTER_PRODUCT[i,"Determined DOE Product Class (CEC)"] = "13"
}
} else if (isTRUE(MASTER_PRODUCT[i, "Louvers."] == "False")) {if(isTRUE(MASTER_PRODUCT[i, "Cooling Capacity (BTU/h)"] < 14000)) {
MASTER_PRODUCT[i,"Determined DOE Product Class (CEC)"] = "12"} else if(isTRUE(MASTER_PRODUCT[i, "Cooling Capacity (BTU/h)"] > 14000)) {
MASTER_PRODUCT[i,"Determined DOE Product Class (CEC)"] = "14"}
}} else {
if (MASTER_PRODUCT[i, "Louvers."] %in% c("TRUE", "True", "true")) {if(isTRUE(MASTER_PRODUCT[i, "Cooling Capacity (BTU/h)"] < 6000)) {
MASTER_PRODUCT[i,"Determined DOE Product Class (CEC)"] = "1"} else if(isTRUE(MASTER_PRODUCT[i, "Cooling Capacity (BTU/h)"] < 7999)) {
MASTER_PRODUCT[i,"Determined DOE Product Class (CEC)"] = "2"} else if(isTRUE(MASTER_PRODUCT[i, "Cooling Capacity (BTU/h)"] < 10000)) {
MASTER_PRODUCT[i,"Determined DOE Product Class (CEC)"] = "3a"} else if(isTRUE(MASTER_PRODUCT[i, "Cooling Capacity (BTU/h)"] < 13999)) {
MASTER_PRODUCT[i,"Determined DOE Product Class (CEC)"] = "3b"
Created by Energy Solutions 5

} else if(isTRUE(MASTER_PRODUCT[i, "Cooling Capacity (BTU/h)"] < 19999)) {MASTER_PRODUCT[i,"Determined DOE Product Class (CEC)"] = "4"
} else if(isTRUE(MASTER_PRODUCT[i, "Cooling Capacity (BTU/h)"] < 27999)) {MASTER_PRODUCT[i,"Determined DOE Product Class (CEC)"] = "5a"
} else if(isTRUE(MASTER_PRODUCT[i, "Cooling Capacity (BTU/h)"] > 27999)) {MASTER_PRODUCT[i,"Determined DOE Product Class (CEC)"] = "5b"
}
} else if (isTRUE(MASTER_PRODUCT[i, "Louvers."] == "False")) {if(isTRUE(MASTER_PRODUCT[i, "Cooling Capacity (BTU/h)"] < 6000)) {
MASTER_PRODUCT[i,"Determined DOE Product Class (CEC)"] = "6"} else if(isTRUE(MASTER_PRODUCT[i, "Cooling Capacity (BTU/h)"] < 7999)) {
MASTER_PRODUCT[i,"Determined DOE Product Class (CEC)"] = "7"} else if(isTRUE(MASTER_PRODUCT[i, "Cooling Capacity (BTU/h)"] < 10999)) {
MASTER_PRODUCT[i,"Determined DOE Product Class (CEC)"] = "8a"} else if(isTRUE(MASTER_PRODUCT[i, "Cooling Capacity (BTU/h)"] < 13999)) {
MASTER_PRODUCT[i,"Determined DOE Product Class (CEC)"] = "8b"} else if(isTRUE(MASTER_PRODUCT[i, "Cooling Capacity (BTU/h)"] < 19999)) {
MASTER_PRODUCT[i,"Determined DOE Product Class (CEC)"] = "9"} else if(isTRUE(MASTER_PRODUCT[i, "Cooling Capacity (BTU/h)"] > 19999)) {
MASTER_PRODUCT[i,"Determined DOE Product Class (CEC)"] = "10"}
}}
}}
A.3. Reference Tables
Table 4: ENERGY STAR CEER by Product Class
DOE Product Class Minimum ENERGY STARCEER
1 12.12 12.13 124 11.85a 10.3
5b 9.96 117 118a 10.68b 10.5
9 10.210 10.311 10.812 10.213 10.2
Created by Energy Solutions 6

14 9.615 11.416 11.4
Created by Energy Solutions 7

2016 PG&E RETAIL PRODUCTS PLATFORM (RPP) AIR CLEANER LAB RESEARCH RESULTS
December 30, 2016
1
M E M O
To: PG&E From: Andrea Salazar, EMI Consulting Date: December 30, 2016 RE: 2016 PG&E Retail Products Platform (RPP) – Air Cleaner Laboratory Research Results
Introduction The Pacific Gas and Electric Company (PG&E) submitted a workpaper for the Retail Products Platform (RPP) Program in December 2015. In its workpaper disposition the California Public Utilities Commission – Energy Division (CPUC-ED) identified the need for further research to support the unit energy savings (UES) values for room air cleaners.1 Resultantly, PG&E is currently conducting two distinct but related research efforts on room air cleaners:
1. Lab testing of non-ENERGY STAR air cleaners to measure power draw and efficiency and determine if any models meet ENERGY STAR criteria. In this research effort, PG&E has partnered with Intertek, an EPA-certified third-party test lab, to test and meter room air cleaner models that are not ENERGY STAR certified.
2. Surveys to determine hours of use (HOU) and coincident demand factor (CDF) for air cleaners. For this effort, PG&E and EMI Consulting are conducting a survey of PG&E residential customers to derive more accurate and reliable HOU and CDF estimates.
This memo only summarizes the results of the first effort (lab testing). The lab testing is being conducted because commission staff were concerned about the lack of data to support the assumption that non-ENERGY STAR models of products included in the RPP program (such as soundbars, air cleaners, and freezers) do not meet ENERGY STAR specification requirements. Staff stated that there needs to be evidence that non-ENERGY STAR products do, in fact, use more energy than ENERGY STAR products. In other words, a product that is not ENERGY STAR certified does not, by default, consume more energy than an ENERGY STAR product. It may be, for example, that ENERGY STAR certification was too costly for the manufacturer, but that the product meets ENERGY STAR requirements nonetheless. The RPP program incents a portfolio of ENERGY STAR certified products that are sold by retailers to residential customers. Some of these products have federal energy efficiency regulations in place, and all such models are required to be tested to show compliance with federal standards. However, certain plug load devices such as soundbars and air cleaners are not federally regulated, so test data is only available 1 In its disposition letter, the CPUC-ED also requested additional research on clothes dryers, soundbars, and research into product-specific market barriers preventing increased adoption of RPP measures. This memo only covers air cleaner research.

Memorandum METHODOLOGY AIR CLEANERS
2
for ENERGY STAR certified models. With limited data available for non-ENERGY STAR certified models, it is difficult to determine whether those models that have not been tested via the certification process have efficiencies below ENERGY STAR specifications. In the research described here, PG&E identified models of non-ENERGY STAR certified air cleaners with high market share and tested them using the applicable ENERGY STAR test protocol. The testing provided key parameters such as power draw and determined whether the selected models meet ENERGY STAR requirements.
Research Questions/Objectives This purpose of this research was to answer the questions:
• What is the power draw of non-ENERGY STAR certified air cleaners? • Is the power draw for non-ENERGY STAR models substantially higher than ENERGY STAR
certified models? • Are there models of air cleaners that have not been ENERGY STAR certified, but would meet
ENERGY STAR specifications if they were tested?
Summary of Key Findings • Average active mode power draw of the non-ENERGY STAR models tested is 39.7 W (there is
no active mode power draw requirement in the ENERGY STAR specification). • Average standby mode power draw of the non-ENERGY STAR models tested is 4.1 W
(ENERGY STAR maximum is 2 W). • Average efficiency (for dust) is 1.7 CADR/W (ENERGY STAR minimum is 50 CADR). • Seven of the thirteen models tested produce less than 50 CADR and would not be considered
under the ENERGY STAR specification. • One of the thirteen models tested meets the ENERGY STAR specification requirements. • When operating at modes other than the maximum fan setting, the average “low” setting power
draw is 59% of the “high” setting power draw and the average “medium” setting power draw is 63% of the “high” setting power draw.
Research Approach PG&E contracted Intertek, an EPA-certified third-party test lab, to test and meter models selected by PG&E using the methodology discussed below.
Model Selection
Under contract with PG&E, Energy Solutions identified top-selling air cleaner models (both ENERGY STAR and non-ENERGY STAR) by reviewing major retail websites and sorting the products using the “best-selling” sorting option. Each model was then determined to be ENERGY STAR certified or non-ENERGY STAR based by matching its model number to the ENERGY STAR Qualified Products list. This generated a ranked list of top selling non-ENERGY STAR models for each retailer. At the time of air cleaner model selection, retailers had not yet provided RPP program administrators with sales data for non-ENERGY STAR models of products included in the program. Therefore, to determine the relative market share of each non-ENERGY STAR model, Energy Solutions plotted model rank by

Memorandum METHODOLOGY AIR CLEANERS
3
retailer website and total retailer sales for ENERGY STAR models to create a regression equation that was used to estimate sales of non-ENERGY STAR models based on website rank (Figure 1).
Figure 1. Example curve fitting of RPP-reported air cleaner sales by top-selling rank
Based on these regression equations, Energy Solutions interpolated the sales of non-ENERGY STAR products based on their website rank, and created a list of non-ENERGY STAR models and their estimated sales volume. From this overall list of non-ENERGY STAR products, Energy Solutions created a shortlist of products comprised of top-selling models with good representation across a variety of manufacturers, retail channels, and product capabilities. The final list of models tested is shown in Table 1.
Table 1: Non-ENERGY STAR Air Cleaners Selected for Testing
MODELA RPP RETAILER NON-ENERGY STAR MARKET SHAREB
NUMBER OF UNITS SOLD SALES VOLUME RANKC % OF SALES
2 271 1st 38.0%
5 200 2nd 28.1%
12 31 3rd 10.8%D
4 20 6th 2.8%
7 8 8th 1.1%
6 3 9th 0.4%
8 3 9th 0.4%
11 1 11th 0.1%
13 1 11th 0.1%
1 0 NA 0.0%
3 0 NA 0.0%
9 0 NA 0.0%
10 0 NA 0.0%
A Manufacturer/model information is confidential, but can be provided if requested to the CPUC-ED and/or other utility partners on an as needed basis. B Market share is based on RPP retailer sales data from January 2015 – November 2016 from the ICF database. C Out of 34 different non-ENERGY STAR models that are sold by RPP retailers D Here we have included additional models numbers that only differ by color.
0 10 20 30 40 50 60
Sale
s
Top-Selling Rank
Air Cleaner Sales by Top-Selling Rank for an RPP Retailer

Memorandum METHODOLOGY AIR CLEANERS
4
Using the RPP retailer sales data that has since become available, we determined that this list of models represents roughly 82% of non-ENERGY STAR air cleaner market sales.2 The top three selling models (all of which were tested) represent 77% of non-ENERGY STAR sales. The top ten selling models (seven of which were tested) represent 96% of non-ENERGY STAR sales.
Model Testing
Each model was lab tested in accordance with the test method outlined in the ENERGY STAR Program Requirements Product Specification for Room Air Cleaners.3 The following characteristics were collected from manufacturer specifications for each model:
• Manufacturer and model number • Clean air delivery rate (CADR) for dust, tobacco smoke, and pollen if available
The following data were collected through the testing process: • Dust-free air delivery rate (cfm) tested under ANSI/AHAM AC-1-2015 • Active mode power consumption • Standby mode power consumption • Efficiency in CADR/W (dust) • Power consumption at multiple fan settings
Research Results
ENERGY STAR Testing
ENERGY STAR test results are shown in the table below.
2 We have removed from the dataset models that do not conform with the ENERGY STAR definition of air cleaner, namely, those models whose primary function is something other than removing particulate matter from the air (i.e. killing bacteria, viruses, and other microorganisms) and those models with a secondary function (i.e. heating, cooling, humidifying, dehumidifying) 3 https://www.energystar.gov/index.cfm?c=archives.air_cleaners

Memorandum METHODOLOGY AIR CLEANERS
5
Table 2: Non-ENERGY STAR Air/ Cleaner Lab Testing Results
Modela Dust-Free Clean Air Delivery Rate
(CADR, in cfm) Dust Efficiency
(CADR/W) Active Mode Power
(W) Standby Mode Power
(W)
1 -1.62b -0.2b 10.8 0
2 72.2 1.3 56.4 0.1
3 -1.9 b -1.9 b 49.8 45.7
4 68.5 1.3 52.7 0.1
5 60.9 1.6 38.3 0
6 153.6 6.7 22.8 0.4
7 95.7 1.2 83.2 0
8 126.2 2.3 55.7 2.3
9 49.8 1.5 34.3 0
10 3.5 0.1 59.1 2.8
11 49 1.4 35.1 0
12 25.6 3.3 7.8 0.5
13 36.3 3.7 9.6 1.2
a Manufacturer/model information is confidential, but can be provided if requested to the CPUC-ED and/or other utility partners on an as needed basis. b A negative CADR and CADR/W (resulting from the negative CADR) means that the natural decay rate (with the unit off) of the pollutant particles that are injected into the air during the test procedure is faster than the decay rate with the unit on. In more practical terms, the units with negative CADR values don’t have fans and therefore don’t move air. CADR is measured in cubic feet per minute (cfm), and a unit that doesn’t have a fan will not have a meaningful cfm measurement. Units with negative CADR and CADR/W values are not effective at removing particulate matter from the air. However, these units may function perfectly well as air deodorizers and/or may effectively kill microorganisms such as bacteria, viruses, and mold using high heat or UV light. These two units have been removed from the analysis that follows as they don’t conform to the ENERGY STAR definition of air cleaner. No sales of these units were found in the ICF RPP database. The ENERGY STAR specification requires that air cleaners produce a minimum of 50 CADR, have an efficiency of at least 2 CADR/W and a standby power draw of no more than 2 W. Only one model tested (Model 6) meets all these criteria. This model represents only 0.4% of non-ENERGY STAR sales at RPP retailers. Three other models had efficiencies of at least 2 CADR/W (Models 8, 12, and 13) but either did not produce the minimum 50 CADR (Models 12 and 13) or exceeded the maximum standby power draw (model 8). In addition, eight models (Models 1, 2, 4, 5, 6, 7, 9, and 11) had a standby power draw of less than 2 W, but either did not produce the minimum 50 CADR (Model 1) and/or didn’t meet the minimum efficiency requirement (Models 2, 4, 5, 7, 9, and 11).

Memorandum METHODOLOGY AIR CLEANERS
6
As shown in Figure 1 below, the models tested had CADRs (for dust) ranging from 3.5 to 153.6, and an average CADR of 67.4.
Figure 1. CADR (for dust) by Model Tested

Memorandum METHODOLOGY AIR CLEANERS
7
Figure 2 shows that the models had efficiencies (for dust) ranging from 0.1 to 6.7 CADR/W and an average efficiency of 2.2 CADR/W.
Figure 2. Efficiency (for dust) by Model Tested

Memorandum METHODOLOGY AIR CLEANERS
8
Figure 3 shows that the models tested had active mode power draw ranging from 7.8 to 83.2 W and an average active mode power draw of 41.4 W
Figure 3. Active Mode Power Draw by Model Tested

Memorandum METHODOLOGY AIR CLEANERS
9
Figure 4 shows that the models tested had standby power draw ranging from 0 to 2.8 W, and an average standby power draw of 0.7 W.
Figure 4. Standby Mode Power Draw by Model Tested
Power Draw by Fan Speed Testing
Table 3 shows the results of power draw readings for up to 5 available fan speed settings for each model. The last two columns show the estimated “low” and “medium” speed power draws as a percentage of the power draw at the highest speed setting. Models with only one speed setting (1, 3, and 12) are excluded from the analysis. Models with two speed settings have no attributable “medium” speed setting. For models with more than 3 speed settings, the “medium” setting is taken as the average of all settings between the highest and lowest settings.

Memorandum METHODOLOGY AIR CLEANERS
10
Table 3: Power Draw at by Fan Speed Setting and Model Tested
Model Power Draw (W) % of Power Draw at High Fan Speed
Fan Speed 1 Fan Speed 2 Fan Speed 3 Fan Speed 4 Fan Speed 5 Fan Setting Low Fan Setting Medium
1 10.8 N/A N/A
2 3.2 5.3 10.3 20.7 42.8 7% 28%
3 49.8 N/A N/A
4 3 5.1 9.8 19.4 40 8% 29%
5 26.2 30.4 86% N/A
6 5.5 9.5 14.9 37% 64%
7 51.5 64 80% N/A
8 23.9 27.2 35.2 45.5 53% 69%
9 20.4 24.3 84% N/A
10 46.8 51 55.7 58.3 80% 92%
11 9.2 17.8 52% N/A
12 2.7 N/A N/A
13 9.9 10 9.8 100% 100%
Average 59% 63%
Impact of Results on RPP Workpaper In the RPP workpaper, the unit energy consumption of room air cleaners is calculated using Equation 1 and Equation 2.
Equation 1
𝑈𝑈𝑈𝑈𝑈𝑈 =𝑃𝑃𝐴𝐴 ∗ 𝑇𝑇𝐴𝐴 + 𝑃𝑃𝑆𝑆 ∗ 𝑇𝑇𝑆𝑆1000 𝑊𝑊ℎ
𝑘𝑘𝑊𝑊ℎ�
Equation 2
𝑃𝑃𝐴𝐴 =𝑈𝑈𝐶𝐶𝐶𝐶𝑈𝑈𝐸𝐸𝐸𝐸
Where
UEC = unit energy consumption in kWh PA = power draw in active mode in watts TA = number of hours per year spent in active mode PS = power draw in standby mode in watts TS = number of hours per year spent in standby mode Cap = capacity of air cleaner in CADR Eff = efficiency of air cleaner in CADR/W 1000 = conversion factor to change from watt-hours to kilowatt-hours.

Memorandum METHODOLOGY AIR CLEANERS
11
The efficiency of base-case models was assumed to be 1.0 CADR/Watt. The efficiency of basic tier (ENERGY STAR) program-qualified models is 2.0 CADR/Watt, and the efficiency of advanced tier (ENERGY STAR +30%) program-qualified models is 2.6 CADR/Watt. Standby mode power draw was assumed to be 1.0 watt for base-case models, 0.6 watts for basic tier (ENERGY STAR) program-qualified models, and 0.5 watts for advanced tier (ENERGY STAR + 30%) program-qualified models. Based on the results of this research, we believe the assumption for the base-case efficiency should be increased from 1 CADR/W to 2.2 CADR/W (the average of all the non-ENERGY STAR models tested excluding the two units with negative CADR ratings). In addition, the assumption for the base-case standby power draw should be decreased from 1 W to 0.7 W (the average of all the non-ENERGY STAR models tested excluding the two units with negative CADR ratings). These changes will result in a negative unit energy savings value for basic tier air cleaners and significantly reduced savings for the advanced tier. In addition, a part-load factor should be applied to the power draw in active mode (PA) that is calculated as a weighted average of the percentage of users that typically run their air cleaners at each speed setting and the power draw of each speed setting as a percentage of the power draw at the highest setting. This is necessary because the PA currently used in the workpaper (for both baseline and measure-case calculations) assumes that air cleaners are always used with the fan at the highest speed setting. The consumer survey research (the second research item alluded to in the beginning of this memo) shows the following frequency of usage at different speeds: 30% at “low”, 50% at “medium”, and 20% at “high” 4. Our lab testing results show that the models tested draw 59% of the maximum power at “low” speed and 63% at “medium” speed. Thus, we arrive at a part-load factor of 0.69 as shown in the calculation below. This part-load factor of 0.69 should be applied to the active mode power draw for both baseline and measure-case energy consumption calculations. 𝑃𝑃𝐴𝐴,ℎ𝑖𝑖𝑖𝑖ℎ = 1 ∗ 𝑃𝑃𝐴𝐴,ℎ𝑖𝑖𝑖𝑖ℎ 𝑃𝑃𝐴𝐴,𝑚𝑚𝑚𝑚𝑚𝑚𝑖𝑖𝑚𝑚𝑚𝑚 = 0.63 ∗ 𝑃𝑃𝐴𝐴,ℎ𝑖𝑖𝑖𝑖ℎ 𝑃𝑃𝐴𝐴,𝑙𝑙𝑙𝑙𝑙𝑙 = 0.59 ∗ 𝑃𝑃𝐴𝐴,ℎ𝑖𝑖𝑖𝑖ℎ 0.2 𝑜𝑜𝐸𝐸 𝑢𝑢𝑢𝑢𝑢𝑢𝑢𝑢𝑢𝑢 𝑡𝑡𝑡𝑡𝐶𝐶𝑡𝑡𝑡𝑡𝐶𝐶𝑡𝑡𝑡𝑡𝑡𝑡 𝑑𝑑𝑢𝑢𝐶𝐶𝑑𝑑 𝑃𝑃𝐴𝐴,ℎ𝑖𝑖𝑖𝑖ℎ 0.5 𝑜𝑜𝐸𝐸 𝑢𝑢𝑢𝑢𝑢𝑢𝑢𝑢𝑢𝑢 𝑡𝑡𝑡𝑡𝐶𝐶𝑡𝑡𝑡𝑡𝐶𝐶𝑡𝑡𝑡𝑡𝑡𝑡 𝑑𝑑𝑢𝑢𝐶𝐶𝑑𝑑 𝑃𝑃𝐴𝐴,𝑚𝑚𝑚𝑚𝑚𝑚𝑖𝑖𝑚𝑚𝑚𝑚 0.3 𝑜𝑜𝐸𝐸 𝑢𝑢𝑢𝑢𝑢𝑢𝑢𝑢𝑢𝑢 𝑡𝑡𝑡𝑡𝐶𝐶𝑡𝑡𝑡𝑡𝐶𝐶𝑡𝑡𝑡𝑡𝑡𝑡 𝑑𝑑𝑢𝑢𝐶𝐶𝑑𝑑 𝑃𝑃𝐴𝐴,𝑙𝑙𝑙𝑙𝑙𝑙 𝑃𝑃𝐴𝐴 = 0.2 ∗ 𝑃𝑃𝐴𝐴,ℎ𝑖𝑖𝑖𝑖ℎ + 0.5 ∗ 𝑃𝑃𝐴𝐴,𝑚𝑚𝑚𝑚𝑚𝑚𝑖𝑖𝑚𝑚𝑚𝑚 + 0.3 ∗ 𝑃𝑃𝐴𝐴,𝑙𝑙𝑙𝑙𝑙𝑙 𝑃𝑃𝐴𝐴 = 0.2 ∗ 𝑃𝑃𝐴𝐴,ℎ𝑖𝑖𝑖𝑖ℎ + 0.5 ∗ (0.63 ∗ 𝑃𝑃𝐴𝐴,ℎ𝑖𝑖𝑖𝑖ℎ) + 0.3 ∗ (0.59 ∗ 𝑃𝑃𝐴𝐴,ℎ𝑖𝑖𝑖𝑖ℎ)
4 To arrive at the 20%/50%/30% split for users who typically use their air cleaners in high/med/low settings, we assumed respondents who use the “auto” setting and those who responded that they don’t know what setting they typically use, both typically use the medium setting.

Memorandum METHODOLOGY AIR CLEANERS
12
𝑃𝑃𝐴𝐴 = 0.692 ∗ 𝑃𝑃𝐴𝐴,ℎ𝑖𝑖𝑖𝑖ℎ

2016 PG&E RETAIL PRODUCTS PLATFORM (RPP) SOUNDBAR LAB RESEARCH RESULTS
December 30, 2016
1
M E M O
To: PG&E
From: Andrea Salazar, EMI Consulting
Date: December 30, 2016
RE: 2016 PG&E Retail Products Platform (RPP) – Soundbar Laboratory Research Results
Introduction
The Pacific Gas and Electric Company (PG&E) submitted a workpaper for the Retail Products Platform
(RPP) Program in December 2015. In its workpaper disposition the California Public Utilities
Commission – Energy Division (CPUC-ED) identified the need for further research to support the unit
energy savings (UES) values for soundbars.1,2 Resultantly, PG&E conducted lab testing of non-ENERGY
STAR soundbars to measure modal power draw, default auto power down (APD) timing, and amplifier
efficiency and determine if any models meet ENERGY STAR criteria. In this research effort, PG&E has
partnered with Intertek, an EPA-certified third-party test lab, to test and meter soundbar models that are
not ENERGY STAR certified.
The lab testing is being conducted because commission staff were concerned about the lack of data to
support the assumption that non-ENERGY STAR models of products included in the RPP program (such
as soundbars, air cleaners, and freezers) do not meet ENERGY STAR specification requirements. Staff
stated that there needs to be evidence that non-ENERGY STAR products do, in fact, use more energy
than ENERGY STAR products. In other words, a product that is not ENERGY STAR certified does not,
by default, consume more energy than an ENERGY STAR product. It may be, for example, that
ENERGY STAR certification was too costly for the manufacturer, but that the product meets ENERGY
STAR requirements nonetheless.
1 In its disposition letter, the CPUC-ED also requested additional research on clothes dryers, room air cleaners, and research into product-specific market barriers preventing increased adoption of RPP measures. This memo only covers soundbar lab-based research. 2 In the disposition, the Ex Ante Review team also noted “that the hours of use for soundbars does not seem to take into account the previous results for HDTV hours of use and the fact that soundbars are most likely installed with the highest use HDTV in the home (“Understanding Television Set Usage: An investigation into average TV- set usage patterns in California,” prepared by Nielsen for PG&E, May 16, 2012.).” The Nielson study found a daily average of 5.1 hours of use (HOU) per TV across all TVs and 7.7 hours for the most watched TV in the household. This translates to an annual usage of 1,862 hours across all TVs and 2,811 hours for the most watched TV. The workpaper currently estimates 1,580 hours in active mode for sound bars, based on a Consumer Electronics Association (CEA) survey conducted for home theatre in a box systems (Roth, K. W., & McKenney, K. (2007, December). Energy Consumption by Consumer Electronics in U.S. Residences. Retrieved December 27, 2016, from Consumer Electronics Association: http://s3.amazonaws.com/zanran_storage/www.ce.org/ContentPages/25159083.pdf). PG&E agreed to revise the active mode HOU from 1,862 to 2,811 hours per year since the large volume of metered data from the Nielson study is likely more representative of actual consumer usage than consumer responses from the CEA survey.

Memorandum 2016 PG&E RETAIL PRODUCTS PLATFORM (RPP) AIR CLEANER RESEARCH STATUS UPDATE
2
The RPP program incents a portfolio of ENERGY STAR certified products that are sold by retailers to
residential customers. Some of these products have federal energy efficiency regulations in place, and all
such models are required to be tested to show compliance with federal standards. However, certain plug
load devices such as soundbars and air cleaners are not federally regulated, so test data is only available
for ENERGY STAR certified models. With limited data available for non-ENERGY STAR certified
models, it is difficult to determine whether those models that have not been tested via the certification
process have efficiencies below ENERGY STAR specifications. In the research described here, PG&E
identified models of non-ENERGY STAR certified soundbars with high market share and tested them
using the applicable ENERGY STAR test protocol. The testing provided key parameters such as power
draw and determined whether the selected models meet ENERGY STAR requirements.
Research Questions/Objectives
This purpose of this research was to answer the questions:
• What is the power draw (by mode) of non-ENERGY STAR certified soundbars?
• Is the power draw for non-ENERGY STAR models substantially higher than ENERGY STAR
certified models?
• Are there models of soundbars that have not been ENERGY STAR certified, but would meet
ENERGY STAR specifications if they were tested?
Summary of Key Findings
• Average idle mode power draw3 of the non-ENERGY STAR models tested is 8.5 W (ENERGY
STAR maximum ranges from 11 – 15 W for the products tested based on functionality and power
output).
• Average sleep mode power draw of the non-ENERGY STAR models tested is 1.7 W (ENERGY
STAR maximum ranges from 2 – 6 W for the products tested based on functionality).
• Seven of the twenty-three models tested meet all the ENERGY STAR specification requirements.
Four models have inconclusive results.
Research Approach
PG&E contracted Intertek, an EPA-certified third-party test lab, to test and meter models selected by
PG&E using the methodology discussed below.
Model Selection
At the time when this research began, the RPP program had access to 3 months of program sales data as
well as 12 months of historical sales data from participating retailers in PG&E’s service territory. Due to
the short life cycle of consumer electronic items such as sound bars (a model from last year may no
longer be in stock), we decided to use only the most recent 3 months of program sales data for model
selection. We sorted the list of non-ENERGY STAR sound bar models sold between March and May of
2016 by sales volume and selected the 23 top-selling models for those 3 months. 3 of those models were
3 Note that the idle mode power draw requirements in the ENERGY STAR specification do not apply to soundbars with default auto-power down (APD) settings of 30 minutes or less that cannot be disabled or increased beyond 30 minutes.

Memorandum 2016 PG&E RETAIL PRODUCTS PLATFORM (RPP) AIR CLEANER RESEARCH STATUS UPDATE
3
out of stock during the procurement phase of this research, so we instead replaced those with the next 3
top-selling models in the scope. The final list of models tested is shown in

Memorandum 2016 PG&E RETAIL PRODUCTS PLATFORM (RPP) AIR CLEANER RESEARCH STATUS UPDATE
4
Table 1.

Memorandum 2016 PG&E RETAIL PRODUCTS PLATFORM (RPP) AIR CLEANER RESEARCH STATUS UPDATE
5
Table 1: Non-ENERGY STAR Soundbars Selected for Testing
MODELA
RPP RETAILER NON-ENERGY STAR MARKET SHAREB
NUMBER OF UNITS
SOLD
SALES VOLUME
RANKC % OF SALES
1 5,651 1st 13.3%
4 2,115 4th 5.0%
9 2,046 5th 4.8%
2 2,036 6th 4.8%
3 1,873 7th 4.4%
20 1,394 9th 3.3%
11 1,218 10th 2.9%
5 1,214 11th 2.9%
21 852 13th 2.0%
14 802 15th 1.9%
23 670 17th 1.6%
7 598 18th 1.4%
15 514 21st 1.2%
22 404 24th 0.9%
19 328 28th 0.8%
12 318 30th 0.7%
17 268 31st 0.6%
16 262 32nd 0.6%
18 230 34th 0.5%
8 206 37th 0.5%
10 130 45th 0.3%
13 101 49th 0.2%
6 0 NA 0.0%
A Manufacturer/model information is confidential, but can be provided if requested to the CPUC-ED and/or other utility partners
on an as needed basis. B Market share is based on RPP retailer sales data from January 2015 – November 2016 from the ICF database. C Out of 202 different non-ENERGY STAR models that are sold by RPP retailers
Using the RPP retailer sales data that has since become available, we determined that this list of models
represents roughly 55% of non-ENERGY STAR soundbar market sales.4 The top five selling models
(three of which were tested) represent 37% of non-ENERGY STAR sales. The top ten selling models
(seven of which were tested) represent 57% of non-ENERGY STAR sales.
4 The models tested represent 55% of non-ENERGY STAR qualified sound bars from January 2015 to November 2016. From March 2016 to May 2016, these same models represent roughly 69% of RPP retailer sales.

Memorandum 2016 PG&E RETAIL PRODUCTS PLATFORM (RPP) AIR CLEANER RESEARCH STATUS UPDATE
6
Model Testing
Each model was lab tested in accordance with the test method outlined in the ENERGY STAR Program
Requirements Product Specification for Audio/Video Version 3.0.5
The following characteristics were collected from manufacturer specifications for each model:
• Manufacturer and model number
• Number of channels
• Connected functionality (Wi-Fi, gigabit Ethernet, Bluetooth, or other networking/control
protocols)
The following data were collected through the testing process:
• Auto power down (APD) requirements met? Y/N
• Measured average power before APD
• Measured average power after APD
• Time to APD
• Calculated ENERGY STAR specification maximum sleep mode power (based on each model’s
functionality)
• Calculated ENERGY STAR specification maximum idle mode power (based on each model’s
functionality and power output)
• Measured input power (𝑃𝐼𝑁) at 1/8 maximum undistorted power (MUP)
• Measured output power (𝑃𝑂𝑈𝑇) at 1/8 MUP
• Measured average power in idle mode (𝑃𝐼𝐷𝐿𝐸)
• Measured average power in sleep mode (𝑃𝑆𝐿𝐸𝐸𝑃)
• Calculated amplifier efficiency = 𝑃𝑂𝑈𝑇/(𝑃𝐼𝑁)
Research Results
Test results are shown in the table below.
5 https://www.energystar.gov/ia/partners/prod_development/revisions/downloads/audio_video/Final_Version_3_AV_Program_Requirements.pdf?143e-0e06

Memorandum 2016 PG&E RETAIL PRODUCTS PLATFORM (RPP) AIR CLEANER RESEARCH STATUS UPDATE
7
Table 2: Non-ENERGY STAR Soundbar Lab Testing Results
Model Time to ADP
(min)
ADP Req
Met?
PIdle
(W)
Max PIdle
(W)
PSLEEP
(W)
Max
PSLEEP (W) Amp Eff
Amp Eff
Req
All Spec
Reqs Met?
1 Not enabled No 3.2 11.0 0.3 1.0 0.098 NA No
2 41.3 Yes 2.8 11.0 0.2 3.0 0.271 NA Yes
3 10.7 Yes 11.1 11.0 0.4 3.0 0.244 NA No
4 9.7 Yes 3.3 11.0 0.3 1.0 0.415 NA Yes
5 9.9 Yes 7.6 11.0 0.4 3.0 0.008 NA Yes
6 Not enabled No 3.1 11.0 0.2 1.0 0.369 NA No
7 9.9 Yes 2.5 11.0 0.4 3.0 0.248 NA Yes
8 4.7 Yes 7.0 11.0 2.6 2.0 0.219 NA No
9 19.9 Yes 5.4 11.0 0.4 3.0 0.33 NA Yes
10 14.9 Yes 19.8 11.0 6.2 3.0 0.292 0.44 No
11 19.4 Yes 6.0 11.0 0.3 3.0 0.488 NA Yes
12 4.9 Yes 6.7 11.0 5.5 1.0 0.393 0.44 No
13 20.7 Yes 23.5 13.0 0.3 6.0 0.088 0.44 No
14 20.5 Yes 18.1 13.0 1.6 6.0 0.038 0.55 No
15 20.4 Yes 13.2 13.0 5.4 6.0 0.362 0.44 No
16 19.9 Yes 9.9 11.0 4.9 4.0 0.323 NA No
17 4.7 Yes 5.3 11.0 0.2 3.0 0.154 NA Yes
18 14.9 Yes 5.2 11.0 2.6 2.0 0.059 NA No
19 20.0 Yes 10.2 11.0 5.1 4.0 0.398 NA No
20 19.8 Yes 7.9 11.0 0.4 3.0 Unknown* Unknown* Unknown*
21 9.7 Yes 4.8 12.0 0.2 1.0 Unknown* Unknown* Unknown*
22 17.6 Yes 6.4 11.0 0.3 2.0 Unknown* Unknown* Unknown*
23 20.6 Yes 11.8 13.0 1.6 6.0 Unknown* Unknown* Unknown*
* The audio amplification tests for these units were indeterminate due to inconsistent test results or a malfunctioning unit. Rough
estimates of input power for these units indicate that most of these units likely have an input power draw that falls below the
threshold that requires amplifier testing.
As can be seen above 7 of the 23 models tested meet all applicable ENERGY STAR criteria. Of the 12
units that do not meet the ENERGY STAR criteria, 2 fail to meet the ADP requirement, 6 fail to meet the
sleep mode power draw requirement, 5 fail to meet the idle mode power draw requirement, and 5 fail to
meet the amplifier efficiency requirement. 4 models meet the ADP, idle mode power, and sleep mode
power requirements, but it is inconclusive whether the amplifier efficiency requirement is met.

Memorandum 2016 PG&E RETAIL PRODUCTS PLATFORM (RPP) AIR CLEANER RESEARCH STATUS UPDATE
8
As shown in Figure 1 below, all the models that had ADP enabled meet the ENERGY STAR time to
ADP requirement of less than or equal to 2 hours. The average time to ADP was approximately 16
minutes with a range of approximately 5 minutes to just over 41 minutes.
Figure 1. Time to ADP by Model Tested

Memorandum 2016 PG&E RETAIL PRODUCTS PLATFORM (RPP) AIR CLEANER RESEARCH STATUS UPDATE
9
Figure 2 shows that the models tested have idle mode power draws ranging from 2.5 to 23.5 W and an
average idle mode power draw of 8.5 W. The ENERGY STAR maximum idle mode power draw ranges
from 11 to 13 W for the models tested depending on the functionality of the unit.
Figure 2. Idle Mode Power Draw by Model Tested

Memorandum 2016 PG&E RETAIL PRODUCTS PLATFORM (RPP) AIR CLEANER RESEARCH STATUS UPDATE
10
Figure 3 shows that the models tested have sleep mode power draw ranging from 0.2 to 6.2 W, and an
average sleep mode power draw of 1.7 W. The ENERGY STAR maximum sleep mode power draw
ranges from 1 to 6 W for the models tested depending on the functionality of the unit.
Figure 3. Sleep Mode Power Draw by Model Tested
Impact of Results on RPP Workpaper
In the RPP workpaper, the unit energy consumption of soundbars is calculated using Equation 1.
Equation 1
𝑈𝐸𝐶 =𝑃𝐴 ∗ 𝑇𝐴 + 𝑃𝐼 ∗ 𝑇𝐼 + 𝑃𝑆 ∗ 𝑇𝑆
1000 𝑊ℎ𝑘𝑊ℎ⁄
Where
UEC = unit energy consumption in kWh
PA = power draw in active mode in watts
TA = number of hours per year spent in active mode
PI = power draw in standby mode in watts
TI = number of hours per year spent in standby mode
PS = power draw in sleep mode in watts
TS = number of hours per year spent in sleep mode
1000 = conversion factor to change from watt-hours to kilowatt-hours.

Memorandum 2016 PG&E RETAIL PRODUCTS PLATFORM (RPP) AIR CLEANER RESEARCH STATUS UPDATE
11
Idle mode power draw was assumed to be 12 W for base-case models, 9.2 W for basic tier (ENERGY
STAR + 15%) program-qualified models, and 5.5 W for advanced tier (ENERGY STAR + 50%)
program-qualified models. Sleep mode power draw was assumed to be 4 W for base-case models, 1.5 W
for basic tier (ENERGY STAR + 15%) program-qualified models, and 1.0 W for advanced tier
(ENERGY STAR + 50%) program-qualified models.
Based on the results of this research, we believe the assumption for the base-case power draw
assumptions should be changed from 12 W and 4 W to 8.5 W and 1.7 W for idle and sleep modes
respectively (the averages of all the non-ENERGY STAR models tested).