Embed Size (px)
Citation preview

·· ., :-.
No Objection To Declassification 2009/03/10 : NLN-WHCF SMOF WHITMAN-242-3-2-2
MEMORANDUM FOR: 4Qi ' •:
DX'. l!:'zra So.lomon .-..O•r
~ _, , :~. ··. ,~ W'l_:_c!;.l · ~ !;conoaio Mvisers ;r · · '~tive Office Building :~ ..
At~~ is your personal copy of · ..- .911111QI!_.., ;J•fWtl.fordm -t 9Mf 1 ·IM - I fDE .
25X1 ·. . . ~
URICE C • .,.....,,. =-=> Direo ~f Economic Researcll Central Intelligence Agancy
FORlll NO . ·1 AU6 54 10 .. 1 llEPLACU FORM· 10• IOI
WHICH MAY. 1£ OSEO.
o\ 4\v& '1~ (DATE)
ON-FILE NSC RELEASE INSTRUCTIONS APPL
IOI
No Objection To Declassification 2009/03/10 : NLN-WHCF SMOF WHITMAN-242-3-2-2

;. --.. No Objection To Declassification 2009/03/10: NLN-WHCF SMOF WHITMAN-242-3-2-2 k.,,
DIRECTORATE OF INTELLIGENCE
Cont idential
Intelligence Memorandum
International Finance Series
The Outlook for Free Market Gold
Confidential ER IM 72-125 Aug1=!_s_:!; _1972
Copy No. 46
No Objection To Declassification 2009/03/10 : NLN-WHCF SMOF WHITMAN-242-3-2-2

25X1
No Objection To Declassification 2009/03/10 : NLN-WHCF SMOF WHITMAN-242-3-2-2
WARNING This dix·ument nmtains infonnation affecting the national dcf ense of the United States, within the meaning of Titlt• 18, sections 793 and 794, of the US Code, as amended. Its transmission or n~vclation of its contents to or re· ceipt by an unauthorizl•d person is prohibited by law.
No Objection To Declassification 2009/03/10 : NLN-WHCF SMOF WHITMAN-242-3-2-2

No Objection To Declassification 2009/03/10: NLN-WHCF SMOF WHITMAN-242-3-2-2 uUN r 1v.r.,N 111\L
CENTRAL INTELLIGENCE AGENCY Directorate of Intelligence
August 1972
INTELLIGENCE MEMORANDUM
THE OUTLOOK FOR FREE MARKET GOLD
Summary
l. Free World basic (non-speculative) private demand<l) for gold caught up with the supply of newly mined gold at the official price of $35 an ounce in the mid-1960s, exceeded production by 15% in 1970, and now probably is at least 30% greater. In 1970, basic gold demand totaled about 1,480 metric tons, compared with only about 1,290 tons of new gold production. This 190-ton supply shortfall - plus 245 tons added to official reserves - was met by drawing down most of the remaining portion of the speculative overhang that accumulated during the 1967-68 rush on gold. About 55% of total basic demand occurred in the developed countries - nearly all for commercial purposes. The remainder was added to gold hoards in the less developed countries.
2. The gap between basic demand and supply may temporarily narrow in 1973, but will widen in the following years. Basic demand is expected to grow about 3o/o-4% annually in quantity terms based on estimated annual growth rates of some 5% for industrially developed countries and about I% for the less developed countries. The annual average supply of newly mined gold, however, is not likely to expand over the coming years, although supply in 1973 probably will be somewhat higher than l 972's unusually low level.
1. The terms consumption and demand, although similar in connotation, have distinct meanings as applied in this memorandum. In all cases, consumption refers to actual tonnages of gold absorbed. Demand, however, is intended to describe those tonnages of gold that potential gold consumers would wish to acquire if the price of gold remained constant.
Note: This memorandum was prepared by the Office of Economic Research.
CONFIDENTIAL
No Objection To Declassification 2009/03/10: NLN-WHCF SMOF WHITMAN-242-3-2-2
No Objection To Declassification 2009/03/10 : NLN-WHCF SMOF WHITMAN-242-3-2-2 \....IV!"" r 11.J.Cl''ij .l l/'\..L
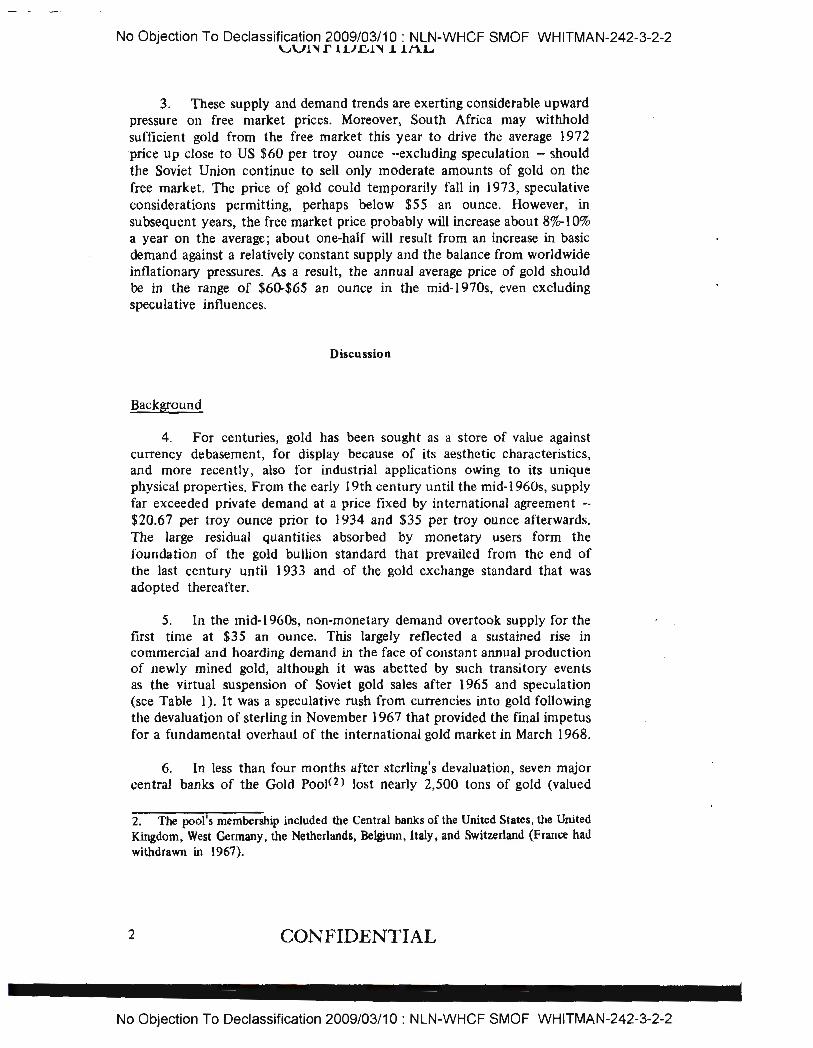
3. These supply and demand trends are exerting considerable upward pressure on free market prices. Moreover, South Africa may withhold sufficient gold from the free market this year to drive the average 1972 price up close to US $60 per troy ounce --excluding speculation - should the Soviet Union continue to sell only moderate amounts of gold on the free market. The price of gold could temporarily fall in 1973, speculative considerations permitting, perhaps below $55 an ounce. However, in subsequent years, the free market price probably will increase about 8o/a-10% a year on the average ; about one-half will result from an increase in basic demand against a relatively constant supply and the balance from worldwide inflationary pressures. As a result, the annual average price of gold should be in the range of $60-$65 an ounce in the mid-1970s, even excluding speculative influences.
Discussion
Background
4. For centuries, gold has been sought as a store of value against currency debasement, for display because of its aesthetic characteristics, and more recently, also for industrial applications owing to its unique physical properties. From the early 19th century until the mid-1960s, supply far exceeded private demand at a price fixed by international agreement -$20.67 per troy ounce prior to 1934 and $35 per troy ounce afterwards. The large residual quantities absorbed by monetary users form the foundation of the gold bullion standard that prevailed from the end of the last century until 1933 and of the gold exchange standard that was adopted thereafter.
S. In the mid- l 960s, non-monetary demand overtook supply for the first time at $35 an ounce. This largely reflected a sustained rise in commercial and hoarding demand in the face of constant annual production of newly mined gold, although it was abetted by such transitory events as the virtual suspension of Soviet gold sales after 1965 and speculation (see Table l ). It was a speculative rush from currencies into gold following the devaluation of sterling in November 1967 that provided the final impetus for a fundamental overhaul of the international gold market in March 1968.
6. In less than four months after sterling's devaluation, seven major central banks of the Gold PooJ<2) lost nearJy 2,500 tons of gold (valued
2. The pool's membership included the Central banks of the United States, the United Kingdom, West Germany, the Netherlands, Belgium, Italy, and Switzerland (France had withdrawn in 1967).
2 CONFIDENTIAL
No Objection To Declassification 2009/03/10 : NLN-WHCF SMOF WHITMAN-242-3-2-2

No Objection To Declassification 2009/03/10 : NLN-WHCF SMOF WHITMAN-242-3-2-2
CONFIDENTIAL
Table 1
Gold: Free world supply and Demand
Metric Tons
Sales by Additions Net New Communist To Monetary Private
Year Production Countries Stocks Purchases
1950 755 288 467 1951 733 235 498 1952 755 205 550 1953 755 67 404 418 1954 795 67 595 267 1955 835 67 591 311
1956 871 133 435 569 1957 906 231 614 523 1958 933 196 605 524 1959 1,000 266 671 595 1960 1,049 177 262 964
1961 1I0 80 266 538 808 1962 1I156 178 329 1 I 005 1963 1,205 489 729 965 1964 1,250 400 631 1 '019 1965 1,280 355 196 1,439
1966 1,285 -67 -40 1,258 1967 1,250 -s -1'404 2,649 1968 1,262 -29 -623 1,856 1969 1 , 262 -15 97 1'150 1970 1,289 245 1,044 1971 1 '250 50 -so 1,350
at $2.8 billion). Finally, on 1 7 March 1968, in conjunction with the International Monetary Fund (IMF), these central banks inaugurated a two-tier marketing arrangment whereby monetary gold transactions at a fixed price were segregated from private gold transactions at prices determined by market forces. As a result of this arrangment, which was supplemented by an agreement between South Africa and the IMF in December 1969, monetary gold stocks were to remain essentially unchanged and all newly mined gold was to be sold on the free market to private buyers except on certain occasions.< 3 > Since then, the price of gold on
3. South Africa was permitted to sell gold to the lMF whenever the free market price fell to $35 an ounce and/or its balance of payments was in deficit.
CONFIDENTIAL 3
No Objection To Declassification 2009/03/10 : NLN-WHCF SMOF WHITMAN-242-3-2-2

No Objection To Declassification 2009/03/10 : NLN-WHCF SMOF WHITMAN-242-3-2-2
CONFIDENTIAL
the free market has risen erratically but continuously, temporarily reaching $70 an ounce for the first time in early August 1972.
Basic Consumption
7. We define basic gold consumption as that non-monetary gold that is fabricated for commercial (artistic, dental, and industrial) purposes and accumulated for hoarding, as distinguished from gold purchased for speculative purposes. We measure only basic demand to determine long-range effects on the free-market value of gold. Speculative demand cannot be predicted in any meaningful way, because of its sensitivity to rapidly changing economic and political conditions. Moreover, speculative demand will net out over time as speculative sales offset speculative purchases.
8. Available statistics make it impossible to separate commercial demand, hoarding demand, and speculative ·demand in less developed countries. All gold entering the Jess developed countries is treated as basic consumption, mainly gold hoards. This is probably a reasonable procedure because gold sold for speculative purposes in the markets of less developed countries rarely finds its way back to the markets of industrial countries.
The Economically Advanced Countries
9. North America, Western Europe, and Japan consumed about 760 tons of gold for commercial purposes in 1970. Five countries - the United States, Italy, West Germany, Japan, and Spain - accounted for more than three-fourths of the total (see Table 2). In addition, substantial amounts of gold were hoarded in J 970 - mostly in France, but some in Switzerland - although probably Jess than the customary SO tons or more a year.
I 0. Some 80% of commercial gold is used in jewelry and other artistic products; the remainder is about evenly divided between industrial and dental applications. Italy, the United States, West Germany, and Spain are the principal producers of gold jewelry. Industrial consumption is heavily concentrated in the United States (which accounts for about one-half the total), West Germany, Japan, and the United Kingdom. These countries are the leading producers of electronic components and equipment. Dental use is spread relatively evenly throughout the developed countries. Consumption of gold for artistic and dental purposes has risen - although the latter rather slowly - in response to increases in per capita incomes and population. Industrial consumption of gold has risen rapidly with increases in industrial production.
4 CONFIDENTIAL
No Objection To Declassification 2009/03/10: NLN-WHCF SMOF WHITMAN-242-3-2-2

No Objection To Declassification 2009/03/10 : NLN-WHCF SMOF WHITMAN-242-3-2-2 CONFIDENTIAL
Table 2
Commercial Consumption of Gold in the Developed Countries ~/
Metric Tons
1966 1967 1968 1969 1970
United States 188 196 205 221 186
Canada 10 10 10 10 10
Japan 16 22 32 49 59
Austria 22 £,! 32 £,! 24 £,! 18 el 28 £/ Belgium/Luxembourg 4 5 6 7 7
France 40 40 41 41 34
Greece 10 £/ 11 ~/ 11 £/ 12 e/ 12 e/ Italy 130 ~/ 145 s/ 160 £/ 168 £/ 175 e/ Netherlands 9 9 9 10 12
Norway/Derunark/ Finland 11 £/ , 1 <:./ 1 1 £/ 11 £/ 11 £/
Portugal 15 16 14 11 12
Spain 53 el 52 £/ 48 £,! 65 el 57 ~ Sweden 7 8 6 6 . 6
Switzerland 26 24 23 23 24
United Kingdom/ Ireland 25 29 29 32 32
West Germany 109 149 104 104 95
Total 675 759 733 788 760
a. Including North America, Western Europe, and Japan. National totals, except where otherwise indicated, are based on official statistics submitted to either the US Bureau of the Mint or the Bank for International Settle-ments. b. Reported by private studies. c. CIA estimate •
CONFIDENTIAL 5
No Objection To Declassification 2009/03/10: NLN-WHCF SMOF WHITMAN-242-3-2-2

No Objection To Declassification 2009/03/10: NLN-WHCF SMOF WHITMAN-242-3-2-2 CONFIDENTIAL
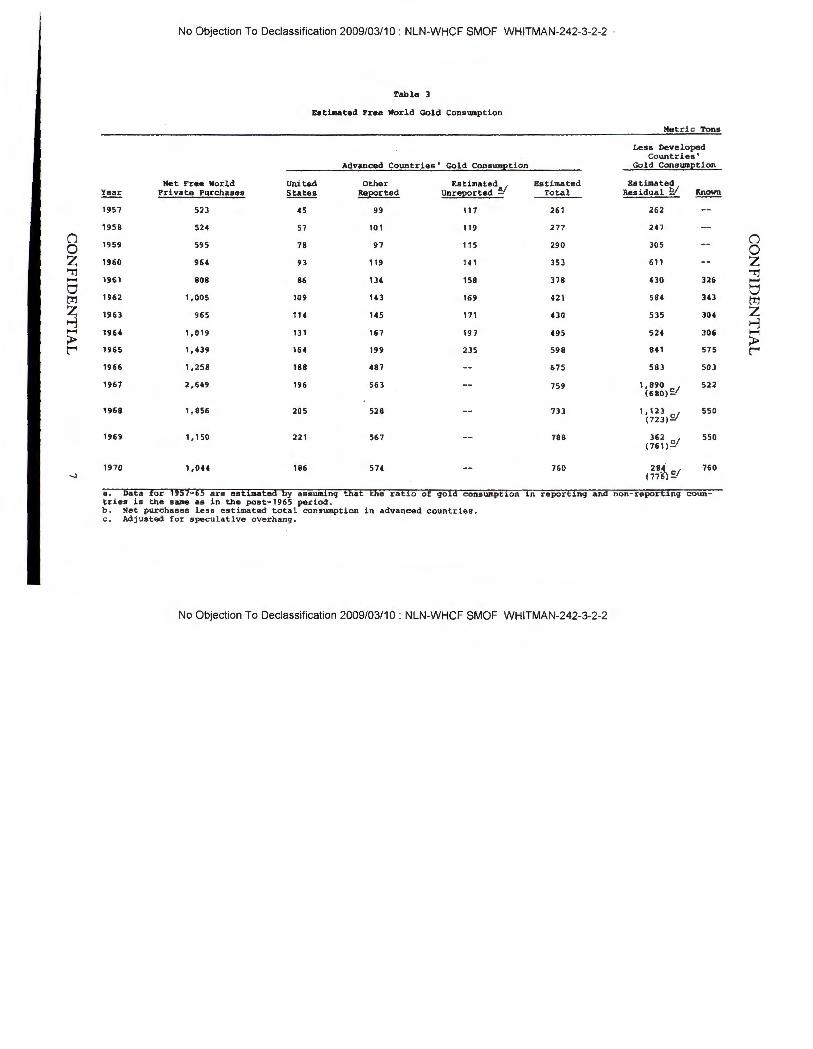
l l. Commercial consumption of gold in the developed countries probably grew at an average annual rate of 8% to 9% during 1958-70 (see Table 3).C4) The rate of growth in the United States - 11.5% a year -was singularly high while consumption in other developed countries probably increased about 7'%-8% a year. Growth of consumption has slowed in recent years. Following four years of unusually rapid growth (an average of about l 5%), consumption fell in 1968, probably reflecting stock adjustments and uncertainties after the two-tier system was first established. Consumption rose in 1969, and fell again in 1970, mainly because of the US economic recession.
The Less Developed Countries
12. Basic gold consumption by less developed countries was roughly 680 tons in 1970. (5 > Most was purchased for hoarding purposes in the form of crudely fashioned jewelry and ornaments. There are two major types of demand for gold in the less developed countries. The first is traditional, motivated by prestige considerations and distrust or unavailability of banks. Much of this originates in the rural areas - such as those of India - where the lower economic classes purchase gold jewelry as a form of seasonal savings. The remaining traditional consumption is more permanent than seasonal, involves gold bars, and occurs in the more urban areas - such as those of the Near East - where an unsophisticated nouveau ricbe class has been concentrated. The second type of demand is motivated almost exclusively by political uncertainty. For it to exist, two conditions are required - a fear of drastic political change and a substantial means of financing gold purchases. In South Vietnam, for example, the war and the availability of large sums of dollars has generated a large and continuing demand for gold imports.
13. Although gold consumption in the less developed countries has risen about 8o/o-9% a year during 1958-70, this growth has been uneven. There have been two short spurts of rapid expansion followed by prolonged periods of minimal growth. The first jump in consumption occurred at about the turn of the decade. We are uncertain about its cause. Increased incomes from oil in the Near East may have been a contributing factor . Moreover, sales of newly mined gold to private purchasers may have understated world consumption in the late 1950s because of the disgorging of hoarded gold in Europe with the easing of the cold war and the lifting of restrictions on trade and payments. The most recent surge in demand occurred in the
4. The ratio of gold consumption in each country where data are lacking prior to 1966 to the total is assumed to be the same before 1966 as after . 5. For a detailed explanation of how this estimate was derived and for a breakdown of consumption by country, see the Appendix.
6 CONFIDENTIAL
No Objection To Declassification 2009/03/10 : NLN-WHCF SMOF WHITMAN-242-3-2-2
No Objection To Declassification 2009/03/10 : NLN-WHCF SMOF WHITMAN-242-3-2-2
Table 3
Estimated Free World Gold ConsUllption
Metric Tons
Less Developed Countries'
Advanced Countries' Gold ConsumEtion Gold ConsUllEtion
Net Free World United Other Estimated Estimated a!:~::ie~ Year Private P11rchases States ReES!rted unre2orted ~ Total Known
1957 523 45 99 117 261 262
1958 524 57 101 119 277 247 (')
1959 595 78 97 115 290 305 (')
0 0 z 1960 964 93 119 141 353 611 z 'Tl 'Tl ....... 1961 808 86 134 158 378 430 326 ..... 0 m 1962 1,005 109 143
t:l 169 421 584 343 m z 1963 965 114 145 171 uo 535 304 z
~ ~ ..... 1964 1,019 131 167 197 495 524 306 .... ;p. ;p. r 1965 1,439 164 199 235 598 841 575 r
1966 1,258 188 487 675 583 503
1967 2,649 196 563 759 1 i!:g,s.1 522
1968 1,856 205 528 733 1,123 (723)£/
550
1969 '' 150 221 567 788 362
(761)£/ 550
1970 1,0U 186 574 760 284 760 _, (776) sl
a. Data for 1957-65 are esti...,ted by assW11inq that the ratio tries is the sane as in the post-1965 period.
of qold consumpti.on in report.i.nq and non-report~n9 coun-
b. Net purchases less estimated total consumption in advanced countries. c. Adjusted for specula t i ve overhang .
No Objection To Declassification 2009/03/10 : NLN-WHCF SMOF WHITMAN-242-3-2-2

No Objection To Declassification 2009/03/10 : NLN-WHCF SMOF WHITMAN-242-3-2-2 t..;U N r ' HJ ..t:N 'l '!AL
mid- l 960s and apparently is attributable largely to increased hostilities in Southeast Asia. Since about 1965, growth in consumption by less developed countries has been slight.
14. Three regional markets - consisting of the Near East-North Africa, the Indian sub-continent, and the Far East - account for most of the consumption by less developed countries. Most of each region's supply flows through trading centers where the imports are legal - Lebanon for the Near East-North Africa ; Dubai for the Indian sub-continent ; and Hong Kong, Laos, and Singapore for the Far East. In 1970 the Near East absorbed about 135 tons of gold, of which an estimated 20 tons can be attributed to speculation that preceded the devaluation of the Turkish lira. The principal gold consumers in this region are Turkey, Iran, and Egypt. The Indian sub-continent - one of the world's largest gold markets - absorbed about 280 tons in 1970. More than 50% of the Far East's consumption -about 240 tons in 1970 - is shared by South Vietnam and Indonesia . The two other regional markets - Latin America and sub-Saharan Africa - are not important gold-hoarding areas (see Table 4).
8
Table 4
Identified Gold Conswnption in the Less Developed Countries in 19 70 ~I
Metric Tons
Nearb/ South Far Latin Sub-Saharan East - ~ ~ America Africa Total
Net imports 135 275 210 50 10 700 Production
consumed locally 5 30 25 20 60
Total ill 280 240 . 75 30 760
Adjusted £/ 115 220 240 75 30 680
a. Data are rounded to the nearest five tons. b. Including North Africa. c. Adjusted totals eliminate amounts that do not appear to respond to "basic" demand forces but rather are attributable to special circumstances.
CONFIDENTIAL
No Objection To Declassification 2009/03/10 : NLN-WHCF SMOF WHITMAN-242-3-2-2

No Objection To Declassification 2009/03/10: NLN-WHCF SMOF WHITMAN-242-3-2-2 CONFIDENTIAL
Supply of Gold
Free World Production
15 . Newly mined gold(6) has been the single most important supply source. Annual production, after a prolonged period of steady annual increases, varied only within the narrow range of 1,250 to 1,290 tons since 1964. In 1971 an estimated 1,250 tons of gold were mined . In general, gains in South African output since 1964 have been approximately offset by declines elsewhere (see Table 5).
16. South Africa has been the world's single most important source of gold since the early years of the 20th century . Its share grew from less than 50% in 1950 to 78% in 1970 as a result of the opening of large, rich deposits in the Orange Free State. South Africa derives an important cost advantage from its ready supply of cheap labor and from significant economies of scale.
17. Other Free World gold-producing countries mine the equivalent of only a small fraction of South Africa's output, and their production declined steadily over the past decade. Canada is the second most important source , with 1970 output equivalent to only about 7% of South Africa's production and only about 55% of its own 1960 level. Most Canadian gold output is a byproduct of other mining activities, largely copper and other base metals. Nearly all Canadian gold mines depend on government aid to survive. The US gold mining industry - the third largest producer - is also hard pressed by rising costs and, except for new open pit mines in Nevada , has also stagnated. Most of the remaining gold is mined in Ghana , Australia, Japan, the Philippines, and Rhodesia.
Soviet Sales
18. Communist gold has not been a significant supply factor in the rest of the world since Moscow discontinued its large-scale sales at the end of 1965. The USSR sold an average of about 200 tons annually between .1956 and 1962, and about 450 tons annually during 1963-65 when it imported large quantities of wheat. During 1966-71, such sales averaged less than 20 tons a year. The USSR has doubJed the size of its goJd reserves since 1965 to about 1,750 tons at the end of 1971. Soviet output , about 225 tons in 1971 , will rise substantially as new mines come into production. An expected sharp increase in Soviet currency needs in 1972, possibly
6. Production is not always equated with the supply of newly mined gold made available to the market owing to South Africa's ability to withhold gold from the market or to sell gold to the IMF under certain conditions.
CONFIDENTIAL 9
No Objection To Declassification 2009/03/10 : NLN-WHCF SMOF WHITMAN-242-3-2-2

No Objection To Declassification 2009/03/10 : NLN-WHCF SMOF WHITMAN-242-3-2-2
0
Tab la 5
Free Worl d Gold Production
Metric Tons
~ ~ ~ ~ ~ ~ __!1g_ ---12!!._ ~ 19 70
South Afri c a 71 3 . 9 793 . 1 853. 9 90 5 .7 950 .2 96 0 . 7 943.6 96 7. 1 969.6 1, 002. 7 (') (')
0 Canada 138 . 2 129 . 3 123 . 5 118 . 2 111 . 6 10 1 .9 92. 2 8 3.6 79 . 2 72. 7 0 z United States 48 .7 48 . 4 45.7 45. 7 52 . 1 56. 1 49.2 47 .9 53.4 56.4 z 'Tl 'Tl ...... ...... Ghana 26.0 27 . 6 28.6 26 .9 23.7 21. 3 23.7 22.6 22.0 22 .0 v v t'I'.I Rhodesia 17.8 17 . 0 17.6 17 . 9 17 . 5 17 . 1 16. 0 16 . 0 16 . 0 15 . 6 t'I'.I
z Philippi nes 13 . 2 z
..:i 13 . 2 11. 7 13.2 13 . 7 14 .1 15. 3 16 .4 17 . 8 18 . 8 ....,
...... ...... Japan 11 . 7 13 .1 13 . 4 14 . 3 16 . 1 17. 2 2 1 . 1 19. 1 21. 1 22 .0 ;:i:.. ;:i:.. t""' Austra l i a 33 . 5 33. 4 31. 8 30 . 0 27 .3 28. 4 25 . 1 24 . 4 21. 8 19 . 3 t""'
Other 77 .0 80 . 5 79 .1 77 . 9 67 .8 68 .5 63 . 5 6 5 . 1 6 1 . 3 59 . 4
Tota l 1,080 .o ~ 1 , 205.3 1, 249 . 8 1 , 200 . o 1,285. 3 ~ 1'262 . 2 1, 262. 2 1 ,28 8 .9
No Objection To Declassification 2009/03/10 : NLN-WHCF SMOF WHITMAN-242-3-2-2

No Objection To Declassification 2009/03/10 : NLN-WHCF SMOF WHITMAN-242-3-2-2 CONFIDENTIAL
matching their annual requirements during 1963-65, probably will bring about a resumption of large-scale gold sales.
Speculative Overhang
19. Between the devaluation of sterling in November 1967 and the creation of the two-tier gold market in March 1968, the London Gold Pool members sold about 2,500 tons (or $2.8 billion) to the private market, mostly to cover heavy speculative demand. About 2,000 tons of this came to be known as "speculative overhang" - that is, gold held in anticipation of a price increase - and the remainder was consumed commercially. For the remainder of 1968, South Africa withheld its newly mined gold from the market so that the supply of newly mined gold from all sources accounted for less than one-half of the basic consumption for that year. A similar gap occurred in 1969 despite some South African free market sales; both gaps were filled from the overhang. Speculative holdings remained substantial, however, until the December 1969 agreement between the IMF and South Africa. Speculators, believing this new agreement assured a long life for the two-tier system, began to dispose of their remaining holdings. Indeed, within the next several weeks, such sales actually depressed free market prices below $35 an ounce. During 1970, net speculative sales probably amounted to approximately 435 tons, which is accounted for by a net addition to monetary stocks of 245 tons and by 190 tons for basic consumption. By year's end, the overhang was no longer a significant source of supply.
Recent Developments
20. Since 1970, with the speculative overhang virtually exhausted, the already large and growing imbalance between basic demand and supply has been reflected in a sharp increase in the free market price. Not only has basic demand continued its steady climb upward but also supply has temporarily declined. The size of the consequent price increase appears consistent with a price elasticity of demand of about, or slightly below, unity< 7 > (see the Appendix). The overall price elasticity is derived from different elasticities for the three main categories of demand: jewelry, dentistry, and industry . The elasticity for gold · jewelry - about 90% of basic consumption - is about unity. The price elasticities for industrial and dental gold are much lower, reducing the aggregate elasticity to slightly below unity.
7. Unit elasticity of demand implies that a l % increase in price leads to a l % reduction in the quantity demanded.
CONFIDENTIAL 11
No Objection To Declassification 2009/03/10: NLN-WHCF SMOF WHITMAN-242-3-2-2
No Objection To Declassification 2009/03/10: NLN-WHCF SMOF WHITMAN-242-3-2-2 L,;UN .I:' llJ~l~ l lf\.L
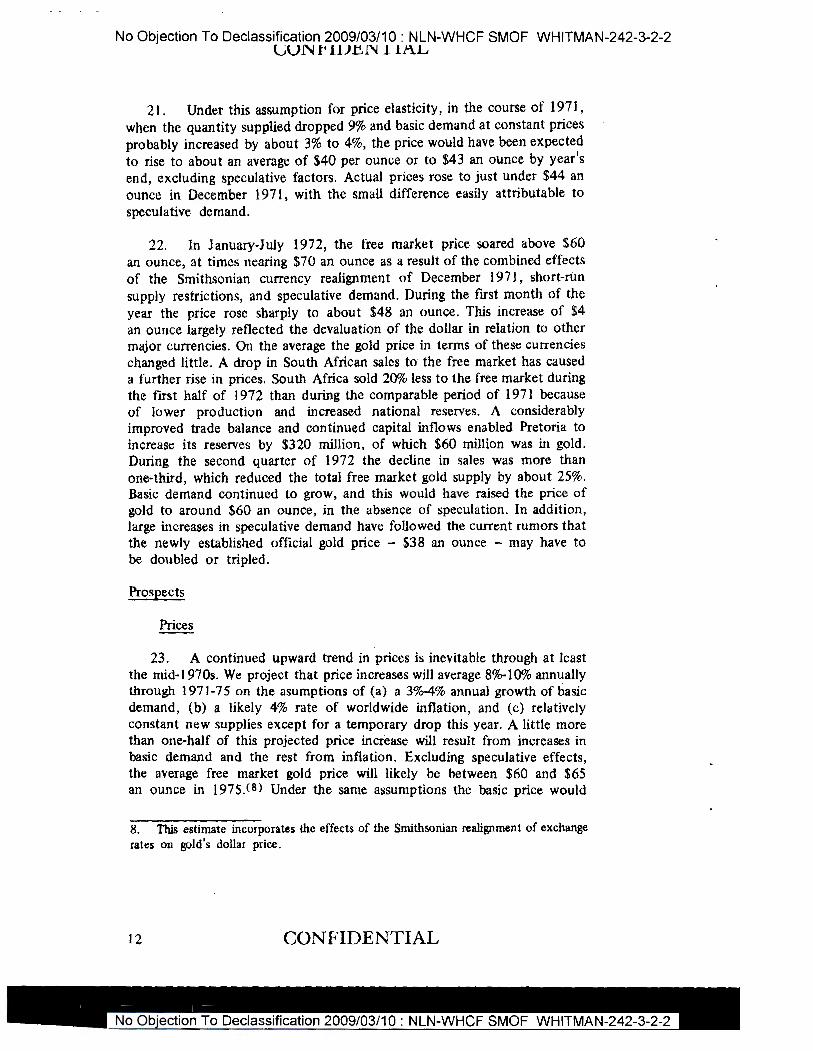
21 . Under this assumption for price elasticity, in the course of 1971, when the quantity supplied dropped 9% and basic demand at constant prices probably increased by about 3% to 4%, the price would have been expected to rise to about an average of $40 per ounce or to $43 an ounce by year's end, excluding speculative factors. Actual prices rose to just under $44 an ounce in December 1971, with the small difference easily attributable to speculative demand.
22. In January-July 1972, the free market price soared above $60 an ounce, at times nearing $70 an ounce as a result of the combined effects of the Smithsonian currency realignment of December 1971, short-run supply restrictions, and speculative demand. During the first month of the year the price rose sharply to about $48 an ounce. This increase of $4 an ounce largely reflected the devaluation of the dollar in relation to other major currencies. On the average the gold price in terms of these currencies changed little. A drop in South African sales to the free market has caused a further rise in prices. South Africa sold 20% less to the free market during the first half of 1972 than during the comparable period of 1971 because of lower production and increased national reserves. A considerably improved trade balance and continued capital inflows enabled Pretoria to increase its reserves by $320 million, of which $60 million was in gold. During the second quarter of 1972 the decline in sales was more than one-third, which reduced the total free market gold supply by about 25%. Basic demand continued to grow, and this would have raised the price of gold to around $60 an ounce, in the absence of speculation. In addition, large increases in speculative demand have followed the current rumors that the newly established official gold price - $38 an ounce - may have to be doubled or tripled.
Prospects
Prices
23. A continued upward trend in prices is inevitable through at least the mid-l 970s. We project that price increases will average 8%-10% annually through 1971-7 5 on the asumptions of (a} a 3%-4% annual growth of basic demand, (b) a likely 4% rate of worldwide inflation, and (c) relatively constant new supplies except for a temporary drop this year. A little more than one-half of this projected price increase will result from · increases in basic demand and the rest from inflation. Excluding speculative effects, the average free market gold price will likely be between $60 and $65 an ounce in 197 5. ( B > Under the same assumptions the basic price would
8. This estimate incorporates the effects of the Smithsonian realignment of exchange rates on gold's dollar price.
12 CONFIDENTIAL

No Objection To Declassification 2009/03/10 : NLN-WHCF SMOF WHITMAN-242-3-2-2 CUN ~'11Jt.:N · 11AL
exceed $90 an ounce by 1980, but for this longer period the supply projection becomes much more uncertain, as there would be time for larger investments in gold mining in response to higher prices to bear fruit.
24. In 1972 the basic price will deviate substantially from the estimated longer run trend because we expect South Africa to sell about 300 fewer tons of gold to the free market this year than last. Excluding speculation, this should yield an average price of about $60 an ounce . Free market price rises in subsequent years should be substantially more gradual as the flow of newly mined gold to the free market from South Africa is restored to more normal levels and with the expected resumption of Soviet gold sales on a larger scale. In fact, the price of gold could temporarily decline over the next year, speculative considerations aside.
Demand
25. Basic demand for gold in non-Communist countries is expected to rise during 1971-75 at an average annual rate of 3% to 4% based on a projected annual growth rate of about 5% or slightly more for the advanced countries and only about 1 % for developing countries. Because the price elasticity of demand for gold is slightly less than unity, the value of gold demand increases at about the same rate. Consequently real demand should increase from 1,480 tons in 1970 to 1,750 tons in 1975 if the gold price is constant. With a price elasticity of unity, the value of sales in current prices will increase to the same extent - from $1.7 billion in 1970 to $2.1 billion in 197 5.
26. The basic demand for the developed countries is based heavily on past trends that have been modified slightly in some instances to reflect changing conditions (see the Appendix). In accordance with past trends, a projected 5% annual average increase for national income should yield a 5% to 6% annual growth rate for gold in jewelry. Demand in dentistry, because it is more closely related to population - which is expected to increase 1% annually in the developed countries - than to income, probably will rise at the average annual rate of 3%. Finally, industrial applications of gold, which have risen at least 50% more rapidly than industrial production in the developed countries over the past 15 years, are likely to be somewhat less sensitive to increases in industrial production in coming years because of new techniques which will lower the gold content per unit of output in the electronics industries. Consequently, an expected 6% growth rate of industrial production may yield only an 8% rate of increase for industrial demand for gold.
2 7. Consumption in less developed countries is more difficult to forecast because it largely depends on prevailing political and military
CONFIDENTIAL 13
No Objection To Declassification 2009/03/10 : NLN-WHCF SMOF WHITMAN-242-3-2-2

No Objection To Declassification 2009/03/10: NLN-WHCF SMOF WHITMAN-242-3-2-2 l...iVl'I .t' llJ.Cl'I 111\.L
conditions. Estimates range from a 2% annual decline to about a 2% annual increase, with the most likely increase approximately 1 %. Our overall projection is a composite of separate estimates for each region. Consumption in the Near East is expected to continue to decline as rapid economic development in that area provides more attractive forms of investment and as investor sophistication grows. South Asian consumption should increase by only 1 % to 3% a year as the growth of rural incomes generated by the "green revolution" of recent years decelerates. Far Eastern consumption, dominated by South Vietnam and Indonesia, is likely to be much more volatile. Vietnam's consumption might increase to perhaps 70 tons a year, if a high level of uncertainty continues. On the other hand, should stable conditions be restored to Vietnam, consumption in 1975 could be on the order of 20 tons - a normal level for a country with its population and level of development. In Indonesia, economic conditions are likely to continue improving, bringing a drop in politically motivated gold purchases.
Supply
28. World gold production is not likely to expand over the next several years, regardless of free market price behavior. Because a long lead time is necessary to open a new mine - about three years for a deep level shaft - South Africa's output through 1975 will be determined by mines already in operation or under construction. By this time, four mines are expected either to be opened or substantially expanded, providing additional capacity of about 75 tons. At free market prices substantially above the official price, some older mines scheduled for closure will remain open. But, although gold mining capacity will increase and the lifespan of existing mines will be lengthened, their production during this period will be reduced because the richness of the ores extracted and, consequently, output in terms of metallic content varies inversely with price.C9) This decline in output from existing mines will approximately offset increased output from new mines. South African production in 1972 is expected to be 8% (about
9. All but one of the seven goldfields are in one geological basin - the other field is in a subsidiary basin -- that is characterized by the occurrence of gold in thin reefs at extremely deep levels -- down to depths in excess of 10,000 feet. The gold is found in the form of a fine dust intermixed in a conglomerate, and for each metric ton of conglomerate mined an average of about one-third ounce of gold is obtained. Removal and processing of the conglomerate is the gold industry's bottleneck. The total volume produced can be varied somewhat, however, by extracting ores with different gold content. The richness of the ores extracted varies inversely with the price of gold. Working a given volume of lower grade ores means that in any one year less gold is produced and profitable reserves are increased. In the long run, therefore, less gold is left in the ground by the time the mine is closed and thus the mine's lifespan is considerably lengthened.
14 CONFIDENTIAL
No Objection To Declassification 2009/03/10 : NLN-WHCF SMOF WHITMAN-242-3-2-2
No Objection To Declassification 2009/03/10: NLN-WHCF SMOF WHITMAN-242-3-2-2 CUN t'llJbN ' l 'lAL
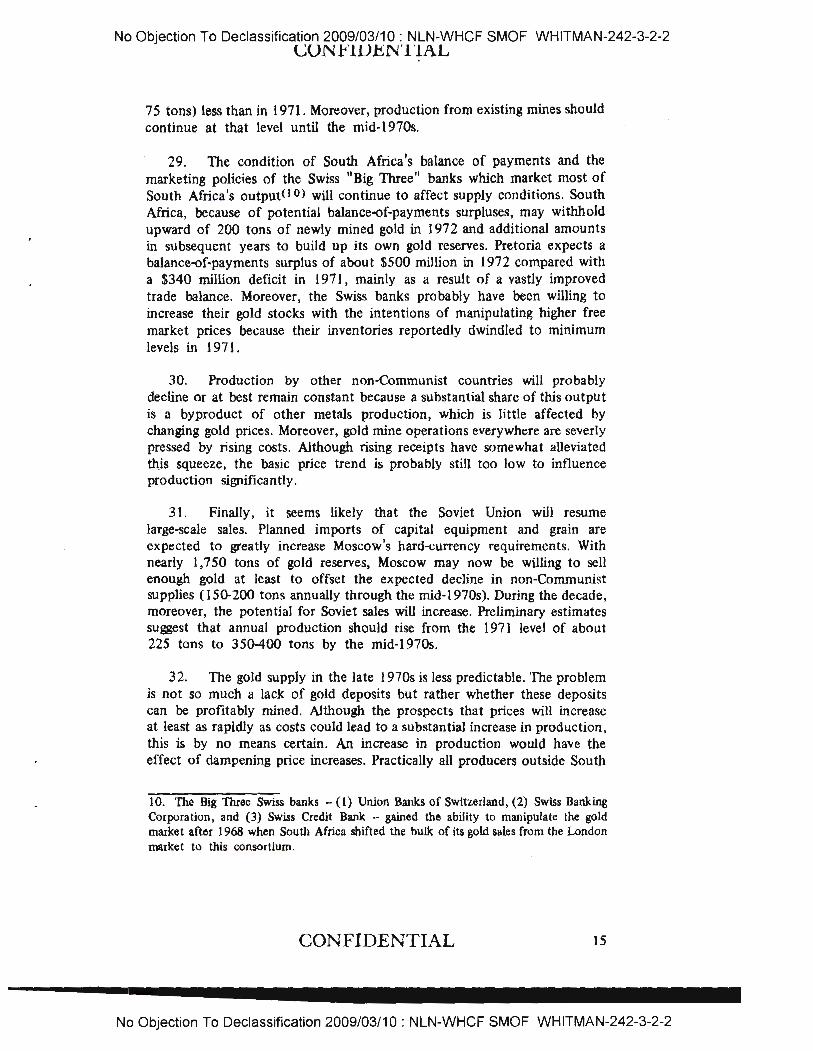
75 tons) less than in 1971. Moreover, production from existing mines should continue at that level until the mid-l 970s.
29. The condition of South Africa's balance of payments and the marketing policies of the Swiss "Big Three" banks which market most of South Africa's output<lO) will continue to affect supply conditions. South Africa, because of potential balance-of-payments surpluses, may withhold upward of 200 tons of newly mined gold in 1972 and additional amounts in subsequent years to build up its own gold reserves. Pretoria expects a balance-of-payments surplus of about $500 million in 1972 compared with a $340 million deficit in 1971, mainly as a result of a vastly improved trade balance. Moreover, the Swiss banks probably have been willing to increase their gold stocks with the intentions of manipulating higher free market prices because their inventories reportedly dwindled to minimum levels in I 971 .
30. Production by other non-Communist countries will probably decline or at best remain constant because a substantial share of this output is a byproduct of other metals production, which is little affected by changing gold prices. Moreover, gold mine operations everywhere are severly pressed by rising costs. Although rising receipts have somewhat alleviated this squeeze, the basic price trend is probably still too low to influence production significantly.
31. Finally, it seems likely that the Soviet Union will resume large-scale sales. Planned imports of capital equipment and grain are expected to greatly increase Moscow's hard-currency requirements. With nearly 1,750 tons of gold reserves, Moscow may now be willing to sell enough gold at least to offset the expected decline in non-Communist supplies (150-200 tons annually through the rnid-1970s). During the decade, moreover, the potential for Soviet sales will increase. Preliminary estimates suggest that annual production should rise from the 1971 level of about 225 tons to 350-400 tons by the mid-l 970s.
32. The gold supply in the late 1970s is Jess predictable. The problem is not so much a lack of gold deposits but rather whether these deposits can be profitably mined. Although the prospects that prices will increase at least as rapidly as costs could lead to a substantial increase in production, this is by no means certain. An increase in production would have the effect of dampening price increases. Practically all producers outside South
10. The Big Three Swiss banks - (1) Union Banks of Switzerland, (2) Swiss Banking Corporation, and (3) Swiss Credit Bank ·· gained the ability to manipulate the gold market after 1968 when South Africa shifted the bulk of its gold sales from the London market to this consortium.
CONFIDENTIAL 15
No Objection To Declassification 2009/03/10: NLN-WHCF SMOF WHITMAN-242-3-2-2

No Objection To Declassification 2009/03/10 : NLN-WHCF SMOF WHITMAN-242-3-2-2 CONFIDENTIAL
Africa depend on government subsidies, and higher prices might result in lower subsidies. Moreover, the South African government largely determines the profitability of its mines through tax policy, and, if dependence on gold to finance balance-of ·payments deficits declines, Pretoria may not encourage an expansion of its gold industry.
Implications
33. A price increase on the order of that envisioned through the mid· l 970s could threaten an end to the two-tier gold market , depending on the shape international monetary reform assumes. If Special Drawing Rights, or some other new form of international reserve asset, were to gain sufficient favor among central banks, then part of the nearly 36,000 tons ($44 billion at $38 an ounce) of gold in official coffers could be sold on the free market. Large-scale sales of gold stock, however, would depress the free market price and reduce the advantages of further sales.
34. Conversely, rising prices may increase gold's attractiveness as a reserve asset and encourage some governments to purchase free market gold. This would be the most likely outcome in the absence of restored confidence in the international monetary system and the viability of alternative reserve forms. Steadily rising prices could dispel a principal argument against gold as a reserve asset. If the free gold market price rose steadily , a country's gold reserves - far from being sterile assets - would indeed increase in market value. Moreover, a combination of sustained dolJar inconvertibility and a rising gold price would tempt some central banks to dispose of excess dollar holdings by using them to purchase free market gold.
16 CONFIDENTIAL
No Objection To Declassification 2009/03/10: NLN-WHCF SMOF WHITMAN-242-3-2-2

No Objection To Declassification 2009/03/10: NLN-WHCF SMOF WHITMAN-242-3-2-2 CUN r'lV.hNTlAL
APPENDIX
Derivation of Estimates
Sources of Consumption Data
There have been several estimates of world basic gold consumption by official and private organizations in recent years. Each has contributed to the store of accumulated knowledge , but each has peculiar shortcomings.
The International Monetary Fund (IMF), the Bank for International Settlements (BIS), and the US Bureau of the Mint publish yearly estimates of commercial gold consumption. None of these claim to have completely reliable information for the entire non-Communist world, particularly the less developed countries. Moreover, all obtain their data from official national authorities. These data are sometimes incomplete, omitting, for example, illegally imported gold.
Two large and comprehensive private studies have been completed and published over the past three years by David Lloyd Jacob of Consolidated G.old Fields Ltd. and L.L.C. Smets of Charter Consolidated Ltd., British firms that own South African gold mining interests. These studies have generated estimates for certain parts of the world for which little or no worthwhile information had existed before. Because of the vested interests of these firms in higher gold prices, however, both may be biased on the high side.
Information from the above sources plus classified sources have been frequently used in this memorandum. Where estimates conflict, the one that appears to fit most closely with other available data was selected. In most cases, the more conservative estimate has been used unless evidence supporting a higher estimate is especially strong. Official estimates are usually considered valid unless there are convincing reasons for disputing them.
The Developed Countries
Several sources have been used in compiling data for North America, Western Europe, and Japan. For most countries, two or more sources have presented conflicting estimates. Table 2 attempts to glean the most reasonable and unbiased national estimates.
CONFIDENTIAL 17
No Objection To Declassification 2009/03/10 : NLN-WHCF SMOF WHITMAN-242-3-2-2

No Objection To Declassification 2009/03/10 : NLN-WHCF SMOF WHITMAN-242-3-2-2 CUNr'!DhN'l'lAL
Government-generated statistics have been used for most, but not all, countries. The figures submitted to either the US Bureau of the Mint or the BIS by the governments of the United States, Canada, Japan, Belgium, Luxembourg, France, the Netherlands, Portugal Sweden, Switzerland, the United Kingdom, Ireland, and West Germany were accepted as valid. In the cases of Greece, Norway, and Denmark, the estimates by the two private studies - neither of which are contentious - fill gaps where no government statistics exist. Although estimates of commercial gold consumption have been submitted by all other national governments, their validity is open to question. In these cases, the findings of either one or the other of the two private studies are considered more accurate.
The estimates for Italian gold consumption are probably the most misleading among all of the government data reviewed. Rome claims that between 30 and 70 tons of gold were consumed annually between I 963 and 1969 ; yet it is widely recognized that these are gross understatements. These totals probably reflect only that amount legally imported for private use. Actually, well over one-half of the gold absorbed is believed to be smuggled from Switzerland. Jewelry manufacturers who purchase the great bulk of the metal avoid three different sets of taxes by smuggling gold. Jacob's estimates for 1968· 70 are probably the best available . For 1970, the Italian government surprisingly presented a figure of 284 tons to the BIS as an estimate for gold consumption. This figure, however, is also suspect.
Spanish government statistics are also too low, the estimates apparently representing reported legal imports of primary gold designated for private commercial use. However, large quantities of gold, probably at least equivalent to legal imports, are smuggled in, mostly from France. Prohibitively small quotas and substantial surtaxes on legal gold imports have prompted large-scale smuggling. Jacob's estimates, which are roughly twice the official figures , appear to be far more realistic.
Estimates provided the US Bureau of the Mint by the Austrian government include only gold used in carat jewelry products, dentistry , and inpustry. The data include only a small part of total commercial consumption, however, because Austria is significant for its very substantial production of gold coins which serve as a highly popular form of hoarding. Again, Jacob's findings, which included gold coin manufacturing, would appear to off er a rather good estimate of total Austrian commercial consumption of gold.
18 CONFIDENTIAL
No Objection To Declassification 2009/03/10 : NLN-WHCF SMOF WHITMAN-242-3-2-2

No Objection To Declassification 2009/03/10: NLN-WHCF SMOF WHITMAN-242-3-2-2 CONFlDENTlAL
The Less Developed Countries
As part of their development programs, most developing countries severely restrict or ban gold trading in an attempt to minimize unproductive utilization of their limited resources. Thus most of their gold demand is met by smuggling, and, consequently, little reliable information exists on gold consumption. Those few countries that allow free gold trade, however, have become regional trading centers, importing gold legally and then reexporting to other countries where its import is illegal. The import statistics of these trading centers - which are fairly reliable - have been used to establish total regional demand,* and the two private studies by Consolidated Gold and Charter Consolidated to estimate the final destination of gold within each region. Only where other intelligence provides compelling reasons to reject the two studies' findings have different estimates been made.
Most gold destined for the Middle East and North Africa passes through Lebanon. Except for some Arabian Peninsula states, Lebanon is the region's only country that allows its residents to trade gold freely. Because reliable data are available on Lebanon's imports, it is possible to make a reasonable estimate of gold absorption in the Middle East. Beirut also sends small amounts of gold out of the region (see Table 6). Additional gold enters the region through Kuwait, Saudi Arabia , and the Trucial States. In these countries, gold imports have declined substantially from earlier years, but in 1970 they still amounted to about 30 tons. About one-half was absorbed locally, with the remainder reexported to the Indian subcontinent and Africa.
Dubai, a tiny isolated sheikdom on the Persian Gulf, is the world's third largest gold market, handling a much larger volume than any other Asian center. Dubai imports from Great Britain and Switzerland and exports to the Indian subcontinent. Dubai normally accounts for some 90% of South Asia's gold imports, which are supplemented by casual smuggling from the Far East, other Middle Eastern markets, and Europe. Dubai's trade is a reasonably accurate indicator of Indian gold imports because practically none of the sheikdom's gold imports are retained or exported elsewhere.
Dubai's gold exports are smuggled by motorized dhow to Pakistan , India, and Sri Lanka, all of which ban gold imports. An estimated 20% of the flow normally goes to Pakistan and a very small amount enters Sri Lanka. Nearly all the imports of Sri Lanka and perhaps one-half of Pakistan's imports are transferred to India.
* The estimates of imports, however, generally represent only organized gold flows that are supplemented by casual smuggling ·· that is, individuals smuggling small amounts on their own initiative. It is impossible to estimate accurately this small volume of gold trading.
CONFIDENTIAL 19
No Objection To Declassification 2009/03/10: NLN-WHCF SMOF WHITMAN-242-3-2-2

No Objection To Declassification 2009/03/10 : NLN-WHCF SMOF WHITMAN-242-3-2-2 CUN~UJ~J"I llf\L
Table 6
Near East - North Africa and South Asia Non-Monetary Gold Trade in 1970 !/
Metric Tons
Imports from outside region 415
Dubai Lebanon Kuwait, Saudi Arabia
and Trucial States Others
Of which: Reexports within region
260 105
30 20
By Dubai 260
To Ceylon 5 To Pakistan 30 To India 225
By Lebanon BS
To Turkey 40 To Libya/Egypt 10 To Iran 10 To other Near East - North African countries 20
To outside Middle East 5
By Kuwait, Saudi Arabia, and Trucial States 15
To Africa (Sudan, Ethiopia, etc.) 5 To South Asia 10
a. Data are rounded to the nearest five tons.
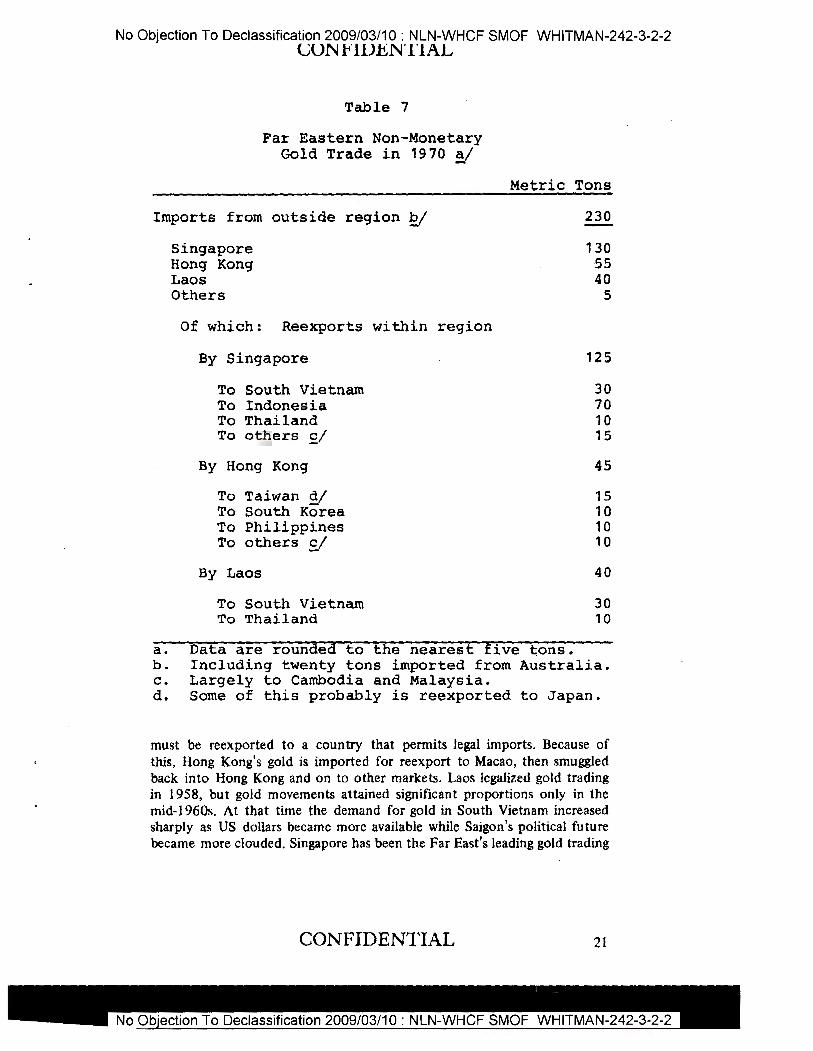
The three major Far Eastern gold trading centers - Hong Kong, Laos, and Singapore - essentially compete for one market (see Table 7). Thus their fortunes are intertwined, and an expansion of one center's trade is often at the expense of the other's trade . Hong Kong-Macao is generally considered the region's most important gold market, but only once from 1965 through 1970 did it import the largest volume of gold. Hong Kong's gold trade is complicated by the legal requirement that all imported gold
20 CONFIDENTIAL
No Objection To Declassification 2009/03/10 : NLN-WHCF SMOF WHITMAN-242-3-2-2 CUNFUJ.hN'l'lAL
Table 7
Far Eastern Non-Monetary Gold Trade in 1970 ~
Imports from outside region £! Singapore Hong Kong Laos Others
Of which: Reexports within region
By Singapore
To South Vietnam To Indonesia To Thailand To others £/
By Hong Kong
To Taiwan d/ To South Korea To Philippines To others g/
By Laos
To South Vietnam To Thailand
Metric Tons
230
130 55 40
5
125
30 70 10 15
45
15 10 10 10
40
30 10
a. Data are rounded to the nearest five tons. b. Including twenty tons imported from Australia. c. Largely to Cambodia and Malaysia. d. Some of this probably is reexported to Japan.
must be reexported to a country that permits legal imports. Because of this, Hong Kong's gold is imported for reexport to Macao, then smuggled back into Hong Kong and on to other markets. Laos legalized gold trading in 1958, but gold movements attained significant proportions only in the mid-1960s. At that time the demand for gold in South Vietnam increased sharply as US dollars became more available while Saigon's political future became more clouded. Singapore has been the Far East's leading gold trading
CONFIDENTIAL 21

No Objection To Declassification 2009/03/10 : NLN-WHCF SMOF WHITMAN-242-3-2-2 t..;UN_ti11J.hN11AL
center since 1969, when gold importation for reexport was legalized, although substantial quantities were undoubtedly traded illegally prior to that time. Because no data are available on Singapore's gold trade before 1970 - in that year it accounted for more than half the region's imports -it is not possible to quantify past gold consumption trends in the Far East.
Little concrete data are available on final use patterns in the Far East. The best estimate of South Vietnam's imports is based on the observation that in 1967 at least two-thirds - almost 50 tons - of Laos' imports were destined for its neighbor. After dropping in 1968, gold imports into South Vietnam almost certainly have more than regained this level. As a result , South Vietnam probably accounts for about one-fourth of the region's imports - about 60 tons in 1970. Indonesia's position as the leading Far Eastern gold-absorbing country derives from its size and a history of economic instability.
Price Elasticity of Demand for Gold
Views of the Experts
Since the free market was established in March 1968, several authorities on gold have attempted to determine the market relationship between the demand and price of gold. The consensus to date is that the price elasticity of demand for private non-speculative gold is about, or slightly below, unity . Included among the authorities who share this belief are David Lloyd Jacob and Peter Fells (Gold 1971 and Gold 1972, Consolidated Gold Fields, I 971 and 1972), Constantine Michalopoulos and Roger Van Tassel (Western Economic Journal, June 1971) and Richard N. Brown (International currency Review, May-July 1971 ).
The overall price elasticity is the weighted sum of the elasticities for the three main use categories - jewelry, dentistry , and industry . The price elasticity for gold jewelry is estimated by Jacob as unity . It accounts for 80% of basic gold consumption in the developed countries and nearly all of the total in the less developed countries. The much lower price elasticities of demand for industrial and dental gold reduce the aggregate elasticity by only a minor degree.
The authorities point out that the near unity aggregate elasticity is supported by a mixture of impressions and statistics. Michalopoulos and Van Tassel based their analysis on results of a large number of interviews and questionnaires involving jewelers, dentists, and electronic and other industrial firms in the United States. Jacob and Fells found that much of the variation in gold consumed for jewelry in the United Kingdom over the period 1961-68 was accounted for by changes in the purchase tax on gold. Regression analysis for that case indicated a price elasticity of - I .1 .
22 CONFIDENTIAL
No Objection To Declassification 2009/03/10 : NLN-WHCF SMOF WHITMAN-242-3-2-2
No Objection To Declassification 2009/03/10 : NLN-WHCF SMOF WHITMAN-242-3-2-2 CONFIDEN'l'lAL
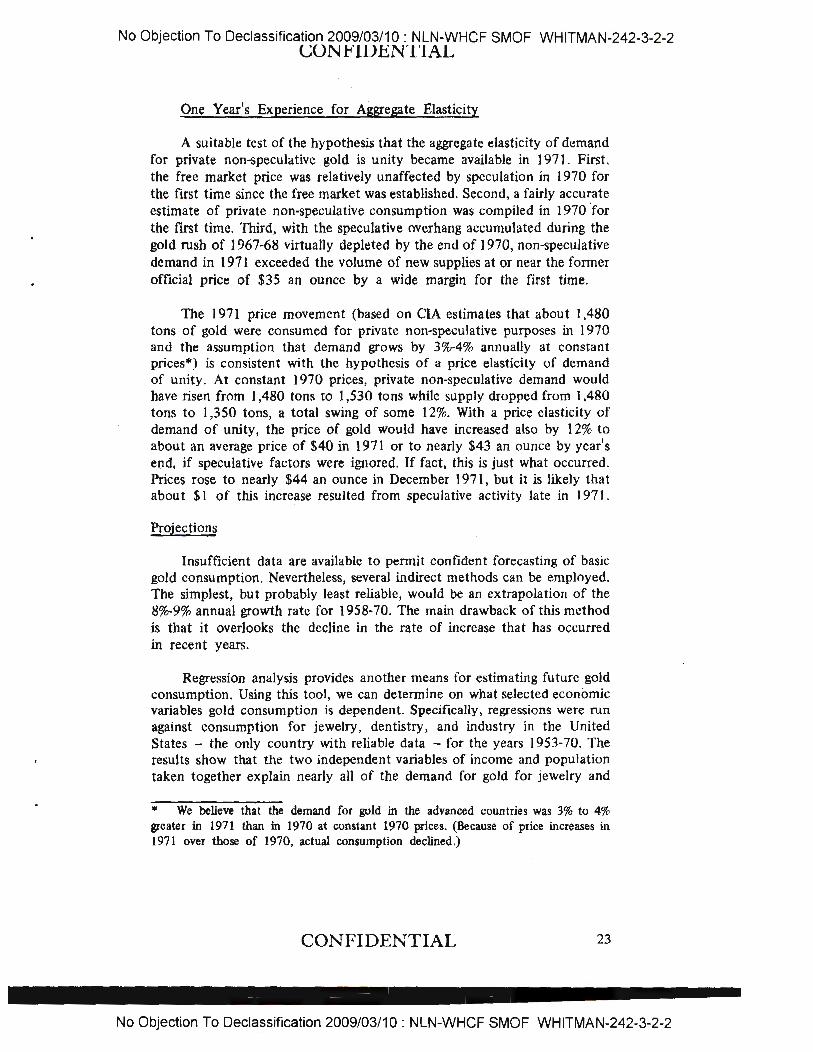
One Year's Experience for Aggregate Elasticity
A suitable test of the hypothesis that the aggregate elasticity of demand for private non-speculative gold is unity became available in 1971. First , the free market price was relatively unaffected by speculation in l 970 for the first time since the free market was established. Second, a fairly accurate estimate of private non-speculative consumption was compiled in 1970 'for the first time. Third, with the speculative overhang accumulated during the gold rush of 1967-68 virtually depleted by the end of 1970, non-speculative demand in 1971 exceeded the volume of new supplies at or near the former official price of $35 an ounce by a wide margin for the first time.
The 1971 price movement (based on CIA estimates that about 1,480 tons of gold were consumed for private non-speculative purposes in 1970 and the assumption that demand grows by 3o/o-4% annually at constant prices*) is consistent with the hypothesis of a price elasticity of demand of unity. At constant l 970 prices, private non-speculative demand would have risen from 1,480 tons to 1,530 tons while supply dropped from l ,480 tons to 1,350 tons, a total swing of some 12%. With a price elasticity of demand of unity , the price of gold would have increased also by 12% to about an average price of $40 in 1971 or to nearly $43 an ounce by year's end, if speculative factors were ignored. If fact, this is just what occurred. Prices rose to nearly $44 an ounce in December 1971, but it is likely that about $I of this increase resulted from speculative activity late in I 971.
Projections
Insufficient data are available to permit confident forecasting of basic gold consumption. Nevertheless, several indirect methods can be employed. The simplest, but probably least reliable, would be an extrapolation of the 8o/o-9% annual growth rate for 1958· 70. The main drawback of this method is that it overlooks the decline in the rate of increase that has occurred in recent years.
Regression analysis provides another means for estimating future gold consumption. Using this tool, we can determine on what selected economic variables gold consumption is dependent. Specifically, regressions were run against consumption for jewelry, dentistry, and industry in the United States - the only country with reliable data - for the years 1953-70. The results show that the two independent variables of income and population taken together explain nearly all of the demand for gold for jewelry and
• We believe that the demand for gold in the advanced countries was 3% to 4% greater in 1971 than in 1970 at constant 1970 prices. (Because of price increases in 1971 over those of 1970, actual consumption declined .)
CONFIDENTIAL 23
No Objection To Declassification 2009/03/10: NLN-WHCF SMOF WHITMAN-242-3-2-2

No Objection To Declassification 2009/03/10 : NLN-WHCF SMOF WHITMAN-242-3-2-2 CONFIDENTIAL
dental consumption. Nevertheless, because of multicollinearity - that is, high intercorrelation between independent variables - it was not possible to quantify this relationship with statistical confidence. It is possible, however, to quantify US industrial demand· for gold against an industrial production index with statistical confidence. The following results were obtained for the United States.
Ci=-180 + 0.21Y + 0.67P (2.55) (3.01) (1.15)
Cd= -40 + 0.02Y + 0.17P + 4M (3.44) (1.29) (1.86)
C;= -65 + 0.75I (14.9) (22.7)
Where :
c =
y =
p =
M =
I
j =
d =
=
Consumption in tons of gold;
US gross domestic product in billion 1963 dollars ;
Population in millions;
Dummy variable for medicare of 3 prior to 1967 and 4 thereafter;
Federal Reserve Board's industrial production index, 1957-59 being 100;
Jewelry consumption;
Dental consumption; and
Industrial consumption
The . terms in .parentheses are the student's t distributions. The terms less than 2 are significant only at about the 75% level, while the other terms are significant at 99% or greater.
The above equations for the United States were used to project demand through 1975 in both the United States and the other advanced countries.*
* Using the gross domestic products of non-US OECD countries in billions of constant 1963 dollars converted at 1963 exchange rates, the population of non-US OECD countries in millions, and industrial production indexes of non-US OECD countries.
24 CONFIDENTIAL
No Objection To Declassification 2009/03/10 : NLN-WHCF SMOF WHITMAN-242-3-2-2

No Objection To Declassification 2009/03/10 : NLN-WHCF SMOF WHITMAN-242-3-2-2 CONFIDENTIAL
These equations appeared to be valid for the period 1953· 70, despite price effects on demand after the two-tier market was established in 1968, because actual price changes through 1970 were relatively small. Conveniently, aggregate income and industrial production in the non-US developed countries were roughly equivalent in size to those of the United States in 1970. By applying the regression formulas to both the United States and the non-US developed countries as a group, assuming the structure of demand in the latter is similar to that in the United States, we derive a projected growth rate of about 7% for total basic gold consumption in the developed countries.
However, this projection is too high for two reasons. First, the growth of non-US demand for gold has been moderately slower than that implied by the regression for the United States. This is because consumption of gold for jewelry and dentistry in these other countries has been somewhat less responsive to changes in income and population than in the United States and because the electronic and aerospace share of industrial production in the other developed countries is smaller than in the United States. Second, future growth rates for all developed countries are likely to be lower than suggested by the regressions of past trends. The consumption of gold for jewelry may be becoming less responsive to changes in income. Furthermore, an expected increased in efficiency by industrial users of gold should reduce the growth in industrial demand. After allowing for the above, we believe the annual rate for gold consumption in the developed countries is more likely to fall within a 5% to 6% range over · the next few years (see Table 8).
The combined regional projections of demand in less developed countries on balance yield a "most likely" annual growth rate forecast of about 1 % (see Table 9). The low estimate assumes a sharp decline in instability in Southeast Asia while the high projection incorporates high demand assumptions for each region. The most likely projection combines a continued high level of consumption in South Vietnam with less optimistic assumptions for the other less developed countries.
CONFIDENTIAL 25

No Objection To Declassification 2009/03/10 : NLN-WHCF SMOF WHITMAN-242-3-2-2
CONFIDENTIAL
Table 8
Projected Advanced Country Demand ~/
Metric Tons
1970 19 75
Commercial 760 980
Jewelry 610 780 Industry 80 120 Dentistry 70 80
Hoarded 40 so
Total basic consumption 800
=-== 1,030
a. Based on the following assumptions:
Annual Increase
(Percent)
5 - 5.5
5 8 3
5 - 5.5
(1) Commercial gold consumption in 1970 was distributed as follows - jewelry, 80%; industry, more than 10%; dentistry, less than 10%. (2) National income will increase 5% a year in the United States and 5.5% a year in the group of other developed countries through 19 75. (3) Population will increase 1.0% a year in the United States and 1.2% a year in the group of other developed countries through 1975. (4) Industrial production will increase 6% a year in the United States and 6.5% a year in the group of other developed countries through 1975. (S) Hoarded gold will average 50 tons a year through 1975. (6) Projections are based on constant 1970 prices.
26 CONFIDENTIAL
No Objection To Declassification 2009/03/10 : NLN-WHCF SMOF WHITMAN-242-3-2-2

No Objection To Declassification 2009/03/10: NLN-WHCF SMOF WHITMAN-242-3-2-2
CONFIDENTIAL
Table 9
Projected Demand in Less Developed Countries ~
Metric Tons
1970 21 1975
Most Adjusted Low High Likely
Near East 115 105 115 105 South Asia 220 230 255 245 Far East 240 185 250 250 Latin America 75 70 80 80 Sub-Saharan
Africa 30 30 35 35
Total 680 625 735 715
Percent
Annual increase -2 +2 +1
a. Projections are based on constant 1970 prices. b. See Table 4.
CONFIDENTIAL 27

a.. l7J~'J.-(. No Objection To Declassification 2009/03/10 : NLN-WHCF SMOF WHITMAN-242-3-2-2 v I .v ;-- ' v / ' I v .... ""
Conftdenti1I
: •
Confid1nti1I
No Objection To Declassification 2009/03/10 : NLN-WHCF SMOF WHITMAN-242-3-2-2