Embed Size (px)
Citation preview

MEMORANDUM
To: Laura Shinn, San Diego State University
From: Sarah Lozano, Katie Laybourn, Jennifer Reed, Nicholas Lorenzen
Subject: SDSU Tula Pavilion and Tenochca Hall Renewal/Refresh -
Air Quality and Greenhouse Gases Technical Memorandum
Date: January 4, 2017
Attachment(s): Figures 1–2
Appendix A, CalEEMod Output Files
Dudek evaluated potential impacts to air quality and greenhouse gases (GHGs) associated
with the proposed San Diego State University (SDSU) Tula Pavilion and Tenochca Hall
Renewal/Refresh (proposed project), located in San Diego, California. This technical
memorandum provides the results of that evaluation.
1 PROJECT LOCATION AND SETTING
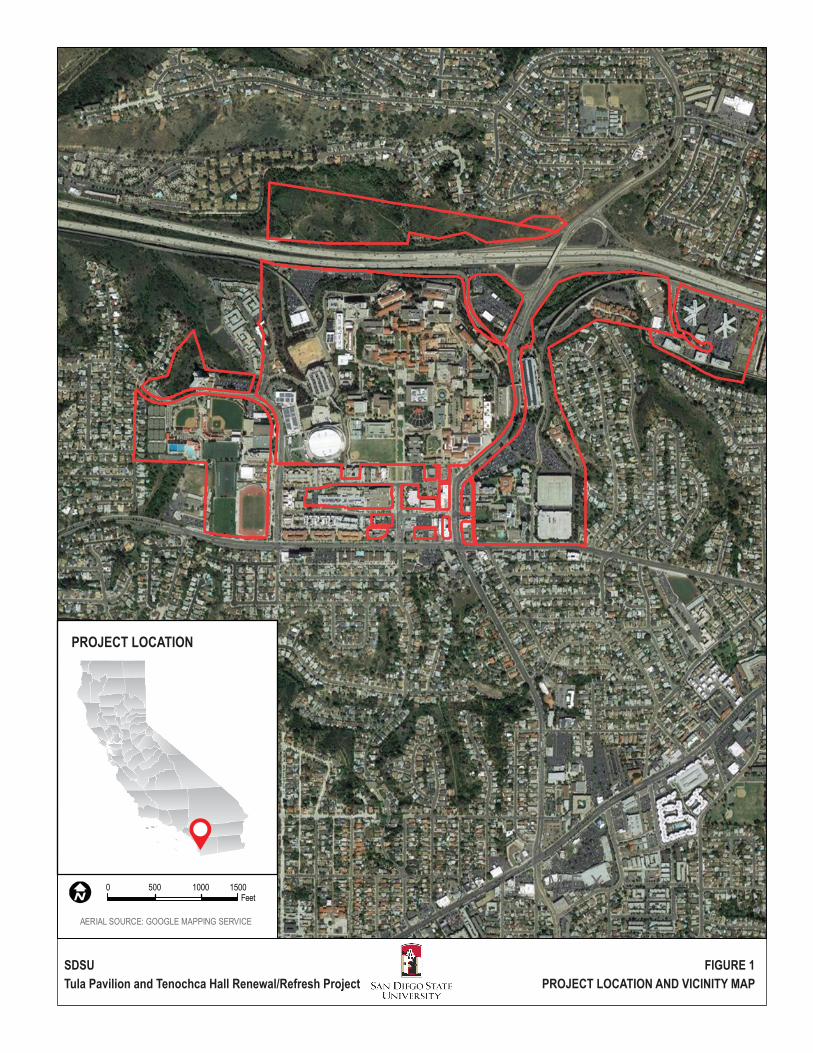
SDSU is located adjacent to Interstate 8 (I-8), approximately 8 miles east of downtown San
Diego (see Figure 1, Regional Map). The SDSU campus is located in the “College Area,” within
the City and County of San Diego, and is surrounded by urban uses, including commercial,
institutional, and medical facilities. The proposed project would be located in the southeastern
portion of the SDSU campus (see Figure 2, Project Site). As described below, the proposed
Tenochca Community Space (TCS) and Tula Pavilion would be constructed on the site of the
demolished Tula/Tenochca Community Center, and the proposed Tula Pavilion would be
constructed to the northwest on the site of a paved walking path at the north end of a service
vehicle parking lot.
2 PROJECT DESCRIPTION
The proposed project, referred to as the “Tula Pavilion and Tenochca Hall Renewal/Refresh,”
involves demolishing the existing Tula/Tenochca Community Center and replacing it with two
separate buildings, the Tula Pavilion and Tenochca Community Space. The proposed Tenochca
Community Space would be two-stories in height and approximately 13,000 gross square feet (gsf)
in size. The proposed Tenochca building would provide a variety of student gathering spaces,
including student lounges, a kitchen for student use, and areas visible to televisions that front the

Memorandum
Subject: SDSU Tula Pavilion and Tenochca Hall Renewal/Refresh - Air Quality and
Greenhouse Gases Technical Memorandum
10018 2 January 2017
outdoor grounds. The proposed Tula Pavilion would be a one-story building and approximately
12,000 gsf. The Tula interior space would include one large assembly space, and an adjoining large
classroom/seminar room that can be divided into three smaller rooms and a banquet room, as well
as a courtyard, which would provide an outdoor venue for private events, and otherwise would be
open to public use and circulation.
The proposed Tenochca Community Space would be constructed at the site of the existing
Tula/Tenochca Community Center and would replace the student common spaces at the
existing Tula/Tenochca Community Center, such as the security check-in point, student lounge
space, laundry and Star Center, and faculty residences. Exterior landscape improvements
would include the expansion of the landscape at the commons side of the building. A new
“Tenochca Backyard” would be created with outdoor room and lawn areas. The existing pool
between the proposed Tenochca Community Space and existing Maya Hall would be enclosed
with new fencing, surrounded by new palm trees, and furnished with new furniture and tables
to create a sense of place at the pool deck. No further renovations to the pool area would be
proposed as part of the project. Construction of the proposed Tenochca Community Space
would require approximately 8,700 square feet (sf) of concrete and approximately 850 cubic
yards (cy) of structural fill.
The proposed Tula Pavilion would replace those spaces that serve public gathering and large
assembly functions at the existing Tula Community Center and would be constructed north of the
existing Tula Community Center on a site presently designated as Parking Lot 4A. The proposed
building also would incorporate exterior elements, including a courtyard on the north end and an
open arcade that wraps around the west side of the building, for a total exterior space of
approximately 6,000 sf. The proposed Tula Pavilion would be constructed as a steel-framed building
with wood roofs, a reinforced concrete foundation system, and stucco exterior. Construction would
require approximately 10,000 sf of concrete and approximately 2,000 cy of backfill.
The anticipated start date for demolition of the Tula Community Center and construction of the
proposed Tula Pavilion and Tenochca Community Space is June 2017, with anticipated
construction duration of 15 months. However, as discussed in section 4, for modeling purposes a
shorter construction timeframe is utilized. The total gross square footage to be demolished is
approximately 20,000 gsf. The total gsf to be constructed is approximately 25,000 gsf of interior
space. See Table 1 for additional project demolition and construction details.

Memorandum
Subject: SDSU Tula Pavilion and Tenochca Hall Renewal/Refresh - Air Quality and
Greenhouse Gases Technical Memorandum
10018 3 January 2017
Table 1
Tula Pavilion and Tenochca Hall Renewal/Refresh Project Details
Tula Community Center Tenochca Community Space Tula Pavilion Project Phase Demolition Construction Construction
Gross square footage (GSF)
19,872 12,638 12,181 + 5,988 (exterior) = 18,169
Stories 2 stories 2 stories 1 story
Project Phase Operation Operation Operation
Uses Lobby
Meeting rooms
Restrooms
Kitchen
Storage
Custodial
“Star Center”
Offices
TV Lounge
Recreation
Laundry
Faculty Apartments
Lobby
Restrooms
Storage
“Star Center”
Offices
TV Lounge
Recreation
Laundry
Faculty Apartments
“Backyard” Outdoor room
Assembly space
Classroom space (3 rooms)
Banquet room
Storage
Custodial
Offices
Mechanical
Restrooms
Kitchen
Courtyard
Arcade
3 EXISTING CONDITIONS
The proposed project site consists entirely of developed land. Additionally, the general vicinity
of the project site is primarily developed, with parking structures and associated roadways
immediately to the east, existing campus buildings to the north and west of the site, and
residential neighborhoods to the south.
Climate and Topography
The weather of the San Diego region, as in most of Southern California is influenced by the
Pacific Ocean and its semi-permanent high-pressure systems that result in dry, warm summers
and mild occasionally wet winters. The average temperature ranges from the mid-40s oF to the
high 90s oF. Most of the region’s precipitation falls from November to April, with infrequent
(approximately 10%) precipitation during the summer. The average seasonal precipitation along
the coast is approximately 10 inches; the amount increases with elevation as moist air is lifted
over the mountains (WRCC 2016a.).

Memorandum
Subject: SDSU Tula Pavilion and Tenochca Hall Renewal/Refresh - Air Quality and
Greenhouse Gases Technical Memorandum
10018 4 January 2017
4 METHODOLOGY
Construction
Criteria air pollutant emissions and GHG emissions resulting from the construction of the proposed
project were estimated using the California Emissions Estimator Model (CalEEMod), Version
2016.3.1. For purposes of modeling, it was assumed that construction would start in June 2017.
Given the size of the project, and using CalEEMod default values for construction activities,
construction of the proposed project was conservatively assumed to require 15 months to complete.
A detailed depiction of the construction schedule including information regarding sub phases,
demolition and equipment used during each sub phase is included in Appendix A of this memo.
The information contained in Appendix A was used as CalEEMod model inputs.
Model defaults were used for construction equipment and scheduling specifications and the
equipment mix is meant to represent a reasonably conservative estimate of construction activity. For
the analysis, it was generally assumed that heavy equipment would be operating at the site for
approximately 8 hours per day, 5 days per week, and 22 days per month during project construction.
Operation
The proposed project would not result in a substantial change in the type of operational activity
occurring on the project site, as compared to the existing Tula Community Center. However, the
change of size/scale of the proposed project, as compared to the existing facilities, could possibly
result in increased air emissions; thus, an analysis of such potential increases was conducted.
The proposed project would result in long-term operational emissions associated with area
sources and energy use. Area sources include the use of consumer products, landscaping
activities, and architectural coating reapplication. Energy use would be associated with
electricity for lighting and water conveyance, treatment, and distribution. Indirect emissions
(primarily GHGs) from project operations would result from electrical usage, water supply (the
energy used to provide water to the project), and solid waste generation. GHG emissions from
electrical usage are produced when energy consumed on the site is generated by fuel combustion
at power plants. GHG emissions from water supply are also indirect emissions resulting from the
energy required to treat and transport water from its source to the proposed project site. Solid
waste emissions are generated when the increased waste generated by the proposed project is
taken to a landfill to decompose. The proposed project would replace existing student facilities,
so existing operational emissions were subtracted from the projected air pollutant and GHG
emissions. CalEEMod default values were used to estimate operational emissions from the

Memorandum
Subject: SDSU Tula Pavilion and Tenochca Hall Renewal/Refresh - Air Quality and
Greenhouse Gases Technical Memorandum
10018 5 January 2017
project’s area, energy, and mobile sources. For water use, consistent with Executive Order B-29-
15, a 25% water use reduction was assumed. Additionally, for solid waste, consistent with AB
341, a 75% solid waste reduction was assumed. Refer to Appendix A for additional information.
5 THRESHOLDS OF SIGNIFICANCE
The significance criteria used to evaluate the project impacts to air quality are based on
Appendix G of the CEQA Guidelines. According to Appendix G of the CEQA Guidelines, a
significant impact related to air quality would occur if the project would:
1. Conflict with or obstruct implementation of the applicable air quality plan.
2. Violate any air quality standard or contribute substantially to an existing or projected air
quality violation.
3. Result in a cumulatively considerable new increase of any criteria pollutant for which the
project region is non-attainment under an applicable federal or state ambient air quality
standard (including releasing emissions which exceed quantitative threshold emissions
which exceed quantitative thresholds for ozone precursors).
4. Expose sensitive receptors to substantial pollutant concentrations.
5. Create objectionable odors affecting a substantial number of people.
The significance criteria used to evaluate the project impacts to greenhouse gas emissions also
are based on Appendix G of the CEQA Guidelines. According to the Appendix G of the CEQA
Guidelines, a significant impact related to greenhouse gases would occur if the project would:
1. Generate greenhouse gas emissions, either directly or indirectly, that may have a
significant impact on the environment
2. Conflict with an applicable plan, policy, or regulation adopted for the purpose of
reducing the emissions of greenhouse gases.
San Diego Air Pollution Control District (SDAPCD) As part of its air quality permitting process, the
SDAPCD has established thresholds in Rule 2.0.2 that require the preparation of Air Quality Impact
Assessments for permitted stationary sources. The SDAPCD sets quantitative emission thresholds
below which a stationary source would not have a significant impact on ambient air quality. While
CSU/SDSU, as a state agency, is not subject to local land use regulations, for the limited purpose of
this analysis, the SDAPCD thresholds will be utilized to assess significant impacts. Thus, project-
related air quality impacts estimated in this environmental analysis would be considered significant if
any of the applicable significance thresholds presented in Table 2 are exceeded.

Memorandum
Subject: SDSU Tula Pavilion and Tenochca Hall Renewal/Refresh - Air Quality and
Greenhouse Gases Technical Memorandum
10018 6 January 2017
Table 2
SDAPCD Air Quality Significance Thresholds
Construction Emissions Pollutant Total Emissions (Pounds per Day)
Respirable particulate matter (PM10) 100
Fine particulate matter (PM2.5) 67
Oxides of nitrogen (NOx) 250
Oxides of sulfur (SOx) 250
Carbon monoxide (CO) 550
Volatile organic compounds (VOC) 75a
Operational Emissions
Pollutant
Total Emissions
Pounds per Hour Pounds per Day Tons per Year
Respirable particulate matter (PM10) — 100 15
Fine particulate matter (PM2.5) — 67 10
Oxides of nitrogen (NOx) 25 250 40
Sulfur oxides (SOx) 25 250 40
Carbon monoxide (CO) 100 550 100
Lead and lead compounds — 3.2 0.6
Volatile organic compounds (VOC) — 75a 13.7
Source: SDAPCD Rules 1501 (SDAPCD 1995) and 20.2(d)(2) (SDAPCD 2016b). a VOC threshold based on the threshold of significance for VOCs from the South Coast Air Quality Management District for the Coachella
Valley as stated in the San Diego County Guidelines for Determining Significance.
For use in California Environmental Quality Act (CEQA) purposes, the thresholds listed in Table 2
represent screening-level thresholds that can be used to evaluate whether project-related emissions
could cause a significant impact on air quality. Emissions below the screening-level thresholds would
not cause a significant impact. In the event that emissions exceed these thresholds, modeling would
be required to demonstrate that the proposed project’s total air quality impacts would result in
ground-level concentrations that are below the California Ambient Air Quality Standards and
National Ambient Air Quality Standards, including appropriate background levels. For
nonattainment pollutants, if emissions exceed the thresholds shown in Table 2, the proposed project
could have the potential to result in a cumulatively considerable net increase in these pollutants, and
thus, could have a significant impact on ambient air quality.
Additionally, the following rules and regulations apply to all sources in the jurisdiction of SDAPCD:
SDAPCD Regulation IV: Prohibitions; Rule 51: Nuisance. Prohibits the discharge,
from any source, of such quantities of air contaminants or other materials that cause or
Memorandum
Subject: SDSU Tula Pavilion and Tenochca Hall Renewal/Refresh - Air Quality and
Greenhouse Gases Technical Memorandum
10018 7 January 2017
have a tendency to cause injury, detriment, nuisance, annoyance to people and/or the
public, or damage to any business or property (SDAPCD 1969).
SDAPCD Regulation IV: Prohibitions; Rule 55: Fugitive Dust. Regulates fugitive
dust emissions from any commercial construction or demolition activity capable of
generating fugitive dust emissions, including active operations, open storage piles, and
inactive disturbed areas, as well as track-out and carry-out onto paved roads beyond a
project site (SDAPCD 2009b).
SDAPCD Regulation IV: Prohibitions; Rule 67.0.1: Architectural Coatings. Requires
manufacturers, distributors, and end users of architectural and industrial maintenance
coatings to reduce VOC emissions from the use of these coatings, primarily by placing
limits on the VOC content of various coating categories (SDAPCD 2015).
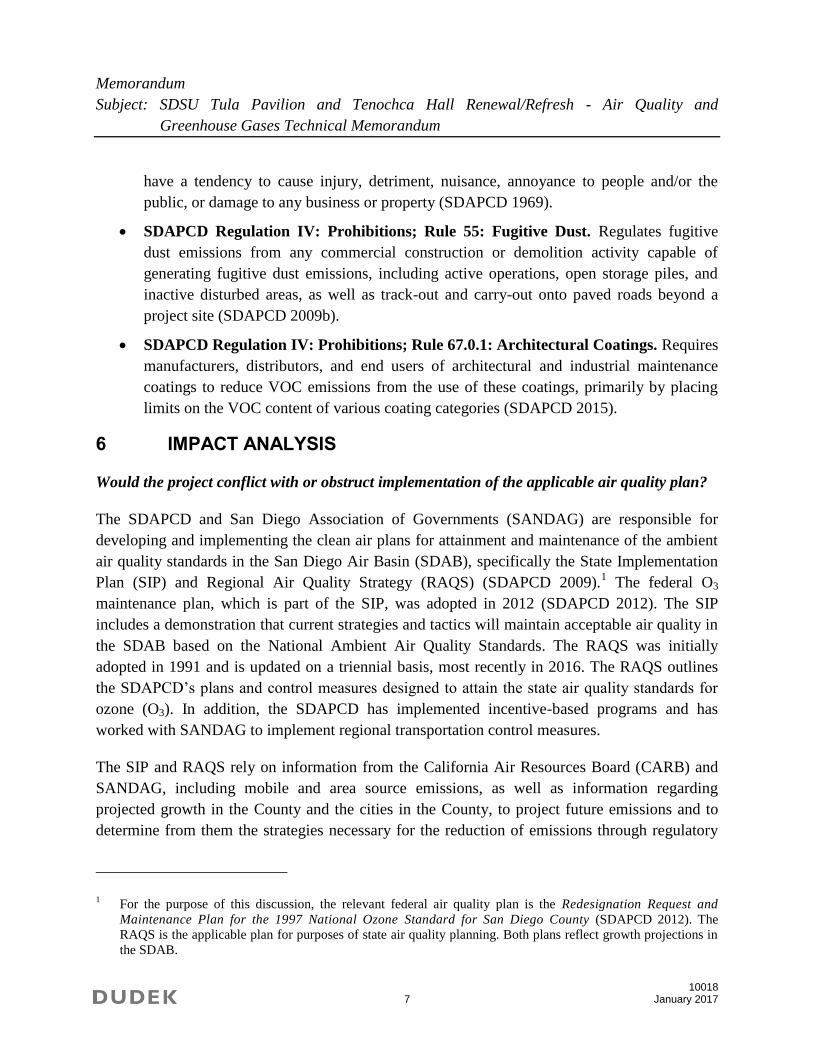
6 IMPACT ANALYSIS
Would the project conflict with or obstruct implementation of the applicable air quality plan?
The SDAPCD and San Diego Association of Governments (SANDAG) are responsible for
developing and implementing the clean air plans for attainment and maintenance of the ambient
air quality standards in the San Diego Air Basin (SDAB), specifically the State Implementation
Plan (SIP) and Regional Air Quality Strategy (RAQS) (SDAPCD 2009).1 The federal O3
maintenance plan, which is part of the SIP, was adopted in 2012 (SDAPCD 2012). The SIP
includes a demonstration that current strategies and tactics will maintain acceptable air quality in
the SDAB based on the National Ambient Air Quality Standards. The RAQS was initially
adopted in 1991 and is updated on a triennial basis, most recently in 2016. The RAQS outlines
the SDAPCD’s plans and control measures designed to attain the state air quality standards for
ozone (O3). In addition, the SDAPCD has implemented incentive-based programs and has
worked with SANDAG to implement regional transportation control measures.
The SIP and RAQS rely on information from the California Air Resources Board (CARB) and
SANDAG, including mobile and area source emissions, as well as information regarding
projected growth in the County and the cities in the County, to project future emissions and to
determine from them the strategies necessary for the reduction of emissions through regulatory
1 For the purpose of this discussion, the relevant federal air quality plan is the Redesignation Request and
Maintenance Plan for the 1997 National Ozone Standard for San Diego County (SDAPCD 2012). The
RAQS is the applicable plan for purposes of state air quality planning. Both plans reflect growth projections in
the SDAB.

Memorandum
Subject: SDSU Tula Pavilion and Tenochca Hall Renewal/Refresh - Air Quality and
Greenhouse Gases Technical Memorandum
10018 8 January 2017
controls. CARB mobile source emission projections and SANDAG growth projections are based
on population, vehicle trends, and land use plans developed by the County and the cities in the
County as part of the development of their general plans.
If a project proposes development that is greater than anticipated in the local plan and
SANDAG’s growth projections, the project might be in conflict with the SIP and RAQS and may
contribute to a potentially significant cumulative impact on air quality.
As proposed, the project – which calls for the targeted redevelopment of a discrete portion of the
campus – would not result in regional growth that is not accounted for in the RAQS and the SIP
because the purpose of the project is not to accommodate additional student growth at the campus but
rather provide more updated amenities and services to the existing student population. Specifically,
the proposed project would not generate new operational vehicle trips that are otherwise unaccounted
for in CARB’s mobile source emission projections and would not generate new population growth
that is otherwise unaccounted for in SANDAG’s growth projections; as such, the proposed project
would not conflict with the projected emission trends provided in the RAQS and the SIP. Therefore,
the proposed project would be consistent at a regional level with the underlying growth forecasts in
the RAQS and the SIP. Impacts would be less than significant.
Would the project violate any air quality standard or contribute substantially to an existing or
projected air quality violation?
Construction of the proposed project would result in a temporary addition of pollutants to the
local airshed caused by fugitive dust emissions, as well as combustion pollutants from on-site
construction equipment and off-site trucks hauling demolition debris and construction materials.
Construction emissions can vary substantially from day to day, depending on the level of
activity, the specific type of operation, and, for dust, the prevailing weather conditions. Fugitive
dust (i.e., particulate matter with an aerodynamic diameter equal to or less than 10 microns
(PM10) and particulate matter with an aerodynamic diameter equal to or less than 2.5 microns
(PM2.5)) emissions would primarily result from grading and site preparation activities. Oxides of
nitrogen (NOx) and carbon monoxide (CO) emissions would primarily result from the use of
construction equipment and motor vehicles.
Emissions resulting from the construction phase of the proposed project were estimated using
CalEEMod. For the purposes of emissions modeling, it was assumed that construction of the
proposed project would begin in summer of 2017 and be completed in Summer 2018. Detailed
assumptions are provided in Section 2, Project Construction Assumptions, and in Appendix A.
Memorandum
Subject: SDSU Tula Pavilion and Tenochca Hall Renewal/Refresh - Air Quality and
Greenhouse Gases Technical Memorandum
10018 9 January 2017
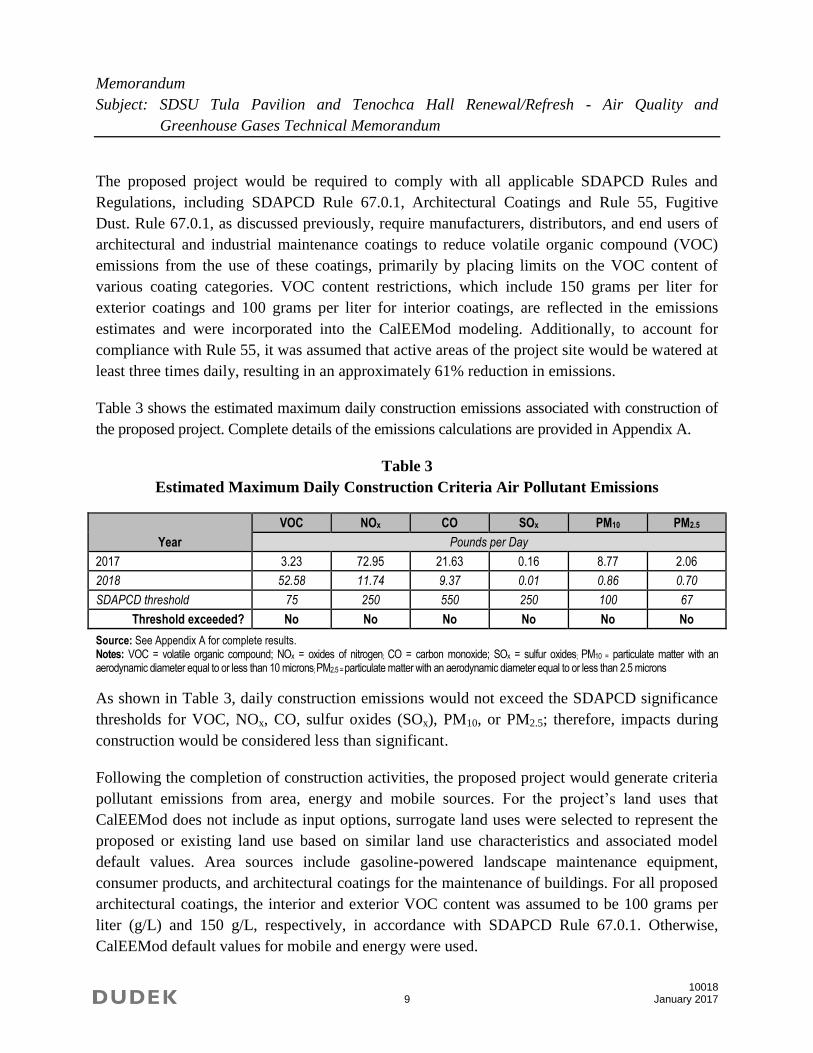
The proposed project would be required to comply with all applicable SDAPCD Rules and
Regulations, including SDAPCD Rule 67.0.1, Architectural Coatings and Rule 55, Fugitive
Dust. Rule 67.0.1, as discussed previously, require manufacturers, distributors, and end users of
architectural and industrial maintenance coatings to reduce volatile organic compound (VOC)
emissions from the use of these coatings, primarily by placing limits on the VOC content of
various coating categories. VOC content restrictions, which include 150 grams per liter for
exterior coatings and 100 grams per liter for interior coatings, are reflected in the emissions
estimates and were incorporated into the CalEEMod modeling. Additionally, to account for
compliance with Rule 55, it was assumed that active areas of the project site would be watered at
least three times daily, resulting in an approximately 61% reduction in emissions.
Table 3 shows the estimated maximum daily construction emissions associated with construction of
the proposed project. Complete details of the emissions calculations are provided in Appendix A.
Table 3
Estimated Maximum Daily Construction Criteria Air Pollutant Emissions
Year VOC NOx CO SOx PM10 PM2.5
Pounds per Day
2017 3.23 72.95 21.63 0.16 8.77 2.06
2018 52.58 11.74 9.37 0.01 0.86 0.70
SDAPCD threshold 75 250 550 250 100 67
Threshold exceeded? No No No No No No Source: See Appendix A for complete results. Notes: VOC = volatile organic compound; NOx = oxides of nitrogen; CO = carbon monoxide; SOx = sulfur oxides; PM10 = particulate matter with an aerodynamic diameter equal to or less than 10 microns; PM2.5 = particulate matter with an aerodynamic diameter equal to or less than 2.5 microns
As shown in Table 3, daily construction emissions would not exceed the SDAPCD significance
thresholds for VOC, NOx, CO, sulfur oxides (SOx), PM10, or PM2.5; therefore, impacts during
construction would be considered less than significant.
Following the completion of construction activities, the proposed project would generate criteria
pollutant emissions from area, energy and mobile sources. For the project’s land uses that
CalEEMod does not include as input options, surrogate land uses were selected to represent the
proposed or existing land use based on similar land use characteristics and associated model
default values. Area sources include gasoline-powered landscape maintenance equipment,
consumer products, and architectural coatings for the maintenance of buildings. For all proposed
architectural coatings, the interior and exterior VOC content was assumed to be 100 grams per
liter (g/L) and 150 g/L, respectively, in accordance with SDAPCD Rule 67.0.1. Otherwise,
CalEEMod default values for mobile and energy were used.

Memorandum
Subject: SDSU Tula Pavilion and Tenochca Hall Renewal/Refresh - Air Quality and
Greenhouse Gases Technical Memorandum
10018 10 January 2017
Table 4, Estimated Maximum Daily Operational Criteria Air Pollutant Emissions, summarizes
the average daily area, energy and mobile emissions of criteria pollutants that would be
generated by the proposed project, as well as emissions associated with existing land uses. The
values shown are the maximum summer or winter daily emissions results from CalEEMod.
Complete details of the emissions calculations are provided in Appendix A.
Table 4
Estimated Maximum Daily Operational Criteria Air Pollutant Emissions
Emission Source VOC NOx CO SOx PM10 PM2.5
Pounds per Day
Proposed Project
Area 0.61 0.00 0.01 0.00 0.00 0.00
Energy 0.03 0.24 0.20 0.00 0.02 0.02
Mobile 0.99 4.09 11.34 0.03 2.56 0.71
Total 1.62 4.33 11.55 0.03 2.58 0.73 Existing Land Uses
Area 0.55 0.00 0.01 0.00 0.00 0.00
Energy 0.02 0.22 0.19 0.00 0.02 0.02
Mobile 1.98 6.45 23.82 0.05 1.73 0.56
Total 2.56 6.67 24.02 0.05 1.75 0.58 Net Change -0.94 -2.34 -12.47 -0.02 0.83 0.15
SDAPCD threshold 75 250 550 250 100 67
Threshold exceeded? No No No No No No Source: See Appendix A for complete results. Notes: VOC = volatile organic compound; NOx = oxides of nitrogen; CO = carbon monoxide; SOx = sulfur oxides; PM10 = particulate matter with an aerodynamic diameter equal to or less than 10 microns; PM2.5 = particulate matter with an aerodynamic diameter equal to or less than 2.5 microns
As shown in Table 4, daily operational emissions from the proposed project would not exceed
the SDAPCD significance thresholds for VOC, NOx, CO, SOx, PM10, or PM2.5 and would
actually lead to fewer emissions than existing facilities except for PM10 and PM2.5, which have
only nominal increases (i.e., increases that amount to less than one additional pound per day of
each pollutant). Therefore, operational emissions would be considered less than significant.

Memorandum
Subject: SDSU Tula Pavilion and Tenochca Hall Renewal/Refresh - Air Quality and
Greenhouse Gases Technical Memorandum
10018 11 January 2017
Would the project result in a cumulatively considerable new increase of any criteria pollutant
for which the project region is non-attainment under an applicable federal or state ambient air
quality standard (including releasing emissions which exceed quantitative threshold emissions
which exceed quantitative thresholds for ozone precursors?
In analyzing cumulative impacts from the proposed project, the analysis must specifically
evaluate a project’s contribution to the cumulative increase in pollutants for which the SDAB is
designated as nonattainment for the California Ambient Air Quality Standards and National
Ambient Air Quality Standards. If the proposed project does not exceed regional thresholds and
is determined to have less-than-significant project-specific impacts, it may still contribute to a
significant cumulative impact on air quality if the emissions from the proposed project, in
combination with the emissions from other proposed or reasonably foreseeable future projects,
are in excess of established thresholds. However, the proposed project would only be considered
to have a significant cumulative impact if the proposed project’s contribution accounts for a
significant proportion of the cumulative total emissions (i.e., it represents a “cumulatively
considerable contribution” to the cumulative air quality impact).
The SDAB has been designated as a federal nonattainment area for O3 and a state nonattainment
area for O3, PM10, and PM2.5. PM10 and PM2.5 emissions associated with construction generally
result in localized impacts. The nonattainment status is the result of cumulative emissions from
all sources of these air pollutants and their precursors in the SDAB. As discussed above, the
emissions of all criteria pollutants would be substantially below the significance levels.
Construction would be short-term and temporary in nature. Once construction is completed,
construction-related emissions would cease. Operational emissions generated by the proposed
project would be negligible or result in an improvement in air quality relative to existing
conditions, and would not result in a significant impact. As such, the proposed project would
result in less-than-significant cumulative impacts to air quality.
The RAQS and the SIP rely on SANDAG growth projections based on population, vehicle
trends, and land use plans developed by the cities and by the County as part of the development
of their general plans. As previously noted, the proposed project would replace existing facilities
and would not result in regional growth not accounted for in the RAQS and the SIP. Specifically,
the proposed project would not generate additional operational vehicle trips and would not
conflict with the projected emission trends provided in the RAQS and the SIP. Additionally, the
proposed project is consistent with the existing land use designation; thus, it would be consistent
at a regional level with the underlying growth forecasts in the RAQS and the SIP. As a result, the
proposed project would not result in a cumulatively considerable contribution to regional O3
concentrations. Cumulative impacts would be considered less than significant.

Memorandum
Subject: SDSU Tula Pavilion and Tenochca Hall Renewal/Refresh - Air Quality and
Greenhouse Gases Technical Memorandum
10018 12 January 2017
Would the project expose sensitive receptors to substantial pollutant concentrations?
In addition to regional impacts from criteria pollutants, the proposed project would have the
potential of resulting in localized impacts from emissions of pollutants identified by the state and
federal government as toxic air contaminants (TACs) or hazardous air pollutants, respectively, as
well as CO hotspots.
Toxic Air Contaminants
State law established the framework for California’s toxic air contaminants (TAC) identification
and control program, which is generally more stringent than the federal program and is aimed at
TACs that are a problem in California. Health effects from carcinogenic air toxics are usually
described in terms of cancer risk. The SDAPCD recommends an incremental cancer risk threshold
of 10 in a million. “Incremental cancer risk” is the likelihood that a person continuously exposed to
concentrations of TACs resulting from a project over a 70-year lifetime will contract cancer based
on the use of standard risk-assessment methodology.
The greatest potential for TAC emissions during construction would be diesel particulate
emissions from heavy equipment operations and heavy-duty trucks and the associated health
impacts to sensitive receptors. The closest sensitive receptors to the proposed project would
be residents of apartments located along Hardy Avenue, approximately 500 feet southwest of
the proposed project site. The proposed project would not require the extensive use of heavy-
duty construction equipment, which is subject to a CARB Airborne Toxics Control Measure
for in-use diesel construction equipment to reduce diesel particulate emissions, and would
not involve extensive use of diesel trucks, which are also subject to a CARB Airborne Toxics
Control Measure. Total active construction of the proposed project would take approximately
330 days, after which project-related diesel exhaust emissions would cease. In regards to
long-term operations, the proposed project would not result in the generation of TACs as no
sources of TACs would be associated with project operations.
Overall, the proposed project would not result in a long-term (i.e., 70-year) source of TAC
emissions. No residual diesel exhaust TAC emissions and corresponding cancer risk are
anticipated after construction, and no long-term sources of TAC emissions are anticipated during
operation of the proposed project. As such, the exposure of project-related TAC emission
impacts to sensitive receptors would be less than significant.

Memorandum
Subject: SDSU Tula Pavilion and Tenochca Hall Renewal/Refresh - Air Quality and
Greenhouse Gases Technical Memorandum
10018 13 January 2017
Carbon Monoxide Hotspots
Due to the temporary operation of equipment in any one area, construction would not emit
CO in quantities that could pose health concerns. Additionally, as depicted in Table 4, the
proposed project would generate negligible CO emissions (i.e., 11.55 pounds per day
compared to the threshold amount of 550 pounds per day). Exposure of sensitive receptors to
CO would be less than significant.
The traffic report conducted by Linscott Law & Greenspan (LLG), Traffic Engineers
analyzed construction related impacts because LLG determined that the proposed project
would not generate operational traffic trips, which is the main source of CO emissions (LLG
2016). Because the traffic analysis found that the project would not adversely impact
conditions at relevant intersections during operation of the proposed project, exposure of
sensitive receptors to CO would be less than significant.
Would the project create objectionable odors affecting a substantial number of people?
Odors would be generated from vehicles and/or equipment exhaust emissions during
construction of the proposed project. Odors produced during construction would be attributable
to concentrations of unburned hydrocarbons from tailpipes of construction equipment. Such
odors are temporary and generally occur at magnitudes that would not affect substantial numbers
of people. Therefore, impacts associated with odors during construction would be considered less
than significant.
Land uses and industrial operations typically associated with odor complaints include
agricultural uses, wastewater treatment plants, food processing plants, chemical plants,
composting, refineries, landfills, dairies, and fiberglass molding. Because proposed project
involves university community and assembly spaces, it would not result in the creation of a
land use that is commonly associated with substantial odors. Therefore, project operations
would result in an odor impact that is less than significant. (SCAQMD 1993).
Would the project generate greenhouse gas emissions, either directly or indirectly, that
may have a significant impact on the environment?
Neither the State of California, the SDAPCD nor CSU/SDSU have adopted quantitative
emission-based thresholds for GHG emissions under CEQA. OPR’s Technical Advisory titled
CEQA and Climate Change: Addressing Climate Change through California Environmental
Quality Act (CEQA) Review states that “public agencies are encouraged but not required to adopt
thresholds of significance for environmental impacts. Even in the absence of clearly defined

Memorandum
Subject: SDSU Tula Pavilion and Tenochca Hall Renewal/Refresh - Air Quality and
Greenhouse Gases Technical Memorandum
10018 14 January 2017
thresholds for GHG emissions, the law requires that such emissions from CEQA projects must
be disclosed and mitigated to the extent feasible whenever the lead agency determines that the
project contributes to a significant, cumulative climate change impact” (OPR 2008).
Furthermore, the advisory document indicates in the third bullet item on page 6 that “in the
absence of regulatory standards for GHG emissions or other scientific data to clearly define what
constitutes a ‘significant impact,’ individual lead agencies may undertake a project-by-project
analysis, consistent with available guidance and current CEQA practice.”
Short-term construction and long-term operational GHG emissions associated with project
development were estimated using CalEEMod. Construction-related emissions over the full buildout
duration were amortized assuming a 30-year development life after completion of construction. 2
As shown, in Table 5, the estimated GHG emissions generated during project construction would
be approximately 90 MT CO2E in 2017, or 3 MT CO2E per year if annualized over 30 years.
Because there is no separate GHG threshold for construction, the evaluation of significance is
discussed in the following operational emissions analysis.
Table 5
Estimated Annual Construction GHG Emissions
Year CO2 CH4 N2O CO2E
MT/year
2017 89.79 0.02 0.00 90.01
Annualized Construction Emissions 3.00
In regards to operations, GHG emissions from energy consumption (electricity and natural gas),
mobile sources (vehicles), solid waste, and other sources (including area sources and water
conveyance) were estimated. Table 6 presents an estimate of the proposed project’s construction
and operational GHG emissions, as well as emissions associated with existing land uses.
Complete details of the emissions calculations are provided in Appendix A.
2 The South Coast Air Quality Management District (SCAQMD) and City of San Diego recommend construction
emissions be amortized over a 30-year period.

Memorandum
Subject: SDSU Tula Pavilion and Tenochca Hall Renewal/Refresh - Air Quality and
Greenhouse Gases Technical Memorandum
10018 15 January 2017
Table 6
Estimated Annual Operational GHG Emissions
Emission Source CO2 CH4 N2O CO2E
Metric Tons per Year
Proposed Project
Area 0.00 0.00 0.00 0.00
Energy 122.22 0.01 0.00 122.77
Mobile 417.02 0.02 0.00 417.64
Solid waste 6.10 0.36 0.00 15.12
Water supply and wastewater 7.86 0.00 0.00 8.09
Total 546.89 0.39 0.00 563.62 Existing
Area 0.00 0.00 0.00 0.00
Energy 113.69 0.01 0.00 114.19
Mobile 305.48 0.04 0.00 306.36
Solid waste 4.40 0.26 0.00 10.90
Water supply and wastewater 4.69 0.02 0.00 5.18
Total 428.26 0.13 0.00 436.63
Net increase (Proposed project minus Existing) 126.99 Amortized construction emissions 3.10
Net increase (Proposed project minus Existing) + amortized construction total 130.09 Source: See Appendix A for detailed assumptions and results. Notes: Annualized construction emissions represent emissions amortized over 30 years. CO2E = carbon dioxide equivalent; GHG = greenhouse gas
Although CSU/SDSU has not established official thresholds for GHG emissions, the City of San
Diego issued guidance that includes a screening threshold of 900 MT CO2E per year, which is
used for the limited purposes of analyzing GHG emissions from the proposed project (City of
San Diego 2010). Additionally, screening GHG thresholds used in other jurisdictions include the
Bay Area Air Quality Management District’s (BAAQMD’s) interim threshold of 1,100 MT
CO2E per year for commercial, industrial, and public land-use projects (2010); the Sacramento
Metropolitan Air Quality Management District’s threshold of 1,100 MT CO2E per year for
projects with construction or operational phases (2014); and the South Coast Air Quality
Management District’s draft, interim threshold of 3,000 MT CO2E per year for residential and
commercial projects (2008).
As shown in Table 6, the proposed project would result in a net increase of 130 MT CO2E per
year relative to existing conditions. Because the net increase is below all of the identified
screening thresholds, impacts would be less than significant.

Memorandum
Subject: SDSU Tula Pavilion and Tenochca Hall Renewal/Refresh - Air Quality and
Greenhouse Gases Technical Memorandum
10018 16 January 2017
Would the project conflict with an applicable plan, policy, or regulation adopted for the
purpose of reducing the emissions of greenhouse gases?
In June 2005, Governor Schwarzenegger established California’s guiding framework for GHG
emissions reduction targets in Executive Order S-3-05. The Executive Order established the
following goals: GHG emissions should be reduced to 2000 levels by 2010, GHG emissions
should be reduced to 1990 levels by 2020, and GHG emissions should be reduced to 80% below
1990 levels by 2050. In furtherance of the goals established in Executive Order S-3-05, the
legislature enacted Assembly Bill (AB) 32 (Núñez and Pavley) in 2006 and Senate Bill (SB) 32
in 2016. AB 32 requires the state to return to its 1990 emissions level by 2020, and SB 32
requires the state to reduce its emissions 40% below the 1990 level by 2030.
In 2014, CARB adopted the First Update to the Climate Change Scoping Plan: Building on the
Framework (First Update). The stated purpose of the First Update is to “highlight California’s
success to date in reducing its GHG emissions and lay the foundation for establishing a broad
framework for continued emission reductions beyond 2020, on the path to 80% below 1990 levels
by 2050.” The First Update found that California is on track to meet the 2020 emissions reduction
mandate established by AB 32, and noted that California could reduce emissions further by 2030 to
levels squarely in line with those needed to stay on track to reduce emissions to 80% below 1990
levels by 2050 if the state realizes the expected benefits of existing policy goals.
In this case, because the proposed project would not exceed any of the identified screening
thresholds, and because the proposed project would adhere to all applicable regulatory
compliance measures, the proposed project would not conflict with GHG reduction goals for
California established by Executive Order S-3-05, AB 32 and SB 32. Further, although
CSU/SDSU has not established an official climate action plan, CSU and SDSU have
implemented sustainability strategies and programs to reduce energy consumption, water
consumption, and solid waste generation, all of which reduce GHG emissions associated with
activities throughout the CSU system and on the SDSU campus in accordance with the policy of
the state’s executive branch.
Additionally, while the proposed project is not required to comply with the City of San Diego’s
Climate Action Plan (CAP), an analysis of the project’s consistency with the City’s CAP is
included below for disclosure.
The City CAP includes five strategies to reduce City-wide GHG emissions and to achieve
reduction targets for the years 2020 and 2035: (City of San Diego 2015)
1. Energy & Water Efficient Buildings

Memorandum
Subject: SDSU Tula Pavilion and Tenochca Hall Renewal/Refresh - Air Quality and
Greenhouse Gases Technical Memorandum
10018 17 January 2017
2. Clean & Renewable Energy
3. Bicycling, Walking, Transit & Land Use
4. Zero Waste (Gas & Waste Management)
5. Climate Resiliency
Each of the City’s CAP strategies includes goals to identify ways to reduce GHG emissions. The
CAP Consistency Checklist, adopted July 12, 2016, is the primary document used by the City of
San Diego to ensure project-by-project consistency with the underlying assumptions in the CAP
and that the City would achieve its emission reduction targets identified in the CAP. The CAP
Checklist includes a 3-step process to determine project consistency. (City of San Diego 2016)
Step 1 consists of an evaluation to determine the project’s consistency with existing General
Plan, Community and zoning designations. Because the proposed project is not within the CAP’s
jurisdiction, step 1 would not be applicable to the project.
Step 2 consists of an evaluation of the project’s consistency with the five goals and the
applicable strategies of the CAP, discussed above.
The CAP’s first strategy is aimed at energy and water efficient buildings through the adoption of
ordinances and plans. The proposed project would not conflict with the City’s ability to
implement the actions identified in the CAP. In addition, the project would comply with various
statewide and CSU/SDSU measures to reduce water usage including but not limited to,
CALGreen requirements for institutional structures and Executive Order B-29-15, which
requires a statewide reduction on potable urban water use of 25% relative to water use in 2015.
Further, the proposed project would be required to comply with Title 24, which serves to
enhance and regulate California’s building standards. The most recent amendments, referred to
as the 2016 standards, become effective on January 1, 2017. Finally, the proposed project would
be designed to meet a minimum of Leadership in Energy and Environmental Design (LEED)
Silver certification or equivalent.
Strategy two focuses on clean and renewable energy. Actions under this strategy include
increasing the number of municipal zero emission vehicles and natural gas vehicles. These
actions would not apply to implementation of the project. Currently, the potential measure
requiring construction to install conduit for future photovoltaics and electric vehicle charging
stations has not been proposed by the City staff or adopted by City Council. Nonetheless, while
the proposed project does not include any plans for solar installations, the SDSU campus as a
whole has several solar installations and EV charging stations.

Memorandum
Subject: SDSU Tula Pavilion and Tenochca Hall Renewal/Refresh - Air Quality and
Greenhouse Gases Technical Memorandum
10018 18 January 2017
Strategy three outlines goals and actions related to bicycling, walking, transit and land use. Goals
include increasing the use of mass transit, increasing commuter walking and bicycling
opportunities, reducing vehicle fuel consumption and promoting effective land use to reduce
vehicle miles traveled. The project would not conflict or impede with strategy 3. Additionally, a
substantial bike trail system and mass transit options are already in place on the SDSU campus.
Strategy four, which focuses on zero waste, includes the goal of diverting solid waste and
capturing landfill CH4 gas emissions and capturing CH4 gas from wastewater treatment. Both of
the strategy four goals would be implemented by various City departments and the project would
not conflict with implementation of the actions required to meet the City’s targets.
The fifth strategy relates to climate resiliency and includes the goal of increasing tree canopy
coverage. The action under this goal includes consideration of a city-wide Urban Tree Planting
Program, which would incorporate water conservation measures and prioritization of drought-
tolerant and native trees and plantings in areas with recycled water. The project would conform
to the campuses existing water efficient irrigation systems and drought tolerant planting
program. Therefore, the project would not conflict with the City’s actions to increase tree canopy
coverage through a planting program and supporting measures.
As explained above, the project would not conflict with any of the five strategies outlined in the
CAP. As such, the project would be consistent with step 2 of the CAP checklist.
Step 3 of Checklist is only applicable if step 1 is answered in the affirmative under option three.
Because step 1 is not applicable to the proposed project, step 3 would not be applicable.
In summary, where applicable, the proposed project would be consistent with CAP and would
otherwise not conflict with any polices, targets or actions within the CAP
Finally, CSU/SDSU, the local jurisdictions, and the SDAPCD have not adopted GHG reduction
measures that would apply to the GHG emissions associated with the proposed project. As
previously discussed, CSU and SDSU have implemented sustainability strategies and programs
to reduce energy consumption, water consumption, and solid waste generation, all of which
reduce GHG emissions associated with activities throughout the CSU system and on the SDSU
campus. The proposed project would be consistent and compliant with these programs and
initiatives. These programs and initiatives, however, were not adopted with the specific purposes
of reducing GHG emissions. At this time, no mandatory GHG regulations or finalized agency
guidelines would apply to implementation of this proposed project, and no conflict would occur.
Therefore, this impact would be less than significant.

Memorandum
Subject: SDSU Tula Pavilion and Tenochca Hall Renewal/Refresh - Air Quality and
Greenhouse Gases Technical Memorandum
10018 19 January 2017
7 SUMMARY AND CONCLUSIONS
The air quality impact analysis evaluates the potential for significant adverse impacts to the
ambient air quality due to construction and operational emissions resulting from the proposed
project. Construction of the proposed project would result in a temporary addition of pollutants
to the local airshed caused by soil disturbance, fugitive dust emissions, and combustion
pollutants from on-site construction equipment, as well as from off-site trucks hauling
construction materials. The analysis, as set forth above, concludes that the daily construction
emissions would not exceed the SDAPCD significance thresholds for criteria pollutants, and
impacts during construction would be less than significant. Operational emissions also were
found to be below the SDAPCD’s significance thresholds; therefore, impacts during project
operation would be less than significant.
The proposed project’s potential effect on global climate change was evaluated, and emissions of
GHGs were estimated based on the use of construction equipment and vehicle trips associated
with construction activities, as well as operational emissions once construction phases are
complete. The proposed project would result in approximately 130 MT CO2E per year, which
would be below the currently utilized MT CO2E screening thresholds that have been established
for assessing GHG emissions of projects in the state. Additionally, the proposed project would
not conflict or impede with any applicable GHG plans, policies, or regulations. Accordingly,
GHG impacts would be considered less than significant.
Sincerely,
_______________________
Nicholas Lorenzen
Environmental Analyst
8 REFERENCES
14 CCR 15000–15387 and Appendices A–L. Guidelines for Implementation of the California
Environmental Quality Act, as amended.
BAAQMD (Bay Area Air Quality Management District). 2010. California Environmental
Quality Act Air Quality Guidelines. May 2010. Accessed December, 2016.
http://www.baaqmd.gov/~/media/Files/Planning%20and%20Research/CEQA/
Draft_BAAQMD_CEQA_Guidelines_May_2010_Final.ashx?la=en.

Memorandum
Subject: SDSU Tula Pavilion and Tenochca Hall Renewal/Refresh - Air Quality and
Greenhouse Gases Technical Memorandum
10018 20 January 2017
Cal. Building Industry Assn. (California Building Industry Association) v. BAAQMD (Bay Area
Air Quality Management District). (Cal.App. 4 Dist., 2013); no. S213478.
CAPCOA (California Air Pollution Control Officers Association). 2008. CEQA & Climate
Change: Evaluating and Addressing Greenhouse Gas Emissions from Projects Subject to
the California Environmental Quality Act. January 2008.
CARB (California Air Resources Board). 2008. Climate Change Proposed Scoping Plan: A
Framework for Change. October 2008; approved December 12, 2008. Accessed
December 2016. http://www.arb.ca.gov/cc/scopingplan/document/psp.pdf.
City of San Diego. 2010. Addressing Greenhouse Gas Emissions from Projects Subject to
CEQA. August 10, 2010.
City of San Diego. 2015. City of San Diego Climate Action Plan. December 2015.
http://www.sandiego.gov/planning/genplan/cap/pdf/CAP%20Adoption%20Draft%202015.pdf.
City of San Diego. 2016. City of San Diego Climate Action Plan Consistency Checklist. July 12, 2016.
CNRA (California Natural Resources Agency). 2009. 2009 California Climate Adaptation
Strategy. Accessed August 2015. http://resources.ca.gov/docs/climate/Statewide_
Adaptation_Strategy.pdf.
Linscott Law & Greenspan (LLG), Traffic Engineers. San Diego State University
Tula/Tenochca Project Transportation Impact Analysis . December 19, 2016.
OPR (California Governor’s Office of Planning and Research). 2008. Technical Advisory –
CEQA and Climate Change: Addressing Climate Change through California
Environmental Quality Act (CEQA) Review.
SCAQMD (South Coast Air Quality Management District). 1993. CEQA Air Quality Handbook.
SCAQMD 2008. Board Letter – Interim CEQA GHG Significance Threshold for Stationary
Sources, Rules and Plans. December 8, 2008. Accessed December 2016.
http://www.aqmd.gov/docs/default-source/ceqa/handbook/greenhouse-
gases-(ghg)-ceqa-significance-thresholds/ghgboardsynopsis.pdf?sfvrsn=2.
SDAPCD (San Diego Air Pollution Control District). 1969. Rules and Regulations. Regulation
IV. Prohibitions. Rule 51. Nuisance. Effective January 1, 1969.

Memorandum
Subject: SDSU Tula Pavilion and Tenochca Hall Renewal/Refresh - Air Quality and
Greenhouse Gases Technical Memorandum
10018 21 January 2017
SDAPCD. 1998. Regulation II. Rule 20.2. New Source Review Non-Major Stationary Sources.
Adopted and effective May 17, 1994; revisions adopted and effective December 17,
1997. Revisions adopted November 4, 1998; effective December 17, 1998.
SDAPCD. 2009. 2009 Regional Air Quality Strategy Revision. April 2009. Accessed December
2016. http://www.sdapcd.org/planning/2009-RAQS.pdf.
SDAPCD. 2012. Redesignation Request and Maintenance Plan for the 1997 National Ozone
Standard for San Diego County. December 15, 2012. Accessed December , 2016.
http://www.sdapcd.org/planning/8_Hour_O3_Maint-Plan.pdf.
SMAQMD (Sacramento Air Quality Management District). 2014. Adopt a Resolution Approving
Greenhouse Gas Thresholds of Significance. October 23, 2014. Accessed December, 2016.
http://www.airquality.org/bod/2014/Oct-Item11-AdoptResolutionGreenhouseGas
ThresholdsSignificanceBoardLetter.pdf.
WRCC (Western Regional Climate Center). 2016a. “San Diego Lindbergh fld. Temperature and
Precipitation.” Accessed December 2016. http://www.wrcc.dri.edu/cgi-bin/
cliMAIN.pl?ca7740.

C
5000Feet
M E X I C O15001000
AERIAL SOURCE: GOOGLE MAPPING SERVICE
FIGURE 1PROJECT LOCATION AND VICINITY MAP
SDSUTula Pavilion and Tenochca Hall Renewal/Refresh Project
PROJECT LOCATION

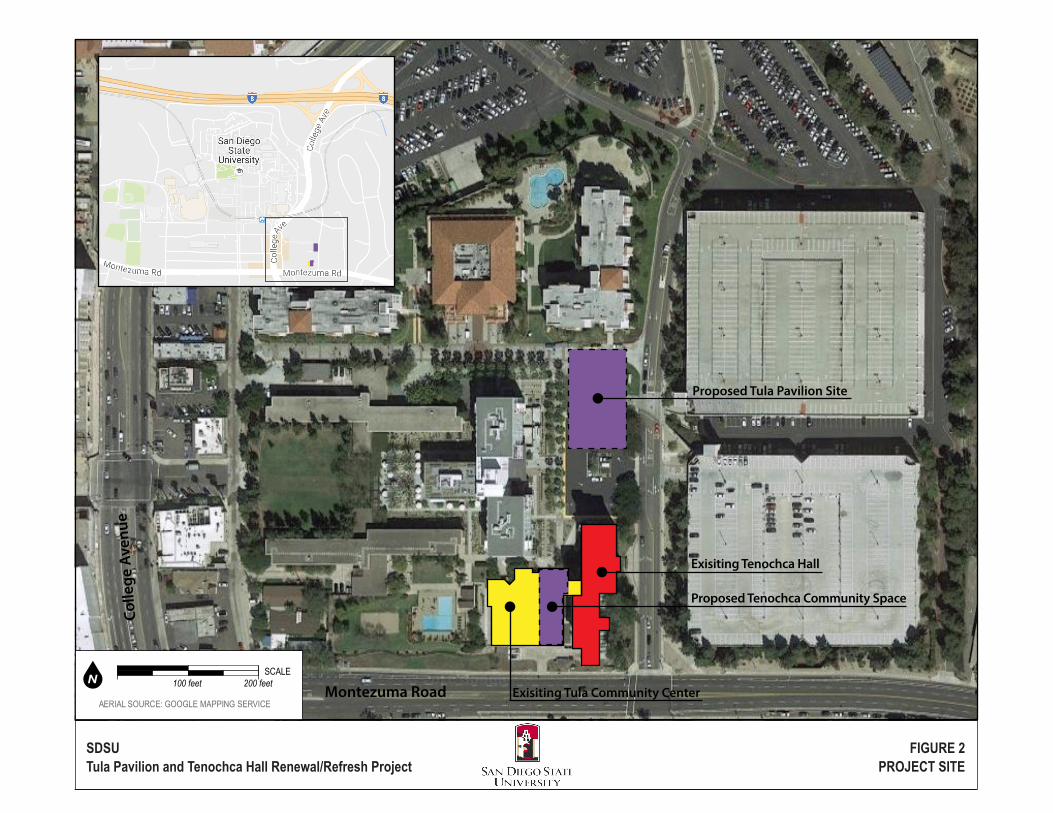
Proposed Tula Pavilion Site
Exisiting Tenochca Hall
Exisiting Tula Community Center Montezuma Road
Colle
ge A
venu
e
FIGURE 2PROJECT SITE
NSCALE
100 feet 200 feet
AERIAL SOURCE: GOOGLE MAPPING SERVICE
Proposed Tenochca Community Space
SDSUTula Pavilion and Tenochca Hall Renewal/Refresh Project


APPENDIX A
CalEEMod Output Files


Grading - 2,850 CY of backfill required to construct both buildings.
Architectural Coating - In compliance with Rule 67.0 Architectural Coatings, Interior coating VOC restricted to 100 grams per liter and exterior coating VOCs restricted to 150 grams per liter.coating VOCs restrited to 150 grams per liter.
1.3 User Entered Comments & Non-Default Data
Project Characteristics - Anticipated Construction Start Date July 2017. Anticipated Operational Start Date: September 2018
Land Use - Tula Pavilion - 12,181 sqft of Interior space and 6,000 sqft of exterior space. Tenocha Community Space - 12,638 sqft and would support/house 78 students.
Off-road Equipment - CalEEMod Defaults Assumed.
Trips and VMT - Worker Trips rounded to even values to account for 2 way trips.
Demolition - Approximately 20,000 sqft of demolition
CO2 Intensity (lb/MWhr)
720.49 CH4 Intensity (lb/MWhr)
0.029 N2O Intensity (lb/MWhr)
0.006
40
Climate Zone 13 Operational Year 2018
Utility Company San Diego Gas & Electric
1.2 Other Project Characteristics
Urbanization Urban Wind Speed (m/s) 2.6 Precipitation Freq (Days)
Other Asphalt Surfaces 6.00 1000sqft 0.14 6,000.00 0
University/College (4Yr) 78.00 Student 0.33 12,638.00 78
Floor Surface Area Population
Junior College (2Yr) 12.18 1000sqft 0.28 12,181.00 0
1.0 Project Characteristics
1.1 Land Usage
Land Uses Size Metric Lot Acreage
CalEEMod Version: CalEEMod.2016.3.1 Page 1 of 1 Date: 12/14/2016 1:40 PM
Tula Pavilion and Tenochca Community Space Project - San Diego County APCD Air District, Winter
Tula Pavilion and Tenochca Community Space ProjectSan Diego County APCD Air District, Winter

tblWater AnaerobicandFacultativeLagoonsPercent
2.21 0.00
tblWater AnaerobicandFacultativeLagoonsPercent
2.21 0.00
tblWater AerobicPercent 87.46 100.00
tblWater AnaerobicandFacultativeLagoonsPercent
2.21 0.00
tblWater AerobicPercent 87.46 100.00
tblWater AerobicPercent 87.46 100.00
tblLandUse Population 0.00 78.00
tblTripsAndVMT HaulingTripNumber 91.00 0.00
tblLandUse LandUseSquareFeet 12,180.00 12,181.00
tblLandUse LandUseSquareFeet 14,336.20 12,638.00
tblLandUse BuildingSpaceSquareFeet 12,180.00 12,181.00
tblLandUse BuildingSpaceSquareFeet 14,336.20 12,638.00
tblConstDustMitigation WaterUnpavedRoadVehicleSpeed 40 15
tblGrading MaterialImported 0.00 2,850.00
tblAreaCoating Area_EF_Nonresidential_Interior 250 100
tblAreaCoating Area_EF_Parking 250 0
tblArchitecturalCoating EF_Residential_Interior 250.00 100.00
tblAreaCoating Area_EF_Nonresidential_Exterior 250 150
tblArchitecturalCoating EF_Parking 250.00 150.00
tblArchitecturalCoating EF_Residential_Exterior 250.00 150.00
tblArchitecturalCoating EF_Nonresidential_Exterior 250.00 150.00
tblArchitecturalCoating EF_Nonresidential_Interior 250.00 100.00
Water Mitigation - Apply Water Conservation Strategy: 25% reduction. Water Reduction consistent with Executive Order B-29-1515
Waste Mitigation - Apply Waste Reduction measures: 75% reduction consistent with AB 341.
Table Name Column Name Default Value New Value
Vehicle Trips - CalEEMod Defaults Assumed.
Area CoatiArea Coating - In compliance with Rule 67.0 Architectural Coatings, Interior coating VOC restricted to 100 grams per liter and exterior coating VOCs restricted to 150 grams per liter.VOCs restrited to 150 grams per liter.Water And Wastewater - 100% Aerobic
Construction Off-road Equipment Mitigation - None

0.0000 16,716.7543
16,716.7543
1.6835 0.0000 16,758.8408
3.5643 1.0866 4.6509 1.0474 1.0372 2.0847Maximum 52.6162 72.9471 21.6329 0.1554
0.0000 16,716.7543
16,716.7543
1.6835 0.0000 16,758.8408
3.5643 1.0866 4.6509 1.0474 1.0372 2.08472017 52.6162 72.9471 21.6329 0.1554
Total CO2 CH4 N2O CO2e
Year lb/day lb/day
PM10 Total
Fugitive PM2.5
Exhaust PM2.5
PM2.5 Total
Bio- CO2 NBio- CO2
Mitigated Construction
ROG NOx CO SO2 Fugitive PM10
Exhaust PM10
0.0000 16,716.7543
16,716.7543
1.6835 0.0000 16,758.8408
4.1456 1.0866 5.2322 1.3183 1.0372 2.3556Maximum 52.6162 72.9471 21.6329 0.1554
0.0000 16,716.7543
16,716.7543
1.6835 0.0000 16,758.8408
4.1456 1.0866 5.2322 1.3183 1.0372 2.35562017 52.6162 72.9471 21.6329 0.1554
CH4 N2O CO2e
Year lb/day lb/day
Fugitive PM2.5
Exhaust PM2.5
PM2.5 Total
Bio- CO2 NBio- CO2 Total CO2
Unmitigated Construction
ROG NOx CO SO2 Fugitive PM10
Exhaust PM10
PM10 Total
tblWater SepticTankPercent 10.33 0.00
2.0 Emissions Summary
2.1 Overall Construction (Maximum Daily Emission)
tblWater SepticTankPercent 10.33 0.00
tblWater SepticTankPercent 10.33 0.00

3,453.9568
3,453.9568 0.1980 5.3500e-003
3,460.5007
2.5183 0.0566 2.5749 0.6733 0.0544 0.7277Total 1.6249 4.3341 11.5514 0.0327
3,162.0276
3,162.0276 0.1923 3,166.8353
2.5183 0.0381 2.5564 0.6733 0.0359 0.7092Mobile 0.9931 4.0907 11.3371 0.0312
291.9082 291.9082 5.5900e-003
5.3500e-003
293.64290.0185 0.0185 0.0185 0.0185Energy 0.0268 0.2433 0.2043 1.4600e-003
0.0211 0.0211 6.0000e-005
0.02254.0000e-005
4.0000e-005
4.0000e-005
4.0000e-005
Area 0.6051 9.0000e-005
9.9600e-003
0.0000
Total CO2 CH4 N2O CO2e
Category lb/day lb/day
PM10 Total
Fugitive PM2.5
Exhaust PM2.5
PM2.5 Total
Bio- CO2 NBio- CO2
Mitigated Operational
ROG NOx CO SO2 Fugitive PM10
Exhaust PM10
3,453.9568
3,453.9568 0.1980 5.3500e-003
3,460.5007
2.5183 0.0566 2.5749 0.6733 0.0544 0.7277Total 1.6249 4.3341 11.5514 0.0327
3,162.0276
3,162.0276 0.1923 3,166.8353
2.5183 0.0381 2.5564 0.6733 0.0359 0.7092Mobile 0.9931 4.0907 11.3371 0.0312
291.9082 291.9082 5.5900e-003
5.3500e-003
293.64290.0185 0.0185 0.0185 0.0185Energy 0.0268 0.2433 0.2043 1.4600e-003
0.0211 0.0211 6.0000e-005
0.02254.0000e-005
4.0000e-005
4.0000e-005
4.0000e-005
Area 0.6051 9.0000e-005
9.9600e-003
0.0000
Total CO2 CH4 N2O CO2e
Category lb/day lb/day
PM10 Total
Fugitive PM2.5
Exhaust PM2.5
PM2.5 Total
Bio- CO2 NBio- CO2
2.2 Overall OperationalUnmitigated Operational
ROG NOx CO SO2 Fugitive PM10
Exhaust PM10
0.00 0.00 0.00 0.00 0.00 0.0014.02 0.00 11.11 20.55 0.00 11.50
NBio-CO2 Total CO2 CH4 N20 CO2e
Percent Reduction
0.00 0.00 0.00 0.00
Exhaust PM10
PM10 Total
Fugitive PM2.5
Exhaust PM2.5
PM2.5 Total
Bio- CO2ROG NOx CO SO2 Fugitive PM10

Grading Tractors/Loaders/Backhoes 2 6.00 97 0.37
Grading Rubber Tired Dozers 1 1.00 247 0.40
Grading Concrete/Industrial Saws 1 8.00 81 0.73
Site Preparation Tractors/Loaders/Backhoes 1 8.00 97 0.37
Site Preparation Graders 1 8.00 187 0.41
Demolition Tractors/Loaders/Backhoes 2 6.00 97 0.37
Demolition Rubber Tired Dozers 1 1.00 247 0.40
Load Factor
Demolition Concrete/Industrial Saws 1 8.00 81 0.73
Acres of Grading (Site Preparation Phase): 0.5
Acres of Grading (Grading Phase): 0
Acres of Paving: 0.14
Residential Indoor: 0; Residential Outdoor: 0; Non-Residential Indoor: 37,229; Non-Residential Outdoor: 12,410; Striped Parking Area:
OffRoad Equipment
Phase Name Offroad Equipment Type Amount Usage Hours Horse Power
5
6 Architectural Coating Architectural Coating 11/14/2017 11/20/2017 5 5
5 Paving Paving 11/7/2017 11/13/2017 5
2
4 Building Construction Building Construction 6/20/2017 11/6/2017 5 100
3 Grading Grading 6/16/2017 6/19/2017 5
10
2 Site Preparation Site Preparation 6/15/2017 6/15/2017 5 1
End Date Num Days Week
Num Days Phase Description
1 Demolition Demolition 6/1/2017 6/14/2017 5
3.0 Construction Detail
Construction Phase
Phase Number
Phase Name Phase Type Start Date
0.00 0.00 0.00 0.00 0.00 0.000.00 0.00 0.00 0.00 0.00 0.00
NBio-CO2 Total CO2 CH4 N20 CO2e
Percent Reduction
0.00 0.00 0.00 0.00
Exhaust PM10
PM10 Total
Fugitive PM2.5
Exhaust PM2.5
PM2.5 Total
Bio- CO2ROG NOx CO SO2 Fugitive PM10

CO2e
Category lb/day lb/day
PM2.5 Total
Bio- CO2 NBio- CO2 Total CO2 CH4 N2OSO2 Fugitive PM10
Exhaust PM10
PM10 Total
Fugitive PM2.5
Exhaust PM2.5
3.1 Mitigation Measures Construction
Water Exposed Area
Reduce Vehicle Speed on Unpaved Roads
3.2 Demolition - 2017Unmitigated Construction On-Site
ROG NOx CO
10.80 7.30 20.00 LD_Mix HDT_Mix HHDT
7.30 20.00 LD_Mix HDT_Mix HHDT
Architectural Coating 1 3.00 0.00 0.00
Paving 7 18.00 0.00 0.00 10.80
10.80 7.30 20.00 LD_Mix HDT_Mix HHDT
7.30 20.00 LD_Mix HDT_Mix HHDT
Building Construction 5 13.00 5.00 0.00
Grading 4 10.00 0.00 356.00 10.80
10.80 7.30 20.00 LD_Mix HDT_Mix HHDT
7.30 20.00 LD_Mix HDT_Mix HHDT
Site Preparation 2 5.00 0.00 0.00
Demolition 4 10.00 0.00 0.00 10.80
Worker Trip Length
Vendor Trip Length
Hauling Trip Length
Worker Vehicle Class
Vendor Vehicle Class
Hauling Vehicle Class
Trips and VMT
Phase Name Offroad Equipment Count
Worker Trip Number
Vendor Trip Number
Hauling Trip Number
Architectural Coating Air Compressors 1 6.00 78 0.48
Paving Tractors/Loaders/Backhoes 1 7.00 97 0.37
Paving Rollers 1 7.00 80 0.38
Paving Pavers 1 7.00 130 0.42
Paving Cement and Mortar Mixers 4 6.00 9 0.56
Building Construction Tractors/Loaders/Backhoes 2 8.00 97 0.37
Building Construction Forklifts 2 6.00 89 0.20
Building Construction Cranes 1 4.00 231 0.29
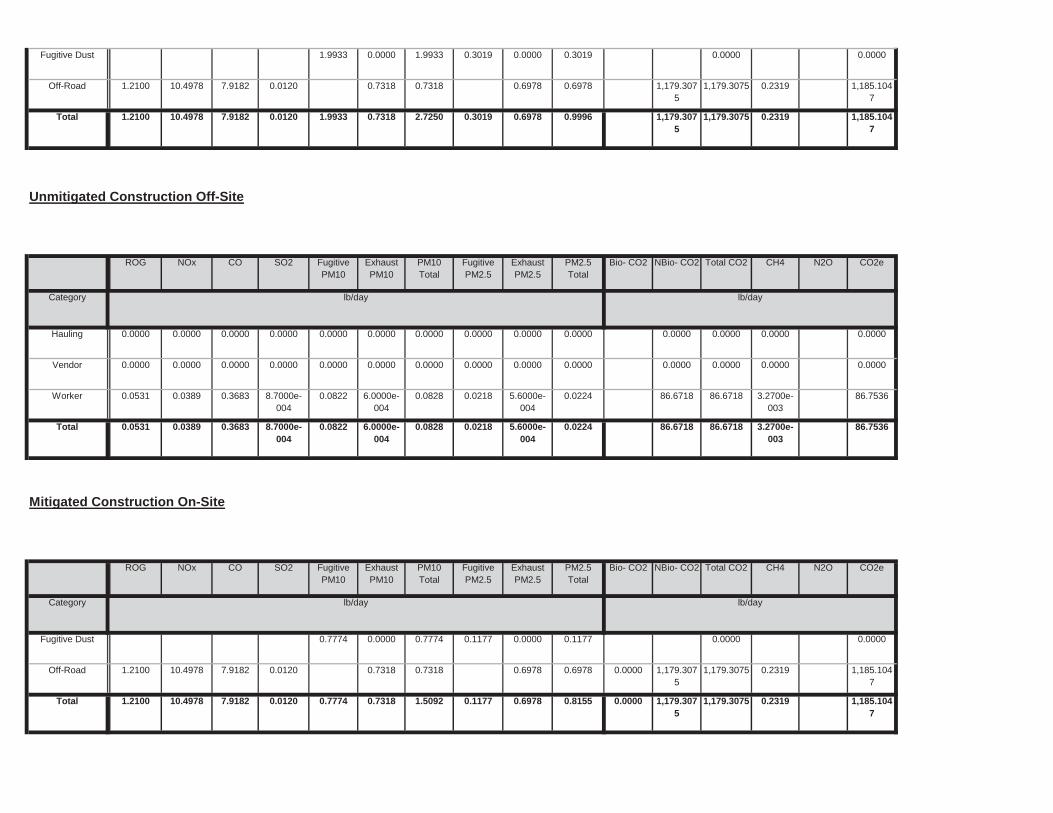
0.0000 1,179.3075
1,179.3075 0.2319 1,185.1047
0.7774 0.7318 1.5092 0.1177 0.6978 0.8155Total 1.2100 10.4978 7.9182 0.0120
0.0000 1,179.3075
1,179.3075 0.2319 1,185.1047
0.7318 0.7318 0.6978 0.6978Off-Road 1.2100 10.4978 7.9182 0.0120
0.0000 0.00000.7774 0.0000 0.7774 0.1177 0.0000 0.1177Fugitive Dust
Total CO2 CH4 N2O CO2e
Category lb/day lb/day
PM10 Total
Fugitive PM2.5
Exhaust PM2.5
PM2.5 Total
Bio- CO2 NBio- CO2
Mitigated Construction On-Site
ROG NOx CO SO2 Fugitive PM10
Exhaust PM10
86.6718 86.6718 3.2700e-003
86.75360.0822 6.0000e-004
0.0828 0.0218 5.6000e-004
0.0224Total 0.0531 0.0389 0.3683 8.7000e-004
86.6718 86.6718 3.2700e-003
86.75360.0822 6.0000e-004
0.0828 0.0218 5.6000e-004
0.0224Worker 0.0531 0.0389 0.3683 8.7000e-004
0.0000 0.0000 0.0000 0.00000.0000 0.0000 0.0000 0.0000 0.0000 0.0000Vendor 0.0000 0.0000 0.0000 0.0000
0.0000 0.0000 0.0000 0.00000.0000 0.0000 0.0000 0.0000 0.0000 0.0000Hauling 0.0000 0.0000 0.0000 0.0000
Total CO2 CH4 N2O CO2e
Category lb/day lb/day
PM10 Total
Fugitive PM2.5
Exhaust PM2.5
PM2.5 Total
Bio- CO2 NBio- CO2
Unmitigated Construction Off-Site
ROG NOx CO SO2 Fugitive PM10
Exhaust PM10
1,179.3075
1,179.3075 0.2319 1,185.1047
1.9933 0.7318 2.7250 0.3019 0.6978 0.9996Total 1.2100 10.4978 7.9182 0.0120
1,179.3075
1,179.3075 0.2319 1,185.1047
0.7318 0.7318 0.6978 0.6978Off-Road 1.2100 10.4978 7.9182 0.0120
0.0000 0.00001.9933 0.0000 1.9933 0.3019 0.0000 0.3019Fugitive Dust
Total CO2 CH4 N2O CO2ePM10 Total
Fugitive PM2.5
Exhaust PM2.5
PM2.5 Total
Bio- CO2 NBio- CO2
Unmitigated Construction Off-Site
ROG NOx CO SO2 Fugitive PM10
Exhaust PM10
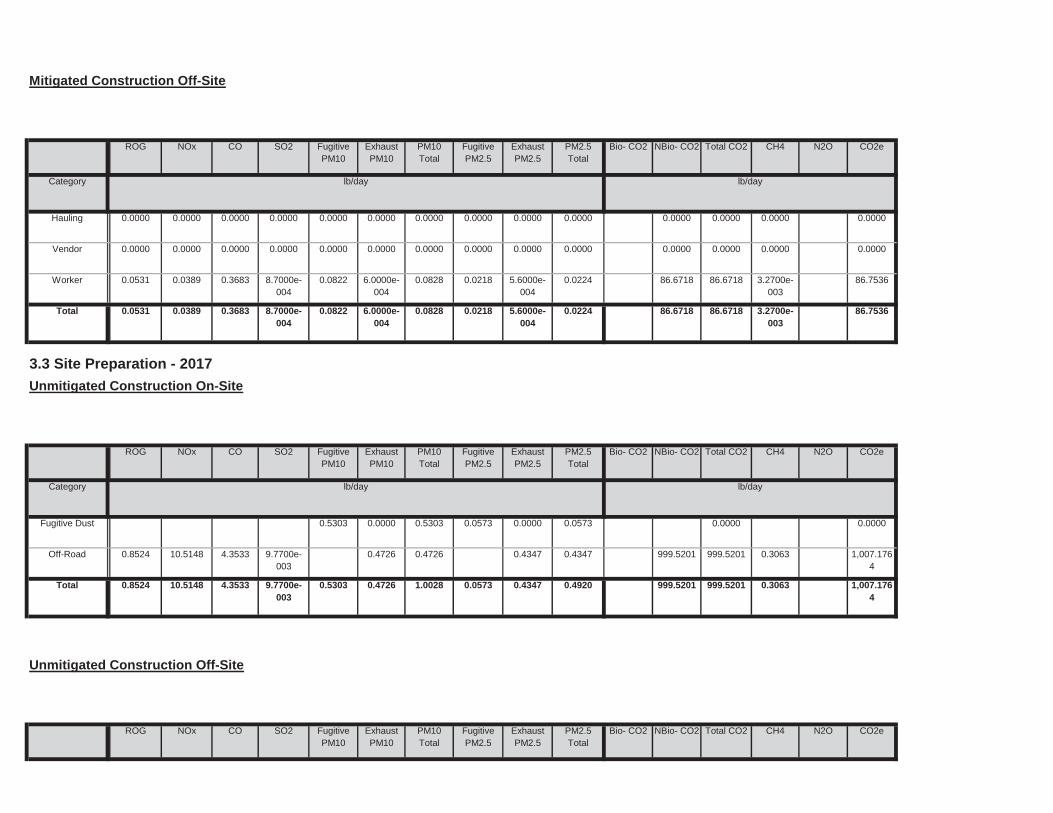
999.5201 999.5201 0.3063 1,007.1764
0.5303 0.4726 1.0028 0.0573 0.4347 0.4920Total 0.8524 10.5148 4.3533 9.7700e-003
999.5201 999.5201 0.3063 1,007.1764
0.4726 0.4726 0.4347 0.4347Off-Road 0.8524 10.5148 4.3533 9.7700e-003
0.0000 0.00000.5303 0.0000 0.5303 0.0573 0.0000 0.0573Fugitive Dust
Total CO2 CH4 N2O CO2e
Category lb/day lb/day
PM10 Total
Fugitive PM2.5
Exhaust PM2.5
PM2.5 Total
Bio- CO2 NBio- CO2
3.3 Site Preparation - 2017Unmitigated Construction On-Site
ROG NOx CO SO2 Fugitive PM10
Exhaust PM10
86.6718 86.6718 3.2700e-003
86.75360.0822 6.0000e-004
0.0828 0.0218 5.6000e-004
0.0224Total 0.0531 0.0389 0.3683 8.7000e-004
86.6718 86.6718 3.2700e-003
86.75360.0822 6.0000e-004
0.0828 0.0218 5.6000e-004
0.0224Worker 0.0531 0.0389 0.3683 8.7000e-004
0.0000 0.0000 0.0000 0.00000.0000 0.0000 0.0000 0.0000 0.0000 0.0000Vendor 0.0000 0.0000 0.0000 0.0000
0.0000 0.0000 0.0000 0.00000.0000 0.0000 0.0000 0.0000 0.0000 0.0000Hauling 0.0000 0.0000 0.0000 0.0000
Total CO2 CH4 N2O CO2e
Category lb/day lb/day
PM10 Total
Fugitive PM2.5
Exhaust PM2.5
PM2.5 Total
Bio- CO2 NBio- CO2
Mitigated Construction Off-Site
ROG NOx CO SO2 Fugitive PM10
Exhaust PM10

43.3359 43.3359 1.6300e-003
43.37680.0411 3.0000e-004
0.0414 0.0109 2.8000e-004
0.0112Worker 0.0265 0.0195 0.1842 4.4000e-004
0.0000 0.0000 0.0000 0.00000.0000 0.0000 0.0000 0.0000 0.0000 0.0000Vendor 0.0000 0.0000 0.0000 0.0000
0.0000 0.0000 0.0000 0.00000.0000 0.0000 0.0000 0.0000 0.0000 0.0000Hauling 0.0000 0.0000 0.0000 0.0000
Total CO2 CH4 N2O CO2e
Category lb/day lb/day
PM10 Total
Fugitive PM2.5
Exhaust PM2.5
PM2.5 Total
Bio- CO2 NBio- CO2
Mitigated Construction Off-Site
ROG NOx CO SO2 Fugitive PM10
Exhaust PM10
0.0000 999.5201 999.5201 0.3063 1,007.1764
0.2068 0.4726 0.6794 0.0223 0.4347 0.4571Total 0.8524 10.5148 4.3533 9.7700e-003
0.0000 999.5201 999.5201 0.3063 1,007.1764
0.4726 0.4726 0.4347 0.4347Off-Road 0.8524 10.5148 4.3533 9.7700e-003
0.0000 0.00000.2068 0.0000 0.2068 0.0223 0.0000 0.0223Fugitive Dust
Total CO2 CH4 N2O CO2e
Category lb/day lb/day
PM10 Total
Fugitive PM2.5
Exhaust PM2.5
PM2.5 Total
Bio- CO2 NBio- CO2
Mitigated Construction On-Site
ROG NOx CO SO2 Fugitive PM10
Exhaust PM10
43.3359 43.3359 1.6300e-003
43.37680.0411 3.0000e-004
0.0414 0.0109 2.8000e-004
0.0112Total 0.0265 0.0195 0.1842 4.4000e-004
43.3359 43.3359 1.6300e-003
43.37680.0411 3.0000e-004
0.0414 0.0109 2.8000e-004
0.0112Worker 0.0265 0.0195 0.1842 4.4000e-004
0.0000 0.0000 0.0000 0.00000.0000 0.0000 0.0000 0.0000 0.0000 0.0000Vendor 0.0000 0.0000 0.0000 0.0000
0.0000 0.0000 0.0000 0.00000.0000 0.0000 0.0000 0.0000 0.0000 0.0000Hauling 0.0000 0.0000 0.0000 0.0000
Category lb/day lb/day

Mitigated Construction On-Site
15,537.4468
15,537.4468
1.4516 15,573.7361
3.1926 0.3548 3.5474 0.8742 0.3395 1.2137Total 2.0205 62.4493 13.7147 0.1434
86.6718 86.6718 3.2700e-003
86.75360.0822 6.0000e-004
0.0828 0.0218 5.6000e-004
0.0224Worker 0.0531 0.0389 0.3683 8.7000e-004
0.0000 0.0000 0.0000 0.00000.0000 0.0000 0.0000 0.0000 0.0000 0.0000Vendor 0.0000 0.0000 0.0000 0.0000
15,450.7749
15,450.7749
1.4483 15,486.9825
3.1105 0.3542 3.4647 0.8525 0.3389 1.1914Hauling 1.9674 62.4103 13.3463 0.1425
Total CO2 CH4 N2O CO2e
Category lb/day lb/day
PM10 Total
Fugitive PM2.5
Exhaust PM2.5
PM2.5 Total
Bio- CO2 NBio- CO2
Unmitigated Construction Off-Site
ROG NOx CO SO2 Fugitive PM10
Exhaust PM10
1,179.3075
1,179.3075 0.2319 1,185.1047
0.9530 0.7318 1.6848 0.4441 0.6978 1.1419Total 1.2100 10.4978 7.9182 0.0120
1,179.3075
1,179.3075 0.2319 1,185.1047
0.7318 0.7318 0.6978 0.6978Off-Road 1.2100 10.4978 7.9182 0.0120
0.0000 0.00000.9530 0.0000 0.9530 0.4441 0.0000 0.4441Fugitive Dust
Total CO2 CH4 N2O CO2e
Category lb/day lb/day
PM10 Total
Fugitive PM2.5
Exhaust PM2.5
PM2.5 Total
Bio- CO2 NBio- CO2
3.4 Grading - 2017Unmitigated Construction On-Site
ROG NOx CO SO2 Fugitive PM10
Exhaust PM10
43.3359 43.3359 1.6300e-003
43.37680.0411 3.0000e-004
0.0414 0.0109 2.8000e-004
0.0112Total 0.0265 0.0195 0.1842 4.4000e-004

Total CO2 CH4 N2O CO2e
Category lb/day lb/day
PM10 Total
Fugitive PM2.5
Exhaust PM2.5
PM2.5 Total
Bio- CO2 NBio- CO2
3.5 Building Construction - 2017Unmitigated Construction On-Site
ROG NOx CO SO2 Fugitive PM10
Exhaust PM10
15,537.4468
15,537.4468
1.4516 15,573.7361
3.1926 0.3548 3.5474 0.8742 0.3395 1.2137Total 2.0205 62.4493 13.7147 0.1434
86.6718 86.6718 3.2700e-003
86.75360.0822 6.0000e-004
0.0828 0.0218 5.6000e-004
0.0224Worker 0.0531 0.0389 0.3683 8.7000e-004
0.0000 0.0000 0.0000 0.00000.0000 0.0000 0.0000 0.0000 0.0000 0.0000Vendor 0.0000 0.0000 0.0000 0.0000
15,450.7749
15,450.7749
1.4483 15,486.9825
3.1105 0.3542 3.4647 0.8525 0.3389 1.1914Hauling 1.9674 62.4103 13.3463 0.1425
Total CO2 CH4 N2O CO2e
Category lb/day lb/day
PM10 Total
Fugitive PM2.5
Exhaust PM2.5
PM2.5 Total
Bio- CO2 NBio- CO2
Mitigated Construction Off-Site
ROG NOx CO SO2 Fugitive PM10
Exhaust PM10
0.0000 1,179.3075
1,179.3075 0.2319 1,185.1047
0.3717 0.7318 1.1034 0.1732 0.6978 0.8710Total 1.2100 10.4978 7.9182 0.0120
0.0000 1,179.3075
1,179.3075 0.2319 1,185.1047
0.7318 0.7318 0.6978 0.6978Off-Road 1.2100 10.4978 7.9182 0.0120
0.0000 0.00000.3717 0.0000 0.3717 0.1732 0.0000 0.1732Fugitive Dust
Total CO2 CH4 N2O CO2e
Category lb/day lb/day
PM10 Total
Fugitive PM2.5
Exhaust PM2.5
PM2.5 Total
Bio- CO2 NBio- CO2ROG NOx CO SO2 Fugitive PM10
Exhaust PM10

0.0000 1,165.9164
1,165.9164 0.3572 1,174.8473
0.8591 0.8591 0.7904 0.7904Total 1.2812 12.7589 8.0700 0.0114
0.0000 1,165.9164
1,165.9164 0.3572 1,174.8473
0.8591 0.8591 0.7904 0.7904Off-Road 1.2812 12.7589 8.0700 0.0114
Total CO2 CH4 N2O CO2e
Category lb/day lb/day
PM10 Total
Fugitive PM2.5
Exhaust PM2.5
PM2.5 Total
Bio- CO2 NBio- CO2
Mitigated Construction On-Site
ROG NOx CO SO2 Fugitive PM10
Exhaust PM10
258.5892 258.5892 0.0174 259.02470.1406 7.4700e-003
0.1481 0.0381 7.1200e-003
0.0452Total 0.1000 0.7586 0.6925 2.5000e-003
112.6734 112.6734 4.2500e-003
112.77960.1068 7.9000e-004
0.1076 0.0283 7.3000e-004
0.0291Worker 0.0690 0.0506 0.4788 1.1300e-003
145.9158 145.9158 0.0132 146.24510.0339 6.6800e-003
0.0405 9.7400e-003
6.3900e-003
0.0161Vendor 0.0310 0.7080 0.2137 1.3700e-003
0.0000 0.0000 0.0000 0.00000.0000 0.0000 0.0000 0.0000 0.0000 0.0000Hauling 0.0000 0.0000 0.0000 0.0000
Total CO2 CH4 N2O CO2e
Category lb/day lb/day
PM10 Total
Fugitive PM2.5
Exhaust PM2.5
PM2.5 Total
Bio- CO2 NBio- CO2
Unmitigated Construction Off-Site
ROG NOx CO SO2 Fugitive PM10
Exhaust PM10
1,165.9164
1,165.9164 0.3572 1,174.8473
0.8591 0.8591 0.7904 0.7904Total 1.2812 12.7589 8.0700 0.0114
1,165.9164
1,165.9164 0.3572 1,174.8473
0.8591 0.8591 0.7904 0.7904Off-Road 1.2812 12.7589 8.0700 0.0114

Total CO2 CH4 N2O CO2ePM10 Total
Fugitive PM2.5
Exhaust PM2.5
PM2.5 Total
Bio- CO2 NBio- CO2
Unmitigated Construction Off-Site
ROG NOx CO SO2 Fugitive PM10
Exhaust PM10
1,085.1071
1,085.1071 0.3018 1,092.6515
0.6087 0.6087 0.5636 0.5636Total 1.1266 9.9754 7.3425 0.0113
0.0000 0.00000.0000 0.0000 0.0000 0.0000Paving 0.0734
1,085.1071
1,085.1071 0.3018 1,092.6515
0.6087 0.6087 0.5636 0.5636Off-Road 1.0532 9.9754 7.3425 0.0113
Total CO2 CH4 N2O CO2e
Category lb/day lb/day
PM10 Total
Fugitive PM2.5
Exhaust PM2.5
PM2.5 Total
Bio- CO2 NBio- CO2
3.6 Paving - 2017Unmitigated Construction On-Site
ROG NOx CO SO2 Fugitive PM10
Exhaust PM10
258.5892 258.5892 0.0174 259.02470.1406 7.4700e-003
0.1481 0.0381 7.1200e-003
0.0452Total 0.1000 0.7586 0.6925 2.5000e-003
112.6734 112.6734 4.2500e-003
112.77960.1068 7.9000e-004
0.1076 0.0283 7.3000e-004
0.0291Worker 0.0690 0.0506 0.4788 1.1300e-003
145.9158 145.9158 0.0132 146.24510.0339 6.6800e-003
0.0405 9.7400e-003
6.3900e-003
0.0161Vendor 0.0310 0.7080 0.2137 1.3700e-003
0.0000 0.0000 0.0000 0.00000.0000 0.0000 0.0000 0.0000 0.0000 0.0000Hauling 0.0000 0.0000 0.0000 0.0000
Total CO2 CH4 N2O CO2e
Category lb/day lb/day
PM10 Total
Fugitive PM2.5
Exhaust PM2.5
PM2.5 Total
Bio- CO2 NBio- CO2
Mitigated Construction Off-Site
ROG NOx CO SO2 Fugitive PM10
Exhaust PM10

156.0093 156.0093 5.8800e-003
156.15640.1479 1.0900e-003
0.1490 0.0392 1.0100e-003
0.0402Worker 0.0955 0.0701 0.6630 1.5700e-003
0.0000 0.0000 0.0000 0.00000.0000 0.0000 0.0000 0.0000 0.0000 0.0000Vendor 0.0000 0.0000 0.0000 0.0000
0.0000 0.0000 0.0000 0.00000.0000 0.0000 0.0000 0.0000 0.0000 0.0000Hauling 0.0000 0.0000 0.0000 0.0000
Total CO2 CH4 N2O CO2e
Category lb/day lb/day
PM10 Total
Fugitive PM2.5
Exhaust PM2.5
PM2.5 Total
Bio- CO2 NBio- CO2
Mitigated Construction Off-Site
ROG NOx CO SO2 Fugitive PM10
Exhaust PM10
0.0000 1,085.1071
1,085.1071 0.3018 1,092.6515
0.6087 0.6087 0.5636 0.5636Total 1.1266 9.9754 7.3425 0.0113
0.0000 0.00000.0000 0.0000 0.0000 0.0000Paving 0.0734
0.0000 1,085.1071
1,085.1071 0.3018 1,092.6515
0.6087 0.6087 0.5636 0.5636Off-Road 1.0532 9.9754 7.3425 0.0113
Total CO2 CH4 N2O CO2e
Category lb/day lb/day
PM10 Total
Fugitive PM2.5
Exhaust PM2.5
PM2.5 Total
Bio- CO2 NBio- CO2
Mitigated Construction On-Site
ROG NOx CO SO2 Fugitive PM10
Exhaust PM10
156.0093 156.0093 5.8800e-003
156.15640.1479 1.0900e-003
0.1490 0.0392 1.0100e-003
0.0402Total 0.0955 0.0701 0.6630 1.5700e-003
156.0093 156.0093 5.8800e-003
156.15640.1479 1.0900e-003
0.1490 0.0392 1.0100e-003
0.0402Worker 0.0955 0.0701 0.6630 1.5700e-003
0.0000 0.0000 0.0000 0.00000.0000 0.0000 0.0000 0.0000 0.0000 0.0000Vendor 0.0000 0.0000 0.0000 0.0000
0.0000 0.0000 0.0000 0.00000.0000 0.0000 0.0000 0.0000 0.0000 0.0000Hauling 0.0000 0.0000 0.0000 0.0000
Category lb/day lb/day

Mitigated Construction On-Site
26.0016 26.0016 9.8000e-004
26.02610.0246 1.8000e-004
0.0248 6.5400e-003
1.7000e-004
6.7000e-003
Total 0.0159 0.0117 0.1105 2.6000e-004
26.0016 26.0016 9.8000e-004
26.02610.0246 1.8000e-004
0.0248 6.5400e-003
1.7000e-004
6.7000e-003
Worker 0.0159 0.0117 0.1105 2.6000e-004
0.0000 0.0000 0.0000 0.00000.0000 0.0000 0.0000 0.0000 0.0000 0.0000Vendor 0.0000 0.0000 0.0000 0.0000
0.0000 0.0000 0.0000 0.00000.0000 0.0000 0.0000 0.0000 0.0000 0.0000Hauling 0.0000 0.0000 0.0000 0.0000
Total CO2 CH4 N2O CO2e
Category lb/day lb/day
PM10 Total
Fugitive PM2.5
Exhaust PM2.5
PM2.5 Total
Bio- CO2 NBio- CO2
Unmitigated Construction Off-Site
ROG NOx CO SO2 Fugitive PM10
Exhaust PM10
281.4481 281.4481 0.0297 282.19090.1733 0.1733 0.1733 0.1733Total 52.6003 2.1850 1.8681 2.9700e-003
281.4481 281.4481 0.0297 282.19090.1733 0.1733 0.1733 0.1733Off-Road 0.3323 2.1850 1.8681 2.9700e-003
0.0000 0.00000.0000 0.0000 0.0000 0.0000Archit. Coating 52.2680
Total CO2 CH4 N2O CO2e
Category lb/day lb/day
PM10 Total
Fugitive PM2.5
Exhaust PM2.5
PM2.5 Total
Bio- CO2 NBio- CO2
3.7 Architectural Coating - 2017Unmitigated Construction On-Site
ROG NOx CO SO2 Fugitive PM10
Exhaust PM10
156.0093 156.0093 5.8800e-003
156.15640.1479 1.0900e-003
0.1490 0.0392 1.0100e-003
0.0402Total 0.0955 0.0701 0.6630 1.5700e-003

4.0 Operational Detail - Mobile
4.1 Mitigation Measures Mobile
26.0016 26.0016 9.8000e-004
26.02610.0246 1.8000e-004
0.0248 6.5400e-003
1.7000e-004
6.7000e-003
Total 0.0159 0.0117 0.1105 2.6000e-004
26.0016 26.0016 9.8000e-004
26.02610.0246 1.8000e-004
0.0248 6.5400e-003
1.7000e-004
6.7000e-003
Worker 0.0159 0.0117 0.1105 2.6000e-004
0.0000 0.0000 0.0000 0.00000.0000 0.0000 0.0000 0.0000 0.0000 0.0000Vendor 0.0000 0.0000 0.0000 0.0000
0.0000 0.0000 0.0000 0.00000.0000 0.0000 0.0000 0.0000 0.0000 0.0000Hauling 0.0000 0.0000 0.0000 0.0000
Total CO2 CH4 N2O CO2e
Category lb/day lb/day
PM10 Total
Fugitive PM2.5
Exhaust PM2.5
PM2.5 Total
Bio- CO2 NBio- CO2
Mitigated Construction Off-Site
ROG NOx CO SO2 Fugitive PM10
Exhaust PM10
0.0000 281.4481 281.4481 0.0297 282.19090.1733 0.1733 0.1733 0.1733Total 52.6003 2.1850 1.8681 2.9700e-003
0.0000 281.4481 281.4481 0.0297 282.19090.1733 0.1733 0.1733 0.1733Off-Road 0.3323 2.1850 1.8681 2.9700e-003
0.0000 0.00000.0000 0.0000 0.0000 0.0000Archit. Coating 52.2680
Total CO2 CH4 N2O CO2e
Category lb/day lb/day
PM10 Total
Fugitive PM2.5
Exhaust PM2.5
PM2.5 Total
Bio- CO2 NBio- CO2ROG NOx CO SO2 Fugitive PM10
Exhaust PM10

0.022073 0.001871 0.002173 0.006385 0.000739 0.001452
0.000739 0.001452
Other Asphalt Surfaces 0.574135 0.045525 0.189369 0.116519 0.019283 0.005646 0.014833
0.005646 0.014833 0.022073 0.001871 0.002173 0.006385University/College (4Yr) 0.574135 0.045525 0.189369 0.116519 0.019283
0.022073 0.001871 0.002173 0.006385 0.000739 0.001452
SBUS MH
Junior College (2Yr) 0.574135 0.045525 0.189369 0.116519 0.019283 0.005646 0.014833
LHD2 MHD HHD OBUS UBUS MCYLand Use LDA LDT1 LDT2 MDV LHD1
88.60 5.00 91 9 0
4.4 Fleet Mix
0.00 0.00 0 0 0
University/College (4Yr) 9.50 7.30 7.30 6.40
88.60 5.00 92 7 1
Other Asphalt Surfaces 9.50 7.30 7.30 0.00
H-S or C-C H-O or C-NW Primary Diverted Pass-by
Junior College (2Yr) 9.50 7.30 7.30 6.40
4.3 Trip Type Information
Miles Trip % Trip Purpose %
Land Use H-W or C-W H-S or C-C H-O or C-NW H-W or C-W
Total 468.21 238.18 14.74 939,539 939,539University/College (4Yr) 133.38 101.40 0.00 277,206 277,206Other Asphalt Surfaces 0.00 0.00 0.00
Annual VMT
Junior College (2Yr) 334.83 136.78 14.74 662,333 662,333
4.2 Trip Summary Information
Average Daily Trip Rate Unmitigated MitigatedLand Use Weekday Saturday Sunday Annual VMT
3,162.0276
3,162.0276 0.1923 3,166.8353
2.5183 0.0381 2.5564 0.6733 0.0359 0.7092Unmitigated 0.9931 4.0907 11.3371 0.0312
3,162.0276
3,162.0276 0.1923 3,166.8353
2.5183 0.0381 2.5564 0.6733 0.0359 0.7092Mitigated 0.9931 4.0907 11.3371 0.0312
NBio- CO2 Total CO2 CH4 N2O CO2e
Category lb/day lb/day
Exhaust PM10
PM10 Total
Fugitive PM2.5
Exhaust PM2.5
PM2.5 Total
Bio- CO2ROG NOx CO SO2 Fugitive PM10

291.9082 291.9082 5.6000e-003
5.3600e-003
293.64290.0185 0.0185 0.0185 0.0185Total 0.0268 0.2433 0.2043 1.4600e-003
148.6416 148.6416 2.8500e-003
2.7300e-003
149.52499.4100e-003
9.4100e-003
9.4100e-003
9.4100e-003
University/College (4Yr)
1263.45 0.0136 0.1239 0.1041 7.4000e-004
0.0000 0.0000 0.0000 0.0000 0.00000.0000 0.0000 0.0000 0.0000Other Asphalt Surfaces
0 0.0000 0.0000 0.0000 0.0000
143.2666 143.2666 2.7500e-003
2.6300e-003
144.11809.0700e-003
9.0700e-003
9.0700e-003
9.0700e-003
Junior College (2Yr)
1217.77 0.0131 0.1194 0.1003 7.2000e-004
Total CO2 CH4 N2O CO2e
Land Use kBTU/yr lb/day lb/day
PM10 Total
Fugitive PM2.5
Exhaust PM2.5
PM2.5 Total
Bio- CO2 NBio- CO2
5.2 Energy by Land Use - NaturalGasUnmitigated
NaturalGas Use
ROG NOx CO SO2 Fugitive PM10
Exhaust PM10
291.9082 291.9082 5.5900e-003
5.3500e-003
293.64290.0185 0.0185 0.0185 0.0185NaturalGas Unmitigated
0.0268 0.2433 0.2043 1.4600e-003
291.9082 291.9082 5.5900e-003
5.3500e-003
293.64290.0185 0.0185 0.0185 0.0185NaturalGas Mitigated
0.0268 0.2433 0.2043 1.4600e-003
NBio- CO2 Total CO2 CH4 N2O CO2e
Category lb/day lb/day
Exhaust PM10
PM10 Total
Fugitive PM2.5
Exhaust PM2.5
PM2.5 Total
Bio- CO2
5.0 Energy Detail
Historical Energy Use: N
5.1 Mitigation Measures Energy
ROG NOx CO SO2 Fugitive PM10

6.2 Area by SubCategoryUnmitigated
0.0211 0.0211 6.0000e-005
0.02254.0000e-005
4.0000e-005
4.0000e-005
4.0000e-005
Unmitigated 0.6051 9.0000e-005
9.9600e-003
0.0000
0.0211 0.0211 6.0000e-005
0.02254.0000e-005
4.0000e-005
4.0000e-005
4.0000e-005
Mitigated 0.6051 9.0000e-005
9.9600e-003
0.0000
NBio- CO2 Total CO2 CH4 N2O CO2e
Category lb/day lb/day
Exhaust PM10
PM10 Total
Fugitive PM2.5
Exhaust PM2.5
PM2.5 Total
Bio- CO2
6.0 Area Detail
6.1 Mitigation Measures Area
ROG NOx CO SO2 Fugitive PM10
291.9082 291.9082 5.6000e-003
5.3600e-003
293.64290.0185 0.0185 0.0185 0.0185Total 0.0268 0.2433 0.2043 1.4600e-003
148.6416 148.6416 2.8500e-003
2.7300e-003
149.52499.4100e-003
9.4100e-003
9.4100e-003
9.4100e-003
University/College (4Yr)
1.26345 0.0136 0.1239 0.1041 7.4000e-004
0.0000 0.0000 0.0000 0.0000 0.00000.0000 0.0000 0.0000 0.0000Other Asphalt Surfaces
0 0.0000 0.0000 0.0000 0.0000
143.2666 143.2666 2.7500e-003
2.6300e-003
144.11809.0700e-003
9.0700e-003
9.0700e-003
9.0700e-003
Junior College (2Yr)
1.21777 0.0131 0.1194 0.1003 7.2000e-004
Total CO2 CH4 N2O CO2e
Land Use kBTU/yr lb/day lb/day
PM10 Total
Fugitive PM2.5
Exhaust PM2.5
PM2.5 Total
Bio- CO2 NBio- CO2
Mitigated
NaturalGas Use
ROG NOx CO SO2 Fugitive PM10
Exhaust PM10

7.0 Water Detail
7.1 Mitigation Measures Water
Apply Water Conservation Strategy
8.0 Waste Detail
0.0211 0.0211 6.0000e-005
0.02254.0000e-005
4.0000e-005
4.0000e-005
4.0000e-005
Total 0.6051 9.0000e-005
9.9600e-003
0.0000
0.0211 0.0211 6.0000e-005
0.02254.0000e-005
4.0000e-005
4.0000e-005
4.0000e-005
Landscaping 9.5000e-004
9.0000e-005
9.9600e-003
0.0000
0.0000 0.00000.0000 0.0000 0.0000 0.0000Consumer Products
0.5333
0.0000 0.00000.0000 0.0000 0.0000 0.0000Architectural Coating
0.0709
Total CO2 CH4 N2O CO2e
SubCategory lb/day lb/day
PM10 Total
Fugitive PM2.5
Exhaust PM2.5
PM2.5 Total
Bio- CO2 NBio- CO2
Mitigated
ROG NOx CO SO2 Fugitive PM10
Exhaust PM10
0.0211 0.0211 6.0000e-005
0.02254.0000e-005
4.0000e-005
4.0000e-005
4.0000e-005
Total 0.6051 9.0000e-005
9.9600e-003
0.0000
0.0211 0.0211 6.0000e-005
0.02254.0000e-005
4.0000e-005
4.0000e-005
4.0000e-005
Landscaping 9.5000e-004
9.0000e-005
9.9600e-003
0.0000
0.0000 0.00000.0000 0.0000 0.0000 0.0000Consumer Products
0.5333
0.0000 0.00000.0000 0.0000 0.0000 0.0000Architectural Coating
0.0709
Total CO2 CH4 N2O CO2e
SubCategory lb/day lb/day
PM10 Total
Fugitive PM2.5
Exhaust PM2.5
PM2.5 Total
Bio- CO2 NBio- CO2ROG NOx CO SO2 Fugitive PM10
Exhaust PM10
Fuel Type
User Defined Equipment
Equipment Type Number
11.0 Vegetation
Boilers
Equipment Type Number Heat Input/Day Heat Input/Year Boiler Rating
Fuel Type
10.0 Stationary Equipment
Fire Pumps and Emergency Generators
Equipment Type Number Hours/Day Hours/Year Horse Power Load Factor Fuel Type
Equipment Type Number Hours/Day Days/Year Horse Power Load Factor
8.1 Mitigation Measures Waste
9.0 Operational Offroad

Grading - 2,850 CY of backfill required to construct both buildings.
Architectural Coating - In compliance with Rule 67.0 Architectural Coatings, Interior coating VOC restricted to 100 grams per liter and exterior coating VOCs restricted to 150 grams per liter.
1.3 User Entered Comments & Non-Default Data
Project Characteristics - Anticipated construction start date July 2017. Anticipated operational start date: September 2018
Land Use - Tula Pavilion - 12,181 sqft of Interior space and 6,000 sqft of exterior space. Tenocha Community Space - 12,638 sqft and would support/house 78 students.Off-road Equipment - Off-road Equipment - CalEEMod defaults assumed.
Trips and VMT - Worker Trips rounded to even values to account for 2 way trips.
Demolition - Approximately 20,000 sqft of demolition
CO2 Intensity (lb/MWhr)
720.49 CH4 Intensity (lb/MWhr)
0.029 N2O Intensity (lb/MWhr)
0.006
40
Climate Zone 13 Operational Year 2018
Utility Company San Diego Gas & Electric
1.2 Other Project Characteristics
Urbanization Urban Wind Speed (m/s) 2.6 Precipitation Freq (Days)
Other Asphalt Surfaces 6.00 1000sqft 0.14 6,000.00 0
University/College (4Yr) 78.00 Student 0.33 12,638.00 78
Floor Surface Area Population
Junior College (2Yr) 12.18 1000sqft 0.28 12,181.00 0
1.0 Project Characteristics
1.1 Land Usage
Land Uses Size Metric Lot Acreage
CalEEMod Version: CalEEMod.2016.3.1 Page 1 of 1 Date: 12/14/2016 1:39 PM
Tula Pavilion and Tenochca Community Space Project - San Diego County APCD Air District, Summer
Tula Pavilion and Tenochca Community Space ProjectSan Diego County APCD Air District, Summer

tblWater AnaerobicandFacultativeLagoonsPercent
2.21 0.00
tblWater AnaerobicandFacultativeLagoonsPercent
2.21 0.00
tblWater AerobicPercent 87.46 100.00
tblWater AnaerobicandFacultativeLagoonsPercent
2.21 0.00
tblWater AerobicPercent 87.46 100.00
tblWater AerobicPercent 87.46 100.00
tblLandUse Population 0.00 78.00
tblTripsAndVMT HaulingTripNumber 91.00 0.00
tblLandUse LandUseSquareFeet 12,180.00 12,181.00
tblLandUse LandUseSquareFeet 14,336.20 12,638.00
tblLandUse BuildingSpaceSquareFeet 12,180.00 12,181.00
tblLandUse BuildingSpaceSquareFeet 14,336.20 12,638.00
tblConstDustMitigation WaterUnpavedRoadVehicleSpeed 40 15
tblGrading MaterialImported 0.00 2,850.00
tblAreaCoating Area_EF_Nonresidential_Interior 250 100
tblAreaCoating Area_EF_Parking 250 0
tblArchitecturalCoating EF_Residential_Interior 250.00 100.00
tblAreaCoating Area_EF_Nonresidential_Exterior 250 150
tblArchitecturalCoating EF_Parking 250.00 150.00
tblArchitecturalCoating EF_Residential_Exterior 250.00 150.00
tblArchitecturalCoating EF_Nonresidential_Exterior 250.00 150.00
tblArchitecturalCoating EF_Nonresidential_Interior 250.00 100.00
Water Mitigation - Apply Water Conservation Strategy: 25% reduction. Water Reduction consistent with Executive Order B-29-15.
Waste Mitigation - Apply Waste Reduction measures: 75% reduction consistent with AB 341.
Table Name Column Name Default Value New Value
Vehicle Trips - CalEEMod defaults assumed.
Area Coating - In compliance with Rule 67.0 Architectural Coatings, Interior coating VOC restricted to 100 grams per liter and exterior coating VOCs restricted to 150 grams per liter.Water And Wastewater - 100% Aerobic
Construction Off-road Equipment Mitigation - None

0.0000 16,972.9571
16,972.9571
1.6298 0.0000 17,013.7014
3.5643 1.0803 4.6445 1.0474 1.0312 2.0786Maximum 52.6144 72.2033 20.7097 0.1578
0.0000 16,972.9571
16,972.9571
1.6298 0.0000 17,013.7014
3.5643 1.0803 4.6445 1.0474 1.0312 2.07862017 52.6144 72.2033 20.7097 0.1578
Total CO2 CH4 N2O CO2e
Year lb/day lb/day
PM10 Total
Fugitive PM2.5
Exhaust PM2.5
PM2.5 Total
Bio- CO2 NBio- CO2
Mitigated Construction
ROG NOx CO SO2 Fugitive PM10
Exhaust PM10
0.0000 16,972.9571
16,972.9571
1.6298 0.0000 17,013.7014
4.1456 1.0803 5.2259 1.3183 1.0312 2.3495Maximum 52.6144 72.2033 20.7097 0.1578
0.0000 16,972.9571
16,972.9571
1.6298 0.0000 17,013.7014
4.1456 1.0803 5.2259 1.3183 1.0312 2.34952017 52.6144 72.2033 20.7097 0.1578
CH4 N2O CO2e
Year lb/day lb/day
Fugitive PM2.5
Exhaust PM2.5
PM2.5 Total
Bio- CO2 NBio- CO2 Total CO2
Unmitigated Construction
ROG NOx CO SO2 Fugitive PM10
Exhaust PM10
PM10 Total
tblWater SepticTankPercent 10.33 0.00
2.0 Emissions Summary
2.1 Overall Construction (Maximum Daily Emission)
tblWater SepticTankPercent 10.33 0.00
tblWater SepticTankPercent 10.33 0.00

3,627.9150
3,627.9150 0.1970 5.3500e-003
3,634.4343
2.5183 0.0563 2.5745 0.6733 0.0541 0.7274Total 1.6467 4.2043 11.6140 0.0344
3,335.9857
3,335.9857 0.1913 3,340.7689
2.5183 0.0377 2.5560 0.6733 0.0356 0.7088Mobile 1.0148 3.9610 11.3997 0.0330
291.9082 291.9082 5.5900e-003
5.3500e-003
293.64290.0185 0.0185 0.0185 0.0185Energy 0.0268 0.2433 0.2043 1.4600e-003
0.0211 0.0211 6.0000e-005
0.02254.0000e-005
4.0000e-005
4.0000e-005
4.0000e-005
Area 0.6051 9.0000e-005
9.9600e-003
0.0000
Total CO2 CH4 N2O CO2e
Category lb/day lb/day
PM10 Total
Fugitive PM2.5
Exhaust PM2.5
PM2.5 Total
Bio- CO2 NBio- CO2
Mitigated Operational
ROG NOx CO SO2 Fugitive PM10
Exhaust PM10
3,627.9150
3,627.9150 0.1970 5.3500e-003
3,634.4343
2.5183 0.0563 2.5745 0.6733 0.0541 0.7274Total 1.6467 4.2043 11.6140 0.0344
3,335.9857
3,335.9857 0.1913 3,340.7689
2.5183 0.0377 2.5560 0.6733 0.0356 0.7088Mobile 1.0148 3.9610 11.3997 0.0330
291.9082 291.9082 5.5900e-003
5.3500e-003
293.64290.0185 0.0185 0.0185 0.0185Energy 0.0268 0.2433 0.2043 1.4600e-003
0.0211 0.0211 6.0000e-005
0.02254.0000e-005
4.0000e-005
4.0000e-005
4.0000e-005
Area 0.6051 9.0000e-005
9.9600e-003
0.0000
Total CO2 CH4 N2O CO2e
Category lb/day lb/day
PM10 Total
Fugitive PM2.5
Exhaust PM2.5
PM2.5 Total
Bio- CO2 NBio- CO2
2.2 Overall OperationalUnmitigated Operational
ROG NOx CO SO2 Fugitive PM10
Exhaust PM10
0.00 0.00 0.00 0.00 0.00 0.0014.02 0.00 11.12 20.55 0.00 11.53
NBio-CO2 Total CO2 CH4 N20 CO2e
Percent Reduction
0.00 0.00 0.00 0.00
Exhaust PM10
PM10 Total
Fugitive PM2.5
Exhaust PM2.5
PM2.5 Total
Bio- CO2ROG NOx CO SO2 Fugitive PM10

Grading Tractors/Loaders/Backhoes 2 6.00 97 0.37
Grading Rubber Tired Dozers 1 1.00 247 0.40
Grading Concrete/Industrial Saws 1 8.00 81 0.73
Site Preparation Tractors/Loaders/Backhoes 1 8.00 97 0.37
Site Preparation Graders 1 8.00 187 0.41
Demolition Tractors/Loaders/Backhoes 2 6.00 97 0.37
Demolition Rubber Tired Dozers 1 1.00 247 0.40
Load Factor
Demolition Concrete/Industrial Saws 1 8.00 81 0.73
Acres of Grading (Site Preparation Phase): 0.5
Acres of Grading (Grading Phase): 0
Acres of Paving: 0.14
Residential Indoor: 0; Residential Outdoor: 0; Non-Residential Indoor: 37,229; Non-Residential Outdoor: 12,410; Striped Parking Area:
OffRoad Equipment
Phase Name Offroad Equipment Type Amount Usage Hours Horse Power
5
6 Architectural Coating Architectural Coating 11/14/2017 11/20/2017 5 5
5 Paving Paving 11/7/2017 11/13/2017 5
2
4 Building Construction Building Construction 6/20/2017 11/6/2017 5 100
3 Grading Grading 6/16/2017 6/19/2017 5
10
2 Site Preparation Site Preparation 6/15/2017 6/15/2017 5 1
End Date Num Days Week
Num Days Phase Description
1 Demolition Demolition 6/1/2017 6/14/2017 5
3.0 Construction Detail
Construction Phase
Phase Number
Phase Name Phase Type Start Date
0.00 0.00 0.00 0.00 0.00 0.000.00 0.00 0.00 0.00 0.00 0.00
NBio-CO2 Total CO2 CH4 N20 CO2e
Percent Reduction
0.00 0.00 0.00 0.00
Exhaust PM10
PM10 Total
Fugitive PM2.5
Exhaust PM2.5
PM2.5 Total
Bio- CO2ROG NOx CO SO2 Fugitive PM10

CO2e
Category lb/day lb/day
PM2.5 Total
Bio- CO2 NBio- CO2 Total CO2 CH4 N2OSO2 Fugitive PM10
Exhaust PM10
PM10 Total
Fugitive PM2.5
Exhaust PM2.5
3.1 Mitigation Measures Construction
Water Exposed Area
Reduce Vehicle Speed on Unpaved Roads
3.2 Demolition - 2017Unmitigated Construction On-Site
ROG NOx CO
10.80 7.30 20.00 LD_Mix HDT_Mix HHDT
7.30 20.00 LD_Mix HDT_Mix HHDT
Architectural Coating 1 3.00 0.00 0.00
Paving 7 18.00 0.00 0.00 10.80
10.80 7.30 20.00 LD_Mix HDT_Mix HHDT
7.30 20.00 LD_Mix HDT_Mix HHDT
Building Construction 5 13.00 5.00 0.00
Grading 4 10.00 0.00 356.00 10.80
10.80 7.30 20.00 LD_Mix HDT_Mix HHDT
7.30 20.00 LD_Mix HDT_Mix HHDT
Site Preparation 2 5.00 0.00 0.00
Demolition 4 10.00 0.00 0.00 10.80
Worker Trip Length
Vendor Trip Length
Hauling Trip Length
Worker Vehicle Class
Vendor Vehicle Class
Hauling Vehicle Class
Trips and VMT
Phase Name Offroad Equipment Count
Worker Trip Number
Vendor Trip Number
Hauling Trip Number
Architectural Coating Air Compressors 1 6.00 78 0.48
Paving Tractors/Loaders/Backhoes 1 7.00 97 0.37
Paving Rollers 1 7.00 80 0.38
Paving Pavers 1 7.00 130 0.42
Paving Cement and Mortar Mixers 4 6.00 9 0.56
Building Construction Tractors/Loaders/Backhoes 2 8.00 97 0.37
Building Construction Forklifts 2 6.00 89 0.20
Building Construction Cranes 1 4.00 231 0.29

0.0000 1,179.3075
1,179.3075 0.2319 1,185.1047
0.7774 0.7318 1.5092 0.1177 0.6978 0.8155Total 1.2100 10.4978 7.9182 0.0120
0.0000 1,179.3075
1,179.3075 0.2319 1,185.1047
0.7318 0.7318 0.6978 0.6978Off-Road 1.2100 10.4978 7.9182 0.0120
0.0000 0.00000.7774 0.0000 0.7774 0.1177 0.0000 0.1177Fugitive Dust
Total CO2 CH4 N2O CO2e
Category lb/day lb/day
PM10 Total
Fugitive PM2.5
Exhaust PM2.5
PM2.5 Total
Bio- CO2 NBio- CO2
Mitigated Construction On-Site
ROG NOx CO SO2 Fugitive PM10
Exhaust PM10
92.3112 92.3112 3.4300e-003
92.39690.0822 6.0000e-004
0.0828 0.0218 5.6000e-004
0.0224Total 0.0470 0.0347 0.3860 9.3000e-004
92.3112 92.3112 3.4300e-003
92.39690.0822 6.0000e-004
0.0828 0.0218 5.6000e-004
0.0224Worker 0.0470 0.0347 0.3860 9.3000e-004
0.0000 0.0000 0.0000 0.00000.0000 0.0000 0.0000 0.0000 0.0000 0.0000Vendor 0.0000 0.0000 0.0000 0.0000
0.0000 0.0000 0.0000 0.00000.0000 0.0000 0.0000 0.0000 0.0000 0.0000Hauling 0.0000 0.0000 0.0000 0.0000
Total CO2 CH4 N2O CO2e
Category lb/day lb/day
PM10 Total
Fugitive PM2.5
Exhaust PM2.5
PM2.5 Total
Bio- CO2 NBio- CO2
Unmitigated Construction Off-Site
ROG NOx CO SO2 Fugitive PM10
Exhaust PM10
1,179.3075
1,179.3075 0.2319 1,185.1047
1.9933 0.7318 2.7250 0.3019 0.6978 0.9996Total 1.2100 10.4978 7.9182 0.0120
1,179.3075
1,179.3075 0.2319 1,185.1047
0.7318 0.7318 0.6978 0.6978Off-Road 1.2100 10.4978 7.9182 0.0120
0.0000 0.00001.9933 0.0000 1.9933 0.3019 0.0000 0.3019Fugitive Dust

Total CO2 CH4 N2O CO2ePM10 Total
Fugitive PM2.5
Exhaust PM2.5
PM2.5 Total
Bio- CO2 NBio- CO2
Unmitigated Construction Off-Site
ROG NOx CO SO2 Fugitive PM10
Exhaust PM10
999.5201 999.5201 0.3063 1,007.1764
0.5303 0.4726 1.0028 0.0573 0.4347 0.4920Total 0.8524 10.5148 4.3533 9.7700e-003
999.5201 999.5201 0.3063 1,007.1764
0.4726 0.4726 0.4347 0.4347Off-Road 0.8524 10.5148 4.3533 9.7700e-003
0.0000 0.00000.5303 0.0000 0.5303 0.0573 0.0000 0.0573Fugitive Dust
Total CO2 CH4 N2O CO2e
Category lb/day lb/day
PM10 Total
Fugitive PM2.5
Exhaust PM2.5
PM2.5 Total
Bio- CO2 NBio- CO2
3.3 Site Preparation - 2017Unmitigated Construction On-Site
ROG NOx CO SO2 Fugitive PM10
Exhaust PM10
92.3112 92.3112 3.4300e-003
92.39690.0822 6.0000e-004
0.0828 0.0218 5.6000e-004
0.0224Total 0.0470 0.0347 0.3860 9.3000e-004
92.3112 92.3112 3.4300e-003
92.39690.0822 6.0000e-004
0.0828 0.0218 5.6000e-004
0.0224Worker 0.0470 0.0347 0.3860 9.3000e-004
0.0000 0.0000 0.0000 0.00000.0000 0.0000 0.0000 0.0000 0.0000 0.0000Vendor 0.0000 0.0000 0.0000 0.0000
0.0000 0.0000 0.0000 0.00000.0000 0.0000 0.0000 0.0000 0.0000 0.0000Hauling 0.0000 0.0000 0.0000 0.0000
Total CO2 CH4 N2O CO2e
Category lb/day lb/day
PM10 Total
Fugitive PM2.5
Exhaust PM2.5
PM2.5 Total
Bio- CO2 NBio- CO2
Mitigated Construction Off-Site
ROG NOx CO SO2 Fugitive PM10
Exhaust PM10

46.1556 46.1556 1.7100e-003
46.19840.0411 3.0000e-004
0.0414 0.0109 2.8000e-004
0.0112Worker 0.0235 0.0173 0.1930 4.6000e-004
0.0000 0.0000 0.0000 0.00000.0000 0.0000 0.0000 0.0000 0.0000 0.0000Vendor 0.0000 0.0000 0.0000 0.0000
0.0000 0.0000 0.0000 0.00000.0000 0.0000 0.0000 0.0000 0.0000 0.0000Hauling 0.0000 0.0000 0.0000 0.0000
Total CO2 CH4 N2O CO2e
Category lb/day lb/day
PM10 Total
Fugitive PM2.5
Exhaust PM2.5
PM2.5 Total
Bio- CO2 NBio- CO2
Mitigated Construction Off-Site
ROG NOx CO SO2 Fugitive PM10
Exhaust PM10
0.0000 999.5201 999.5201 0.3063 1,007.1764
0.2068 0.4726 0.6794 0.0223 0.4347 0.4571Total 0.8524 10.5148 4.3533 9.7700e-003
0.0000 999.5201 999.5201 0.3063 1,007.1764
0.4726 0.4726 0.4347 0.4347Off-Road 0.8524 10.5148 4.3533 9.7700e-003
0.0000 0.00000.2068 0.0000 0.2068 0.0223 0.0000 0.0223Fugitive Dust
Total CO2 CH4 N2O CO2e
Category lb/day lb/day
PM10 Total
Fugitive PM2.5
Exhaust PM2.5
PM2.5 Total
Bio- CO2 NBio- CO2
Mitigated Construction On-Site
ROG NOx CO SO2 Fugitive PM10
Exhaust PM10
46.1556 46.1556 1.7100e-003
46.19840.0411 3.0000e-004
0.0414 0.0109 2.8000e-004
0.0112Total 0.0235 0.0173 0.1930 4.6000e-004
46.1556 46.1556 1.7100e-003
46.19840.0411 3.0000e-004
0.0414 0.0109 2.8000e-004
0.0112Worker 0.0235 0.0173 0.1930 4.6000e-004
0.0000 0.0000 0.0000 0.00000.0000 0.0000 0.0000 0.0000 0.0000 0.0000Vendor 0.0000 0.0000 0.0000 0.0000
0.0000 0.0000 0.0000 0.00000.0000 0.0000 0.0000 0.0000 0.0000 0.0000Hauling 0.0000 0.0000 0.0000 0.0000
Category lb/day lb/day

Mitigated Construction On-Site
15,793.6496
15,793.6496
1.3979 15,828.5967
3.1926 0.3485 3.5411 0.8742 0.3334 1.2076Total 1.9642 61.7055 12.7914 0.1458
92.3112 92.3112 3.4300e-003
92.39690.0822 6.0000e-004
0.0828 0.0218 5.6000e-004
0.0224Worker 0.0470 0.0347 0.3860 9.3000e-004
0.0000 0.0000 0.0000 0.00000.0000 0.0000 0.0000 0.0000 0.0000 0.0000Vendor 0.0000 0.0000 0.0000 0.0000
15,701.3384
15,701.3384
1.3945 15,736.1998
3.1105 0.3479 3.4583 0.8525 0.3328 1.1853Hauling 1.9172 61.6708 12.4054 0.1448
Total CO2 CH4 N2O CO2e
Category lb/day lb/day
PM10 Total
Fugitive PM2.5
Exhaust PM2.5
PM2.5 Total
Bio- CO2 NBio- CO2
Unmitigated Construction Off-Site
ROG NOx CO SO2 Fugitive PM10
Exhaust PM10
1,179.3075
1,179.3075 0.2319 1,185.1047
0.9530 0.7318 1.6848 0.4441 0.6978 1.1419Total 1.2100 10.4978 7.9182 0.0120
1,179.3075
1,179.3075 0.2319 1,185.1047
0.7318 0.7318 0.6978 0.6978Off-Road 1.2100 10.4978 7.9182 0.0120
0.0000 0.00000.9530 0.0000 0.9530 0.4441 0.0000 0.4441Fugitive Dust
Total CO2 CH4 N2O CO2e
Category lb/day lb/day
PM10 Total
Fugitive PM2.5
Exhaust PM2.5
PM2.5 Total
Bio- CO2 NBio- CO2
3.4 Grading - 2017Unmitigated Construction On-Site
ROG NOx CO SO2 Fugitive PM10
Exhaust PM10
46.1556 46.1556 1.7100e-003
46.19840.0411 3.0000e-004
0.0414 0.0109 2.8000e-004
0.0112Total 0.0235 0.0173 0.1930 4.6000e-004

Total CO2 CH4 N2O CO2e
Category lb/day lb/day
PM10 Total
Fugitive PM2.5
Exhaust PM2.5
PM2.5 Total
Bio- CO2 NBio- CO2
3.5 Building Construction - 2017Unmitigated Construction On-Site
ROG NOx CO SO2 Fugitive PM10
Exhaust PM10
15,793.6496
15,793.6496
1.3979 15,828.5967
3.1926 0.3485 3.5411 0.8742 0.3334 1.2076Total 1.9642 61.7055 12.7914 0.1458
92.3112 92.3112 3.4300e-003
92.39690.0822 6.0000e-004
0.0828 0.0218 5.6000e-004
0.0224Worker 0.0470 0.0347 0.3860 9.3000e-004
0.0000 0.0000 0.0000 0.00000.0000 0.0000 0.0000 0.0000 0.0000 0.0000Vendor 0.0000 0.0000 0.0000 0.0000
15,701.3384
15,701.3384
1.3945 15,736.1998
3.1105 0.3479 3.4583 0.8525 0.3328 1.1853Hauling 1.9172 61.6708 12.4054 0.1448
Total CO2 CH4 N2O CO2e
Category lb/day lb/day
PM10 Total
Fugitive PM2.5
Exhaust PM2.5
PM2.5 Total
Bio- CO2 NBio- CO2
Mitigated Construction Off-Site
ROG NOx CO SO2 Fugitive PM10
Exhaust PM10
0.0000 1,179.3075
1,179.3075 0.2319 1,185.1047
0.3717 0.7318 1.1034 0.1732 0.6978 0.8710Total 1.2100 10.4978 7.9182 0.0120
0.0000 1,179.3075
1,179.3075 0.2319 1,185.1047
0.7318 0.7318 0.6978 0.6978Off-Road 1.2100 10.4978 7.9182 0.0120
0.0000 0.00000.3717 0.0000 0.3717 0.1732 0.0000 0.1732Fugitive Dust
Total CO2 CH4 N2O CO2e
Category lb/day lb/day
PM10 Total
Fugitive PM2.5
Exhaust PM2.5
PM2.5 Total
Bio- CO2 NBio- CO2ROG NOx CO SO2 Fugitive PM10
Exhaust PM10

0.0000 1,165.9164
1,165.9164 0.3572 1,174.8473
0.8591 0.8591 0.7904 0.7904Total 1.2812 12.7589 8.0700 0.0114
0.0000 1,165.9164
1,165.9164 0.3572 1,174.8473
0.8591 0.8591 0.7904 0.7904Off-Road 1.2812 12.7589 8.0700 0.0114
Total CO2 CH4 N2O CO2e
Category lb/day lb/day
PM10 Total
Fugitive PM2.5
Exhaust PM2.5
PM2.5 Total
Bio- CO2 NBio- CO2
Mitigated Construction On-Site
ROG NOx CO SO2 Fugitive PM10
Exhaust PM10
269.5561 269.5561 0.0168 269.97670.1406 7.3700e-003
0.1480 0.0381 7.0200e-003
0.0451Total 0.0909 0.7509 0.6955 2.6100e-003
120.0046 120.0046 4.4500e-003
120.11590.1068 7.9000e-004
0.1076 0.0283 7.3000e-004
0.0291Worker 0.0611 0.0451 0.5018 1.2100e-003
149.5515 149.5515 0.0124 149.86080.0339 6.5800e-003
0.0404 9.7400e-003
6.2900e-003
0.0160Vendor 0.0298 0.7058 0.1937 1.4000e-003
0.0000 0.0000 0.0000 0.00000.0000 0.0000 0.0000 0.0000 0.0000 0.0000Hauling 0.0000 0.0000 0.0000 0.0000
Total CO2 CH4 N2O CO2e
Category lb/day lb/day
PM10 Total
Fugitive PM2.5
Exhaust PM2.5
PM2.5 Total
Bio- CO2 NBio- CO2
Unmitigated Construction Off-Site
ROG NOx CO SO2 Fugitive PM10
Exhaust PM10
1,165.9164
1,165.9164 0.3572 1,174.8473
0.8591 0.8591 0.7904 0.7904Total 1.2812 12.7589 8.0700 0.0114
1,165.9164
1,165.9164 0.3572 1,174.8473
0.8591 0.8591 0.7904 0.7904Off-Road 1.2812 12.7589 8.0700 0.0114

Total CO2 CH4 N2O CO2ePM10 Total
Fugitive PM2.5
Exhaust PM2.5
PM2.5 Total
Bio- CO2 NBio- CO2
Unmitigated Construction Off-Site
ROG NOx CO SO2 Fugitive PM10
Exhaust PM10
1,085.1071
1,085.1071 0.3018 1,092.6515
0.6087 0.6087 0.5636 0.5636Total 1.1266 9.9754 7.3425 0.0113
0.0000 0.00000.0000 0.0000 0.0000 0.0000Paving 0.0734
1,085.1071
1,085.1071 0.3018 1,092.6515
0.6087 0.6087 0.5636 0.5636Off-Road 1.0532 9.9754 7.3425 0.0113
Total CO2 CH4 N2O CO2e
Category lb/day lb/day
PM10 Total
Fugitive PM2.5
Exhaust PM2.5
PM2.5 Total
Bio- CO2 NBio- CO2
3.6 Paving - 2017Unmitigated Construction On-Site
ROG NOx CO SO2 Fugitive PM10
Exhaust PM10
269.5561 269.5561 0.0168 269.97670.1406 7.3700e-003
0.1480 0.0381 7.0200e-003
0.0451Total 0.0909 0.7509 0.6955 2.6100e-003
120.0046 120.0046 4.4500e-003
120.11590.1068 7.9000e-004
0.1076 0.0283 7.3000e-004
0.0291Worker 0.0611 0.0451 0.5018 1.2100e-003
149.5515 149.5515 0.0124 149.86080.0339 6.5800e-003
0.0404 9.7400e-003
6.2900e-003
0.0160Vendor 0.0298 0.7058 0.1937 1.4000e-003
0.0000 0.0000 0.0000 0.00000.0000 0.0000 0.0000 0.0000 0.0000 0.0000Hauling 0.0000 0.0000 0.0000 0.0000
Total CO2 CH4 N2O CO2e
Category lb/day lb/day
PM10 Total
Fugitive PM2.5
Exhaust PM2.5
PM2.5 Total
Bio- CO2 NBio- CO2
Mitigated Construction Off-Site
ROG NOx CO SO2 Fugitive PM10
Exhaust PM10

166.1602 166.1602 6.1700e-003
166.31440.1479 1.0900e-003
0.1490 0.0392 1.0100e-003
0.0402Worker 0.0846 0.0624 0.6948 1.6700e-003
0.0000 0.0000 0.0000 0.00000.0000 0.0000 0.0000 0.0000 0.0000 0.0000Vendor 0.0000 0.0000 0.0000 0.0000
0.0000 0.0000 0.0000 0.00000.0000 0.0000 0.0000 0.0000 0.0000 0.0000Hauling 0.0000 0.0000 0.0000 0.0000
Total CO2 CH4 N2O CO2e
Category lb/day lb/day
PM10 Total
Fugitive PM2.5
Exhaust PM2.5
PM2.5 Total
Bio- CO2 NBio- CO2
Mitigated Construction Off-Site
ROG NOx CO SO2 Fugitive PM10
Exhaust PM10
0.0000 1,085.1071
1,085.1071 0.3018 1,092.6515
0.6087 0.6087 0.5636 0.5636Total 1.1266 9.9754 7.3425 0.0113
0.0000 0.00000.0000 0.0000 0.0000 0.0000Paving 0.0734
0.0000 1,085.1071
1,085.1071 0.3018 1,092.6515
0.6087 0.6087 0.5636 0.5636Off-Road 1.0532 9.9754 7.3425 0.0113
Total CO2 CH4 N2O CO2e
Category lb/day lb/day
PM10 Total
Fugitive PM2.5
Exhaust PM2.5
PM2.5 Total
Bio- CO2 NBio- CO2
Mitigated Construction On-Site
ROG NOx CO SO2 Fugitive PM10
Exhaust PM10
166.1602 166.1602 6.1700e-003
166.31440.1479 1.0900e-003
0.1490 0.0392 1.0100e-003
0.0402Total 0.0846 0.0624 0.6948 1.6700e-003
166.1602 166.1602 6.1700e-003
166.31440.1479 1.0900e-003
0.1490 0.0392 1.0100e-003
0.0402Worker 0.0846 0.0624 0.6948 1.6700e-003
0.0000 0.0000 0.0000 0.00000.0000 0.0000 0.0000 0.0000 0.0000 0.0000Vendor 0.0000 0.0000 0.0000 0.0000
0.0000 0.0000 0.0000 0.00000.0000 0.0000 0.0000 0.0000 0.0000 0.0000Hauling 0.0000 0.0000 0.0000 0.0000
Category lb/day lb/day

Mitigated Construction On-Site
27.6934 27.6934 1.0300e-003
27.71910.0246 1.8000e-004
0.0248 6.5400e-003
1.7000e-004
6.7000e-003
Total 0.0141 0.0104 0.1158 2.8000e-004
27.6934 27.6934 1.0300e-003
27.71910.0246 1.8000e-004
0.0248 6.5400e-003
1.7000e-004
6.7000e-003
Worker 0.0141 0.0104 0.1158 2.8000e-004
0.0000 0.0000 0.0000 0.00000.0000 0.0000 0.0000 0.0000 0.0000 0.0000Vendor 0.0000 0.0000 0.0000 0.0000
0.0000 0.0000 0.0000 0.00000.0000 0.0000 0.0000 0.0000 0.0000 0.0000Hauling 0.0000 0.0000 0.0000 0.0000
Total CO2 CH4 N2O CO2e
Category lb/day lb/day
PM10 Total
Fugitive PM2.5
Exhaust PM2.5
PM2.5 Total
Bio- CO2 NBio- CO2
Unmitigated Construction Off-Site
ROG NOx CO SO2 Fugitive PM10
Exhaust PM10
281.4481 281.4481 0.0297 282.19090.1733 0.1733 0.1733 0.1733Total 52.6003 2.1850 1.8681 2.9700e-003
281.4481 281.4481 0.0297 282.19090.1733 0.1733 0.1733 0.1733Off-Road 0.3323 2.1850 1.8681 2.9700e-003
0.0000 0.00000.0000 0.0000 0.0000 0.0000Archit. Coating 52.2680
Total CO2 CH4 N2O CO2e
Category lb/day lb/day
PM10 Total
Fugitive PM2.5
Exhaust PM2.5
PM2.5 Total
Bio- CO2 NBio- CO2
3.7 Architectural Coating - 2017Unmitigated Construction On-Site
ROG NOx CO SO2 Fugitive PM10
Exhaust PM10
166.1602 166.1602 6.1700e-003
166.31440.1479 1.0900e-003
0.1490 0.0392 1.0100e-003
0.0402Total 0.0846 0.0624 0.6948 1.6700e-003

4.0 Operational Detail - Mobile
4.1 Mitigation Measures Mobile
27.6934 27.6934 1.0300e-003
27.71910.0246 1.8000e-004
0.0248 6.5400e-003
1.7000e-004
6.7000e-003
Total 0.0141 0.0104 0.1158 2.8000e-004
27.6934 27.6934 1.0300e-003
27.71910.0246 1.8000e-004
0.0248 6.5400e-003
1.7000e-004
6.7000e-003
Worker 0.0141 0.0104 0.1158 2.8000e-004
0.0000 0.0000 0.0000 0.00000.0000 0.0000 0.0000 0.0000 0.0000 0.0000Vendor 0.0000 0.0000 0.0000 0.0000
0.0000 0.0000 0.0000 0.00000.0000 0.0000 0.0000 0.0000 0.0000 0.0000Hauling 0.0000 0.0000 0.0000 0.0000
Total CO2 CH4 N2O CO2e
Category lb/day lb/day
PM10 Total
Fugitive PM2.5
Exhaust PM2.5
PM2.5 Total
Bio- CO2 NBio- CO2
Mitigated Construction Off-Site
ROG NOx CO SO2 Fugitive PM10
Exhaust PM10
0.0000 281.4481 281.4481 0.0297 282.19090.1733 0.1733 0.1733 0.1733Total 52.6003 2.1850 1.8681 2.9700e-003
0.0000 281.4481 281.4481 0.0297 282.19090.1733 0.1733 0.1733 0.1733Off-Road 0.3323 2.1850 1.8681 2.9700e-003
0.0000 0.00000.0000 0.0000 0.0000 0.0000Archit. Coating 52.2680
Total CO2 CH4 N2O CO2e
Category lb/day lb/day
PM10 Total
Fugitive PM2.5
Exhaust PM2.5
PM2.5 Total
Bio- CO2 NBio- CO2ROG NOx CO SO2 Fugitive PM10
Exhaust PM10

0.022073 0.001871 0.002173 0.006385 0.000739 0.001452
0.000739 0.001452
Other Asphalt Surfaces 0.574135 0.045525 0.189369 0.116519 0.019283 0.005646 0.014833
0.005646 0.014833 0.022073 0.001871 0.002173 0.006385University/College (4Yr) 0.574135 0.045525 0.189369 0.116519 0.019283
0.022073 0.001871 0.002173 0.006385 0.000739 0.001452
SBUS MH
Junior College (2Yr) 0.574135 0.045525 0.189369 0.116519 0.019283 0.005646 0.014833
LHD2 MHD HHD OBUS UBUS MCYLand Use LDA LDT1 LDT2 MDV LHD1
88.60 5.00 91 9 0
4.4 Fleet Mix
0.00 0.00 0 0 0
University/College (4Yr) 9.50 7.30 7.30 6.40
88.60 5.00 92 7 1
Other Asphalt Surfaces 9.50 7.30 7.30 0.00
H-S or C-C H-O or C-NW Primary Diverted Pass-by
Junior College (2Yr) 9.50 7.30 7.30 6.40
4.3 Trip Type Information
Miles Trip % Trip Purpose %
Land Use H-W or C-W H-S or C-C H-O or C-NW H-W or C-W
Total 468.21 238.18 14.74 939,539 939,539University/College (4Yr) 133.38 101.40 0.00 277,206 277,206Other Asphalt Surfaces 0.00 0.00 0.00
Annual VMT
Junior College (2Yr) 334.83 136.78 14.74 662,333 662,333
4.2 Trip Summary Information
Average Daily Trip Rate Unmitigated MitigatedLand Use Weekday Saturday Sunday Annual VMT
3,335.9857
3,335.9857 0.1913 3,340.7689
2.5183 0.0377 2.5560 0.6733 0.0356 0.7088Unmitigated 1.0148 3.9610 11.3997 0.0330
3,335.9857
3,335.9857 0.1913 3,340.7689
2.5183 0.0377 2.5560 0.6733 0.0356 0.7088Mitigated 1.0148 3.9610 11.3997 0.0330
NBio- CO2 Total CO2 CH4 N2O CO2e
Category lb/day lb/day
Exhaust PM10
PM10 Total
Fugitive PM2.5
Exhaust PM2.5
PM2.5 Total
Bio- CO2ROG NOx CO SO2 Fugitive PM10

291.9082 291.9082 5.6000e-003
5.3600e-003
293.64290.0185 0.0185 0.0185 0.0185Total 0.0268 0.2433 0.2043 1.4600e-003
148.6416 148.6416 2.8500e-003
2.7300e-003
149.52499.4100e-003
9.4100e-003
9.4100e-003
9.4100e-003
University/College (4Yr)
1263.45 0.0136 0.1239 0.1041 7.4000e-004
0.0000 0.0000 0.0000 0.0000 0.00000.0000 0.0000 0.0000 0.0000Other Asphalt Surfaces
0 0.0000 0.0000 0.0000 0.0000
143.2666 143.2666 2.7500e-003
2.6300e-003
144.11809.0700e-003
9.0700e-003
9.0700e-003
9.0700e-003
Junior College (2Yr)
1217.77 0.0131 0.1194 0.1003 7.2000e-004
Total CO2 CH4 N2O CO2e
Land Use kBTU/yr lb/day lb/day
PM10 Total
Fugitive PM2.5
Exhaust PM2.5
PM2.5 Total
Bio- CO2 NBio- CO2
5.2 Energy by Land Use - NaturalGasUnmitigated
NaturalGas Use
ROG NOx CO SO2 Fugitive PM10
Exhaust PM10
291.9082 291.9082 5.5900e-003
5.3500e-003
293.64290.0185 0.0185 0.0185 0.0185NaturalGas Unmitigated
0.0268 0.2433 0.2043 1.4600e-003
291.9082 291.9082 5.5900e-003
5.3500e-003
293.64290.0185 0.0185 0.0185 0.0185NaturalGas Mitigated
0.0268 0.2433 0.2043 1.4600e-003
NBio- CO2 Total CO2 CH4 N2O CO2e
Category lb/day lb/day
Exhaust PM10
PM10 Total
Fugitive PM2.5
Exhaust PM2.5
PM2.5 Total
Bio- CO2
5.0 Energy Detail
Historical Energy Use: N
5.1 Mitigation Measures Energy
ROG NOx CO SO2 Fugitive PM10

6.2 Area by SubCategoryUnmitigated
0.0211 0.0211 6.0000e-005
0.02254.0000e-005
4.0000e-005
4.0000e-005
4.0000e-005
Unmitigated 0.6051 9.0000e-005
9.9600e-003
0.0000
0.0211 0.0211 6.0000e-005
0.02254.0000e-005
4.0000e-005
4.0000e-005
4.0000e-005
Mitigated 0.6051 9.0000e-005
9.9600e-003
0.0000
NBio- CO2 Total CO2 CH4 N2O CO2e
Category lb/day lb/day
Exhaust PM10
PM10 Total
Fugitive PM2.5
Exhaust PM2.5
PM2.5 Total
Bio- CO2
6.0 Area Detail
6.1 Mitigation Measures Area
ROG NOx CO SO2 Fugitive PM10
291.9082 291.9082 5.6000e-003
5.3600e-003
293.64290.0185 0.0185 0.0185 0.0185Total 0.0268 0.2433 0.2043 1.4600e-003
148.6416 148.6416 2.8500e-003
2.7300e-003
149.52499.4100e-003
9.4100e-003
9.4100e-003
9.4100e-003
University/College (4Yr)
1.26345 0.0136 0.1239 0.1041 7.4000e-004
0.0000 0.0000 0.0000 0.0000 0.00000.0000 0.0000 0.0000 0.0000Other Asphalt Surfaces
0 0.0000 0.0000 0.0000 0.0000
143.2666 143.2666 2.7500e-003
2.6300e-003
144.11809.0700e-003
9.0700e-003
9.0700e-003
9.0700e-003
Junior College (2Yr)
1.21777 0.0131 0.1194 0.1003 7.2000e-004
Total CO2 CH4 N2O CO2e
Land Use kBTU/yr lb/day lb/day
PM10 Total
Fugitive PM2.5
Exhaust PM2.5
PM2.5 Total
Bio- CO2 NBio- CO2
Mitigated
NaturalGas Use
ROG NOx CO SO2 Fugitive PM10
Exhaust PM10

7.0 Water Detail
7.1 Mitigation Measures Water
Apply Water Conservation Strategy
8.0 Waste Detail
0.0211 0.0211 6.0000e-005
0.02254.0000e-005
4.0000e-005
4.0000e-005
4.0000e-005
Total 0.6051 9.0000e-005
9.9600e-003
0.0000
0.0211 0.0211 6.0000e-005
0.02254.0000e-005
4.0000e-005
4.0000e-005
4.0000e-005
Landscaping 9.5000e-004
9.0000e-005
9.9600e-003
0.0000
0.0000 0.00000.0000 0.0000 0.0000 0.0000Consumer Products
0.5333
0.0000 0.00000.0000 0.0000 0.0000 0.0000Architectural Coating
0.0709
Total CO2 CH4 N2O CO2e
SubCategory lb/day lb/day
PM10 Total
Fugitive PM2.5
Exhaust PM2.5
PM2.5 Total
Bio- CO2 NBio- CO2
Mitigated
ROG NOx CO SO2 Fugitive PM10
Exhaust PM10
0.0211 0.0211 6.0000e-005
0.02254.0000e-005
4.0000e-005
4.0000e-005
4.0000e-005
Total 0.6051 9.0000e-005
9.9600e-003
0.0000
0.0211 0.0211 6.0000e-005
0.02254.0000e-005
4.0000e-005
4.0000e-005
4.0000e-005
Landscaping 9.5000e-004
9.0000e-005
9.9600e-003
0.0000
0.0000 0.00000.0000 0.0000 0.0000 0.0000Consumer Products
0.5333
0.0000 0.00000.0000 0.0000 0.0000 0.0000Architectural Coating
0.0709
Total CO2 CH4 N2O CO2e
SubCategory lb/day lb/day
PM10 Total
Fugitive PM2.5
Exhaust PM2.5
PM2.5 Total
Bio- CO2 NBio- CO2ROG NOx CO SO2 Fugitive PM10
Exhaust PM10

Fuel Type
User Defined Equipment
Equipment Type Number
11.0 Vegetation
Boilers
Equipment Type Number Heat Input/Day Heat Input/Year Boiler Rating
Fuel Type
10.0 Stationary Equipment
Fire Pumps and Emergency Generators
Equipment Type Number Hours/Day Hours/Year Horse Power Load Factor Fuel Type
Equipment Type Number Hours/Day Days/Year Horse Power Load Factor
8.1 Mitigation Measures Waste
9.0 Operational Offroad

Grading - 2,850 CY of backfill required to construct both buildings.
Architectural Coating - In compliance with Rule 67.0 Architectural Coatings, Interior coating VOC restricted to 100 grams per liter and exterior coating VOCs restricted to 150 grams per liter.
1.3 User Entered Comments & Non-Default Data
Project Characteristics - Anticipated construction start date July 2017. Anticipated operational start date: September 2018
Land Use - Tula Pavilion - 12,181 sqft of Interior space and 6,000 sqft of exterior space. Tenocha Community Space - 12,638 sqft and would support/house 78 students.Off-road Equipment - CalEEMod defaults assumed.
Trips and VMT - Worker Trips rounded to even values to account for 2 way trips.
Demolition - Approximately 20,000 sqft of demolition
CO2 Intensity (lb/MWhr)
720.49 CH4 Intensity (lb/MWhr)
0.029 N2O Intensity (lb/MWhr)
0.006
40
Climate Zone 13 Operational Year 2018
Utility Company San Diego Gas & Electric
1.2 Other Project Characteristics
Urbanization Urban Wind Speed (m/s) 2.6 Precipitation Freq (Days)
Other Asphalt Surfaces 6.00 1000sqft 0.14 6,000.00 0
University/College (4Yr) 78.00 Student 0.33 12,638.00 78
Floor Surface Area Population
Junior College (2Yr) 12.18 1000sqft 0.28 12,181.00 0
1.0 Project Characteristics
1.1 Land Usage
Land Uses Size Metric Lot Acreage
CalEEMod Version: CalEEMod.2016.3.1 Page 1 of 1 Date: 12/14/2016 1:37 PM
Tula Pavilion and Tenochca Community Space Project - San Diego County APCD Air District, Annual
Tula Pavilion and Tenochca Community Space ProjectSan Diego County APCD Air District, Annual
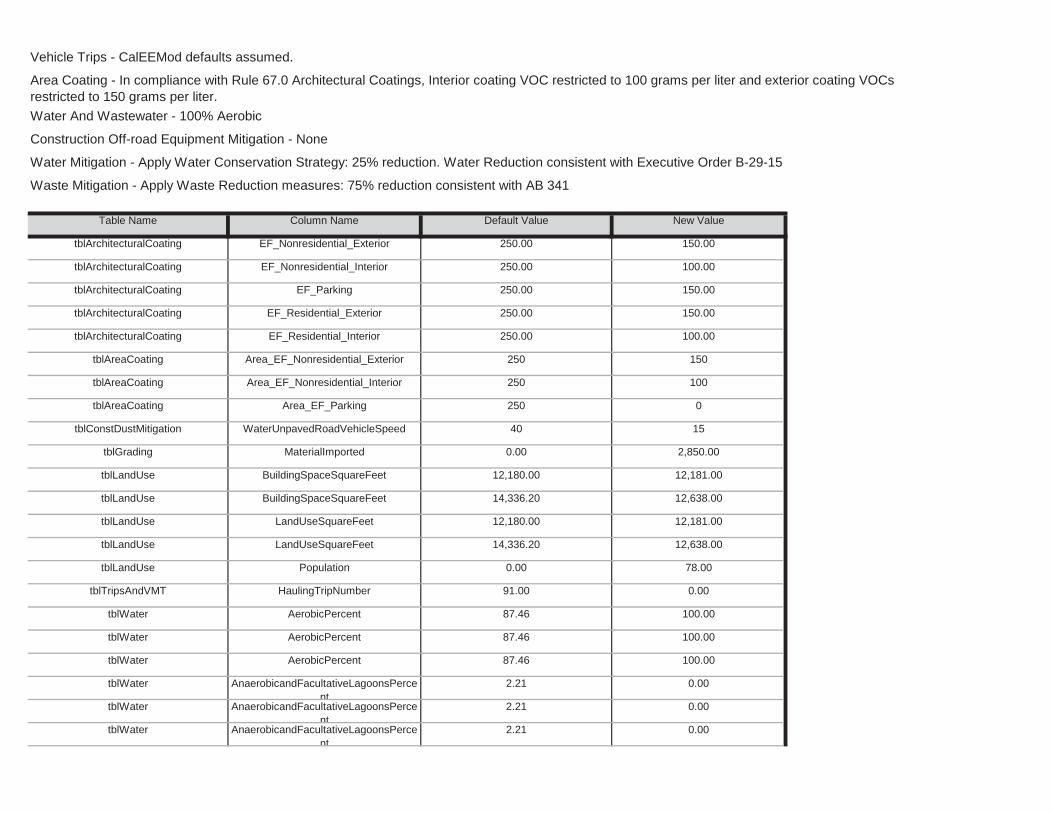
tblWater AnaerobicandFacultativeLagoonsPercent
2.21 0.00
tblWater AnaerobicandFacultativeLagoonsPercent
2.21 0.00
tblWater AerobicPercent 87.46 100.00
tblWater AnaerobicandFacultativeLagoonsPercent
2.21 0.00
tblWater AerobicPercent 87.46 100.00
tblWater AerobicPercent 87.46 100.00
tblLandUse Population 0.00 78.00
tblTripsAndVMT HaulingTripNumber 91.00 0.00
tblLandUse LandUseSquareFeet 12,180.00 12,181.00
tblLandUse LandUseSquareFeet 14,336.20 12,638.00
tblLandUse BuildingSpaceSquareFeet 12,180.00 12,181.00
tblLandUse BuildingSpaceSquareFeet 14,336.20 12,638.00
tblConstDustMitigation WaterUnpavedRoadVehicleSpeed 40 15
tblGrading MaterialImported 0.00 2,850.00
tblAreaCoating Area_EF_Nonresidential_Interior 250 100
tblAreaCoating Area_EF_Parking 250 0
tblArchitecturalCoating EF_Residential_Interior 250.00 100.00
tblAreaCoating Area_EF_Nonresidential_Exterior 250 150
tblArchitecturalCoating EF_Parking 250.00 150.00
tblArchitecturalCoating EF_Residential_Exterior 250.00 150.00
tblArchitecturalCoating EF_Nonresidential_Exterior 250.00 150.00
tblArchitecturalCoating EF_Nonresidential_Interior 250.00 100.00
Water Mitigation - Apply Water Conservation Strategy: 25% reduction. Water Reduction consistent with Executive Order B-29-15
Waste Mitigation - Apply Waste Reduction measures: 75% reduction consistent with AB 341
Table Name Column Name Default Value New Value
Vehicle Trips - CalEEMod defaults assumed.
Area Coating - In compliance with Rule 67.0 Architectural Coatings, Interior coating VOC restricted to 100 grams per liter and exterior coating VOCs restricted to 150 grams per liter.Water And Wastewater - 100% Aerobic
Construction Off-road Equipment Mitigation - None

0.0000 89.7945 89.7945 0.0205 0.0000 90.30580.0152 0.0503 0.0655 3.7200e-003
0.0465 0.0502Maximum 0.2131 0.8383 0.5273 9.6000e-004
0.0000 89.7945 89.7945 0.0205 0.0000 90.30580.0152 0.0503 0.0655 3.7200e-003
0.0465 0.05022017 0.2131 0.8383 0.5273 9.6000e-004
Total CO2 CH4 N2O CO2e
Year tons/yr MT/yr
PM10 Total
Fugitive PM2.5
Exhaust PM2.5
PM2.5 Total
Bio- CO2 NBio- CO2
Mitigated Construction
ROG NOx CO SO2 Fugitive PM10
Exhaust PM10
0.0000 89.7946 89.7946 0.0205 0.0000 90.30580.0220 0.0503 0.0723 4.9300e-003
0.0465 0.0514Maximum 0.2131 0.8383 0.5273 9.6000e-004
0.0000 89.7946 89.7946 0.0205 0.0000 90.30580.0220 0.0503 0.0723 4.9300e-003
0.0465 0.05142017 0.2131 0.8383 0.5273 9.6000e-004
CH4 N2O CO2e
Year tons/yr MT/yr
Fugitive PM2.5
Exhaust PM2.5
PM2.5 Total
Bio- CO2 NBio- CO2 Total CO2
Unmitigated Construction
ROG NOx CO SO2 Fugitive PM10
Exhaust PM10
PM10 Total
tblWater SepticTankPercent 10.33 0.00
2.0 Emissions Summary
2.1 Overall Construction
tblWater SepticTankPercent 10.33 0.00
tblWater SepticTankPercent 10.33 0.00

Total CO2 CH4 N2O CO2e
Category tons/yr MT/yr
PM10 Total
Fugitive PM2.5
Exhaust PM2.5
PM2.5 Total
Bio- CO2 NBio- CO2
Mitigated Operational
ROG NOx CO SO2 Fugitive PM10
Exhaust PM10
6.3724 546.8390 553.2113 0.3906 2.1500e-003
563.61810.3542 8.8200e-003
0.3630 0.0949 8.5000e-003
0.1034Total 0.2542 0.6350 1.6482 4.8100e-003
0.2705 7.5941 7.8645 1.2400e-003
6.5000e-004
8.08960.0000 0.0000 0.0000 0.0000Water
6.1019 0.0000 6.1019 0.3606 0.0000 15.11720.0000 0.0000 0.0000 0.0000Waste
0.0000 417.0227 417.0227 0.0249 0.0000 417.64400.3542 5.4500e-003
0.3597 0.0949 5.1300e-003
0.1000Mobile 0.1390 0.5906 1.6101 4.5400e-003
0.0000 122.2205 122.2205 3.9000e-003
1.5000e-003
122.76543.3700e-003
3.3700e-003
3.3700e-003
3.3700e-003
Energy 4.8800e-003
0.0444 0.0373 2.7000e-004
0.0000 1.7200e-003
1.7200e-003
0.0000 0.0000 1.8400e-003
0.0000 0.0000 0.0000 0.0000Area 0.1104 1.0000e-005
9.0000e-004
0.0000
Total CO2 CH4 N2O CO2e
Category tons/yr MT/yr
PM10 Total
Fugitive PM2.5
Exhaust PM2.5
PM2.5 Total
Bio- CO2 NBio- CO2
2.2 Overall OperationalUnmitigated Operational
ROG NOx CO SO2 Fugitive PM10
Exhaust PM10
2 9-1-2017 9-30-2017 0.1594 0.1594
Highest 0.5587 0.5587
Quarter Start Date End Date Maximum Unmitigated ROG + NOX (tons/quarter) Maximum Mitigated ROG + NOX (tons/quarter)
1 6-1-2017 8-31-2017 0.5587 0.5587
0.00 0.00 0.00 0.00 0.00 0.0030.97 0.00 9.43 24.54 0.00 2.35
NBio-CO2 Total CO2 CH4 N20 CO2e
Percent Reduction
0.00 0.00 0.00 0.00
Exhaust PM10
PM10 Total
Fugitive PM2.5
Exhaust PM2.5
PM2.5 Total
Bio- CO2ROG NOx CO SO2 Fugitive PM10

Load Factor
Acres of Grading (Site Preparation Phase): 0.5
Acres of Grading (Grading Phase): 0
Acres of Paving: 0.14
Residential Indoor: 0; Residential Outdoor: 0; Non-Residential Indoor: 37,229; Non-Residential Outdoor: 12,410; Striped Parking Area:
OffRoad Equipment
Phase Name Offroad Equipment Type Amount Usage Hours Horse Power
5
6 Architectural Coating Architectural Coating 11/14/2017 11/20/2017 5 5
5 Paving Paving 11/7/2017 11/13/2017 5
2
4 Building Construction Building Construction 6/20/2017 11/6/2017 5 100
3 Grading Grading 6/16/2017 6/19/2017 5
10
2 Site Preparation Site Preparation 6/15/2017 6/15/2017 5 1
End Date Num Days Week
Num Days Phase Description
1 Demolition Demolition 6/1/2017 6/14/2017 5
3.0 Construction Detail
Construction Phase
Phase Number
Phase Name Phase Type Start Date
1.06 0.35 0.36 0.08 7.44 0.360.00 0.00 0.00 0.00 0.00 0.00
NBio-CO2 Total CO2 CH4 N20 CO2e
Percent Reduction
0.00 0.00 0.00 0.00
Exhaust PM10
PM10 Total
Fugitive PM2.5
Exhaust PM2.5
PM2.5 Total
Bio- CO2ROG NOx CO SO2 Fugitive PM10
6.3048 544.9404 551.2452 0.3903 1.9900e-003
561.59570.3542 8.8200e-003
0.3630 0.0949 8.5000e-003
0.1034Total 0.2542 0.6350 1.6482 4.8100e-003
0.2028 5.6956 5.8984 9.3000e-004
4.9000e-004
6.06720.0000 0.0000 0.0000 0.0000Water
6.1019 0.0000 6.1019 0.3606 0.0000 15.11720.0000 0.0000 0.0000 0.0000Waste
0.0000 417.0227 417.0227 0.0249 0.0000 417.64400.3542 5.4500e-003
0.3597 0.0949 5.1300e-003
0.1000Mobile 0.1390 0.5906 1.6101 4.5400e-003
0.0000 122.2205 122.2205 3.9000e-003
1.5000e-003
122.76543.3700e-003
3.3700e-003
3.3700e-003
3.3700e-003
Energy 4.8800e-003
0.0444 0.0373 2.7000e-004
0.0000 1.7200e-003
1.7200e-003
0.0000 0.0000 1.8400e-003
0.0000 0.0000 0.0000 0.0000Area 0.1104 1.0000e-005
9.0000e-004
0.0000
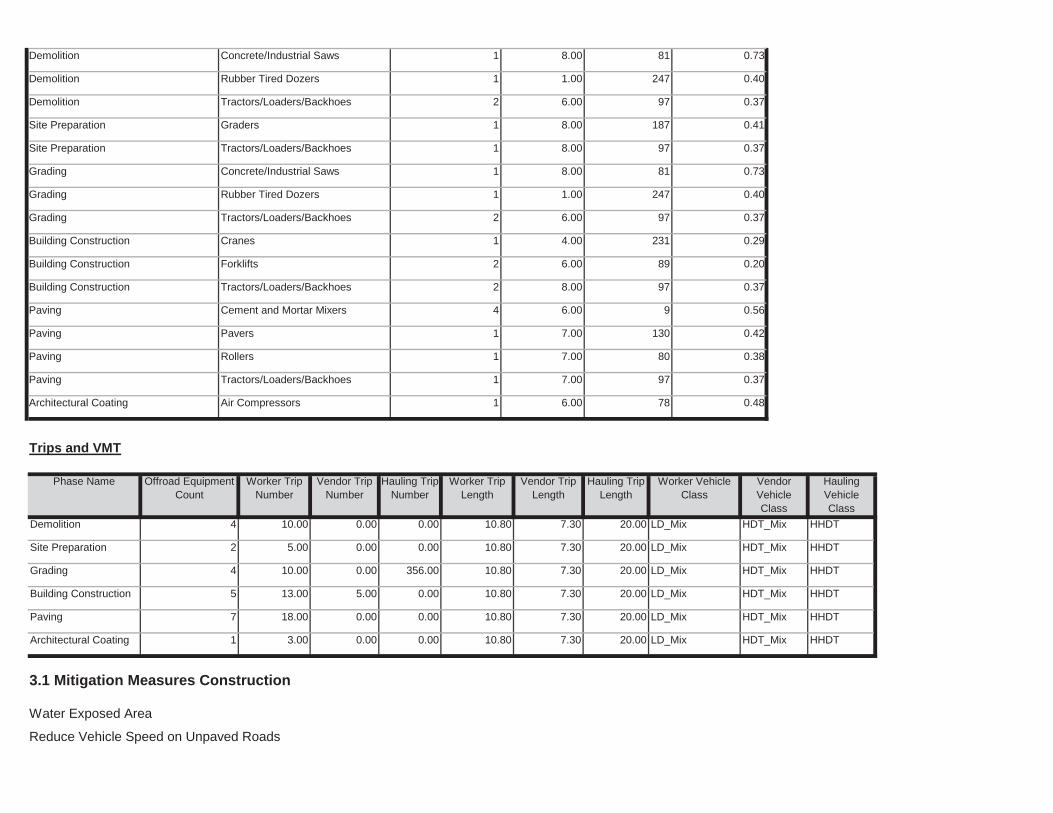
3.1 Mitigation Measures Construction
Water Exposed Area
Reduce Vehicle Speed on Unpaved Roads
10.80 7.30 20.00 LD_Mix HDT_Mix HHDT
7.30 20.00 LD_Mix HDT_Mix HHDT
Architectural Coating 1 3.00 0.00 0.00
Paving 7 18.00 0.00 0.00 10.80
10.80 7.30 20.00 LD_Mix HDT_Mix HHDT
7.30 20.00 LD_Mix HDT_Mix HHDT
Building Construction 5 13.00 5.00 0.00
Grading 4 10.00 0.00 356.00 10.80
10.80 7.30 20.00 LD_Mix HDT_Mix HHDT
7.30 20.00 LD_Mix HDT_Mix HHDT
Site Preparation 2 5.00 0.00 0.00
Demolition 4 10.00 0.00 0.00 10.80
Worker Trip Length
Vendor Trip Length
Hauling Trip Length
Worker Vehicle Class
Vendor Vehicle Class
Hauling Vehicle Class
Trips and VMT
Phase Name Offroad Equipment Count
Worker Trip Number
Vendor Trip Number
Hauling Trip Number
Architectural Coating Air Compressors 1 6.00 78 0.48
Paving Tractors/Loaders/Backhoes 1 7.00 97 0.37
Paving Rollers 1 7.00 80 0.38
Paving Pavers 1 7.00 130 0.42
Paving Cement and Mortar Mixers 4 6.00 9 0.56
Building Construction Tractors/Loaders/Backhoes 2 8.00 97 0.37
Building Construction Forklifts 2 6.00 89 0.20
Building Construction Cranes 1 4.00 231 0.29
Grading Tractors/Loaders/Backhoes 2 6.00 97 0.37
Grading Rubber Tired Dozers 1 1.00 247 0.40
Grading Concrete/Industrial Saws 1 8.00 81 0.73
Site Preparation Tractors/Loaders/Backhoes 1 8.00 97 0.37
Site Preparation Graders 1 8.00 187 0.41
Demolition Tractors/Loaders/Backhoes 2 6.00 97 0.37
Demolition Rubber Tired Dozers 1 1.00 247 0.40
Demolition Concrete/Industrial Saws 1 8.00 81 0.73

Mitigated Construction On-Site
0.0000 0.3971 0.3971 1.0000e-005
0.0000 0.39744.0000e-004
0.0000 4.0000e-004
1.1000e-004
0.0000 1.1000e-004
Total 2.4000e-004
1.9000e-004
1.8400e-003
0.0000
0.0000 0.3971 0.3971 1.0000e-005
0.0000 0.39744.0000e-004
0.0000 4.0000e-004
1.1000e-004
0.0000 1.1000e-004
Worker 2.4000e-004
1.9000e-004
1.8400e-003
0.0000
0.0000 0.0000 0.0000 0.0000 0.0000 0.00000.0000 0.0000 0.0000 0.0000 0.0000 0.0000Vendor 0.0000 0.0000 0.0000 0.0000
0.0000 0.0000 0.0000 0.0000 0.0000 0.00000.0000 0.0000 0.0000 0.0000 0.0000 0.0000Hauling 0.0000 0.0000 0.0000 0.0000
Total CO2 CH4 N2O CO2e
Category tons/yr MT/yr
PM10 Total
Fugitive PM2.5
Exhaust PM2.5
PM2.5 Total
Bio- CO2 NBio- CO2
Unmitigated Construction Off-Site
ROG NOx CO SO2 Fugitive PM10
Exhaust PM10
0.0000 5.3493 5.3493 1.0500e-003
0.0000 5.37559.9700e-003
3.6600e-003
0.0136 1.5100e-003
3.4900e-003
5.0000e-003
Total 6.0500e-003
0.0525 0.0396 6.0000e-005
0.0000 5.3493 5.3493 1.0500e-003
0.0000 5.37553.6600e-003
3.6600e-003
3.4900e-003
3.4900e-003
Off-Road 6.0500e-003
0.0525 0.0396 6.0000e-005
0.0000 0.0000 0.0000 0.0000 0.0000 0.00009.9700e-003
0.0000 9.9700e-003
1.5100e-003
0.0000 1.5100e-003
CO2e
Category tons/yr MT/yr
Fugitive Dust
PM2.5 Total
Bio- CO2 NBio- CO2 Total CO2 CH4 N2OSO2 Fugitive PM10
Exhaust PM10
PM10 Total
Fugitive PM2.5
Exhaust PM2.5
3.2 Demolition - 2017Unmitigated Construction On-Site
ROG NOx CO

0.0000 0.0000 0.0000 0.0000 0.0000 0.00002.7000e-004
0.0000 2.7000e-004
3.0000e-005
0.0000 3.0000e-005
Fugitive Dust
Total CO2 CH4 N2O CO2e
Category tons/yr MT/yr
PM10 Total
Fugitive PM2.5
Exhaust PM2.5
PM2.5 Total
Bio- CO2 NBio- CO2
3.3 Site Preparation - 2017Unmitigated Construction On-Site
ROG NOx CO SO2 Fugitive PM10
Exhaust PM10
0.0000 0.3971 0.3971 1.0000e-005
0.0000 0.39744.0000e-004
0.0000 4.0000e-004
1.1000e-004
0.0000 1.1000e-004
Total 2.4000e-004
1.9000e-004
1.8400e-003
0.0000
0.0000 0.3971 0.3971 1.0000e-005
0.0000 0.39744.0000e-004
0.0000 4.0000e-004
1.1000e-004
0.0000 1.1000e-004
Worker 2.4000e-004
1.9000e-004
1.8400e-003
0.0000
0.0000 0.0000 0.0000 0.0000 0.0000 0.00000.0000 0.0000 0.0000 0.0000 0.0000 0.0000Vendor 0.0000 0.0000 0.0000 0.0000
0.0000 0.0000 0.0000 0.0000 0.0000 0.00000.0000 0.0000 0.0000 0.0000 0.0000 0.0000Hauling 0.0000 0.0000 0.0000 0.0000
Total CO2 CH4 N2O CO2e
Category tons/yr MT/yr
PM10 Total
Fugitive PM2.5
Exhaust PM2.5
PM2.5 Total
Bio- CO2 NBio- CO2
Mitigated Construction Off-Site
ROG NOx CO SO2 Fugitive PM10
Exhaust PM10
0.0000 5.3492 5.3492 1.0500e-003
0.0000 5.37553.8900e-003
3.6600e-003
7.5500e-003
5.9000e-004
3.4900e-003
4.0800e-003
Total 6.0500e-003
0.0525 0.0396 6.0000e-005
0.0000 5.3492 5.3492 1.0500e-003
0.0000 5.37553.6600e-003
3.6600e-003
3.4900e-003
3.4900e-003
Off-Road 6.0500e-003
0.0525 0.0396 6.0000e-005
0.0000 0.0000 0.0000 0.0000 0.0000 0.00003.8900e-003
0.0000 3.8900e-003
5.9000e-004
0.0000 5.9000e-004
Fugitive Dust
Total CO2 CH4 N2O CO2e
Category tons/yr MT/yr
PM10 Total
Fugitive PM2.5
Exhaust PM2.5
PM2.5 Total
Bio- CO2 NBio- CO2ROG NOx CO SO2 Fugitive PM10
Exhaust PM10

Mitigated Construction Off-Site
0.0000 0.4534 0.4534 1.4000e-004
0.0000 0.45691.0000e-004
2.4000e-004
3.4000e-004
1.0000e-005
2.2000e-004
2.3000e-004
Total 4.3000e-004
5.2600e-003
2.1800e-003
0.0000
0.0000 0.4534 0.4534 1.4000e-004
0.0000 0.45692.4000e-004
2.4000e-004
2.2000e-004
2.2000e-004
Off-Road 4.3000e-004
5.2600e-003
2.1800e-003
0.0000
0.0000 0.0000 0.0000 0.0000 0.0000 0.00001.0000e-004
0.0000 1.0000e-004
1.0000e-005
0.0000 1.0000e-005
Fugitive Dust
Total CO2 CH4 N2O CO2e
Category tons/yr MT/yr
PM10 Total
Fugitive PM2.5
Exhaust PM2.5
PM2.5 Total
Bio- CO2 NBio- CO2
Mitigated Construction On-Site
ROG NOx CO SO2 Fugitive PM10
Exhaust PM10
0.0000 0.0199 0.0199 0.0000 0.0000 0.01992.0000e-005
0.0000 2.0000e-005
1.0000e-005
0.0000 1.0000e-005
Total 1.0000e-005
1.0000e-005
9.0000e-005
0.0000
0.0000 0.0199 0.0199 0.0000 0.0000 0.01992.0000e-005
0.0000 2.0000e-005
1.0000e-005
0.0000 1.0000e-005
Worker 1.0000e-005
1.0000e-005
9.0000e-005
0.0000
0.0000 0.0000 0.0000 0.0000 0.0000 0.00000.0000 0.0000 0.0000 0.0000 0.0000 0.0000Vendor 0.0000 0.0000 0.0000 0.0000
0.0000 0.0000 0.0000 0.0000 0.0000 0.00000.0000 0.0000 0.0000 0.0000 0.0000 0.0000Hauling 0.0000 0.0000 0.0000 0.0000
Total CO2 CH4 N2O CO2e
Category tons/yr MT/yr
PM10 Total
Fugitive PM2.5
Exhaust PM2.5
PM2.5 Total
Bio- CO2 NBio- CO2
Unmitigated Construction Off-Site
ROG NOx CO SO2 Fugitive PM10
Exhaust PM10
0.0000 0.4534 0.4534 1.4000e-004
0.0000 0.45692.7000e-004
2.4000e-004
5.1000e-004
3.0000e-005
2.2000e-004
2.5000e-004
Total 4.3000e-004
5.2600e-003
2.1800e-003
0.0000
0.0000 0.4534 0.4534 1.4000e-004
0.0000 0.45692.4000e-004
2.4000e-004
2.2000e-004
2.2000e-004
Off-Road 4.3000e-004
5.2600e-003
2.1800e-003
0.0000
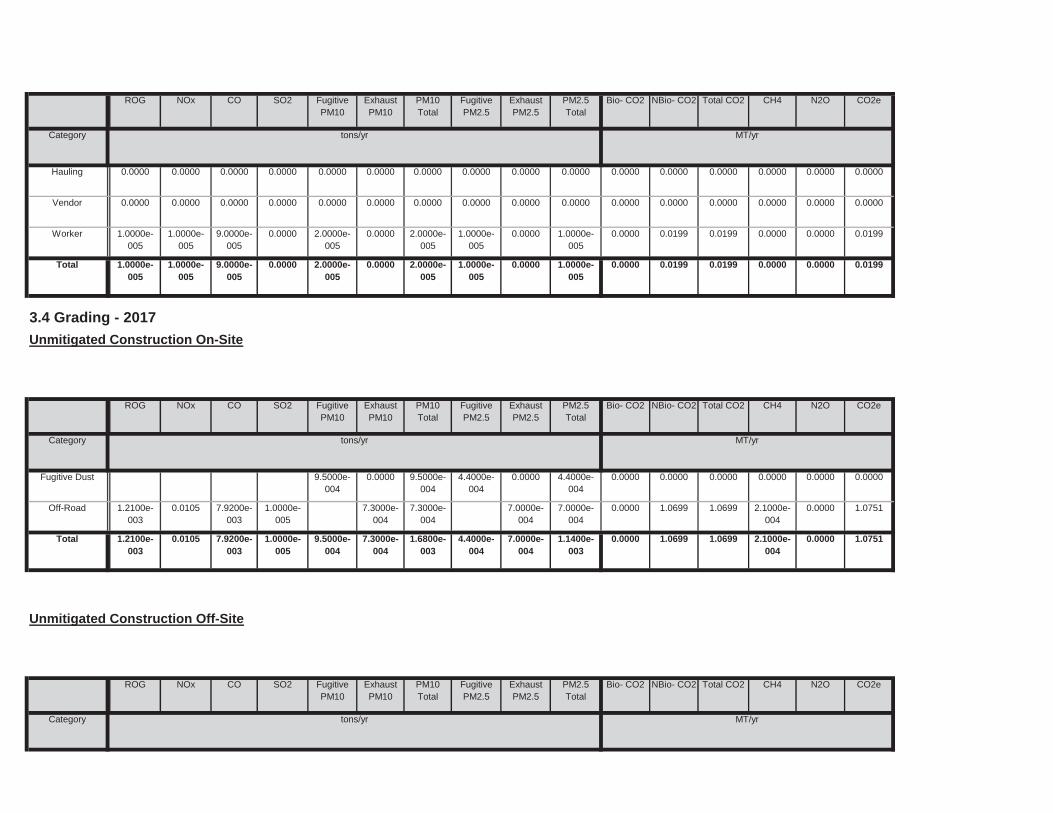
Total CO2 CH4 N2O CO2e
Category tons/yr MT/yr
PM10 Total
Fugitive PM2.5
Exhaust PM2.5
PM2.5 Total
Bio- CO2 NBio- CO2
Unmitigated Construction Off-Site
ROG NOx CO SO2 Fugitive PM10
Exhaust PM10
0.0000 1.0699 1.0699 2.1000e-004
0.0000 1.07519.5000e-004
7.3000e-004
1.6800e-003
4.4000e-004
7.0000e-004
1.1400e-003
Total 1.2100e-003
0.0105 7.9200e-003
1.0000e-005
0.0000 1.0699 1.0699 2.1000e-004
0.0000 1.07517.3000e-004
7.3000e-004
7.0000e-004
7.0000e-004
Off-Road 1.2100e-003
0.0105 7.9200e-003
1.0000e-005
0.0000 0.0000 0.0000 0.0000 0.0000 0.00009.5000e-004
0.0000 9.5000e-004
4.4000e-004
0.0000 4.4000e-004
Fugitive Dust
Total CO2 CH4 N2O CO2e
Category tons/yr MT/yr
PM10 Total
Fugitive PM2.5
Exhaust PM2.5
PM2.5 Total
Bio- CO2 NBio- CO2
3.4 Grading - 2017Unmitigated Construction On-Site
ROG NOx CO SO2 Fugitive PM10
Exhaust PM10
0.0000 0.0199 0.0199 0.0000 0.0000 0.01992.0000e-005
0.0000 2.0000e-005
1.0000e-005
0.0000 1.0000e-005
Total 1.0000e-005
1.0000e-005
9.0000e-005
0.0000
0.0000 0.0199 0.0199 0.0000 0.0000 0.01992.0000e-005
0.0000 2.0000e-005
1.0000e-005
0.0000 1.0000e-005
Worker 1.0000e-005
1.0000e-005
9.0000e-005
0.0000
0.0000 0.0000 0.0000 0.0000 0.0000 0.00000.0000 0.0000 0.0000 0.0000 0.0000 0.0000Vendor 0.0000 0.0000 0.0000 0.0000
0.0000 0.0000 0.0000 0.0000 0.0000 0.00000.0000 0.0000 0.0000 0.0000 0.0000 0.0000Hauling 0.0000 0.0000 0.0000 0.0000
Total CO2 CH4 N2O CO2e
Category tons/yr MT/yr
PM10 Total
Fugitive PM2.5
Exhaust PM2.5
PM2.5 Total
Bio- CO2 NBio- CO2ROG NOx CO SO2 Fugitive PM10
Exhaust PM10

0.0000 14.2280 14.2280 1.2900e-003
0.0000 14.26023.1300e-003
3.5000e-004
3.4800e-003
8.6000e-004
3.4000e-004
1.1900e-003
Total 1.9900e-003
0.0630 0.0132 1.4000e-004
0.0000 0.0794 0.0794 0.0000 0.0000 0.07958.0000e-005
0.0000 8.0000e-005
2.0000e-005
0.0000 2.0000e-005
Worker 5.0000e-005
4.0000e-005
3.7000e-004
0.0000
0.0000 0.0000 0.0000 0.0000 0.0000 0.00000.0000 0.0000 0.0000 0.0000 0.0000 0.0000Vendor 0.0000 0.0000 0.0000 0.0000
0.0000 14.1486 14.1486 1.2900e-003
0.0000 14.18073.0500e-003
3.5000e-004
3.4000e-003
8.4000e-004
3.4000e-004
1.1700e-003
Hauling 1.9400e-003
0.0630 0.0128 1.4000e-004
Total CO2 CH4 N2O CO2e
Category tons/yr MT/yr
PM10 Total
Fugitive PM2.5
Exhaust PM2.5
PM2.5 Total
Bio- CO2 NBio- CO2
Mitigated Construction Off-Site
ROG NOx CO SO2 Fugitive PM10
Exhaust PM10
0.0000 1.0699 1.0699 2.1000e-004
0.0000 1.07513.7000e-004
7.3000e-004
1.1000e-003
1.7000e-004
7.0000e-004
8.7000e-004
Total 1.2100e-003
0.0105 7.9200e-003
1.0000e-005
0.0000 1.0699 1.0699 2.1000e-004
0.0000 1.07517.3000e-004
7.3000e-004
7.0000e-004
7.0000e-004
Off-Road 1.2100e-003
0.0105 7.9200e-003
1.0000e-005
0.0000 0.0000 0.0000 0.0000 0.0000 0.00003.7000e-004
0.0000 3.7000e-004
1.7000e-004
0.0000 1.7000e-004
Fugitive Dust
Total CO2 CH4 N2O CO2e
Category tons/yr MT/yr
PM10 Total
Fugitive PM2.5
Exhaust PM2.5
PM2.5 Total
Bio- CO2 NBio- CO2
Mitigated Construction On-Site
ROG NOx CO SO2 Fugitive PM10
Exhaust PM10
0.0000 14.2280 14.2280 1.2900e-003
0.0000 14.26023.1300e-003
3.5000e-004
3.4800e-003
8.6000e-004
3.4000e-004
1.1900e-003
Total 1.9900e-003
0.0630 0.0132 1.4000e-004
0.0000 0.0794 0.0794 0.0000 0.0000 0.07958.0000e-005
0.0000 8.0000e-005
2.0000e-005
0.0000 2.0000e-005
Worker 5.0000e-005
4.0000e-005
3.7000e-004
0.0000
0.0000 0.0000 0.0000 0.0000 0.0000 0.00000.0000 0.0000 0.0000 0.0000 0.0000 0.0000Vendor 0.0000 0.0000 0.0000 0.0000
0.0000 14.1486 14.1486 1.2900e-003
0.0000 14.18073.0500e-003
3.5000e-004
3.4000e-003
8.4000e-004
3.4000e-004
1.1700e-003
Hauling 1.9400e-003
0.0630 0.0128 1.4000e-004

Mitigated Construction On-Site
0.0000 11.8760 11.8760 7.7000e-004
0.0000 11.89536.8700e-003
3.7000e-004
7.2400e-003
1.8700e-003
3.6000e-004
2.2200e-003
Total 4.5800e-003
0.0383 0.0341 1.3000e-004
0.0000 5.1617 5.1617 1.9000e-004
0.0000 5.16665.2100e-003
4.0000e-005
5.2500e-003
1.3900e-003
4.0000e-005
1.4200e-003
Worker 3.0700e-003
2.4900e-003
0.0239 6.0000e-005
0.0000 6.7143 6.7143 5.8000e-004
0.0000 6.72871.6600e-003
3.3000e-004
1.9900e-003
4.8000e-004
3.2000e-004
8.0000e-004
Vendor 1.5100e-003
0.0358 0.0102 7.0000e-005
0.0000 0.0000 0.0000 0.0000 0.0000 0.00000.0000 0.0000 0.0000 0.0000 0.0000 0.0000Hauling 0.0000 0.0000 0.0000 0.0000
Total CO2 CH4 N2O CO2e
Category tons/yr MT/yr
PM10 Total
Fugitive PM2.5
Exhaust PM2.5
PM2.5 Total
Bio- CO2 NBio- CO2
Unmitigated Construction Off-Site
ROG NOx CO SO2 Fugitive PM10
Exhaust PM10
0.0000 52.8851 52.8851 0.0162 0.0000 53.29020.0430 0.0430 0.0395 0.0395Total 0.0641 0.6380 0.4035 5.7000e-004
0.0000 52.8851 52.8851 0.0162 0.0000 53.29020.0430 0.0430 0.0395 0.0395Off-Road 0.0641 0.6380 0.4035 5.7000e-004
Total CO2 CH4 N2O CO2e
Category tons/yr MT/yr
PM10 Total
Fugitive PM2.5
Exhaust PM2.5
PM2.5 Total
Bio- CO2 NBio- CO2
3.5 Building Construction - 2017Unmitigated Construction On-Site
ROG NOx CO SO2 Fugitive PM10
Exhaust PM10

0.0000 2.4610 2.4610 6.8000e-004
0.0000 2.47811.5200e-003
1.5200e-003
1.4100e-003
1.4100e-003
Off-Road 2.6300e-003
0.0249 0.0184 3.0000e-005
Total CO2 CH4 N2O CO2e
Category tons/yr MT/yr
PM10 Total
Fugitive PM2.5
Exhaust PM2.5
PM2.5 Total
Bio- CO2 NBio- CO2
3.6 Paving - 2017Unmitigated Construction On-Site
ROG NOx CO SO2 Fugitive PM10
Exhaust PM10
0.0000 11.8760 11.8760 7.7000e-004
0.0000 11.89536.8700e-003
3.7000e-004
7.2400e-003
1.8700e-003
3.6000e-004
2.2200e-003
Total 4.5800e-003
0.0383 0.0341 1.3000e-004
0.0000 5.1617 5.1617 1.9000e-004
0.0000 5.16665.2100e-003
4.0000e-005
5.2500e-003
1.3900e-003
4.0000e-005
1.4200e-003
Worker 3.0700e-003
2.4900e-003
0.0239 6.0000e-005
0.0000 6.7143 6.7143 5.8000e-004
0.0000 6.72871.6600e-003
3.3000e-004
1.9900e-003
4.8000e-004
3.2000e-004
8.0000e-004
Vendor 1.5100e-003
0.0358 0.0102 7.0000e-005
0.0000 0.0000 0.0000 0.0000 0.0000 0.00000.0000 0.0000 0.0000 0.0000 0.0000 0.0000Hauling 0.0000 0.0000 0.0000 0.0000
Total CO2 CH4 N2O CO2e
Category tons/yr MT/yr
PM10 Total
Fugitive PM2.5
Exhaust PM2.5
PM2.5 Total
Bio- CO2 NBio- CO2
Mitigated Construction Off-Site
ROG NOx CO SO2 Fugitive PM10
Exhaust PM10
0.0000 52.8850 52.8850 0.0162 0.0000 53.29010.0430 0.0430 0.0395 0.0395Total 0.0641 0.6380 0.4035 5.7000e-004
0.0000 52.8850 52.8850 0.0162 0.0000 53.29010.0430 0.0430 0.0395 0.0395Off-Road 0.0641 0.6380 0.4035 5.7000e-004
Total CO2 CH4 N2O CO2e
Category tons/yr MT/yr
PM10 Total
Fugitive PM2.5
Exhaust PM2.5
PM2.5 Total
Bio- CO2 NBio- CO2ROG NOx CO SO2 Fugitive PM10
Exhaust PM10
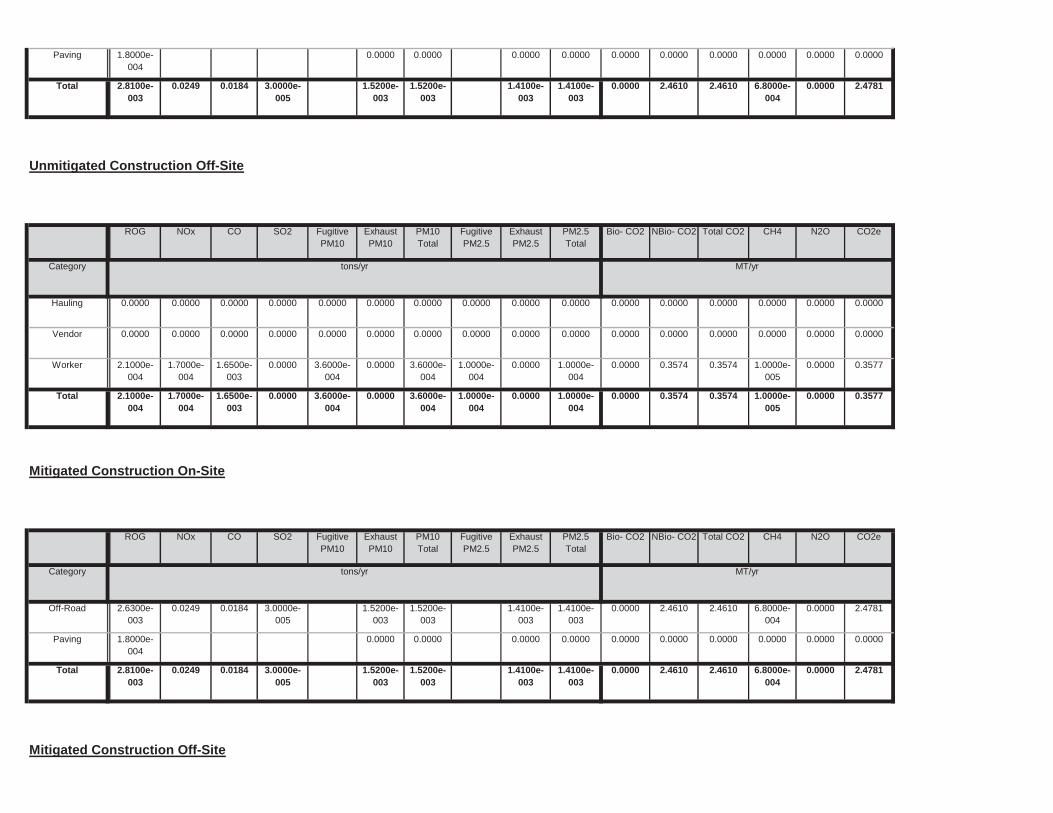
Mitigated Construction Off-Site
0.0000 2.4610 2.4610 6.8000e-004
0.0000 2.47811.5200e-003
1.5200e-003
1.4100e-003
1.4100e-003
Total 2.8100e-003
0.0249 0.0184 3.0000e-005
0.0000 0.0000 0.0000 0.0000 0.0000 0.00000.0000 0.0000 0.0000 0.0000Paving 1.8000e-004
0.0000 2.4610 2.4610 6.8000e-004
0.0000 2.47811.5200e-003
1.5200e-003
1.4100e-003
1.4100e-003
Off-Road 2.6300e-003
0.0249 0.0184 3.0000e-005
Total CO2 CH4 N2O CO2e
Category tons/yr MT/yr
PM10 Total
Fugitive PM2.5
Exhaust PM2.5
PM2.5 Total
Bio- CO2 NBio- CO2
Mitigated Construction On-Site
ROG NOx CO SO2 Fugitive PM10
Exhaust PM10
0.0000 0.3574 0.3574 1.0000e-005
0.0000 0.35773.6000e-004
0.0000 3.6000e-004
1.0000e-004
0.0000 1.0000e-004
Total 2.1000e-004
1.7000e-004
1.6500e-003
0.0000
0.0000 0.3574 0.3574 1.0000e-005
0.0000 0.35773.6000e-004
0.0000 3.6000e-004
1.0000e-004
0.0000 1.0000e-004
Worker 2.1000e-004
1.7000e-004
1.6500e-003
0.0000
0.0000 0.0000 0.0000 0.0000 0.0000 0.00000.0000 0.0000 0.0000 0.0000 0.0000 0.0000Vendor 0.0000 0.0000 0.0000 0.0000
0.0000 0.0000 0.0000 0.0000 0.0000 0.00000.0000 0.0000 0.0000 0.0000 0.0000 0.0000Hauling 0.0000 0.0000 0.0000 0.0000
Total CO2 CH4 N2O CO2e
Category tons/yr MT/yr
PM10 Total
Fugitive PM2.5
Exhaust PM2.5
PM2.5 Total
Bio- CO2 NBio- CO2
Unmitigated Construction Off-Site
ROG NOx CO SO2 Fugitive PM10
Exhaust PM10
0.0000 2.4610 2.4610 6.8000e-004
0.0000 2.47811.5200e-003
1.5200e-003
1.4100e-003
1.4100e-003
Total 2.8100e-003
0.0249 0.0184 3.0000e-005
0.0000 0.0000 0.0000 0.0000 0.0000 0.00000.0000 0.0000 0.0000 0.0000Paving 1.8000e-004

Total CO2 CH4 N2O CO2e
Category tons/yr MT/yr
PM10 Total
Fugitive PM2.5
Exhaust PM2.5
PM2.5 Total
Bio- CO2 NBio- CO2
Unmitigated Construction Off-Site
ROG NOx CO SO2 Fugitive PM10
Exhaust PM10
0.0000 0.6383 0.6383 7.0000e-005
0.0000 0.64004.3000e-004
4.3000e-004
4.3000e-004
4.3000e-004
Total 0.1315 5.4600e-003
4.6700e-003
1.0000e-005
0.0000 0.6383 0.6383 7.0000e-005
0.0000 0.64004.3000e-004
4.3000e-004
4.3000e-004
4.3000e-004
Off-Road 8.3000e-004
5.4600e-003
4.6700e-003
1.0000e-005
0.0000 0.0000 0.0000 0.0000 0.0000 0.00000.0000 0.0000 0.0000 0.0000Archit. Coating 0.1307
Total CO2 CH4 N2O CO2e
Category tons/yr MT/yr
PM10 Total
Fugitive PM2.5
Exhaust PM2.5
PM2.5 Total
Bio- CO2 NBio- CO2
3.7 Architectural Coating - 2017Unmitigated Construction On-Site
ROG NOx CO SO2 Fugitive PM10
Exhaust PM10
0.0000 0.3574 0.3574 1.0000e-005
0.0000 0.35773.6000e-004
0.0000 3.6000e-004
1.0000e-004
0.0000 1.0000e-004
Total 2.1000e-004
1.7000e-004
1.6500e-003
0.0000
0.0000 0.3574 0.3574 1.0000e-005
0.0000 0.35773.6000e-004
0.0000 3.6000e-004
1.0000e-004
0.0000 1.0000e-004
Worker 2.1000e-004
1.7000e-004
1.6500e-003
0.0000
0.0000 0.0000 0.0000 0.0000 0.0000 0.00000.0000 0.0000 0.0000 0.0000 0.0000 0.0000Vendor 0.0000 0.0000 0.0000 0.0000
0.0000 0.0000 0.0000 0.0000 0.0000 0.00000.0000 0.0000 0.0000 0.0000 0.0000 0.0000Hauling 0.0000 0.0000 0.0000 0.0000
Total CO2 CH4 N2O CO2e
Category tons/yr MT/yr
PM10 Total
Fugitive PM2.5
Exhaust PM2.5
PM2.5 Total
Bio- CO2 NBio- CO2ROG NOx CO SO2 Fugitive PM10
Exhaust PM10

0.0000 0.0596 0.0596 0.0000 0.0000 0.05966.0000e-005
0.0000 6.0000e-005
2.0000e-005
0.0000 2.0000e-005
Total 4.0000e-005
3.0000e-005
2.8000e-004
0.0000
0.0000 0.0596 0.0596 0.0000 0.0000 0.05966.0000e-005
0.0000 6.0000e-005
2.0000e-005
0.0000 2.0000e-005
Worker 4.0000e-005
3.0000e-005
2.8000e-004
0.0000
0.0000 0.0000 0.0000 0.0000 0.0000 0.00000.0000 0.0000 0.0000 0.0000 0.0000 0.0000Vendor 0.0000 0.0000 0.0000 0.0000
0.0000 0.0000 0.0000 0.0000 0.0000 0.00000.0000 0.0000 0.0000 0.0000 0.0000 0.0000Hauling 0.0000 0.0000 0.0000 0.0000
Total CO2 CH4 N2O CO2e
Category tons/yr MT/yr
PM10 Total
Fugitive PM2.5
Exhaust PM2.5
PM2.5 Total
Bio- CO2 NBio- CO2
Mitigated Construction Off-Site
ROG NOx CO SO2 Fugitive PM10
Exhaust PM10
0.0000 0.6383 0.6383 7.0000e-005
0.0000 0.64004.3000e-004
4.3000e-004
4.3000e-004
4.3000e-004
Total 0.1315 5.4600e-003
4.6700e-003
1.0000e-005
0.0000 0.6383 0.6383 7.0000e-005
0.0000 0.64004.3000e-004
4.3000e-004
4.3000e-004
4.3000e-004
Off-Road 8.3000e-004
5.4600e-003
4.6700e-003
1.0000e-005
0.0000 0.0000 0.0000 0.0000 0.0000 0.00000.0000 0.0000 0.0000 0.0000Archit. Coating 0.1307
Total CO2 CH4 N2O CO2e
Category tons/yr MT/yr
PM10 Total
Fugitive PM2.5
Exhaust PM2.5
PM2.5 Total
Bio- CO2 NBio- CO2
Mitigated Construction On-Site
ROG NOx CO SO2 Fugitive PM10
Exhaust PM10
0.0000 0.0596 0.0596 0.0000 0.0000 0.05966.0000e-005
0.0000 6.0000e-005
2.0000e-005
0.0000 2.0000e-005
Total 4.0000e-005
3.0000e-005
2.8000e-004
0.0000
0.0000 0.0596 0.0596 0.0000 0.0000 0.05966.0000e-005
0.0000 6.0000e-005
2.0000e-005
0.0000 2.0000e-005
Worker 4.0000e-005
3.0000e-005
2.8000e-004
0.0000
0.0000 0.0000 0.0000 0.0000 0.0000 0.00000.0000 0.0000 0.0000 0.0000 0.0000 0.0000Vendor 0.0000 0.0000 0.0000 0.0000
0.0000 0.0000 0.0000 0.0000 0.0000 0.00000.0000 0.0000 0.0000 0.0000 0.0000 0.0000Hauling 0.0000 0.0000 0.0000 0.0000

88.60 5.00 91 9 0
4.4 Fleet Mix
0.00 0.00 0 0 0
University/College (4Yr) 9.50 7.30 7.30 6.40
88.60 5.00 92 7 1
Other Asphalt Surfaces 9.50 7.30 7.30 0.00
H-S or C-C H-O or C-NW Primary Diverted Pass-by
Junior College (2Yr) 9.50 7.30 7.30 6.40
4.3 Trip Type Information
Miles Trip % Trip Purpose %
Land Use H-W or C-W H-S or C-C H-O or C-NW H-W or C-W
Total 468.21 238.18 14.74 939,539 939,539University/College (4Yr) 133.38 101.40 0.00 277,206 277,206Other Asphalt Surfaces 0.00 0.00 0.00
Annual VMT
Junior College (2Yr) 334.83 136.78 14.74 662,333 662,333
4.2 Trip Summary Information
Average Daily Trip Rate Unmitigated MitigatedLand Use Weekday Saturday Sunday Annual VMT
0.0000 417.0227 417.0227 0.0249 0.0000 417.64400.3542 5.4500e-003
0.3597 0.0949 5.1300e-003
0.1000Unmitigated 0.1390 0.5906 1.6101 4.5400e-003
0.0000 417.0227 417.0227 0.0249 0.0000 417.64400.3542 5.4500e-003
0.3597 0.0949 5.1300e-003
0.1000Mitigated 0.1390 0.5906 1.6101 4.5400e-003
NBio- CO2 Total CO2 CH4 N2O CO2e
Category tons/yr MT/yr
Exhaust PM10
PM10 Total
Fugitive PM2.5
Exhaust PM2.5
PM2.5 Total
Bio- CO2
4.0 Operational Detail - Mobile
4.1 Mitigation Measures Mobile
ROG NOx CO SO2 Fugitive PM10

23.86041.6600e-003
0.0000 23.7194 23.7194 4.5000e-004
4.3000e-004
1.3000e-004
1.6600e-003
1.6600e-003
1.6600e-003
Junior College (2Yr)
444485 2.4000e-003
0.0218 0.0183
NBio- CO2 Total CO2 CH4 N2O CO2e
Land Use kBTU/yr tons/yr MT/yr
Exhaust PM10
PM10 Total
Fugitive PM2.5
Exhaust PM2.5
PM2.5 Total
Bio- CO2
5.2 Energy by Land Use - NaturalGasUnmitigated
NaturalGas Use
ROG NOx CO SO2 Fugitive PM10
0.0000 48.3287 48.3287 9.3000e-004
8.9000e-004
48.61593.3700e-003
3.3700e-003
3.3700e-003
3.3700e-003
NaturalGas Unmitigated
4.8800e-003
0.0444 0.0373 2.7000e-004
0.0000 48.3287 48.3287 9.3000e-004
8.9000e-004
48.61593.3700e-003
3.3700e-003
3.3700e-003
3.3700e-003
NaturalGas Mitigated
4.8800e-003
0.0444 0.0373 2.7000e-004
0.0000 73.8918 73.8918 2.9700e-003
6.2000e-004
74.14960.0000 0.0000 0.0000 0.0000Electricity Unmitigated
0.0000 73.8918 73.8918 2.9700e-003
6.2000e-004
74.14960.0000 0.0000 0.0000 0.0000Electricity Mitigated
NBio- CO2 Total CO2 CH4 N2O CO2e
Category tons/yr MT/yr
Exhaust PM10
PM10 Total
Fugitive PM2.5
Exhaust PM2.5
PM2.5 Total
Bio- CO2
5.0 Energy Detail
Historical Energy Use: N
5.1 Mitigation Measures Energy
ROG NOx CO SO2 Fugitive PM10
0.022073 0.001871 0.002173 0.006385 0.000739 0.001452
0.000739 0.001452
Other Asphalt Surfaces 0.574135 0.045525 0.189369 0.116519 0.019283 0.005646 0.014833
0.005646 0.014833 0.022073 0.001871 0.002173 0.006385University/College (4Yr) 0.574135 0.045525 0.189369 0.116519 0.019283
0.022073 0.001871 0.002173 0.006385 0.000739 0.001452
SBUS MH
Junior College (2Yr) 0.574135 0.045525 0.189369 0.116519 0.019283 0.005646 0.014833
LHD2 MHD HHD OBUS UBUS MCYLand Use LDA LDT1 LDT2 MDV LHD1
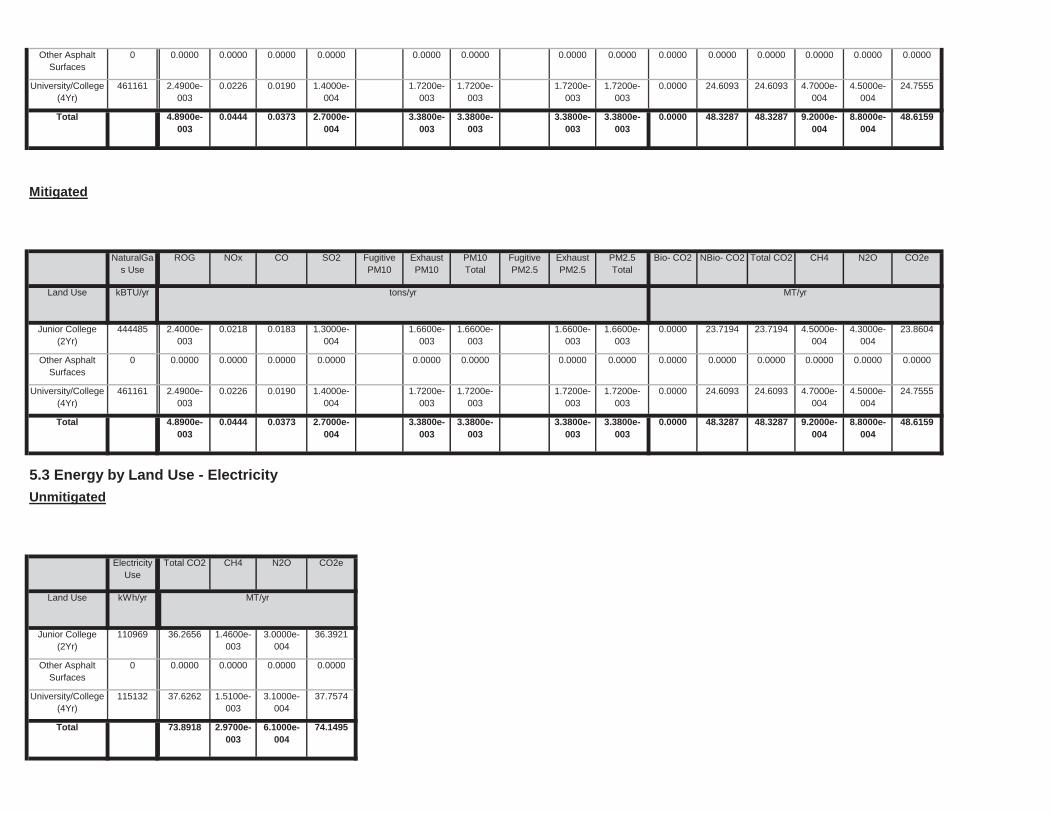
37.7574
Total 73.8918 2.9700e-003
6.1000e-004
74.1495
University/College (4Yr)
115132 37.6262 1.5100e-003
3.1000e-004
36.3921
Other Asphalt Surfaces
0 0.0000 0.0000 0.0000 0.0000
Land Use kWh/yr ton
MT/yr
Junior College (2Yr)
110969 36.2656 1.4600e-003
3.0000e-004
Unmitigated
Electricity Use
Total CO2 CH4 N2O CO2e
48.3287 48.3287 9.2000e-004
8.8000e-004
48.6159
5.3 Energy by Land Use - Electricity
3.3800e-003
3.3800e-003
3.3800e-003
3.3800e-003
0.0000
4.5000e-004
24.7555
Total 4.8900e-003
0.0444 0.0373 2.7000e-004
1.7200e-003
1.7200e-003
0.0000 24.6093 24.6093 4.7000e-004
0.0190 1.4000e-004
1.7200e-003
1.7200e-003
0.0000 0.0000 0.0000 0.0000 0.0000
University/College (4Yr)
461161 2.4900e-003
0.0226
0.0000 0.0000 0.0000 0.0000 0.0000
4.3000e-004
23.8604
Other Asphalt Surfaces
0 0.0000 0.0000 0.0000 0.0000
1.6600e-003
1.6600e-003
0.0000 23.7194 23.7194 4.5000e-004
0.0183 1.3000e-004
1.6600e-003
1.6600e-003
CO2e
Land Use kBTU/yr tons/yr MT/yr
Junior College (2Yr)
444485 2.4000e-003
0.0218
PM2.5 Total
Bio- CO2 NBio- CO2 Total CO2 CH4 N2OSO2 Fugitive PM10
Exhaust PM10
PM10 Total
Fugitive PM2.5
Exhaust PM2.5
NaturalGas Use
ROG NOx CO
48.3287 9.2000e-004
8.8000e-004
48.6159
Mitigated
3.3800e-003
3.3800e-003
3.3800e-003
0.0000 48.3287
24.7555
Total 4.8900e-003
0.0444 0.0373 2.7000e-004
3.3800e-003
1.7200e-003
0.0000 24.6093 24.6093 4.7000e-004
4.5000e-004
1.4000e-004
1.7200e-003
1.7200e-003
1.7200e-003
0.0000 0.0000 0.0000 0.0000
University/College (4Yr)
461161 2.4900e-003
0.0226 0.0190
0.0000 0.0000 0.0000 0.0000 0.0000Other Asphalt Surfaces
0 0.0000 0.0000 0.0000 0.0000 0.0000

6.2 Area by SubCategoryUnmitigated
0.0000 1.7200e-003
1.7200e-003
0.0000 0.0000 1.8400e-003
0.0000 0.0000 0.0000 0.0000Unmitigated 0.1104 1.0000e-005
9.0000e-004
0.0000
0.0000 1.7200e-003
1.7200e-003
0.0000 0.0000 1.8400e-003
0.0000 0.0000 0.0000 0.0000Mitigated 0.1104 1.0000e-005
9.0000e-004
0.0000
NBio- CO2 Total CO2 CH4 N2O CO2e
Category tons/yr MT/yr
Exhaust PM10
PM10 Total
Fugitive PM2.5
Exhaust PM2.5
PM2.5 Total
Bio- CO2
6.0 Area Detail
6.1 Mitigation Measures Area
ROG NOx CO SO2 Fugitive PM10
37.7574
Total 73.8918 2.9700e-003
6.1000e-004
74.1495
University/College (4Yr)
115132 37.6262 1.5100e-003
3.1000e-004
36.3921
Other Asphalt Surfaces
0 0.0000 0.0000 0.0000 0.0000
Land Use kWh/yr ton
MT/yr
Junior College (2Yr)
110969 36.2656 1.4600e-003
3.0000e-004
Mitigated
Electricity Use
Total CO2 CH4 N2O CO2e

7.0 Water Detail
7.1 Mitigation Measures Water
Apply Water Conservation Strategy
0.0000 1.7200e-003
1.7200e-003
0.0000 0.0000 1.8400e-003
0.0000 0.0000 0.0000 0.0000Total 0.1104 1.0000e-005
9.0000e-004
0.0000
0.0000 1.7200e-003
1.7200e-003
0.0000 0.0000 1.8400e-003
0.0000 0.0000 0.0000 0.0000Landscaping 9.0000e-005
1.0000e-005
9.0000e-004
0.0000
0.0000 0.0000 0.0000 0.0000 0.0000 0.00000.0000 0.0000 0.0000 0.0000Consumer Products
0.0973
0.0000 0.0000 0.0000 0.0000 0.0000 0.00000.0000 0.0000 0.0000 0.0000Architectural Coating
0.0129
Total CO2 CH4 N2O CO2e
SubCategory tons/yr MT/yr
PM10 Total
Fugitive PM2.5
Exhaust PM2.5
PM2.5 Total
Bio- CO2 NBio- CO2
Mitigated
ROG NOx CO SO2 Fugitive PM10
Exhaust PM10
0.0000 1.7200e-003
1.7200e-003
0.0000 0.0000 1.8400e-003
0.0000 0.0000 0.0000 0.0000Total 0.1104 1.0000e-005
9.0000e-004
0.0000
0.0000 1.7200e-003
1.7200e-003
0.0000 0.0000 1.8400e-003
0.0000 0.0000 0.0000 0.0000Landscaping 9.0000e-005
1.0000e-005
9.0000e-004
0.0000
0.0000 0.0000 0.0000 0.0000 0.0000 0.00000.0000 0.0000 0.0000 0.0000Consumer Products
0.0973
0.0000 0.0000 0.0000 0.0000 0.0000 0.00000.0000 0.0000 0.0000 0.0000Architectural Coating
0.0129
Total CO2 CH4 N2O CO2e
SubCategory tons/yr MT/yr
PM10 Total
Fugitive PM2.5
Exhaust PM2.5
PM2.5 Total
Bio- CO2 NBio- CO2ROG NOx CO SO2 Fugitive PM10
Exhaust PM10

Mitigated
Indoor/Outdoor Use
Total CO2 CH4 N2O CO2e
1.7674
Total 7.8645 1.2400e-003
6.5000e-004
8.0896
University/College (4Yr)
0.167006 / 0.261214
1.7182 2.7000e-004
1.4000e-004
6.3222
Other Asphalt Surfaces
0 / 0 0.0000 0.0000 0.0000 0.0000
Land Use Mgal ton
MT/yr
Junior College (2Yr)
0.597417 / 0.934422
6.1463 9.7000e-004
5.1000e-004
7.2 Water by Land UseUnmitigated
Indoor/Outdoor Use
Total CO2 CH4 N2O CO2e
Unmitigated 7.8645 1.2400e-003
6.5000e-004
8.0896
Category ton
MT/yr
Mitigated 5.8984 9.3000e-004
4.9000e-004
6.0672
Total CO2 CH4 N2O CO2e

Land Use tons ton
MT/yr
8.2 Waste by Land UseUnmitigated
Waste Disposed
Total CO2 CH4 N2O CO2e
Unmitigated 6.1019 0.3606 0.0000 15.1172
ton
MT/yr
Mitigated 6.1019 0.3606 0.0000 15.1172
8.0 Waste Detail
8.1 Mitigation Measures Waste
Category/Year
Total CO2 CH4 N2O CO2e
1.3255
Total 5.8984 9.2000e-004
4.9000e-004
6.0672
University/College (4Yr)
0.125254 / 0.195911
1.2886 2.0000e-004
1.1000e-004
4.7417
Other Asphalt Surfaces
0 / 0 0.0000 0.0000 0.0000 0.0000
Land Use Mgal ton
MT/yr
Junior College (2Yr)
0.448063 / 0.700816
4.6098 7.2000e-004
3.8000e-004
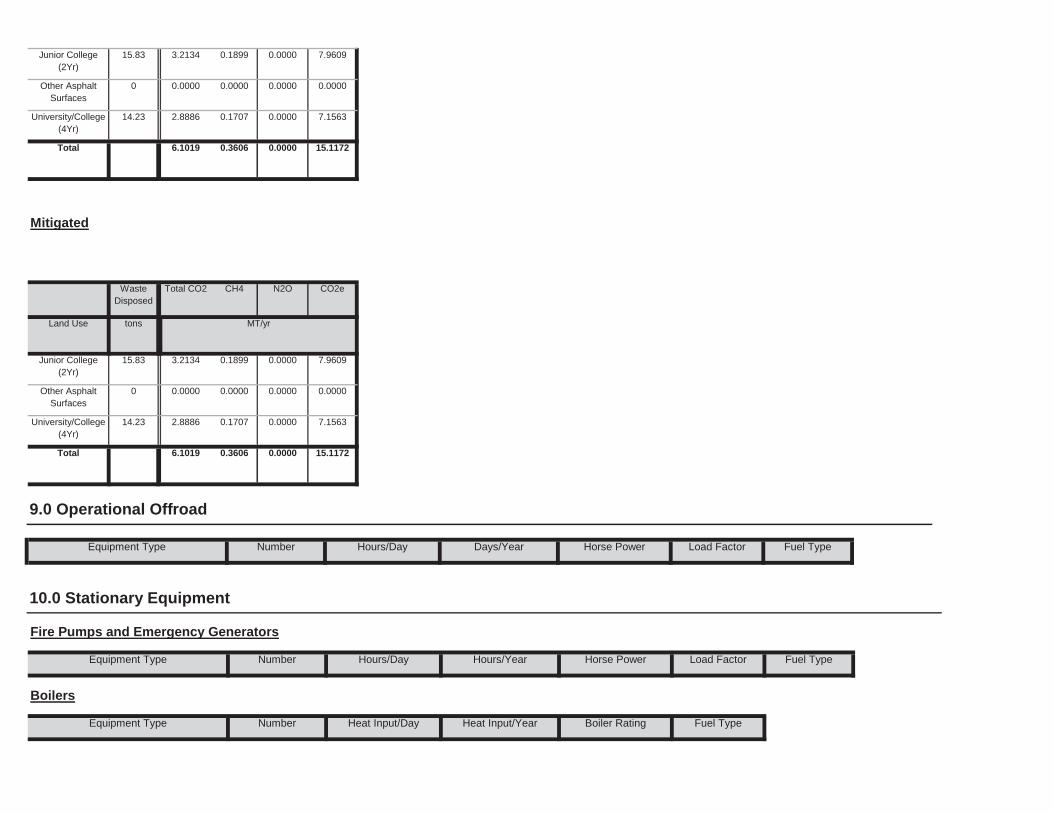
Fuel Type
Boilers
Equipment Type Number Heat Input/Day Heat Input/Year Boiler Rating Fuel Type
Load Factor Fuel Type
10.0 Stationary Equipment
Fire Pumps and Emergency Generators
Equipment Type Number Hours/Day Hours/Year Horse Power Load Factor
9.0 Operational Offroad
Equipment Type Number Hours/Day Days/Year Horse Power
7.1563
Total 6.1019 0.3606 0.0000 15.1172
University/College (4Yr)
14.23 2.8886 0.1707 0.0000
7.9609
Other Asphalt Surfaces
0 0.0000 0.0000 0.0000 0.0000
Land Use tons ton
MT/yr
Junior College (2Yr)
15.83 3.2134 0.1899 0.0000
Mitigated
Waste Disposed
Total CO2 CH4 N2O CO2e
7.1563
Total 6.1019 0.3606 0.0000 15.1172
University/College (4Yr)
14.23 2.8886 0.1707 0.0000
7.9609
Other Asphalt Surfaces
0 0.0000 0.0000 0.0000 0.0000
Junior College (2Yr)
15.83 3.2134 0.1899 0.0000

User Defined Equipment
Equipment Type Number
11.0 Vegetation

Project Characteristics - Assumed operational start date of 2005
tblProjectCharacteristics OperationalYear 2018 2005
tblLandUse BuildingSpaceSquareFeet 6,000.00 5,904.00
tblLandUse LandUseSquareFeet 6,000.00 5,904.00
tblArchitecturalCoating EF_Parking 250.00 0.00
tblAreaCoating Area_EF_Parking 250 0
1.3 User Entered Comments & Non-Default Data
Land Use - Tula Community Center square footage = 19,872 = approx 13,968 square feet of 4Yr + approx 5904 square feet of 2Yr space
Energy Use - Historical Title 24 requirements assumed.
Table Name Column Name Default Value New Value
CO2 Intensity (lb/MWhr)
720.49 CH4 Intensity (lb/MWhr)
0.029 N2O Intensity (lb/MWhr)
0.006
40
Climate Zone 13 Operational Year 2005
Utility Company San Diego Gas & Electric
1.2 Other Project Characteristics
Urbanization Urban Wind Speed (m/s) 2.6 Precipitation Freq (Days)
University/College (4Yr) 76.00 Student 0.32 13,968.61 0
Floor Surface Area Population
Junior College (2Yr) 6.00 1000sqft 0.14 5,904.00 0
1.0 Project Characteristics
1.1 Land Usage
Land Uses Size Metric Lot Acreage
CalEEMod Version: CalEEMod.2016.3.1 Page 1 of 1 Date: 12/21/2016 10:32 AM
Existing Setting - Tula Community Center - San Diego County APCD Air District, Winter
Existing Setting - Tula Community CenterSan Diego County APCD Air District, Winter

0.00 0.00 0.00 0.00 0.00 0.000.00 0.00 0.00 0.00 0.00 0.00
NBio-CO2 Total CO2 CH4 N20 CO2e
Percent Reduction
0.00 0.00 0.00 0.00
Exhaust PM10
PM10 Total
Fugitive PM2.5
Exhaust PM2.5
PM2.5 Total
Bio- CO2ROG NOx CO SO2 Fugitive PM10
0.0000 1,489.9897
1,489.9897 0.3560 0.0000 1,498.8901
0.8349 1.8238 2.5791 0.4356 1.8220 2.1795Maximum 93.0314 23.8741 13.1993 0.1459
0.0000 1,489.9897
1,489.9897 0.3560 0.0000 1,498.8901
0.8349 1.8238 2.5791 0.4356 1.8220 2.17952004 93.0314 23.8741 13.1993 0.1459
Total CO2 CH4 N2O CO2e
Year lb/day lb/day
PM10 Total
Fugitive PM2.5
Exhaust PM2.5
PM2.5 Total
Bio- CO2 NBio- CO2
Mitigated Construction
ROG NOx CO SO2 Fugitive PM10
Exhaust PM10
0.0000 1,489.9897
1,489.9897 0.3560 0.0000 1,498.8901
0.8349 1.8238 2.5791 0.4356 1.8220 2.1795Maximum 93.0314 23.8741 13.1993 0.1459
0.0000 1,489.9897
1,489.9897 0.3560 0.0000 1,498.8901
0.8349 1.8238 2.5791 0.4356 1.8220 2.17952004 93.0314 23.8741 13.1993 0.1459
CH4 N2O CO2e
Year lb/day lb/day
Fugitive PM2.5
Exhaust PM2.5
PM2.5 Total
Bio- CO2 NBio- CO2 Total CO2
Unmitigated Construction
ROG NOx CO SO2 Fugitive PM10
Exhaust PM10
PM10 Total
2.0 Emissions Summary
2.1 Overall Construction (Maximum Daily Emission)

0.00 0.00 0.00 0.00 0.00 0.000.00 0.00 0.00 0.00 0.00 0.00
NBio-CO2 Total CO2 CH4 N20 CO2e
Percent Reduction
0.00 0.00 0.00 0.00
Exhaust PM10
PM10 Total
Fugitive PM2.5
Exhaust PM2.5
PM2.5 Total
Bio- CO2ROG NOx CO SO2 Fugitive PM10
2,562.5808
2,562.5808 0.2740 4.8400e-003
2,570.8741
1.5864 0.1567 1.7431 0.4244 0.1497 0.5741Total 2.5595 6.6702 24.0202 0.0520
2,298.3420
2,298.3420 0.2688 2,305.0631
1.5864 0.1399 1.7263 0.4244 0.1329 0.5574Mobile 1.9825 6.4499 23.8246 0.0507
264.2208 264.2208 5.0600e-003
4.8400e-003
265.79100.0167 0.0167 0.0167 0.0167Energy 0.0242 0.2202 0.1850 1.3200e-003
0.0180 0.0180 8.0000e-005
0.02004.0000e-005
4.0000e-005
4.0000e-005
4.0000e-005
Area 0.5528 1.3000e-004
0.0107 0.0000
Total CO2 CH4 N2O CO2e
Category lb/day lb/day
PM10 Total
Fugitive PM2.5
Exhaust PM2.5
PM2.5 Total
Bio- CO2 NBio- CO2
Mitigated Operational
ROG NOx CO SO2 Fugitive PM10
Exhaust PM10
2,562.5808
2,562.5808 0.2740 4.8400e-003
2,570.8741
1.5864 0.1567 1.7431 0.4244 0.1497 0.5741Total 2.5595 6.6702 24.0202 0.0520
2,298.3420
2,298.3420 0.2688 2,305.0631
1.5864 0.1399 1.7263 0.4244 0.1329 0.5574Mobile 1.9825 6.4499 23.8246 0.0507
264.2208 264.2208 5.0600e-003
4.8400e-003
265.79100.0167 0.0167 0.0167 0.0167Energy 0.0242 0.2202 0.1850 1.3200e-003
0.0180 0.0180 8.0000e-005
0.02004.0000e-005
4.0000e-005
4.0000e-005
4.0000e-005
Area 0.5528 1.3000e-004
0.0107 0.0000
Total CO2 CH4 N2O CO2e
Category lb/day lb/day
PM10 Total
Fugitive PM2.5
Exhaust PM2.5
PM2.5 Total
Bio- CO2 NBio- CO2
2.2 Overall OperationalUnmitigated Operational
ROG NOx CO SO2 Fugitive PM10
Exhaust PM10
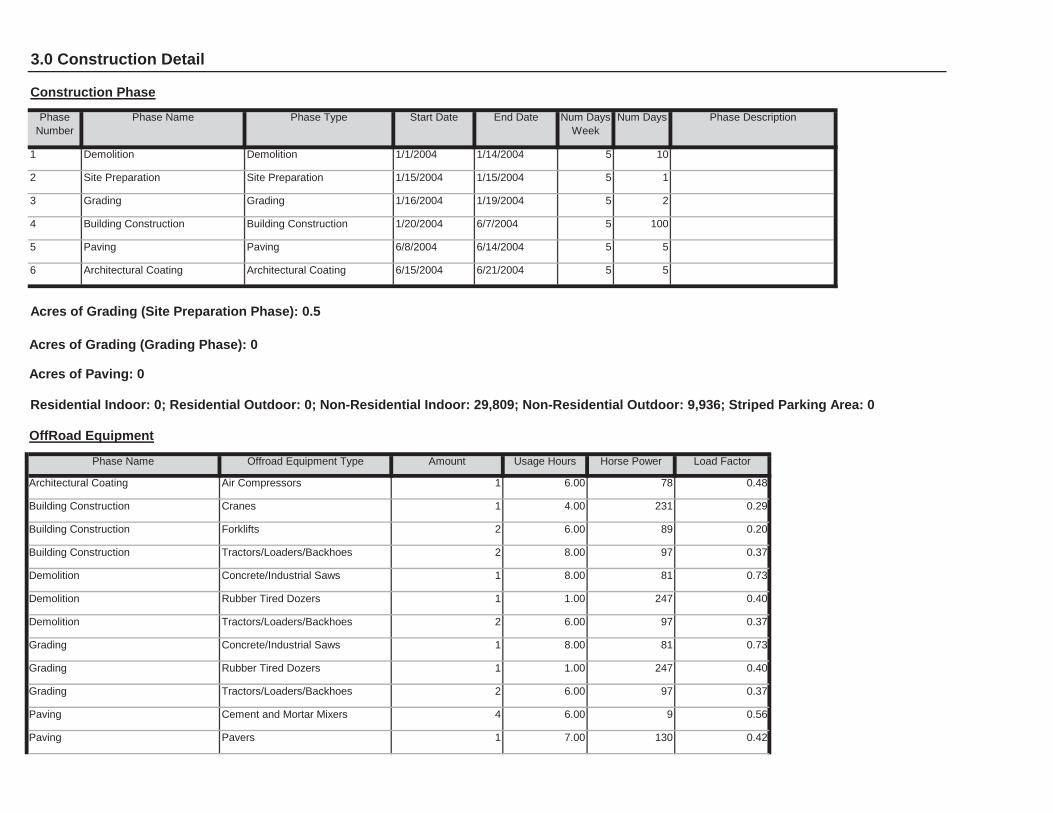
Paving Pavers 1 7.00 130 0.42
Paving Cement and Mortar Mixers 4 6.00 9 0.56
Grading Tractors/Loaders/Backhoes 2 6.00 97 0.37
Grading Rubber Tired Dozers 1 1.00 247 0.40
Grading Concrete/Industrial Saws 1 8.00 81 0.73
Demolition Tractors/Loaders/Backhoes 2 6.00 97 0.37
Demolition Rubber Tired Dozers 1 1.00 247 0.40
Demolition Concrete/Industrial Saws 1 8.00 81 0.73
Building Construction Tractors/Loaders/Backhoes 2 8.00 97 0.37
Building Construction Forklifts 2 6.00 89 0.20
Building Construction Cranes 1 4.00 231 0.29
Load Factor
Architectural Coating Air Compressors 1 6.00 78 0.48
Acres of Grading (Site Preparation Phase): 0.5
Acres of Grading (Grading Phase): 0
Acres of Paving: 0
Residential Indoor: 0; Residential Outdoor: 0; Non-Residential Indoor: 29,809; Non-Residential Outdoor: 9,936; Striped Parking Area: 0
OffRoad Equipment
Phase Name Offroad Equipment Type Amount Usage Hours Horse Power
5
6 Architectural Coating Architectural Coating 6/15/2004 6/21/2004 5 5
5 Paving Paving 6/8/2004 6/14/2004 5
2
4 Building Construction Building Construction 1/20/2004 6/7/2004 5 100
3 Grading Grading 1/16/2004 1/19/2004 5
10
2 Site Preparation Site Preparation 1/15/2004 1/15/2004 5 1
End Date Num Days Week
Num Days Phase Description
1 Demolition Demolition 1/1/2004 1/14/2004 5
3.0 Construction Detail
Construction Phase
Phase Number
Phase Name Phase Type Start Date

1,256.0421
1,256.0421 0.3290 1,264.2669
1.7408 1.7408 1.7408 1.7408Total 3.6662 21.9317 9.5771 0.1320
1,256.0421
1,256.0421 0.3290 1,264.2669
1.7408 1.7408 1.7408 1.7408Off-Road 3.6662 21.9317 9.5771 0.1320
NBio- CO2 Total CO2 CH4 N2O CO2e
Category lb/day lb/day
Exhaust PM10
PM10 Total
Fugitive PM2.5
Exhaust PM2.5
PM2.5 Total
Bio- CO2
3.1 Mitigation Measures Construction
3.2 Demolition - 2004Unmitigated Construction On-Site
ROG NOx CO SO2 Fugitive PM10
10.80 7.30 20.00 LD_Mix HDT_Mix HHDT
7.30 20.00 LD_Mix HDT_Mix HHDT
Site Preparation 2 5.00 0.00 0.00
Paving 7 18.00 0.00 0.00 10.80
10.80 7.30 20.00 LD_Mix HDT_Mix HHDT
7.30 20.00 LD_Mix HDT_Mix HHDT
Grading 4 10.00 0.00 0.00
Demolition 4 10.00 0.00 0.00 10.80
10.80 7.30 20.00 LD_Mix HDT_Mix HHDT
7.30 20.00 LD_Mix HDT_Mix HHDT
Building Construction 5 8.00 3.00 0.00
Architectural Coating 1 2.00 0.00 0.00 10.80
Worker Trip Length
Vendor Trip Length
Hauling Trip Length
Worker Vehicle Class
Vendor Vehicle Class
Hauling Vehicle Class
Trips and VMT
Phase Name Offroad Equipment Count
Worker Trip Number
Vendor Trip Number
Hauling Trip Number
Site Preparation Tractors/Loaders/Backhoes 1 8.00 97 0.37
Site Preparation Graders 1 8.00 187 0.41
Paving Tractors/Loaders/Backhoes 1 7.00 97 0.37
Paving Rollers 1 7.00 80 0.38

Total CO2 CH4 N2O CO2ePM10 Total
Fugitive PM2.5
Exhaust PM2.5
PM2.5 Total
Bio- CO2 NBio- CO2
Mitigated Construction Off-Site
ROG NOx CO SO2 Fugitive PM10
Exhaust PM10
0.0000 1,256.0421
1,256.0421 0.3290 1,264.2669
1.7408 1.7408 1.7408 1.7408Total 3.6662 21.9317 9.5771 0.1320
0.0000 1,256.0421
1,256.0421 0.3290 1,264.2669
1.7408 1.7408 1.7408 1.7408Off-Road 3.6662 21.9317 9.5771 0.1320
Total CO2 CH4 N2O CO2e
Category lb/day lb/day
PM10 Total
Fugitive PM2.5
Exhaust PM2.5
PM2.5 Total
Bio- CO2 NBio- CO2
Mitigated Construction On-Site
ROG NOx CO SO2 Fugitive PM10
Exhaust PM10
98.9145 98.9145 0.0154 99.29840.0822 3.3100e-003
0.0855 0.0218 3.0700e-003
0.0249Total 0.2262 0.2636 2.1784 1.5100e-003
98.9145 98.9145 0.0154 99.29840.0822 3.3100e-003
0.0855 0.0218 3.0700e-003
0.0249Worker 0.2262 0.2636 2.1784 1.5100e-003
0.0000 0.0000 0.0000 0.00000.0000 0.0000 0.0000 0.0000 0.0000 0.0000Vendor 0.0000 0.0000 0.0000 0.0000
0.0000 0.0000 0.0000 0.00000.0000 0.0000 0.0000 0.0000 0.0000 0.0000Hauling 0.0000 0.0000 0.0000 0.0000
Total CO2 CH4 N2O CO2e
Category lb/day lb/day
PM10 Total
Fugitive PM2.5
Exhaust PM2.5
PM2.5 Total
Bio- CO2 NBio- CO2
Unmitigated Construction Off-Site
ROG NOx CO SO2 Fugitive PM10
Exhaust PM10

49.4572 49.4572 7.6800e-003
49.64920.0411 1.6500e-003
0.0427 0.0109 1.5300e-003
0.0124Worker 0.1131 0.1318 1.0892 7.6000e-004
0.0000 0.0000 0.0000 0.00000.0000 0.0000 0.0000 0.0000 0.0000 0.0000Vendor 0.0000 0.0000 0.0000 0.0000
0.0000 0.0000 0.0000 0.00000.0000 0.0000 0.0000 0.0000 0.0000 0.0000Hauling 0.0000 0.0000 0.0000 0.0000
Total CO2 CH4 N2O CO2e
Category lb/day lb/day
PM10 Total
Fugitive PM2.5
Exhaust PM2.5
PM2.5 Total
Bio- CO2 NBio- CO2
Unmitigated Construction Off-Site
ROG NOx CO SO2 Fugitive PM10
Exhaust PM10
1,128.1977
1,128.1977 0.2272 1,133.8779
0.5303 1.1366 1.6668 0.0573 1.1366 1.1938Total 2.5349 18.7202 6.9250 0.1151
1,128.1977
1,128.1977 0.2272 1,133.8779
1.1366 1.1366 1.1366 1.1366Off-Road 2.5349 18.7202 6.9250 0.1151
0.0000 0.00000.5303 0.0000 0.5303 0.0573 0.0000 0.0573Fugitive Dust
Total CO2 CH4 N2O CO2e
Category lb/day lb/day
PM10 Total
Fugitive PM2.5
Exhaust PM2.5
PM2.5 Total
Bio- CO2 NBio- CO2
3.3 Site Preparation - 2004Unmitigated Construction On-Site
ROG NOx CO SO2 Fugitive PM10
Exhaust PM10
98.9145 98.9145 0.0154 99.29840.0822 3.3100e-003
0.0855 0.0218 3.0700e-003
0.0249Total 0.2262 0.2636 2.1784 1.5100e-003
98.9145 98.9145 0.0154 99.29840.0822 3.3100e-003
0.0855 0.0218 3.0700e-003
0.0249Worker 0.2262 0.2636 2.1784 1.5100e-003
0.0000 0.0000 0.0000 0.00000.0000 0.0000 0.0000 0.0000 0.0000 0.0000Vendor 0.0000 0.0000 0.0000 0.0000
0.0000 0.0000 0.0000 0.00000.0000 0.0000 0.0000 0.0000 0.0000 0.0000Hauling 0.0000 0.0000 0.0000 0.0000
Category lb/day lb/day

3.4 Grading - 2004Unmitigated Construction On-Site
49.4572 49.4572 7.6800e-003
49.64920.0411 1.6500e-003
0.0427 0.0109 1.5300e-003
0.0124Total 0.1131 0.1318 1.0892 7.6000e-004
49.4572 49.4572 7.6800e-003
49.64920.0411 1.6500e-003
0.0427 0.0109 1.5300e-003
0.0124Worker 0.1131 0.1318 1.0892 7.6000e-004
0.0000 0.0000 0.0000 0.00000.0000 0.0000 0.0000 0.0000 0.0000 0.0000Vendor 0.0000 0.0000 0.0000 0.0000
0.0000 0.0000 0.0000 0.00000.0000 0.0000 0.0000 0.0000 0.0000 0.0000Hauling 0.0000 0.0000 0.0000 0.0000
Total CO2 CH4 N2O CO2e
Category lb/day lb/day
PM10 Total
Fugitive PM2.5
Exhaust PM2.5
PM2.5 Total
Bio- CO2 NBio- CO2
Mitigated Construction Off-Site
ROG NOx CO SO2 Fugitive PM10
Exhaust PM10
0.0000 1,128.1977
1,128.1977 0.2272 1,133.8779
0.5303 1.1366 1.6668 0.0573 1.1366 1.1938Total 2.5349 18.7202 6.9250 0.1151
0.0000 1,128.1977
1,128.1977 0.2272 1,133.8779
1.1366 1.1366 1.1366 1.1366Off-Road 2.5349 18.7202 6.9250 0.1151
0.0000 0.00000.5303 0.0000 0.5303 0.0573 0.0000 0.0573Fugitive Dust
Total CO2 CH4 N2O CO2e
Category lb/day lb/day
PM10 Total
Fugitive PM2.5
Exhaust PM2.5
PM2.5 Total
Bio- CO2 NBio- CO2
Mitigated Construction On-Site
ROG NOx CO SO2 Fugitive PM10
Exhaust PM10
49.4572 49.4572 7.6800e-003
49.64920.0411 1.6500e-003
0.0427 0.0109 1.5300e-003
0.0124Total 0.1131 0.1318 1.0892 7.6000e-004

Total CO2 CH4 N2O CO2e
Category lb/day lb/day
PM10 Total
Fugitive PM2.5
Exhaust PM2.5
PM2.5 Total
Bio- CO2 NBio- CO2
Mitigated Construction On-Site
ROG NOx CO SO2 Fugitive PM10
Exhaust PM10
98.9145 98.9145 0.0154 99.29840.0822 3.3100e-003
0.0855 0.0218 3.0700e-003
0.0249Total 0.2262 0.2636 2.1784 1.5100e-003
98.9145 98.9145 0.0154 99.29840.0822 3.3100e-003
0.0855 0.0218 3.0700e-003
0.0249Worker 0.2262 0.2636 2.1784 1.5100e-003
0.0000 0.0000 0.0000 0.00000.0000 0.0000 0.0000 0.0000 0.0000 0.0000Vendor 0.0000 0.0000 0.0000 0.0000
0.0000 0.0000 0.0000 0.00000.0000 0.0000 0.0000 0.0000 0.0000 0.0000Hauling 0.0000 0.0000 0.0000 0.0000
Total CO2 CH4 N2O CO2e
Category lb/day lb/day
PM10 Total
Fugitive PM2.5
Exhaust PM2.5
PM2.5 Total
Bio- CO2 NBio- CO2
Unmitigated Construction Off-Site
ROG NOx CO SO2 Fugitive PM10
Exhaust PM10
1,256.0421
1,256.0421 0.3290 1,264.2669
0.7528 1.7408 2.4936 0.4138 1.7408 2.1546Total 3.6662 21.9317 9.5771 0.1320
1,256.0421
1,256.0421 0.3290 1,264.2669
1.7408 1.7408 1.7408 1.7408Off-Road 3.6662 21.9317 9.5771 0.1320
0.0000 0.00000.7528 0.0000 0.7528 0.4138 0.0000 0.4138Fugitive Dust
Total CO2 CH4 N2O CO2e
Category lb/day lb/day
PM10 Total
Fugitive PM2.5
Exhaust PM2.5
PM2.5 Total
Bio- CO2 NBio- CO2ROG NOx CO SO2 Fugitive PM10
Exhaust PM10
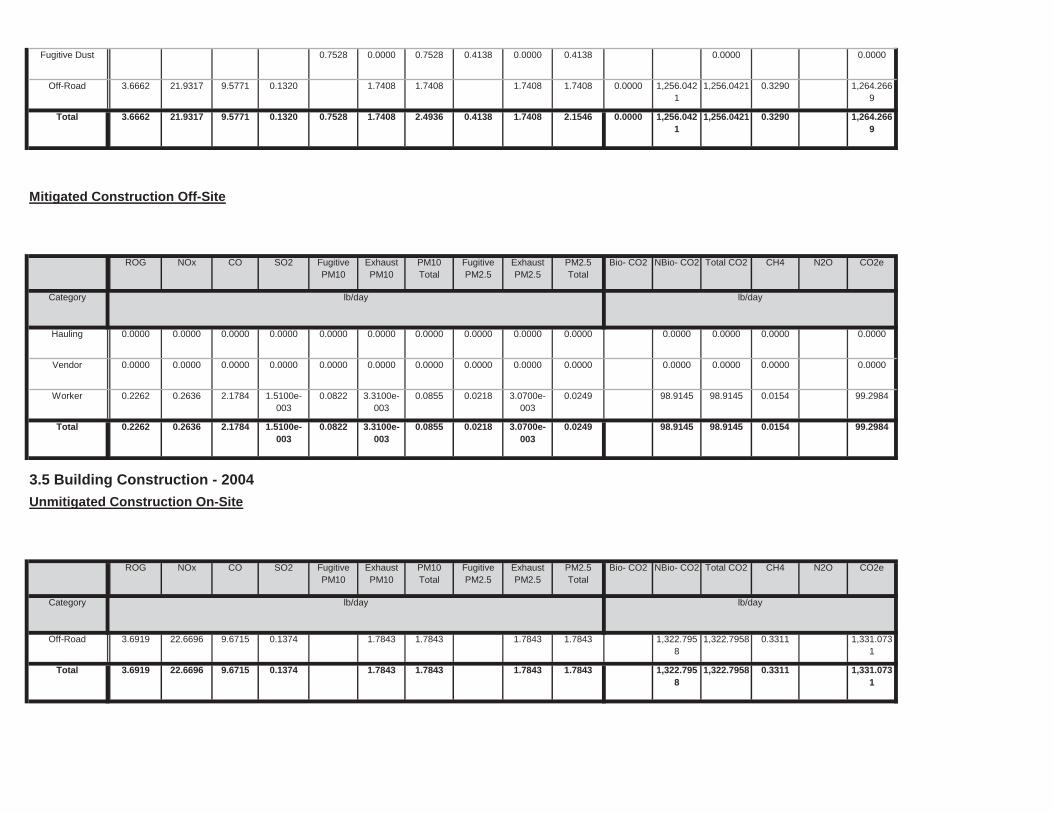
1,322.7958
1,322.7958 0.3311 1,331.0731
1.7843 1.7843 1.7843 1.7843Total 3.6919 22.6696 9.6715 0.1374
1,322.7958
1,322.7958 0.3311 1,331.0731
1.7843 1.7843 1.7843 1.7843Off-Road 3.6919 22.6696 9.6715 0.1374
Total CO2 CH4 N2O CO2e
Category lb/day lb/day
PM10 Total
Fugitive PM2.5
Exhaust PM2.5
PM2.5 Total
Bio- CO2 NBio- CO2
3.5 Building Construction - 2004Unmitigated Construction On-Site
ROG NOx CO SO2 Fugitive PM10
Exhaust PM10
98.9145 98.9145 0.0154 99.29840.0822 3.3100e-003
0.0855 0.0218 3.0700e-003
0.0249Total 0.2262 0.2636 2.1784 1.5100e-003
98.9145 98.9145 0.0154 99.29840.0822 3.3100e-003
0.0855 0.0218 3.0700e-003
0.0249Worker 0.2262 0.2636 2.1784 1.5100e-003
0.0000 0.0000 0.0000 0.00000.0000 0.0000 0.0000 0.0000 0.0000 0.0000Vendor 0.0000 0.0000 0.0000 0.0000
0.0000 0.0000 0.0000 0.00000.0000 0.0000 0.0000 0.0000 0.0000 0.0000Hauling 0.0000 0.0000 0.0000 0.0000
Total CO2 CH4 N2O CO2e
Category lb/day lb/day
PM10 Total
Fugitive PM2.5
Exhaust PM2.5
PM2.5 Total
Bio- CO2 NBio- CO2
Mitigated Construction Off-Site
ROG NOx CO SO2 Fugitive PM10
Exhaust PM10
0.0000 1,256.0421
1,256.0421 0.3290 1,264.2669
0.7528 1.7408 2.4936 0.4138 1.7408 2.1546Total 3.6662 21.9317 9.5771 0.1320
0.0000 1,256.0421
1,256.0421 0.3290 1,264.2669
1.7408 1.7408 1.7408 1.7408Off-Road 3.6662 21.9317 9.5771 0.1320
0.0000 0.00000.7528 0.0000 0.7528 0.4138 0.0000 0.4138Fugitive Dust

Total CO2 CH4 N2O CO2ePM10 Total
Fugitive PM2.5
Exhaust PM2.5
PM2.5 Total
Bio- CO2 NBio- CO2
Mitigated Construction Off-Site
ROG NOx CO SO2 Fugitive PM10
Exhaust PM10
0.0000 1,322.7958
1,322.7958 0.3311 1,331.0731
1.7843 1.7843 1.7843 1.7843Total 3.6919 22.6696 9.6715 0.1374
0.0000 1,322.7958
1,322.7958 0.3311 1,331.0731
1.7843 1.7843 1.7843 1.7843Off-Road 3.6919 22.6696 9.6715 0.1374
Total CO2 CH4 N2O CO2e
Category lb/day lb/day
PM10 Total
Fugitive PM2.5
Exhaust PM2.5
PM2.5 Total
Bio- CO2 NBio- CO2
Mitigated Construction On-Site
ROG NOx CO SO2 Fugitive PM10
Exhaust PM10
167.1939 167.1939 0.0249 167.81700.0860 0.0395 0.1255 0.0233 0.0377 0.0610Total 0.3022 1.2045 2.5167 8.4500e-003
79.1316 79.1316 0.0123 79.43870.0657 2.6500e-003
0.0684 0.0174 2.4500e-003
0.0199Worker 0.1810 0.2109 1.7427 1.2100e-003
88.0623 88.0623 0.0126 88.37830.0203 0.0369 0.0572 5.8400e-003
0.0353 0.0411Vendor 0.1212 0.9936 0.7740 7.2400e-003
0.0000 0.0000 0.0000 0.00000.0000 0.0000 0.0000 0.0000 0.0000 0.0000Hauling 0.0000 0.0000 0.0000 0.0000
Total CO2 CH4 N2O CO2e
Category lb/day lb/day
PM10 Total
Fugitive PM2.5
Exhaust PM2.5
PM2.5 Total
Bio- CO2 NBio- CO2
Unmitigated Construction Off-Site
ROG NOx CO SO2 Fugitive PM10
Exhaust PM10

178.0461 178.0461 0.0276 178.73710.1479 5.9600e-003
0.1538 0.0392 5.5200e-003
0.0447Worker 0.4072 0.4745 3.9210 2.7200e-003
0.0000 0.0000 0.0000 0.00000.0000 0.0000 0.0000 0.0000 0.0000 0.0000Vendor 0.0000 0.0000 0.0000 0.0000
0.0000 0.0000 0.0000 0.00000.0000 0.0000 0.0000 0.0000 0.0000 0.0000Hauling 0.0000 0.0000 0.0000 0.0000
Total CO2 CH4 N2O CO2e
Category lb/day lb/day
PM10 Total
Fugitive PM2.5
Exhaust PM2.5
PM2.5 Total
Bio- CO2 NBio- CO2
Unmitigated Construction Off-Site
ROG NOx CO SO2 Fugitive PM10
Exhaust PM10
1,211.7777
1,211.7777 0.3022 1,219.3328
1.5422 1.5422 1.5422 1.5422Total 3.3626 21.2572 9.2783 0.1305
0.0000 0.00000.0000 0.0000 0.0000 0.0000Paving 0.0000
1,211.7777
1,211.7777 0.3022 1,219.3328
1.5422 1.5422 1.5422 1.5422Off-Road 3.3626 21.2572 9.2783 0.1305
Total CO2 CH4 N2O CO2e
Category lb/day lb/day
PM10 Total
Fugitive PM2.5
Exhaust PM2.5
PM2.5 Total
Bio- CO2 NBio- CO2
3.6 Paving - 2004Unmitigated Construction On-Site
ROG NOx CO SO2 Fugitive PM10
Exhaust PM10
167.1939 167.1939 0.0249 167.81700.0860 0.0395 0.1255 0.0233 0.0377 0.0610Total 0.3022 1.2045 2.5167 8.4500e-003
79.1316 79.1316 0.0123 79.43870.0657 2.6500e-003
0.0684 0.0174 2.4500e-003
0.0199Worker 0.1810 0.2109 1.7427 1.2100e-003
88.0623 88.0623 0.0126 88.37830.0203 0.0369 0.0572 5.8400e-003
0.0353 0.0411Vendor 0.1212 0.9936 0.7740 7.2400e-003
0.0000 0.0000 0.0000 0.00000.0000 0.0000 0.0000 0.0000 0.0000 0.0000Hauling 0.0000 0.0000 0.0000 0.0000
Category lb/day lb/day

3.7 Architectural Coating - 2004Unmitigated Construction On-Site
178.0461 178.0461 0.0276 178.73710.1479 5.9600e-003
0.1538 0.0392 5.5200e-003
0.0447Total 0.4072 0.4745 3.9210 2.7200e-003
178.0461 178.0461 0.0276 178.73710.1479 5.9600e-003
0.1538 0.0392 5.5200e-003
0.0447Worker 0.4072 0.4745 3.9210 2.7200e-003
0.0000 0.0000 0.0000 0.00000.0000 0.0000 0.0000 0.0000 0.0000 0.0000Vendor 0.0000 0.0000 0.0000 0.0000
0.0000 0.0000 0.0000 0.00000.0000 0.0000 0.0000 0.0000 0.0000 0.0000Hauling 0.0000 0.0000 0.0000 0.0000
Total CO2 CH4 N2O CO2e
Category lb/day lb/day
PM10 Total
Fugitive PM2.5
Exhaust PM2.5
PM2.5 Total
Bio- CO2 NBio- CO2
Mitigated Construction Off-Site
ROG NOx CO SO2 Fugitive PM10
Exhaust PM10
0.0000 1,211.7777
1,211.7777 0.3022 1,219.3328
1.5422 1.5422 1.5422 1.5422Total 3.3626 21.2572 9.2783 0.1305
0.0000 0.00000.0000 0.0000 0.0000 0.0000Paving 0.0000
0.0000 1,211.7777
1,211.7777 0.3022 1,219.3328
1.5422 1.5422 1.5422 1.5422Off-Road 3.3626 21.2572 9.2783 0.1305
Total CO2 CH4 N2O CO2e
Category lb/day lb/day
PM10 Total
Fugitive PM2.5
Exhaust PM2.5
PM2.5 Total
Bio- CO2 NBio- CO2
Mitigated Construction On-Site
ROG NOx CO SO2 Fugitive PM10
Exhaust PM10
178.0461 178.0461 0.0276 178.73710.1479 5.9600e-003
0.1538 0.0392 5.5200e-003
0.0447Total 0.4072 0.4745 3.9210 2.7200e-003

Total CO2 CH4 N2O CO2e
Category lb/day lb/day
PM10 Total
Fugitive PM2.5
Exhaust PM2.5
PM2.5 Total
Bio- CO2 NBio- CO2
Mitigated Construction On-Site
ROG NOx CO SO2 Fugitive PM10
Exhaust PM10
19.7829 19.7829 3.0700e-003
19.85970.0164 6.6000e-004
0.0171 4.3600e-003
6.1000e-004
4.9700e-003
Total 0.0452 0.0527 0.4357 3.0000e-004
19.7829 19.7829 3.0700e-003
19.85970.0164 6.6000e-004
0.0171 4.3600e-003
6.1000e-004
4.9700e-003
Worker 0.0452 0.0527 0.4357 3.0000e-004
0.0000 0.0000 0.0000 0.00000.0000 0.0000 0.0000 0.0000 0.0000 0.0000Vendor 0.0000 0.0000 0.0000 0.0000
0.0000 0.0000 0.0000 0.00000.0000 0.0000 0.0000 0.0000 0.0000 0.0000Hauling 0.0000 0.0000 0.0000 0.0000
Total CO2 CH4 N2O CO2e
Category lb/day lb/day
PM10 Total
Fugitive PM2.5
Exhaust PM2.5
PM2.5 Total
Bio- CO2 NBio- CO2
Unmitigated Construction Off-Site
ROG NOx CO SO2 Fugitive PM10
Exhaust PM10
281.4485 281.4485 0.0787 283.41720.4135 0.4135 0.4135 0.4135Total 92.9861 5.0892 2.2504 0.0297
281.4485 281.4485 0.0787 283.41720.4135 0.4135 0.4135 0.4135Off-Road 0.8771 5.0892 2.2504 0.0297
0.0000 0.00000.0000 0.0000 0.0000 0.0000Archit. Coating 92.1090
Total CO2 CH4 N2O CO2e
Category lb/day lb/day
PM10 Total
Fugitive PM2.5
Exhaust PM2.5
PM2.5 Total
Bio- CO2 NBio- CO2ROG NOx CO SO2 Fugitive PM10
Exhaust PM10

2,298.3420
2,298.3420 0.2688 2,305.0631
1.5864 0.1399 1.7263 0.4244 0.1329 0.5574Mitigated 1.9825 6.4499 23.8246 0.0507
NBio- CO2 Total CO2 CH4 N2O CO2e
Category lb/day lb/day
Exhaust PM10
PM10 Total
Fugitive PM2.5
Exhaust PM2.5
PM2.5 Total
Bio- CO2
4.0 Operational Detail - Mobile
4.1 Mitigation Measures Mobile
ROG NOx CO SO2 Fugitive PM10
19.7829 19.7829 3.0700e-003
19.85970.0164 6.6000e-004
0.0171 4.3600e-003
6.1000e-004
4.9700e-003
Total 0.0452 0.0527 0.4357 3.0000e-004
19.7829 19.7829 3.0700e-003
19.85970.0164 6.6000e-004
0.0171 4.3600e-003
6.1000e-004
4.9700e-003
Worker 0.0452 0.0527 0.4357 3.0000e-004
0.0000 0.0000 0.0000 0.00000.0000 0.0000 0.0000 0.0000 0.0000 0.0000Vendor 0.0000 0.0000 0.0000 0.0000
0.0000 0.0000 0.0000 0.00000.0000 0.0000 0.0000 0.0000 0.0000 0.0000Hauling 0.0000 0.0000 0.0000 0.0000
Total CO2 CH4 N2O CO2e
Category lb/day lb/day
PM10 Total
Fugitive PM2.5
Exhaust PM2.5
PM2.5 Total
Bio- CO2 NBio- CO2
Mitigated Construction Off-Site
ROG NOx CO SO2 Fugitive PM10
Exhaust PM10
0.0000 281.4485 281.4485 0.0787 283.41720.4135 0.4135 0.4135 0.4135Total 92.9861 5.0892 2.2504 0.0297
0.0000 281.4485 281.4485 0.0787 283.41720.4135 0.4135 0.4135 0.4135Off-Road 0.8771 5.0892 2.2504 0.0297
0.0000 0.00000.0000 0.0000 0.0000 0.0000Archit. Coating 92.1090

CO2ePM2.5 Total
Bio- CO2 NBio- CO2 Total CO2 CH4 N2OSO2 Fugitive PM10
Exhaust PM10
PM10 Total
Fugitive PM2.5
Exhaust PM2.5
0.000773 0.002884
5.0 Energy Detail
Historical Energy Use: Y
5.1 Mitigation Measures Energy
ROG NOx CO
0.005459 0.014026 0.019971 0.001578 0.001508 0.005510University/College (4Yr) 0.496962 0.074792 0.199148 0.142251 0.035136
0.019971 0.001578 0.001508 0.005510 0.000773 0.002884
SBUS MH
Junior College (2Yr) 0.496962 0.074792 0.199148 0.142251 0.035136 0.005459 0.014026
LHD2 MHD HHD OBUS UBUS MCYLand Use LDA LDT1 LDT2 MDV LHD1
88.60 5.00 91 9 0
4.4 Fleet Mix
88.60 5.00 92 7 1
University/College (4Yr) 9.50 7.30 7.30 6.40
H-S or C-C H-O or C-NW Primary Diverted Pass-by
Junior College (2Yr) 9.50 7.30 7.30 6.40
4.3 Trip Type Information
Miles Trip % Trip Purpose %
Land Use H-W or C-W H-S or C-C H-O or C-NW H-W or C-W
Total 294.90 166.18 7.26 596,371 596,371University/College (4Yr) 129.96 98.80 0.00 270,098 270,098
Annual VMT
Junior College (2Yr) 164.94 67.38 7.26 326,272 326,272
4.2 Trip Summary Information
Average Daily Trip Rate Unmitigated MitigatedLand Use Weekday Saturday Sunday Annual VMT
2,298.3420
2,298.3420 0.2688 2,305.0631
1.5864 0.1399 1.7263 0.4244 0.1329 0.5574Unmitigated 1.9825 6.4499 23.8246 0.0507

264.2209 264.2209 5.0600e-003
4.8400e-003
265.79100.0167 0.0167 0.0167 0.0167Total 0.0242 0.2202 0.1850 1.3200e-003
185.7229 185.7229 3.5600e-003
3.4000e-003
186.82650.0118 0.0118 0.0118 0.0118University/College (4Yr)
1.57864 0.0170 0.1548 0.1300 9.3000e-004
78.4980 78.4980 1.5000e-003
1.4400e-003
78.96454.9700e-003
4.9700e-003
4.9700e-003
4.9700e-003
Junior College (2Yr)
0.667233 7.2000e-003
0.0654 0.0550 3.9000e-004
Total CO2 CH4 N2O CO2e
Land Use kBTU/yr lb/day lb/day
PM10 Total
Fugitive PM2.5
Exhaust PM2.5
PM2.5 Total
Bio- CO2 NBio- CO2
Mitigated
NaturalGas Use
ROG NOx CO SO2 Fugitive PM10
Exhaust PM10
264.2209 264.2209 5.0600e-003
4.8400e-003
265.79100.0167 0.0167 0.0167 0.0167Total 0.0242 0.2202 0.1850 1.3200e-003
185.7229 185.7229 3.5600e-003
3.4000e-003
186.82650.0118 0.0118 0.0118 0.0118University/College (4Yr)
1578.64 0.0170 0.1548 0.1300 9.3000e-004
78.4980 78.4980 1.5000e-003
1.4400e-003
78.96454.9700e-003
4.9700e-003
4.9700e-003
4.9700e-003
Junior College (2Yr)
667.233 7.2000e-003
0.0654 0.0550 3.9000e-004
Total CO2 CH4 N2O CO2e
Land Use kBTU/yr lb/day lb/day
PM10 Total
Fugitive PM2.5
Exhaust PM2.5
PM2.5 Total
Bio- CO2 NBio- CO2
5.2 Energy by Land Use - NaturalGasUnmitigated
NaturalGas Use
ROG NOx CO SO2 Fugitive PM10
Exhaust PM10
264.2208 264.2208 5.0600e-003
4.8400e-003
265.79100.0167 0.0167 0.0167 0.0167NaturalGas Unmitigated
0.0242 0.2202 0.1850 1.3200e-003
264.2208 264.2208 5.0600e-003
4.8400e-003
265.79100.0167 0.0167 0.0167 0.0167
Category lb/day lb/day
NaturalGas Mitigated
0.0242 0.2202 0.1850 1.3200e-003

Mitigated
0.0180 0.0180 8.0000e-005
0.02004.0000e-005
4.0000e-005
4.0000e-005
4.0000e-005
Total 0.5528 1.3000e-004
0.0107 0.0000
0.0180 0.0180 8.0000e-005
0.02004.0000e-005
4.0000e-005
4.0000e-005
4.0000e-005
Landscaping 1.3800e-003
1.3000e-004
0.0107 0.0000
0.0000 0.00000.0000 0.0000 0.0000 0.0000Consumer Products
0.4253
0.0000 0.00000.0000 0.0000 0.0000 0.0000Architectural Coating
0.1262
Total CO2 CH4 N2O CO2e
SubCategory lb/day lb/day
PM10 Total
Fugitive PM2.5
Exhaust PM2.5
PM2.5 Total
Bio- CO2 NBio- CO2
6.2 Area by SubCategoryUnmitigated
ROG NOx CO SO2 Fugitive PM10
Exhaust PM10
0.0180 0.0180 8.0000e-005
0.02004.0000e-005
4.0000e-005
4.0000e-005
4.0000e-005
Unmitigated 0.5528 1.3000e-004
0.0107 0.0000
0.0180 0.0180 8.0000e-005
0.02004.0000e-005
4.0000e-005
4.0000e-005
4.0000e-005
Mitigated 0.5528 1.3000e-004
0.0107 0.0000
NBio- CO2 Total CO2 CH4 N2O CO2e
Category lb/day lb/day
Exhaust PM10
PM10 Total
Fugitive PM2.5
Exhaust PM2.5
PM2.5 Total
Bio- CO2
6.0 Area Detail
6.1 Mitigation Measures Area
ROG NOx CO SO2 Fugitive PM10

User Defined Equipment
Load Factor Fuel Type
Boilers
Equipment Type Number Heat Input/Day Heat Input/Year Boiler Rating Fuel Type
Fire Pumps and Emergency Generators
Equipment Type Number Hours/Day Hours/Year Horse Power
Hours/Day Days/Year Horse Power Load Factor Fuel Type
10.0 Stationary Equipment
7.0 Water Detail
7.1 Mitigation Measures Water
8.0 Waste Detail
8.1 Mitigation Measures Waste
9.0 Operational Offroad
Equipment Type Number
0.0180 0.0180 8.0000e-005
0.02004.0000e-005
4.0000e-005
4.0000e-005
4.0000e-005
Total 0.5528 1.3000e-004
0.0107 0.0000
0.0180 0.0180 8.0000e-005
0.02004.0000e-005
4.0000e-005
4.0000e-005
4.0000e-005
Landscaping 1.3800e-003
1.3000e-004
0.0107 0.0000
0.0000 0.00000.0000 0.0000 0.0000 0.0000Consumer Products
0.4253
0.0000 0.00000.0000 0.0000 0.0000 0.0000Architectural Coating
0.1262
Total CO2 CH4 N2O CO2e
SubCategory lb/day lb/day
PM10 Total
Fugitive PM2.5
Exhaust PM2.5
PM2.5 Total
Bio- CO2 NBio- CO2ROG NOx CO SO2 Fugitive PM10
Exhaust PM10

Equipment Type Number
11.0 Vegetation

Project Characteristics - Assumed operational start date of 2005
tblProjectCharacteristics OperationalYear 2018 2005
tblLandUse BuildingSpaceSquareFeet 6,000.00 5,904.00
tblLandUse LandUseSquareFeet 6,000.00 5,904.00
tblArchitecturalCoating EF_Parking 250.00 0.00
tblAreaCoating Area_EF_Parking 250 0
1.3 User Entered Comments & Non-Default Data
Land Use - Tula Community Center square footage = 19,872 = approx 13,968 square feet of 4Yr + approx 5904 square feet of 2Yr space
Energy Use Historical Title 24 requirements assumed
Table Name Column Name Default Value New Value
CO2 Intensity (lb/MWhr)
720.49 CH4 Intensity (lb/MWhr)
0.029 N2O Intensity (lb/MWhr)
0.006
40
Climate Zone 13 Operational Year 2005
Utility Company San Diego Gas & Electric
1.2 Other Project Characteristics
Urbanization Urban Wind Speed (m/s) 2.6 Precipitation Freq (Days)
University/College (4Yr) 76.00 Student 0.32 13,968.61 0
Floor Surface Area Population
Junior College (2Yr) 6.00 1000sqft 0.14 5,904.00 0
1.0 Project Characteristics
1.1 Land Usage
Land Uses Size Metric Lot Acreage
CalEEMod Version: CalEEMod.2016.3.1 Page 1 of 1 Date: 12/21/2016 10:24 AM
Existing Setting - Tula Community Center - San Diego County APCD Air District, Summer
Existing Setting - Tula Community CenterSan Diego County APCD Air District, Summer

0.00 0.00 0.00 0.00 0.00 0.000.00 0.00 0.00 0.00 0.00 0.00
NBio-CO2 Total CO2 CH4 N20 CO2e
Percent Reduction
0.00 0.00 0.00 0.00
Exhaust PM10
PM10 Total
Fugitive PM2.5
Exhaust PM2.5
PM2.5 Total
Bio- CO2ROG NOx CO SO2 Fugitive PM10
0.0000 1,496.3229
1,496.3229 0.3554 0.0000 1,505.2071
0.8349 1.8219 2.5791 0.4356 1.8202 2.1795Maximum 93.0270 23.8350 13.2862 0.1461
0.0000 1,496.3229
1,496.3229 0.3554 0.0000 1,505.2071
0.8349 1.8219 2.5791 0.4356 1.8202 2.17952004 93.0270 23.8350 13.2862 0.1461
Total CO2 CH4 N2O CO2e
Year lb/day lb/day
PM10 Total
Fugitive PM2.5
Exhaust PM2.5
PM2.5 Total
Bio- CO2 NBio- CO2
Mitigated Construction
ROG NOx CO SO2 Fugitive PM10
Exhaust PM10
0.0000 1,496.3229
1,496.3229 0.3554 0.0000 1,505.2071
0.8349 1.8219 2.5791 0.4356 1.8202 2.1795Maximum 93.0270 23.8350 13.2862 0.1461
0.0000 1,496.3229
1,496.3229 0.3554 0.0000 1,505.2071
0.8349 1.8219 2.5791 0.4356 1.8202 2.17952004 93.0270 23.8350 13.2862 0.1461
CH4 N2O CO2e
Year lb/day lb/day
Fugitive PM2.5
Exhaust PM2.5
PM2.5 Total
Bio- CO2 NBio- CO2 Total CO2
Unmitigated Construction
ROG NOx CO SO2 Fugitive PM10
Exhaust PM10
PM10 Total
2.0 Emissions Summary
2.1 Overall Construction (Maximum Daily Emission)

0.00 0.00 0.00 0.00 0.00 0.000.00 0.00 0.00 0.00 0.00 0.00
NBio-CO2 Total CO2 CH4 N20 CO2e
Percent Reduction
0.00 0.00 0.00 0.00
Exhaust PM10
PM10 Total
Fugitive PM2.5
Exhaust PM2.5
PM2.5 Total
Bio- CO2ROG NOx CO SO2 Fugitive PM10
2,686.8201
2,686.8201 0.2727 4.8400e-003
2,695.0817
1.5864 0.1514 1.7378 0.4244 0.1447 0.5691Total 2.5119 6.3633 23.6831 0.0538
2,422.5813
2,422.5813 0.2676 2,429.2707
1.5864 0.1347 1.7211 0.4244 0.1279 0.5523Mobile 1.9348 6.1429 23.4875 0.0525
264.2208 264.2208 5.0600e-003
4.8400e-003
265.79100.0167 0.0167 0.0167 0.0167Energy 0.0242 0.2202 0.1850 1.3200e-003
0.0180 0.0180 8.0000e-005
0.02004.0000e-005
4.0000e-005
4.0000e-005
4.0000e-005
Area 0.5528 1.3000e-004
0.0107 0.0000
Total CO2 CH4 N2O CO2e
Category lb/day lb/day
PM10 Total
Fugitive PM2.5
Exhaust PM2.5
PM2.5 Total
Bio- CO2 NBio- CO2
Mitigated Operational
ROG NOx CO SO2 Fugitive PM10
Exhaust PM10
2,686.8201
2,686.8201 0.2727 4.8400e-003
2,695.0817
1.5864 0.1514 1.7378 0.4244 0.1447 0.5691Total 2.5119 6.3633 23.6831 0.0538
2,422.5813
2,422.5813 0.2676 2,429.2707
1.5864 0.1347 1.7211 0.4244 0.1279 0.5523Mobile 1.9348 6.1429 23.4875 0.0525
264.2208 264.2208 5.0600e-003
4.8400e-003
265.79100.0167 0.0167 0.0167 0.0167Energy 0.0242 0.2202 0.1850 1.3200e-003
0.0180 0.0180 8.0000e-005
0.02004.0000e-005
4.0000e-005
4.0000e-005
4.0000e-005
Area 0.5528 1.3000e-004
0.0107 0.0000
Total CO2 CH4 N2O CO2e
Category lb/day lb/day
PM10 Total
Fugitive PM2.5
Exhaust PM2.5
PM2.5 Total
Bio- CO2 NBio- CO2
2.2 Overall OperationalUnmitigated Operational
ROG NOx CO SO2 Fugitive PM10
Exhaust PM10

Paving Pavers 1 7.00 130 0.42
Paving Cement and Mortar Mixers 4 6.00 9 0.56
Grading Tractors/Loaders/Backhoes 2 6.00 97 0.37
Grading Rubber Tired Dozers 1 1.00 247 0.40
Grading Concrete/Industrial Saws 1 8.00 81 0.73
Demolition Tractors/Loaders/Backhoes 2 6.00 97 0.37
Demolition Rubber Tired Dozers 1 1.00 247 0.40
Demolition Concrete/Industrial Saws 1 8.00 81 0.73
Building Construction Tractors/Loaders/Backhoes 2 8.00 97 0.37
Building Construction Forklifts 2 6.00 89 0.20
Building Construction Cranes 1 4.00 231 0.29
Load Factor
Architectural Coating Air Compressors 1 6.00 78 0.48
Acres of Grading (Site Preparation Phase): 0.5
Acres of Grading (Grading Phase): 0
Acres of Paving: 0
Residential Indoor: 0; Residential Outdoor: 0; Non-Residential Indoor: 29,809; Non-Residential Outdoor: 9,936; Striped Parking Area: 0
OffRoad Equipment
Phase Name Offroad Equipment Type Amount Usage Hours Horse Power
5
6 Architectural Coating Architectural Coating 6/15/2004 6/21/2004 5 5
5 Paving Paving 6/8/2004 6/14/2004 5
2
4 Building Construction Building Construction 1/20/2004 6/7/2004 5 100
3 Grading Grading 1/16/2004 1/19/2004 5
10
2 Site Preparation Site Preparation 1/15/2004 1/15/2004 5 1
End Date Num Days Week
Num Days Phase Description
1 Demolition Demolition 1/1/2004 1/14/2004 5
3.0 Construction Detail
Construction Phase
Phase Number
Phase Name Phase Type Start Date

1,256.0421
1,256.0421 0.3290 1,264.2669
1.7408 1.7408 1.7408 1.7408Total 3.6662 21.9317 9.5771 0.1320
1,256.0421
1,256.0421 0.3290 1,264.2669
1.7408 1.7408 1.7408 1.7408Off-Road 3.6662 21.9317 9.5771 0.1320
NBio- CO2 Total CO2 CH4 N2O CO2e
Category lb/day lb/day
Exhaust PM10
PM10 Total
Fugitive PM2.5
Exhaust PM2.5
PM2.5 Total
Bio- CO2
3.1 Mitigation Measures Construction
3.2 Demolition - 2004Unmitigated Construction On-Site
ROG NOx CO SO2 Fugitive PM10
10.80 7.30 20.00 LD_Mix HDT_Mix HHDT
7.30 20.00 LD_Mix HDT_Mix HHDT
Site Preparation 2 5.00 0.00 0.00
Paving 7 18.00 0.00 0.00 10.80
10.80 7.30 20.00 LD_Mix HDT_Mix HHDT
7.30 20.00 LD_Mix HDT_Mix HHDT
Grading 4 10.00 0.00 0.00
Demolition 4 10.00 0.00 0.00 10.80
10.80 7.30 20.00 LD_Mix HDT_Mix HHDT
7.30 20.00 LD_Mix HDT_Mix HHDT
Building Construction 5 8.00 3.00 0.00
Architectural Coating 1 2.00 0.00 0.00 10.80
Worker Trip Length
Vendor Trip Length
Hauling Trip Length
Worker Vehicle Class
Vendor Vehicle Class
Hauling Vehicle Class
Trips and VMT
Phase Name Offroad Equipment Count
Worker Trip Number
Vendor Trip Number
Hauling Trip Number
Site Preparation Tractors/Loaders/Backhoes 1 8.00 97 0.37
Site Preparation Graders 1 8.00 187 0.41
Paving Tractors/Loaders/Backhoes 1 7.00 97 0.37
Paving Rollers 1 7.00 80 0.38

Total CO2 CH4 N2O CO2ePM10 Total
Fugitive PM2.5
Exhaust PM2.5
PM2.5 Total
Bio- CO2 NBio- CO2
Mitigated Construction Off-Site
ROG NOx CO SO2 Fugitive PM10
Exhaust PM10
0.0000 1,256.0421
1,256.0421 0.3290 1,264.2669
1.7408 1.7408 1.7408 1.7408Total 3.6662 21.9317 9.5771 0.1320
0.0000 1,256.0421
1,256.0421 0.3290 1,264.2669
1.7408 1.7408 1.7408 1.7408Off-Road 3.6662 21.9317 9.5771 0.1320
Total CO2 CH4 N2O CO2e
Category lb/day lb/day
PM10 Total
Fugitive PM2.5
Exhaust PM2.5
PM2.5 Total
Bio- CO2 NBio- CO2
Mitigated Construction On-Site
ROG NOx CO SO2 Fugitive PM10
Exhaust PM10
104.7032 104.7032 0.0157 105.09660.0822 3.3100e-003
0.0855 0.0218 3.0700e-003
0.0249Total 0.2044 0.2339 2.2266 1.6000e-003
104.7032 104.7032 0.0157 105.09660.0822 3.3100e-003
0.0855 0.0218 3.0700e-003
0.0249Worker 0.2044 0.2339 2.2266 1.6000e-003
0.0000 0.0000 0.0000 0.00000.0000 0.0000 0.0000 0.0000 0.0000 0.0000Vendor 0.0000 0.0000 0.0000 0.0000
0.0000 0.0000 0.0000 0.00000.0000 0.0000 0.0000 0.0000 0.0000 0.0000Hauling 0.0000 0.0000 0.0000 0.0000
Total CO2 CH4 N2O CO2e
Category lb/day lb/day
PM10 Total
Fugitive PM2.5
Exhaust PM2.5
PM2.5 Total
Bio- CO2 NBio- CO2
Unmitigated Construction Off-Site
ROG NOx CO SO2 Fugitive PM10
Exhaust PM10

52.3516 52.3516 7.8700e-003
52.54830.0411 1.6500e-003
0.0427 0.0109 1.5300e-003
0.0124Worker 0.1022 0.1169 1.1133 8.0000e-004
0.0000 0.0000 0.0000 0.00000.0000 0.0000 0.0000 0.0000 0.0000 0.0000Vendor 0.0000 0.0000 0.0000 0.0000
0.0000 0.0000 0.0000 0.00000.0000 0.0000 0.0000 0.0000 0.0000 0.0000Hauling 0.0000 0.0000 0.0000 0.0000
Total CO2 CH4 N2O CO2e
Category lb/day lb/day
PM10 Total
Fugitive PM2.5
Exhaust PM2.5
PM2.5 Total
Bio- CO2 NBio- CO2
Unmitigated Construction Off-Site
ROG NOx CO SO2 Fugitive PM10
Exhaust PM10
1,128.1977
1,128.1977 0.2272 1,133.8779
0.5303 1.1366 1.6668 0.0573 1.1366 1.1938Total 2.5349 18.7202 6.9250 0.1151
1,128.1977
1,128.1977 0.2272 1,133.8779
1.1366 1.1366 1.1366 1.1366Off-Road 2.5349 18.7202 6.9250 0.1151
0.0000 0.00000.5303 0.0000 0.5303 0.0573 0.0000 0.0573Fugitive Dust
Total CO2 CH4 N2O CO2e
Category lb/day lb/day
PM10 Total
Fugitive PM2.5
Exhaust PM2.5
PM2.5 Total
Bio- CO2 NBio- CO2
3.3 Site Preparation - 2004Unmitigated Construction On-Site
ROG NOx CO SO2 Fugitive PM10
Exhaust PM10
104.7032 104.7032 0.0157 105.09660.0822 3.3100e-003
0.0855 0.0218 3.0700e-003
0.0249Total 0.2044 0.2339 2.2266 1.6000e-003
104.7032 104.7032 0.0157 105.09660.0822 3.3100e-003
0.0855 0.0218 3.0700e-003
0.0249Worker 0.2044 0.2339 2.2266 1.6000e-003
0.0000 0.0000 0.0000 0.00000.0000 0.0000 0.0000 0.0000 0.0000 0.0000Vendor 0.0000 0.0000 0.0000 0.0000
0.0000 0.0000 0.0000 0.00000.0000 0.0000 0.0000 0.0000 0.0000 0.0000Hauling 0.0000 0.0000 0.0000 0.0000
Category lb/day lb/day

3.4 Grading - 2004Unmitigated Construction On-Site
52.3516 52.3516 7.8700e-003
52.54830.0411 1.6500e-003
0.0427 0.0109 1.5300e-003
0.0124Total 0.1022 0.1169 1.1133 8.0000e-004
52.3516 52.3516 7.8700e-003
52.54830.0411 1.6500e-003
0.0427 0.0109 1.5300e-003
0.0124Worker 0.1022 0.1169 1.1133 8.0000e-004
0.0000 0.0000 0.0000 0.00000.0000 0.0000 0.0000 0.0000 0.0000 0.0000Vendor 0.0000 0.0000 0.0000 0.0000
0.0000 0.0000 0.0000 0.00000.0000 0.0000 0.0000 0.0000 0.0000 0.0000Hauling 0.0000 0.0000 0.0000 0.0000
Total CO2 CH4 N2O CO2e
Category lb/day lb/day
PM10 Total
Fugitive PM2.5
Exhaust PM2.5
PM2.5 Total
Bio- CO2 NBio- CO2
Mitigated Construction Off-Site
ROG NOx CO SO2 Fugitive PM10
Exhaust PM10
0.0000 1,128.1977
1,128.1977 0.2272 1,133.8779
0.5303 1.1366 1.6668 0.0573 1.1366 1.1938Total 2.5349 18.7202 6.9250 0.1151
0.0000 1,128.1977
1,128.1977 0.2272 1,133.8779
1.1366 1.1366 1.1366 1.1366Off-Road 2.5349 18.7202 6.9250 0.1151
0.0000 0.00000.5303 0.0000 0.5303 0.0573 0.0000 0.0573Fugitive Dust
Total CO2 CH4 N2O CO2e
Category lb/day lb/day
PM10 Total
Fugitive PM2.5
Exhaust PM2.5
PM2.5 Total
Bio- CO2 NBio- CO2
Mitigated Construction On-Site
ROG NOx CO SO2 Fugitive PM10
Exhaust PM10
52.3516 52.3516 7.8700e-003
52.54830.0411 1.6500e-003
0.0427 0.0109 1.5300e-003
0.0124Total 0.1022 0.1169 1.1133 8.0000e-004

Total CO2 CH4 N2O CO2e
Category lb/day lb/day
PM10 Total
Fugitive PM2.5
Exhaust PM2.5
PM2.5 Total
Bio- CO2 NBio- CO2
Mitigated Construction On-Site
ROG NOx CO SO2 Fugitive PM10
Exhaust PM10
104.7032 104.7032 0.0157 105.09660.0822 3.3100e-003
0.0855 0.0218 3.0700e-003
0.0249Total 0.2044 0.2339 2.2266 1.6000e-003
104.7032 104.7032 0.0157 105.09660.0822 3.3100e-003
0.0855 0.0218 3.0700e-003
0.0249Worker 0.2044 0.2339 2.2266 1.6000e-003
0.0000 0.0000 0.0000 0.00000.0000 0.0000 0.0000 0.0000 0.0000 0.0000Vendor 0.0000 0.0000 0.0000 0.0000
0.0000 0.0000 0.0000 0.00000.0000 0.0000 0.0000 0.0000 0.0000 0.0000Hauling 0.0000 0.0000 0.0000 0.0000
Total CO2 CH4 N2O CO2e
Category lb/day lb/day
PM10 Total
Fugitive PM2.5
Exhaust PM2.5
PM2.5 Total
Bio- CO2 NBio- CO2
Unmitigated Construction Off-Site
ROG NOx CO SO2 Fugitive PM10
Exhaust PM10
1,256.0421
1,256.0421 0.3290 1,264.2669
0.7528 1.7408 2.4936 0.4138 1.7408 2.1546Total 3.6662 21.9317 9.5771 0.1320
1,256.0421
1,256.0421 0.3290 1,264.2669
1.7408 1.7408 1.7408 1.7408Off-Road 3.6662 21.9317 9.5771 0.1320
0.0000 0.00000.7528 0.0000 0.7528 0.4138 0.0000 0.4138Fugitive Dust
Total CO2 CH4 N2O CO2e
Category lb/day lb/day
PM10 Total
Fugitive PM2.5
Exhaust PM2.5
PM2.5 Total
Bio- CO2 NBio- CO2ROG NOx CO SO2 Fugitive PM10
Exhaust PM10

1,322.7958
1,322.7958 0.3311 1,331.0731
1.7843 1.7843 1.7843 1.7843Total 3.6919 22.6696 9.6715 0.1374
1,322.7958
1,322.7958 0.3311 1,331.0731
1.7843 1.7843 1.7843 1.7843Off-Road 3.6919 22.6696 9.6715 0.1374
Total CO2 CH4 N2O CO2e
Category lb/day lb/day
PM10 Total
Fugitive PM2.5
Exhaust PM2.5
PM2.5 Total
Bio- CO2 NBio- CO2
3.5 Building Construction - 2004Unmitigated Construction On-Site
ROG NOx CO SO2 Fugitive PM10
Exhaust PM10
104.7032 104.7032 0.0157 105.09660.0822 3.3100e-003
0.0855 0.0218 3.0700e-003
0.0249Total 0.2044 0.2339 2.2266 1.6000e-003
104.7032 104.7032 0.0157 105.09660.0822 3.3100e-003
0.0855 0.0218 3.0700e-003
0.0249Worker 0.2044 0.2339 2.2266 1.6000e-003
0.0000 0.0000 0.0000 0.00000.0000 0.0000 0.0000 0.0000 0.0000 0.0000Vendor 0.0000 0.0000 0.0000 0.0000
0.0000 0.0000 0.0000 0.00000.0000 0.0000 0.0000 0.0000 0.0000 0.0000Hauling 0.0000 0.0000 0.0000 0.0000
Total CO2 CH4 N2O CO2e
Category lb/day lb/day
PM10 Total
Fugitive PM2.5
Exhaust PM2.5
PM2.5 Total
Bio- CO2 NBio- CO2
Mitigated Construction Off-Site
ROG NOx CO SO2 Fugitive PM10
Exhaust PM10
0.0000 1,256.0421
1,256.0421 0.3290 1,264.2669
0.7528 1.7408 2.4936 0.4138 1.7408 2.1546Total 3.6662 21.9317 9.5771 0.1320
0.0000 1,256.0421
1,256.0421 0.3290 1,264.2669
1.7408 1.7408 1.7408 1.7408Off-Road 3.6662 21.9317 9.5771 0.1320
0.0000 0.00000.7528 0.0000 0.7528 0.4138 0.0000 0.4138Fugitive Dust

Total CO2 CH4 N2O CO2ePM10 Total
Fugitive PM2.5
Exhaust PM2.5
PM2.5 Total
Bio- CO2 NBio- CO2
Mitigated Construction Off-Site
ROG NOx CO SO2 Fugitive PM10
Exhaust PM10
0.0000 1,322.7958
1,322.7958 0.3311 1,331.0731
1.7843 1.7843 1.7843 1.7843Total 3.6919 22.6696 9.6715 0.1374
0.0000 1,322.7958
1,322.7958 0.3311 1,331.0731
1.7843 1.7843 1.7843 1.7843Off-Road 3.6919 22.6696 9.6715 0.1374
Total CO2 CH4 N2O CO2e
Category lb/day lb/day
PM10 Total
Fugitive PM2.5
Exhaust PM2.5
PM2.5 Total
Bio- CO2 NBio- CO2
Mitigated Construction On-Site
ROG NOx CO SO2 Fugitive PM10
Exhaust PM10
173.5271 173.5271 0.0243 174.13400.0860 0.0377 0.1237 0.0233 0.0359 0.0592Total 0.2773 1.1654 2.4707 8.6700e-003
83.7626 83.7626 0.0126 84.07730.0657 2.6500e-003
0.0684 0.0174 2.4500e-003
0.0199Worker 0.1635 0.1871 1.7813 1.2800e-003
89.7646 89.7646 0.0117 90.05670.0203 0.0350 0.0553 5.8400e-003
0.0335 0.0393Vendor 0.1138 0.9783 0.6894 7.3900e-003
0.0000 0.0000 0.0000 0.00000.0000 0.0000 0.0000 0.0000 0.0000 0.0000Hauling 0.0000 0.0000 0.0000 0.0000
Total CO2 CH4 N2O CO2e
Category lb/day lb/day
PM10 Total
Fugitive PM2.5
Exhaust PM2.5
PM2.5 Total
Bio- CO2 NBio- CO2
Unmitigated Construction Off-Site
ROG NOx CO SO2 Fugitive PM10
Exhaust PM10

188.4658 188.4658 0.0283 189.17390.1479 5.9600e-003
0.1538 0.0392 5.5200e-003
0.0447Worker 0.3679 0.4210 4.0079 2.8700e-003
0.0000 0.0000 0.0000 0.00000.0000 0.0000 0.0000 0.0000 0.0000 0.0000Vendor 0.0000 0.0000 0.0000 0.0000
0.0000 0.0000 0.0000 0.00000.0000 0.0000 0.0000 0.0000 0.0000 0.0000Hauling 0.0000 0.0000 0.0000 0.0000
Total CO2 CH4 N2O CO2e
Category lb/day lb/day
PM10 Total
Fugitive PM2.5
Exhaust PM2.5
PM2.5 Total
Bio- CO2 NBio- CO2
Unmitigated Construction Off-Site
ROG NOx CO SO2 Fugitive PM10
Exhaust PM10
1,211.7777
1,211.7777 0.3022 1,219.3328
1.5422 1.5422 1.5422 1.5422Total 3.3626 21.2572 9.2783 0.1305
0.0000 0.00000.0000 0.0000 0.0000 0.0000Paving 0.0000
1,211.7777
1,211.7777 0.3022 1,219.3328
1.5422 1.5422 1.5422 1.5422Off-Road 3.3626 21.2572 9.2783 0.1305
Total CO2 CH4 N2O CO2e
Category lb/day lb/day
PM10 Total
Fugitive PM2.5
Exhaust PM2.5
PM2.5 Total
Bio- CO2 NBio- CO2
3.6 Paving - 2004Unmitigated Construction On-Site
ROG NOx CO SO2 Fugitive PM10
Exhaust PM10
173.5271 173.5271 0.0243 174.13400.0860 0.0377 0.1237 0.0233 0.0359 0.0592Total 0.2773 1.1654 2.4707 8.6700e-003
83.7626 83.7626 0.0126 84.07730.0657 2.6500e-003
0.0684 0.0174 2.4500e-003
0.0199Worker 0.1635 0.1871 1.7813 1.2800e-003
89.7646 89.7646 0.0117 90.05670.0203 0.0350 0.0553 5.8400e-003
0.0335 0.0393Vendor 0.1138 0.9783 0.6894 7.3900e-003
0.0000 0.0000 0.0000 0.00000.0000 0.0000 0.0000 0.0000 0.0000 0.0000Hauling 0.0000 0.0000 0.0000 0.0000
Category lb/day lb/day

3.7 Architectural Coating - 2004Unmitigated Construction On-Site
188.4658 188.4658 0.0283 189.17390.1479 5.9600e-003
0.1538 0.0392 5.5200e-003
0.0447Total 0.3679 0.4210 4.0079 2.8700e-003
188.4658 188.4658 0.0283 189.17390.1479 5.9600e-003
0.1538 0.0392 5.5200e-003
0.0447Worker 0.3679 0.4210 4.0079 2.8700e-003
0.0000 0.0000 0.0000 0.00000.0000 0.0000 0.0000 0.0000 0.0000 0.0000Vendor 0.0000 0.0000 0.0000 0.0000
0.0000 0.0000 0.0000 0.00000.0000 0.0000 0.0000 0.0000 0.0000 0.0000Hauling 0.0000 0.0000 0.0000 0.0000
Total CO2 CH4 N2O CO2e
Category lb/day lb/day
PM10 Total
Fugitive PM2.5
Exhaust PM2.5
PM2.5 Total
Bio- CO2 NBio- CO2
Mitigated Construction Off-Site
ROG NOx CO SO2 Fugitive PM10
Exhaust PM10
0.0000 1,211.7777
1,211.7777 0.3022 1,219.3328
1.5422 1.5422 1.5422 1.5422Total 3.3626 21.2572 9.2783 0.1305
0.0000 0.00000.0000 0.0000 0.0000 0.0000Paving 0.0000
0.0000 1,211.7777
1,211.7777 0.3022 1,219.3328
1.5422 1.5422 1.5422 1.5422Off-Road 3.3626 21.2572 9.2783 0.1305
Total CO2 CH4 N2O CO2e
Category lb/day lb/day
PM10 Total
Fugitive PM2.5
Exhaust PM2.5
PM2.5 Total
Bio- CO2 NBio- CO2
Mitigated Construction On-Site
ROG NOx CO SO2 Fugitive PM10
Exhaust PM10
188.4658 188.4658 0.0283 189.17390.1479 5.9600e-003
0.1538 0.0392 5.5200e-003
0.0447Total 0.3679 0.4210 4.0079 2.8700e-003

Total CO2 CH4 N2O CO2e
Category lb/day lb/day
PM10 Total
Fugitive PM2.5
Exhaust PM2.5
PM2.5 Total
Bio- CO2 NBio- CO2
Mitigated Construction On-Site
ROG NOx CO SO2 Fugitive PM10
Exhaust PM10
20.9406 20.9406 3.1500e-003
21.01930.0164 6.6000e-004
0.0171 4.3600e-003
6.1000e-004
4.9700e-003
Total 0.0409 0.0468 0.4453 3.2000e-004
20.9406 20.9406 3.1500e-003
21.01930.0164 6.6000e-004
0.0171 4.3600e-003
6.1000e-004
4.9700e-003
Worker 0.0409 0.0468 0.4453 3.2000e-004
0.0000 0.0000 0.0000 0.00000.0000 0.0000 0.0000 0.0000 0.0000 0.0000Vendor 0.0000 0.0000 0.0000 0.0000
0.0000 0.0000 0.0000 0.00000.0000 0.0000 0.0000 0.0000 0.0000 0.0000Hauling 0.0000 0.0000 0.0000 0.0000
Total CO2 CH4 N2O CO2e
Category lb/day lb/day
PM10 Total
Fugitive PM2.5
Exhaust PM2.5
PM2.5 Total
Bio- CO2 NBio- CO2
Unmitigated Construction Off-Site
ROG NOx CO SO2 Fugitive PM10
Exhaust PM10
281.4485 281.4485 0.0787 283.41720.4135 0.4135 0.4135 0.4135Total 92.9861 5.0892 2.2504 0.0297
281.4485 281.4485 0.0787 283.41720.4135 0.4135 0.4135 0.4135Off-Road 0.8771 5.0892 2.2504 0.0297
0.0000 0.00000.0000 0.0000 0.0000 0.0000Archit. Coating 92.1090
Total CO2 CH4 N2O CO2e
Category lb/day lb/day
PM10 Total
Fugitive PM2.5
Exhaust PM2.5
PM2.5 Total
Bio- CO2 NBio- CO2ROG NOx CO SO2 Fugitive PM10
Exhaust PM10

2,422.5813
2,422.5813 0.2676 2,429.2707
1.5864 0.1347 1.7211 0.4244 0.1279 0.5523Mitigated 1.9348 6.1429 23.4875 0.0525
NBio- CO2 Total CO2 CH4 N2O CO2e
Category lb/day lb/day
Exhaust PM10
PM10 Total
Fugitive PM2.5
Exhaust PM2.5
PM2.5 Total
Bio- CO2
4.0 Operational Detail - Mobile
4.1 Mitigation Measures Mobile
ROG NOx CO SO2 Fugitive PM10
20.9406 20.9406 3.1500e-003
21.01930.0164 6.6000e-004
0.0171 4.3600e-003
6.1000e-004
4.9700e-003
Total 0.0409 0.0468 0.4453 3.2000e-004
20.9406 20.9406 3.1500e-003
21.01930.0164 6.6000e-004
0.0171 4.3600e-003
6.1000e-004
4.9700e-003
Worker 0.0409 0.0468 0.4453 3.2000e-004
0.0000 0.0000 0.0000 0.00000.0000 0.0000 0.0000 0.0000 0.0000 0.0000Vendor 0.0000 0.0000 0.0000 0.0000
0.0000 0.0000 0.0000 0.00000.0000 0.0000 0.0000 0.0000 0.0000 0.0000Hauling 0.0000 0.0000 0.0000 0.0000
Total CO2 CH4 N2O CO2e
Category lb/day lb/day
PM10 Total
Fugitive PM2.5
Exhaust PM2.5
PM2.5 Total
Bio- CO2 NBio- CO2
Mitigated Construction Off-Site
ROG NOx CO SO2 Fugitive PM10
Exhaust PM10
0.0000 281.4485 281.4485 0.0787 283.41720.4135 0.4135 0.4135 0.4135Total 92.9861 5.0892 2.2504 0.0297
0.0000 281.4485 281.4485 0.0787 283.41720.4135 0.4135 0.4135 0.4135Off-Road 0.8771 5.0892 2.2504 0.0297
0.0000 0.00000.0000 0.0000 0.0000 0.0000Archit. Coating 92.1090

CO2ePM2.5 Total
Bio- CO2 NBio- CO2 Total CO2 CH4 N2OSO2 Fugitive PM10
Exhaust PM10
PM10 Total
Fugitive PM2.5
Exhaust PM2.5
0.000773 0.002884
5.0 Energy Detail
Historical Energy Use: Y
5.1 Mitigation Measures Energy
ROG NOx CO
0.005459 0.014026 0.019971 0.001578 0.001508 0.005510University/College (4Yr) 0.496962 0.074792 0.199148 0.142251 0.035136
0.019971 0.001578 0.001508 0.005510 0.000773 0.002884
SBUS MH
Junior College (2Yr) 0.496962 0.074792 0.199148 0.142251 0.035136 0.005459 0.014026
LHD2 MHD HHD OBUS UBUS MCYLand Use LDA LDT1 LDT2 MDV LHD1
88.60 5.00 91 9 0
4.4 Fleet Mix
88.60 5.00 92 7 1
University/College (4Yr) 9.50 7.30 7.30 6.40
H-S or C-C H-O or C-NW Primary Diverted Pass-by
Junior College (2Yr) 9.50 7.30 7.30 6.40
4.3 Trip Type Information
Miles Trip % Trip Purpose %
Land Use H-W or C-W H-S or C-C H-O or C-NW H-W or C-W
Total 294.90 166.18 7.26 596,371 596,371University/College (4Yr) 129.96 98.80 0.00 270,098 270,098
Annual VMT
Junior College (2Yr) 164.94 67.38 7.26 326,272 326,272
4.2 Trip Summary Information
Average Daily Trip Rate Unmitigated MitigatedLand Use Weekday Saturday Sunday Annual VMT
2,422.5813
2,422.5813 0.2676 2,429.2707
1.5864 0.1347 1.7211 0.4244 0.1279 0.5523Unmitigated 1.9348 6.1429 23.4875 0.0525

264.2209 264.2209 5.0600e-003
4.8400e-003
265.79100.0167 0.0167 0.0167 0.0167Total 0.0242 0.2202 0.1850 1.3200e-003
185.7229 185.7229 3.5600e-003
3.4000e-003
186.82650.0118 0.0118 0.0118 0.0118University/College (4Yr)
1.57864 0.0170 0.1548 0.1300 9.3000e-004
78.4980 78.4980 1.5000e-003
1.4400e-003
78.96454.9700e-003
4.9700e-003
4.9700e-003
4.9700e-003
Junior College (2Yr)
0.667233 7.2000e-003
0.0654 0.0550 3.9000e-004
Total CO2 CH4 N2O CO2e
Land Use kBTU/yr lb/day lb/day
PM10 Total
Fugitive PM2.5
Exhaust PM2.5
PM2.5 Total
Bio- CO2 NBio- CO2
Mitigated
NaturalGas Use
ROG NOx CO SO2 Fugitive PM10
Exhaust PM10
264.2209 264.2209 5.0600e-003
4.8400e-003
265.79100.0167 0.0167 0.0167 0.0167Total 0.0242 0.2202 0.1850 1.3200e-003
185.7229 185.7229 3.5600e-003
3.4000e-003
186.82650.0118 0.0118 0.0118 0.0118University/College (4Yr)
1578.64 0.0170 0.1548 0.1300 9.3000e-004
78.4980 78.4980 1.5000e-003
1.4400e-003
78.96454.9700e-003
4.9700e-003
4.9700e-003
4.9700e-003
Junior College (2Yr)
667.233 7.2000e-003
0.0654 0.0550 3.9000e-004
Total CO2 CH4 N2O CO2e
Land Use kBTU/yr lb/day lb/day
PM10 Total
Fugitive PM2.5
Exhaust PM2.5
PM2.5 Total
Bio- CO2 NBio- CO2
5.2 Energy by Land Use - NaturalGasUnmitigated
NaturalGas Use
ROG NOx CO SO2 Fugitive PM10
Exhaust PM10
264.2208 264.2208 5.0600e-003
4.8400e-003
265.79100.0167 0.0167 0.0167 0.0167NaturalGas Unmitigated
0.0242 0.2202 0.1850 1.3200e-003
264.2208 264.2208 5.0600e-003
4.8400e-003
265.79100.0167 0.0167 0.0167 0.0167
Category lb/day lb/day
NaturalGas Mitigated
0.0242 0.2202 0.1850 1.3200e-003

Mitigated
0.0180 0.0180 8.0000e-005
0.02004.0000e-005
4.0000e-005
4.0000e-005
4.0000e-005
Total 0.5528 1.3000e-004
0.0107 0.0000
0.0180 0.0180 8.0000e-005
0.02004.0000e-005
4.0000e-005
4.0000e-005
4.0000e-005
Landscaping 1.3800e-003
1.3000e-004
0.0107 0.0000
0.0000 0.00000.0000 0.0000 0.0000 0.0000Consumer Products
0.4253
0.0000 0.00000.0000 0.0000 0.0000 0.0000Architectural Coating
0.1262
Total CO2 CH4 N2O CO2e
SubCategory lb/day lb/day
PM10 Total
Fugitive PM2.5
Exhaust PM2.5
PM2.5 Total
Bio- CO2 NBio- CO2
6.2 Area by SubCategoryUnmitigated
ROG NOx CO SO2 Fugitive PM10
Exhaust PM10
0.0180 0.0180 8.0000e-005
0.02004.0000e-005
4.0000e-005
4.0000e-005
4.0000e-005
Unmitigated 0.5528 1.3000e-004
0.0107 0.0000
0.0180 0.0180 8.0000e-005
0.02004.0000e-005
4.0000e-005
4.0000e-005
4.0000e-005
Mitigated 0.5528 1.3000e-004
0.0107 0.0000
NBio- CO2 Total CO2 CH4 N2O CO2e
Category lb/day lb/day
Exhaust PM10
PM10 Total
Fugitive PM2.5
Exhaust PM2.5
PM2.5 Total
Bio- CO2
6.0 Area Detail
6.1 Mitigation Measures Area
ROG NOx CO SO2 Fugitive PM10

User Defined Equipment
Load Factor Fuel Type
Boilers
Equipment Type Number Heat Input/Day Heat Input/Year Boiler Rating Fuel Type
Fire Pumps and Emergency Generators
Equipment Type Number Hours/Day Hours/Year Horse Power
Hours/Day Days/Year Horse Power Load Factor Fuel Type
10.0 Stationary Equipment
7.0 Water Detail
7.1 Mitigation Measures Water
8.0 Waste Detail
8.1 Mitigation Measures Waste
9.0 Operational Offroad
Equipment Type Number
0.0180 0.0180 8.0000e-005
0.02004.0000e-005
4.0000e-005
4.0000e-005
4.0000e-005
Total 0.5528 1.3000e-004
0.0107 0.0000
0.0180 0.0180 8.0000e-005
0.02004.0000e-005
4.0000e-005
4.0000e-005
4.0000e-005
Landscaping 1.3800e-003
1.3000e-004
0.0107 0.0000
0.0000 0.00000.0000 0.0000 0.0000 0.0000Consumer Products
0.4253
0.0000 0.00000.0000 0.0000 0.0000 0.0000Architectural Coating
0.1262
Total CO2 CH4 N2O CO2e
SubCategory lb/day lb/day
PM10 Total
Fugitive PM2.5
Exhaust PM2.5
PM2.5 Total
Bio- CO2 NBio- CO2ROG NOx CO SO2 Fugitive PM10
Exhaust PM10

Equipment Type Number
11.0 Vegetation

tblProjectCharacteristics OperationalYear 2018 2005
tblLandUse BuildingSpaceSquareFeet 6,000.00 5,904.00
tblLandUse LandUseSquareFeet 6,000.00 5,904.00
tblArchitecturalCoating EF_Parking 250.00 0.00
tblAreaCoating Area_EF_Parking 250 0
1.3 User Entered Comments & Non-Default Data
Project Characteristics - Assumed Operational Start date of 2005
Land Use - Tula Community Center square footage = 19,872 = approx 13,968 square feet of 4Yr + approx 5904 square feet of 2Yr space
Energy Use - Historical Engery Title 24 requirements assumed.
Table Name Column Name Default Value New Value
CO2 Intensity (lb/MWhr)
720.49 CH4 Intensity (lb/MWhr)
0.029 N2O Intensity (lb/MWhr)
0.006
40
Climate Zone 13 Operational Year 2005
Utility Company San Diego Gas & Electric
1.2 Other Project Characteristics
Urbanization Urban Wind Speed (m/s) 2.6 Precipitation Freq (Days)
University/College (4Yr) 76.00 Student 0.32 13,968.61 0
Floor Surface Area Population
Junior College (2Yr) 6.00 1000sqft 0.14 5,904.00 0
1.0 Project Characteristics
1.1 Land Usage
Land Uses Size Metric Lot Acreage
CalEEMod Version: CalEEMod.2016.3.1 Page 1 of 1 Date: 12/21/2016 10:16 AM
Existing Setting - Tula Community Center - San Diego County APCD Air District, Annual
Existing Setting - Tula Community CenterSan Diego County APCD Air District, Annual

Quarter Start Date End Date Maximum Unmitigated ROG + NOX (tons/quarter) Maximum Mitigated ROG + NOX (tons/quarter)
0.00 0.00 0.00 0.00 0.00 0.000.00 0.00 0.00 0.00 0.00 0.00
NBio-CO2 Total CO2 CH4 N20 CO2e
Percent Reduction
0.00 0.00 0.00 0.00
Exhaust PM10
PM10 Total
Fugitive PM2.5
Exhaust PM2.5
PM2.5 Total
Bio- CO2ROG NOx CO SO2 Fugitive PM10
0.0000 79.4153 79.4153 0.0190 0.0000 79.89136.1200e-003
0.1071 0.1132 1.8200e-003
0.1070 0.1088Maximum 0.4652 1.4038 0.7203 8.5600e-003
0.0000 79.4153 79.4153 0.0190 0.0000 79.89136.1200e-003
0.1071 0.1132 1.8200e-003
0.1070 0.10882004 0.4652 1.4038 0.7203 8.5600e-003
Total CO2 CH4 N2O CO2e
Year tons/yr MT/yr
PM10 Total
Fugitive PM2.5
Exhaust PM2.5
PM2.5 Total
Bio- CO2 NBio- CO2
Mitigated Construction
ROG NOx CO SO2 Fugitive PM10
Exhaust PM10
0.0000 79.4154 79.4154 0.0190 0.0000 79.89146.1200e-003
0.1071 0.1132 1.8200e-003
0.1070 0.1088Maximum 0.4652 1.4038 0.7203 8.5600e-003
0.0000 79.4154 79.4154 0.0190 0.0000 79.89146.1200e-003
0.1071 0.1132 1.8200e-003
0.1070 0.10882004 0.4652 1.4038 0.7203 8.5600e-003
CH4 N2O CO2e
Year tons/yr MT/yr
Fugitive PM2.5
Exhaust PM2.5
PM2.5 Total
Bio- CO2 NBio- CO2 Total CO2
Unmitigated Construction
ROG NOx CO SO2 Fugitive PM10
Exhaust PM10
PM10 Total
2.0 Emissions Summary
2.1 Overall Construction

0.0000 305.4813 305.4813 0.0350 0.0000 306.35620.2251 0.0199 0.2449 0.0603 0.0189 0.0792Mobile 0.2736 0.9369 3.3866 7.4300e-003
0.0000 113.6910 113.6910 3.6500e-003
1.3800e-003
114.19493.0500e-003
3.0500e-003
3.0500e-003
3.0500e-003
Energy 4.4200e-003
0.0402 0.0338 2.4000e-004
0.0000 1.4700e-003
1.4700e-003
1.0000e-005
0.0000 1.6400e-003
0.0000 0.0000 0.0000 0.0000Area 0.1008 1.0000e-005
9.6000e-004
0.0000
Total CO2 CH4 N2O CO2e
Category tons/yr MT/yr
PM10 Total
Fugitive PM2.5
Exhaust PM2.5
PM2.5 Total
Bio- CO2 NBio- CO2
Mitigated Operational
ROG NOx CO SO2 Fugitive PM10
Exhaust PM10
4.5438 423.7139 428.2577 0.3137 1.7700e-003
436.62860.2251 0.0229 0.2480 0.0603 0.0219 0.0823Total 0.3788 0.9771 3.4213 7.6700e-003
0.1450 4.5402 4.6852 0.0151 3.9000e-004
5.17810.0000 0.0000 0.0000 0.0000Water
4.3988 0.0000 4.3988 0.2600 0.0000 10.89790.0000 0.0000 0.0000 0.0000Waste
0.0000 305.4813 305.4813 0.0350 0.0000 306.35620.2251 0.0199 0.2449 0.0603 0.0189 0.0792Mobile 0.2736 0.9369 3.3866 7.4300e-003
0.0000 113.6910 113.6910 3.6500e-003
1.3800e-003
114.19493.0500e-003
3.0500e-003
3.0500e-003
3.0500e-003
Energy 4.4200e-003
0.0402 0.0338 2.4000e-004
0.0000 1.4700e-003
1.4700e-003
1.0000e-005
0.0000 1.6400e-003
0.0000 0.0000 0.0000 0.0000Area 0.1008 1.0000e-005
9.6000e-004
0.0000
Total CO2 CH4 N2O CO2e
Category tons/yr MT/yr
PM10 Total
Fugitive PM2.5
Exhaust PM2.5
PM2.5 Total
Bio- CO2 NBio- CO2
2.2 Overall OperationalUnmitigated Operational
ROG NOx CO SO2 Fugitive PM10
Exhaust PM10
2 4-1-2004 6-30-2004 0.9842 0.9842
Highest 0.9842 0.9842
1 1-1-2004 3-31-2004 0.8920 0.8920

Building Construction Tractors/Loaders/Backhoes 2 8.00 97 0.37
Building Construction Forklifts 2 6.00 89 0.20
Building Construction Cranes 1 4.00 231 0.29
Load Factor
Architectural Coating Air Compressors 1 6.00 78 0.48
Acres of Grading (Site Preparation Phase): 0.5
Acres of Grading (Grading Phase): 0
Acres of Paving: 0
Residential Indoor: 0; Residential Outdoor: 0; Non-Residential Indoor: 29,809; Non-Residential Outdoor: 9,936; Striped Parking Area: 0
OffRoad Equipment
Phase Name Offroad Equipment Type Amount Usage Hours Horse Power
5
6 Architectural Coating Architectural Coating 6/15/2004 6/21/2004 5 5
5 Paving Paving 6/8/2004 6/14/2004 5
2
4 Building Construction Building Construction 1/20/2004 6/7/2004 5 100
3 Grading Grading 1/16/2004 1/19/2004 5
10
2 Site Preparation Site Preparation 1/15/2004 1/15/2004 5 1
End Date Num Days Week
Num Days Phase Description
1 Demolition Demolition 1/1/2004 1/14/2004 5
3.0 Construction Detail
Construction Phase
Phase Number
Phase Name Phase Type Start Date
0.00 0.00 0.00 0.00 0.00 0.000.00 0.00 0.00 0.00 0.00 0.00
NBio-CO2 Total CO2 CH4 N20 CO2e
Percent Reduction
0.00 0.00 0.00 0.00
Exhaust PM10
PM10 Total
Fugitive PM2.5
Exhaust PM2.5
PM2.5 Total
Bio- CO2ROG NOx CO SO2 Fugitive PM10
4.5438 423.7139 428.2577 0.3137 1.7700e-003
436.62860.2251 0.0229 0.2480 0.0603 0.0219 0.0823Total 0.3788 0.9771 3.4213 7.6700e-003
0.1450 4.5402 4.6852 0.0151 3.9000e-004
5.17810.0000 0.0000 0.0000 0.0000Water
4.3988 0.0000 4.3988 0.2600 0.0000 10.89790.0000 0.0000 0.0000 0.0000Waste

NBio- CO2 Total CO2 CH4 N2O CO2eExhaust PM10
PM10 Total
Fugitive PM2.5
Exhaust PM2.5
PM2.5 Total
Bio- CO2
3.1 Mitigation Measures Construction
3.2 Demolition - 2004Unmitigated Construction On-Site
ROG NOx CO SO2 Fugitive PM10
10.80 7.30 20.00 LD_Mix HDT_Mix HHDT
7.30 20.00 LD_Mix HDT_Mix HHDT
Site Preparation 2 5.00 0.00 0.00
Paving 7 18.00 0.00 0.00 10.80
10.80 7.30 20.00 LD_Mix HDT_Mix HHDT
7.30 20.00 LD_Mix HDT_Mix HHDT
Grading 4 10.00 0.00 0.00
Demolition 4 10.00 0.00 0.00 10.80
10.80 7.30 20.00 LD_Mix HDT_Mix HHDT
7.30 20.00 LD_Mix HDT_Mix HHDT
Building Construction 5 8.00 3.00 0.00
Architectural Coating 1 2.00 0.00 0.00 10.80
Worker Trip Length
Vendor Trip Length
Hauling Trip Length
Worker Vehicle Class
Vendor Vehicle Class
Hauling Vehicle Class
Trips and VMT
Phase Name Offroad Equipment Count
Worker Trip Number
Vendor Trip Number
Hauling Trip Number
Site Preparation Tractors/Loaders/Backhoes 1 8.00 97 0.37
Site Preparation Graders 1 8.00 187 0.41
Paving Tractors/Loaders/Backhoes 1 7.00 97 0.37
Paving Rollers 1 7.00 80 0.38
Paving Pavers 1 7.00 130 0.42
Paving Cement and Mortar Mixers 4 6.00 9 0.56
Grading Tractors/Loaders/Backhoes 2 6.00 97 0.37
Grading Rubber Tired Dozers 1 1.00 247 0.40
Grading Concrete/Industrial Saws 1 8.00 81 0.73
Demolition Tractors/Loaders/Backhoes 2 6.00 97 0.37
Demolition Rubber Tired Dozers 1 1.00 247 0.40
Demolition Concrete/Industrial Saws 1 8.00 81 0.73

0.0000 5.6973 5.6973 1.4900e-003
0.0000 5.73468.7000e-003
8.7000e-003
8.7000e-003
8.7000e-003
Total 0.0183 0.1097 0.0479 6.6000e-004
0.0000 5.6973 5.6973 1.4900e-003
0.0000 5.73468.7000e-003
8.7000e-003
8.7000e-003
8.7000e-003
Off-Road 0.0183 0.1097 0.0479 6.6000e-004
Total CO2 CH4 N2O CO2e
Category tons/yr MT/yr
PM10 Total
Fugitive PM2.5
Exhaust PM2.5
PM2.5 Total
Bio- CO2 NBio- CO2
Mitigated Construction On-Site
ROG NOx CO SO2 Fugitive PM10
Exhaust PM10
0.0000 0.4527 0.4527 7.0000e-005
0.0000 0.45444.0000e-004
2.0000e-005
4.2000e-004
1.1000e-004
2.0000e-005
1.2000e-004
Total 1.0300e-003
1.3000e-003
0.0108 1.0000e-005
0.0000 0.4527 0.4527 7.0000e-005
0.0000 0.45444.0000e-004
2.0000e-005
4.2000e-004
1.1000e-004
2.0000e-005
1.2000e-004
Worker 1.0300e-003
1.3000e-003
0.0108 1.0000e-005
0.0000 0.0000 0.0000 0.0000 0.0000 0.00000.0000 0.0000 0.0000 0.0000 0.0000 0.0000Vendor 0.0000 0.0000 0.0000 0.0000
0.0000 0.0000 0.0000 0.0000 0.0000 0.00000.0000 0.0000 0.0000 0.0000 0.0000 0.0000Hauling 0.0000 0.0000 0.0000 0.0000
Total CO2 CH4 N2O CO2e
Category tons/yr MT/yr
PM10 Total
Fugitive PM2.5
Exhaust PM2.5
PM2.5 Total
Bio- CO2 NBio- CO2
Unmitigated Construction Off-Site
ROG NOx CO SO2 Fugitive PM10
Exhaust PM10
0.0000 5.6973 5.6973 1.4900e-003
0.0000 5.73468.7000e-003
8.7000e-003
8.7000e-003
8.7000e-003
Total 0.0183 0.1097 0.0479 6.6000e-004
0.0000 5.6973 5.6973 1.4900e-003
0.0000 5.73468.7000e-003
8.7000e-003
8.7000e-003
8.7000e-003
Off-Road 0.0183 0.1097 0.0479 6.6000e-004
Category tons/yr MT/yr

Unmitigated Construction Off-Site
0.0000 0.5117 0.5117 1.0000e-004
0.0000 0.51432.7000e-004
5.7000e-004
8.4000e-004
3.0000e-005
5.7000e-004
6.0000e-004
Total 1.2700e-003
9.3600e-003
3.4600e-003
6.0000e-005
0.0000 0.5117 0.5117 1.0000e-004
0.0000 0.51435.7000e-004
5.7000e-004
5.7000e-004
5.7000e-004
Off-Road 1.2700e-003
9.3600e-003
3.4600e-003
6.0000e-005
0.0000 0.0000 0.0000 0.0000 0.0000 0.00002.7000e-004
0.0000 2.7000e-004
3.0000e-005
0.0000 3.0000e-005
Fugitive Dust
Total CO2 CH4 N2O CO2e
Category tons/yr MT/yr
PM10 Total
Fugitive PM2.5
Exhaust PM2.5
PM2.5 Total
Bio- CO2 NBio- CO2
3.3 Site Preparation - 2004Unmitigated Construction On-Site
ROG NOx CO SO2 Fugitive PM10
Exhaust PM10
0.0000 0.4527 0.4527 7.0000e-005
0.0000 0.45444.0000e-004
2.0000e-005
4.2000e-004
1.1000e-004
2.0000e-005
1.2000e-004
Total 1.0300e-003
1.3000e-003
0.0108 1.0000e-005
0.0000 0.4527 0.4527 7.0000e-005
0.0000 0.45444.0000e-004
2.0000e-005
4.2000e-004
1.1000e-004
2.0000e-005
1.2000e-004
Worker 1.0300e-003
1.3000e-003
0.0108 1.0000e-005
0.0000 0.0000 0.0000 0.0000 0.0000 0.00000.0000 0.0000 0.0000 0.0000 0.0000 0.0000Vendor 0.0000 0.0000 0.0000 0.0000
0.0000 0.0000 0.0000 0.0000 0.0000 0.00000.0000 0.0000 0.0000 0.0000 0.0000 0.0000Hauling 0.0000 0.0000 0.0000 0.0000
Total CO2 CH4 N2O CO2e
Category tons/yr MT/yr
PM10 Total
Fugitive PM2.5
Exhaust PM2.5
PM2.5 Total
Bio- CO2 NBio- CO2
Mitigated Construction Off-Site
ROG NOx CO SO2 Fugitive PM10
Exhaust PM10
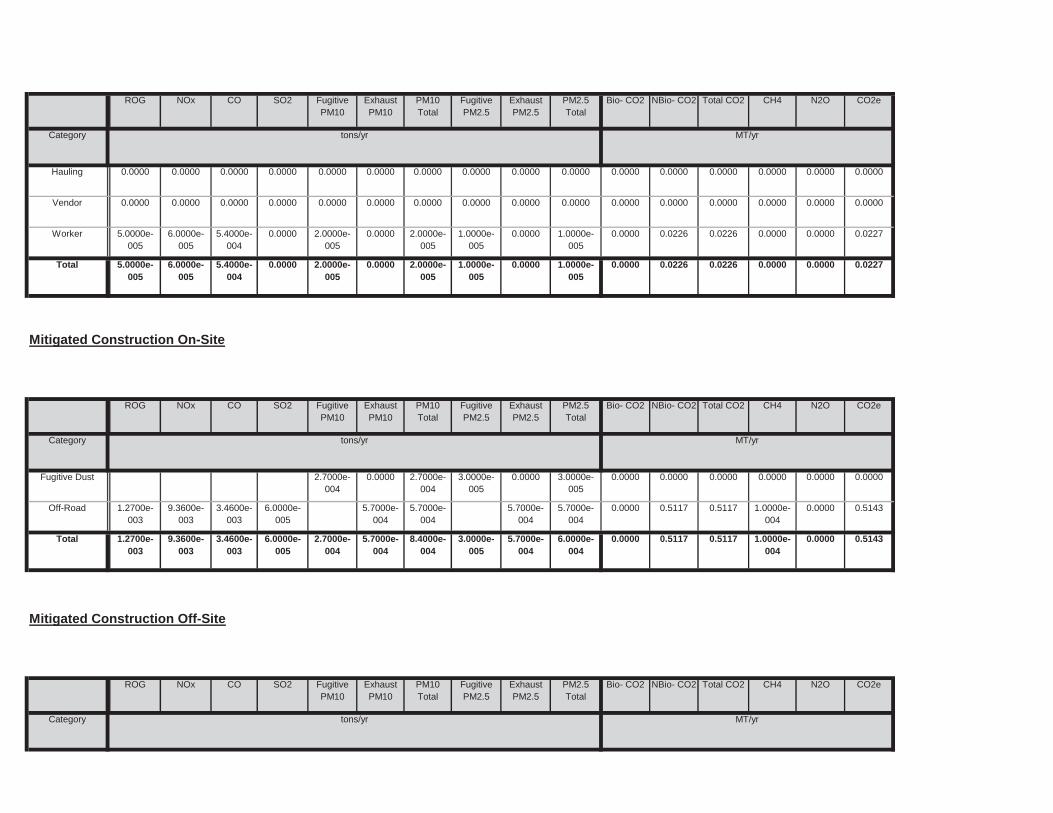
Total CO2 CH4 N2O CO2e
Category tons/yr MT/yr
PM10 Total
Fugitive PM2.5
Exhaust PM2.5
PM2.5 Total
Bio- CO2 NBio- CO2
Mitigated Construction Off-Site
ROG NOx CO SO2 Fugitive PM10
Exhaust PM10
0.0000 0.5117 0.5117 1.0000e-004
0.0000 0.51432.7000e-004
5.7000e-004
8.4000e-004
3.0000e-005
5.7000e-004
6.0000e-004
Total 1.2700e-003
9.3600e-003
3.4600e-003
6.0000e-005
0.0000 0.5117 0.5117 1.0000e-004
0.0000 0.51435.7000e-004
5.7000e-004
5.7000e-004
5.7000e-004
Off-Road 1.2700e-003
9.3600e-003
3.4600e-003
6.0000e-005
0.0000 0.0000 0.0000 0.0000 0.0000 0.00002.7000e-004
0.0000 2.7000e-004
3.0000e-005
0.0000 3.0000e-005
Fugitive Dust
Total CO2 CH4 N2O CO2e
Category tons/yr MT/yr
PM10 Total
Fugitive PM2.5
Exhaust PM2.5
PM2.5 Total
Bio- CO2 NBio- CO2
Mitigated Construction On-Site
ROG NOx CO SO2 Fugitive PM10
Exhaust PM10
0.0000 0.0226 0.0226 0.0000 0.0000 0.02272.0000e-005
0.0000 2.0000e-005
1.0000e-005
0.0000 1.0000e-005
Total 5.0000e-005
6.0000e-005
5.4000e-004
0.0000
0.0000 0.0226 0.0226 0.0000 0.0000 0.02272.0000e-005
0.0000 2.0000e-005
1.0000e-005
0.0000 1.0000e-005
Worker 5.0000e-005
6.0000e-005
5.4000e-004
0.0000
0.0000 0.0000 0.0000 0.0000 0.0000 0.00000.0000 0.0000 0.0000 0.0000 0.0000 0.0000Vendor 0.0000 0.0000 0.0000 0.0000
0.0000 0.0000 0.0000 0.0000 0.0000 0.00000.0000 0.0000 0.0000 0.0000 0.0000 0.0000Hauling 0.0000 0.0000 0.0000 0.0000
Total CO2 CH4 N2O CO2e
Category tons/yr MT/yr
PM10 Total
Fugitive PM2.5
Exhaust PM2.5
PM2.5 Total
Bio- CO2 NBio- CO2ROG NOx CO SO2 Fugitive PM10
Exhaust PM10

0.0000 0.0905 0.0905 1.0000e-005
0.0000 0.09098.0000e-005
0.0000 8.0000e-005
2.0000e-005
0.0000 2.0000e-005
Total 2.1000e-004
2.6000e-004
2.1600e-003
0.0000
0.0000 0.0905 0.0905 1.0000e-005
0.0000 0.09098.0000e-005
0.0000 8.0000e-005
2.0000e-005
0.0000 2.0000e-005
Worker 2.1000e-004
2.6000e-004
2.1600e-003
0.0000
0.0000 0.0000 0.0000 0.0000 0.0000 0.00000.0000 0.0000 0.0000 0.0000 0.0000 0.0000Vendor 0.0000 0.0000 0.0000 0.0000
0.0000 0.0000 0.0000 0.0000 0.0000 0.00000.0000 0.0000 0.0000 0.0000 0.0000 0.0000Hauling 0.0000 0.0000 0.0000 0.0000
Total CO2 CH4 N2O CO2e
Category tons/yr MT/yr
PM10 Total
Fugitive PM2.5
Exhaust PM2.5
PM2.5 Total
Bio- CO2 NBio- CO2
Unmitigated Construction Off-Site
ROG NOx CO SO2 Fugitive PM10
Exhaust PM10
0.0000 1.1395 1.1395 3.0000e-004
0.0000 1.14697.5000e-004
1.7400e-003
2.4900e-003
4.1000e-004
1.7400e-003
2.1500e-003
Total 3.6700e-003
0.0219 9.5800e-003
1.3000e-004
0.0000 1.1395 1.1395 3.0000e-004
0.0000 1.14691.7400e-003
1.7400e-003
1.7400e-003
1.7400e-003
Off-Road 3.6700e-003
0.0219 9.5800e-003
1.3000e-004
0.0000 0.0000 0.0000 0.0000 0.0000 0.00007.5000e-004
0.0000 7.5000e-004
4.1000e-004
0.0000 4.1000e-004
Fugitive Dust
Total CO2 CH4 N2O CO2e
Category tons/yr MT/yr
PM10 Total
Fugitive PM2.5
Exhaust PM2.5
PM2.5 Total
Bio- CO2 NBio- CO2
3.4 Grading - 2004Unmitigated Construction On-Site
ROG NOx CO SO2 Fugitive PM10
Exhaust PM10
0.0000 0.0226 0.0226 0.0000 0.0000 0.02272.0000e-005
0.0000 2.0000e-005
1.0000e-005
0.0000 1.0000e-005
Total 5.0000e-005
6.0000e-005
5.4000e-004
0.0000
0.0000 0.0226 0.0226 0.0000 0.0000 0.02272.0000e-005
0.0000 2.0000e-005
1.0000e-005
0.0000 1.0000e-005
Worker 5.0000e-005
6.0000e-005
5.4000e-004
0.0000
0.0000 0.0000 0.0000 0.0000 0.0000 0.00000.0000 0.0000 0.0000 0.0000 0.0000 0.0000Vendor 0.0000 0.0000 0.0000 0.0000
0.0000 0.0000 0.0000 0.0000 0.0000 0.00000.0000 0.0000 0.0000 0.0000 0.0000 0.0000Hauling 0.0000 0.0000 0.0000 0.0000

3.5 Building Construction - 2004Unmitigated Construction On-Site
0.0000 0.0905 0.0905 1.0000e-005
0.0000 0.09098.0000e-005
0.0000 8.0000e-005
2.0000e-005
0.0000 2.0000e-005
Total 2.1000e-004
2.6000e-004
2.1600e-003
0.0000
0.0000 0.0905 0.0905 1.0000e-005
0.0000 0.09098.0000e-005
0.0000 8.0000e-005
2.0000e-005
0.0000 2.0000e-005
Worker 2.1000e-004
2.6000e-004
2.1600e-003
0.0000
0.0000 0.0000 0.0000 0.0000 0.0000 0.00000.0000 0.0000 0.0000 0.0000 0.0000 0.0000Vendor 0.0000 0.0000 0.0000 0.0000
0.0000 0.0000 0.0000 0.0000 0.0000 0.00000.0000 0.0000 0.0000 0.0000 0.0000 0.0000Hauling 0.0000 0.0000 0.0000 0.0000
Total CO2 CH4 N2O CO2e
Category tons/yr MT/yr
PM10 Total
Fugitive PM2.5
Exhaust PM2.5
PM2.5 Total
Bio- CO2 NBio- CO2
Mitigated Construction Off-Site
ROG NOx CO SO2 Fugitive PM10
Exhaust PM10
0.0000 1.1395 1.1395 3.0000e-004
0.0000 1.14697.5000e-004
1.7400e-003
2.4900e-003
4.1000e-004
1.7400e-003
2.1500e-003
Total 3.6700e-003
0.0219 9.5800e-003
1.3000e-004
0.0000 1.1395 1.1395 3.0000e-004
0.0000 1.14691.7400e-003
1.7400e-003
1.7400e-003
1.7400e-003
Off-Road 3.6700e-003
0.0219 9.5800e-003
1.3000e-004
0.0000 0.0000 0.0000 0.0000 0.0000 0.00007.5000e-004
0.0000 7.5000e-004
4.1000e-004
0.0000 4.1000e-004
Fugitive Dust
Total CO2 CH4 N2O CO2e
Category tons/yr MT/yr
PM10 Total
Fugitive PM2.5
Exhaust PM2.5
PM2.5 Total
Bio- CO2 NBio- CO2
Mitigated Construction On-Site
ROG NOx CO SO2 Fugitive PM10
Exhaust PM10

0.0000 60.0009 60.0009 0.0150 0.0000 60.37640.0892 0.0892 0.0892 0.0892Off-Road 0.1846 1.1335 0.4836 6.8700e-003
Total CO2 CH4 N2O CO2e
Category tons/yr MT/yr
PM10 Total
Fugitive PM2.5
Exhaust PM2.5
PM2.5 Total
Bio- CO2 NBio- CO2
Mitigated Construction On-Site
ROG NOx CO SO2 Fugitive PM10
Exhaust PM10
0.0000 7.6608 7.6608 1.1100e-003
0.0000 7.68844.2100e-003
1.9200e-003
6.1200e-003
1.1400e-003
1.8300e-003
2.9700e-003
Total 0.0141 0.0606 0.1227 4.3000e-004
0.0000 3.6215 3.6215 5.6000e-004
0.0000 3.63553.2100e-003
1.3000e-004
3.3400e-003
8.5000e-004
1.2000e-004
9.7000e-004
Worker 8.2800e-003
0.0104 0.0864 6.0000e-005
0.0000 4.0392 4.0392 5.5000e-004
0.0000 4.05301.0000e-003
1.7900e-003
2.7800e-003
2.9000e-004
1.7100e-003
2.0000e-003
Vendor 5.8300e-003
0.0502 0.0363 3.7000e-004
0.0000 0.0000 0.0000 0.0000 0.0000 0.00000.0000 0.0000 0.0000 0.0000 0.0000 0.0000Hauling 0.0000 0.0000 0.0000 0.0000
Total CO2 CH4 N2O CO2e
Category tons/yr MT/yr
PM10 Total
Fugitive PM2.5
Exhaust PM2.5
PM2.5 Total
Bio- CO2 NBio- CO2
Unmitigated Construction Off-Site
ROG NOx CO SO2 Fugitive PM10
Exhaust PM10
0.0000 60.0010 60.0010 0.0150 0.0000 60.37650.0892 0.0892 0.0892 0.0892Total 0.1846 1.1335 0.4836 6.8700e-003
0.0000 60.0010 60.0010 0.0150 0.0000 60.37650.0892 0.0892 0.0892 0.0892Off-Road 0.1846 1.1335 0.4836 6.8700e-003
Total CO2 CH4 N2O CO2e
Category tons/yr MT/yr
PM10 Total
Fugitive PM2.5
Exhaust PM2.5
PM2.5 Total
Bio- CO2 NBio- CO2ROG NOx CO SO2 Fugitive PM10
Exhaust PM10

Unmitigated Construction Off-Site
0.0000 2.7483 2.7483 6.9000e-004
0.0000 2.76543.8600e-003
3.8600e-003
3.8600e-003
3.8600e-003
Total 8.4100e-003
0.0531 0.0232 3.3000e-004
0.0000 0.0000 0.0000 0.0000 0.0000 0.00000.0000 0.0000 0.0000 0.0000Paving 0.0000
0.0000 2.7483 2.7483 6.9000e-004
0.0000 2.76543.8600e-003
3.8600e-003
3.8600e-003
3.8600e-003
Off-Road 8.4100e-003
0.0531 0.0232 3.3000e-004
Total CO2 CH4 N2O CO2e
Category tons/yr MT/yr
PM10 Total
Fugitive PM2.5
Exhaust PM2.5
PM2.5 Total
Bio- CO2 NBio- CO2
3.6 Paving - 2004Unmitigated Construction On-Site
ROG NOx CO SO2 Fugitive PM10
Exhaust PM10
0.0000 7.6608 7.6608 1.1100e-003
0.0000 7.68844.2100e-003
1.9200e-003
6.1200e-003
1.1400e-003
1.8300e-003
2.9700e-003
Total 0.0141 0.0606 0.1227 4.3000e-004
0.0000 3.6215 3.6215 5.6000e-004
0.0000 3.63553.2100e-003
1.3000e-004
3.3400e-003
8.5000e-004
1.2000e-004
9.7000e-004
Worker 8.2800e-003
0.0104 0.0864 6.0000e-005
0.0000 4.0392 4.0392 5.5000e-004
0.0000 4.05301.0000e-003
1.7900e-003
2.7800e-003
2.9000e-004
1.7100e-003
2.0000e-003
Vendor 5.8300e-003
0.0502 0.0363 3.7000e-004
0.0000 0.0000 0.0000 0.0000 0.0000 0.00000.0000 0.0000 0.0000 0.0000 0.0000 0.0000Hauling 0.0000 0.0000 0.0000 0.0000
Total CO2 CH4 N2O CO2e
Category tons/yr MT/yr
PM10 Total
Fugitive PM2.5
Exhaust PM2.5
PM2.5 Total
Bio- CO2 NBio- CO2
Mitigated Construction Off-Site
ROG NOx CO SO2 Fugitive PM10
Exhaust PM10
0.0000 60.0009 60.0009 0.0150 0.0000 60.37640.0892 0.0892 0.0892 0.0892Total 0.1846 1.1335 0.4836 6.8700e-003

Total CO2 CH4 N2O CO2e
Category tons/yr MT/yr
PM10 Total
Fugitive PM2.5
Exhaust PM2.5
PM2.5 Total
Bio- CO2 NBio- CO2
Mitigated Construction Off-Site
ROG NOx CO SO2 Fugitive PM10
Exhaust PM10
0.0000 2.7483 2.7483 6.9000e-004
0.0000 2.76543.8600e-003
3.8600e-003
3.8600e-003
3.8600e-003
Total 8.4100e-003
0.0531 0.0232 3.3000e-004
0.0000 0.0000 0.0000 0.0000 0.0000 0.00000.0000 0.0000 0.0000 0.0000Paving 0.0000
0.0000 2.7483 2.7483 6.9000e-004
0.0000 2.76543.8600e-003
3.8600e-003
3.8600e-003
3.8600e-003
Off-Road 8.4100e-003
0.0531 0.0232 3.3000e-004
Total CO2 CH4 N2O CO2e
Category tons/yr MT/yr
PM10 Total
Fugitive PM2.5
Exhaust PM2.5
PM2.5 Total
Bio- CO2 NBio- CO2
Mitigated Construction On-Site
ROG NOx CO SO2 Fugitive PM10
Exhaust PM10
0.0000 0.4074 0.4074 6.0000e-005
0.0000 0.40903.6000e-004
1.0000e-005
3.8000e-004
1.0000e-004
1.0000e-005
1.1000e-004
Total 9.3000e-004
1.1700e-003
9.7100e-003
1.0000e-005
0.0000 0.4074 0.4074 6.0000e-005
0.0000 0.40903.6000e-004
1.0000e-005
3.8000e-004
1.0000e-004
1.0000e-005
1.1000e-004
Worker 9.3000e-004
1.1700e-003
9.7100e-003
1.0000e-005
0.0000 0.0000 0.0000 0.0000 0.0000 0.00000.0000 0.0000 0.0000 0.0000 0.0000 0.0000Vendor 0.0000 0.0000 0.0000 0.0000
0.0000 0.0000 0.0000 0.0000 0.0000 0.00000.0000 0.0000 0.0000 0.0000 0.0000 0.0000Hauling 0.0000 0.0000 0.0000 0.0000
Total CO2 CH4 N2O CO2e
Category tons/yr MT/yr
PM10 Total
Fugitive PM2.5
Exhaust PM2.5
PM2.5 Total
Bio- CO2 NBio- CO2ROG NOx CO SO2 Fugitive PM10
Exhaust PM10

0.0000 0.0453 0.0453 1.0000e-005
0.0000 0.04544.0000e-005
0.0000 4.0000e-005
1.0000e-005
0.0000 1.0000e-005
Total 1.0000e-004
1.3000e-004
1.0800e-003
0.0000
0.0000 0.0453 0.0453 1.0000e-005
0.0000 0.04544.0000e-005
0.0000 4.0000e-005
1.0000e-005
0.0000 1.0000e-005
Worker 1.0000e-004
1.3000e-004
1.0800e-003
0.0000
0.0000 0.0000 0.0000 0.0000 0.0000 0.00000.0000 0.0000 0.0000 0.0000 0.0000 0.0000Vendor 0.0000 0.0000 0.0000 0.0000
0.0000 0.0000 0.0000 0.0000 0.0000 0.00000.0000 0.0000 0.0000 0.0000 0.0000 0.0000Hauling 0.0000 0.0000 0.0000 0.0000
Total CO2 CH4 N2O CO2e
Category tons/yr MT/yr
PM10 Total
Fugitive PM2.5
Exhaust PM2.5
PM2.5 Total
Bio- CO2 NBio- CO2
Unmitigated Construction Off-Site
ROG NOx CO SO2 Fugitive PM10
Exhaust PM10
0.0000 0.6383 0.6383 1.8000e-004
0.0000 0.64281.0300e-003
1.0300e-003
1.0300e-003
1.0300e-003
Total 0.2325 0.0127 5.6300e-003
7.0000e-005
0.0000 0.6383 0.6383 1.8000e-004
0.0000 0.64281.0300e-003
1.0300e-003
1.0300e-003
1.0300e-003
Off-Road 2.1900e-003
0.0127 5.6300e-003
7.0000e-005
0.0000 0.0000 0.0000 0.0000 0.0000 0.00000.0000 0.0000 0.0000 0.0000Archit. Coating 0.2303
Total CO2 CH4 N2O CO2e
Category tons/yr MT/yr
PM10 Total
Fugitive PM2.5
Exhaust PM2.5
PM2.5 Total
Bio- CO2 NBio- CO2
3.7 Architectural Coating - 2004Unmitigated Construction On-Site
ROG NOx CO SO2 Fugitive PM10
Exhaust PM10
0.0000 0.4074 0.4074 6.0000e-005
0.0000 0.40903.6000e-004
1.0000e-005
3.8000e-004
1.0000e-004
1.0000e-005
1.1000e-004
Total 9.3000e-004
1.1700e-003
9.7100e-003
1.0000e-005
0.0000 0.4074 0.4074 6.0000e-005
0.0000 0.40903.6000e-004
1.0000e-005
3.8000e-004
1.0000e-004
1.0000e-005
1.1000e-004
Worker 9.3000e-004
1.1700e-003
9.7100e-003
1.0000e-005
0.0000 0.0000 0.0000 0.0000 0.0000 0.00000.0000 0.0000 0.0000 0.0000 0.0000 0.0000Vendor 0.0000 0.0000 0.0000 0.0000
0.0000 0.0000 0.0000 0.0000 0.0000 0.00000.0000 0.0000 0.0000 0.0000 0.0000 0.0000Hauling 0.0000 0.0000 0.0000 0.0000

4.0 Operational Detail - Mobile
4.1 Mitigation Measures Mobile
0.0000 0.0453 0.0453 1.0000e-005
0.0000 0.04544.0000e-005
0.0000 4.0000e-005
1.0000e-005
0.0000 1.0000e-005
Total 1.0000e-004
1.3000e-004
1.0800e-003
0.0000
0.0000 0.0453 0.0453 1.0000e-005
0.0000 0.04544.0000e-005
0.0000 4.0000e-005
1.0000e-005
0.0000 1.0000e-005
Worker 1.0000e-004
1.3000e-004
1.0800e-003
0.0000
0.0000 0.0000 0.0000 0.0000 0.0000 0.00000.0000 0.0000 0.0000 0.0000 0.0000 0.0000Vendor 0.0000 0.0000 0.0000 0.0000
0.0000 0.0000 0.0000 0.0000 0.0000 0.00000.0000 0.0000 0.0000 0.0000 0.0000 0.0000Hauling 0.0000 0.0000 0.0000 0.0000
Total CO2 CH4 N2O CO2e
Category tons/yr MT/yr
PM10 Total
Fugitive PM2.5
Exhaust PM2.5
PM2.5 Total
Bio- CO2 NBio- CO2
Mitigated Construction Off-Site
ROG NOx CO SO2 Fugitive PM10
Exhaust PM10
0.0000 0.6383 0.6383 1.8000e-004
0.0000 0.64281.0300e-003
1.0300e-003
1.0300e-003
1.0300e-003
Total 0.2325 0.0127 5.6300e-003
7.0000e-005
0.0000 0.6383 0.6383 1.8000e-004
0.0000 0.64281.0300e-003
1.0300e-003
1.0300e-003
1.0300e-003
Off-Road 2.1900e-003
0.0127 5.6300e-003
7.0000e-005
0.0000 0.0000 0.0000 0.0000 0.0000 0.00000.0000 0.0000 0.0000 0.0000Archit. Coating 0.2303
Total CO2 CH4 N2O CO2e
Category tons/yr MT/yr
PM10 Total
Fugitive PM2.5
Exhaust PM2.5
PM2.5 Total
Bio- CO2 NBio- CO2
Mitigated Construction On-Site
ROG NOx CO SO2 Fugitive PM10
Exhaust PM10

0.000773 0.002884
5.0 Energy Detail
Historical Energy Use: Y
0.005459 0.014026 0.019971 0.001578 0.001508 0.005510University/College (4Yr) 0.496962 0.074792 0.199148 0.142251 0.035136
0.019971 0.001578 0.001508 0.005510 0.000773 0.002884
SBUS MH
Junior College (2Yr) 0.496962 0.074792 0.199148 0.142251 0.035136 0.005459 0.014026
LHD2 MHD HHD OBUS UBUS MCYLand Use LDA LDT1 LDT2 MDV LHD1
88.60 5.00 91 9 0
4.4 Fleet Mix
88.60 5.00 92 7 1
University/College (4Yr) 9.50 7.30 7.30 6.40
H-S or C-C H-O or C-NW Primary Diverted Pass-by
Junior College (2Yr) 9.50 7.30 7.30 6.40
4.3 Trip Type Information
Miles Trip % Trip Purpose %
Land Use H-W or C-W H-S or C-C H-O or C-NW H-W or C-W
Total 294.90 166.18 7.26 596,371 596,371University/College (4Yr) 129.96 98.80 0.00 270,098 270,098
Annual VMT
Junior College (2Yr) 164.94 67.38 7.26 326,272 326,272
4.2 Trip Summary Information
Average Daily Trip Rate Unmitigated MitigatedLand Use Weekday Saturday Sunday Annual VMT
0.0000 305.4813 305.4813 0.0350 0.0000 306.35620.2251 0.0199 0.2449 0.0603 0.0189 0.0792Unmitigated 0.2736 0.9369 3.3866 7.4300e-003
0.0000 305.4813 305.4813 0.0350 0.0000 306.35620.2251 0.0199 0.2449 0.0603 0.0189 0.0792Mitigated 0.2736 0.9369 3.3866 7.4300e-003
NBio- CO2 Total CO2 CH4 N2O CO2e
Category tons/yr MT/yr
Exhaust PM10
PM10 Total
Fugitive PM2.5
Exhaust PM2.5
PM2.5 Total
Bio- CO2ROG NOx CO SO2 Fugitive PM10

44.0047
Mitigated
3.0600e-003
0.0000 43.7447 43.7447 8.4000e-004
8.0000e-004
2.4000e-004
3.0600e-003
3.0600e-003
3.0600e-003
30.7485 5.9000e-004
5.6000e-004
30.9312
Total 4.4200e-003
0.0402 0.0338
2.1500e-003
2.1500e-003
2.1500e-003
0.0000 30.7485
13.0735
University/College (4Yr)
576205 3.1100e-003
0.0283 0.0237 1.7000e-004
2.1500e-003
9.1000e-004
0.0000 12.9962 12.9962 2.5000e-004
2.4000e-004
7.0000e-005
9.1000e-004
9.1000e-004
9.1000e-004
Junior College (2Yr)
243540 1.3100e-003
0.0119 0.0100
NBio- CO2 Total CO2 CH4 N2O CO2e
Land Use kBTU/yr tons/yr MT/yr
Exhaust PM10
PM10 Total
Fugitive PM2.5
Exhaust PM2.5
PM2.5 Total
Bio- CO2
5.2 Energy by Land Use - NaturalGasUnmitigated
NaturalGas Use
ROG NOx CO SO2 Fugitive PM10
0.0000 43.7447 43.7447 8.4000e-004
8.0000e-004
44.00473.0500e-003
3.0500e-003
3.0500e-003
3.0500e-003
NaturalGas Unmitigated
4.4200e-003
0.0402 0.0338 2.4000e-004
0.0000 43.7447 43.7447 8.4000e-004
8.0000e-004
44.00473.0500e-003
3.0500e-003
3.0500e-003
3.0500e-003
NaturalGas Mitigated
4.4200e-003
0.0402 0.0338 2.4000e-004
0.0000 69.9462 69.9462 2.8200e-003
5.8000e-004
70.19020.0000 0.0000 0.0000 0.0000Electricity Unmitigated
0.0000 69.9462 69.9462 2.8200e-003
5.8000e-004
70.19020.0000 0.0000 0.0000 0.0000
CO2e
Category tons/yr MT/yr
Electricity Mitigated
PM2.5 Total
Bio- CO2 NBio- CO2 Total CO2 CH4 N2OSO2 Fugitive PM10
Exhaust PM10
PM10 Total
Fugitive PM2.5
Exhaust PM2.5
5.1 Mitigation Measures Energy
ROG NOx CO

20.8530
University/College (4Yr)
150442 49.1657 1.9800e-003
4.1000e-004
49.3372
Land Use kWh/yr ton
MT/yr
Junior College (2Yr)
63586.1 20.7805 8.4000e-004
1.7000e-004
70.1902
Mitigated
Electricity Use
Total CO2 CH4 N2O CO2e
Total 69.9462 2.8200e-003
5.8000e-004
20.8530
University/College (4Yr)
150442 49.1657 1.9800e-003
4.1000e-004
49.3372
Land Use kWh/yr ton
MT/yr
Junior College (2Yr)
63586.1 20.7805 8.4000e-004
1.7000e-004
44.0047
5.3 Energy by Land Use - ElectricityUnmitigated
Electricity Use
Total CO2 CH4 N2O CO2e
3.0600e-003
0.0000 43.7447 43.7447 8.4000e-004
8.0000e-004
2.4000e-004
3.0600e-003
3.0600e-003
3.0600e-003
30.7485 5.9000e-004
5.6000e-004
30.9312
Total 4.4200e-003
0.0402 0.0338
2.1500e-003
2.1500e-003
2.1500e-003
0.0000 30.7485
13.0735
University/College (4Yr)
576205 3.1100e-003
0.0283 0.0237 1.7000e-004
2.1500e-003
9.1000e-004
0.0000 12.9962 12.9962 2.5000e-004
2.4000e-004
7.0000e-005
9.1000e-004
9.1000e-004
9.1000e-004
Land Use kBTU/yr tons/yr MT/yr
Junior College (2Yr)
243540 1.3100e-003
0.0119 0.0100
Bio- CO2 NBio- CO2 Total CO2 CH4 N2O CO2eFugitive PM10
Exhaust PM10
PM10 Total
Fugitive PM2.5
Exhaust PM2.5
PM2.5 Total
NaturalGas Use
ROG NOx CO SO2

0.0000 1.4700e-003
1.4700e-003
1.0000e-005
0.0000 1.6400e-003
0.0000 0.0000 0.0000 0.0000Total 0.1008 1.0000e-005
9.6000e-004
0.0000
0.0000 1.4700e-003
1.4700e-003
1.0000e-005
0.0000 1.6400e-003
0.0000 0.0000 0.0000 0.0000Landscaping 1.2000e-004
1.0000e-005
9.6000e-004
0.0000
0.0000 0.0000 0.0000 0.0000 0.0000 0.00000.0000 0.0000 0.0000 0.0000Consumer Products
0.0776
0.0000 0.0000 0.0000 0.0000 0.0000 0.00000.0000 0.0000 0.0000 0.0000Architectural Coating
0.0230
Total CO2 CH4 N2O CO2e
SubCategory tons/yr MT/yr
PM10 Total
Fugitive PM2.5
Exhaust PM2.5
PM2.5 Total
Bio- CO2 NBio- CO2
6.2 Area by SubCategoryUnmitigated
ROG NOx CO SO2 Fugitive PM10
Exhaust PM10
0.0000 1.4700e-003
1.4700e-003
1.0000e-005
0.0000 1.6400e-003
0.0000 0.0000 0.0000 0.0000Unmitigated 0.1008 1.0000e-005
9.6000e-004
0.0000
0.0000 1.4700e-003
1.4700e-003
1.0000e-005
0.0000 1.6400e-003
0.0000 0.0000 0.0000 0.0000Mitigated 0.1008 1.0000e-005
9.6000e-004
0.0000
NBio- CO2 Total CO2 CH4 N2O CO2e
Category tons/yr MT/yr
Exhaust PM10
PM10 Total
Fugitive PM2.5
Exhaust PM2.5
PM2.5 Total
Bio- CO2
70.1902
6.0 Area Detail
6.1 Mitigation Measures Area
ROG NOx CO SO2 Fugitive PM10
Total 69.9462 2.8200e-003
5.8000e-004

7.2 Water by Land UseUnmitigated
Unmitigated 4.6852 0.0151 3.9000e-004
5.1781
Category ton
MT/yr
Mitigated 4.6852 0.0151 3.9000e-004
5.1781
7.0 Water Detail
7.1 Mitigation Measures Water
Total CO2 CH4 N2O CO2e
0.0000 1.4700e-003
1.4700e-003
1.0000e-005
0.0000 1.6400e-003
0.0000 0.0000 0.0000 0.0000Total 0.1008 1.0000e-005
9.6000e-004
0.0000
0.0000 1.4700e-003
1.4700e-003
1.0000e-005
0.0000 1.6400e-003
0.0000 0.0000 0.0000 0.0000Landscaping 1.2000e-004
1.0000e-005
9.6000e-004
0.0000
0.0000 0.0000 0.0000 0.0000 0.0000 0.00000.0000 0.0000 0.0000 0.0000Consumer Products
0.0776
0.0000 0.0000 0.0000 0.0000 0.0000 0.00000.0000 0.0000 0.0000 0.0000Architectural Coating
0.0230
Total CO2 CH4 N2O CO2e
SubCategory tons/yr MT/yr
PM10 Total
Fugitive PM2.5
Exhaust PM2.5
PM2.5 Total
Bio- CO2 NBio- CO2
Mitigated
ROG NOx CO SO2 Fugitive PM10
Exhaust PM10

5.1781
8.0 Waste Detail
8.1 Mitigation Measures Waste
Category/Year
Total 4.6852 0.0151 3.9000e-004
3.3344
University/College (4Yr)
0.162724 / 0.254516
1.6682 5.3700e-003
1.4000e-004
1.8437
Land Use Mgal ton
MT/yr
Junior College (2Yr)
0.294294 / 0.460306
3.0170 9.7100e-003
2.5000e-004
5.1781
Mitigated
Indoor/Outdoor Use
Total CO2 CH4 N2O CO2e
Total 4.6852 0.0151 3.9000e-004
3.3344
University/College (4Yr)
0.162724 / 0.254516
1.6682 5.3700e-003
1.4000e-004
1.8437
Land Use Mgal ton
MT/yr
Junior College (2Yr)
0.294294 / 0.460306
3.0170 9.7100e-003
2.5000e-004
Indoor/Outdoor Use
Total CO2 CH4 N2O CO2e

3.9226
University/College (4Yr)
13.87 2.8155 0.1664 0.0000 6.9752
Land Use tons ton
MT/yr
Junior College (2Yr)
7.8 1.5833 0.0936 0.0000
10.8979
Mitigated
Waste Disposed
Total CO2 CH4 N2O CO2e
Total 4.3988 0.2600 0.0000
3.9226
University/College (4Yr)
13.87 2.8155 0.1664 0.0000 6.9752
Land Use tons ton
MT/yr
Junior College (2Yr)
7.8 1.5833 0.0936 0.0000
8.2 Waste by Land UseUnmitigated
Waste Disposed
Total CO2 CH4 N2O CO2e
Unmitigated 4.3988 0.2600 0.0000 10.8979
ton
MT/yr
Mitigated 4.3988 0.2600 0.0000 10.8979
Total CO2 CH4 N2O CO2e

User Defined Equipment
Equipment Type Number
11.0 Vegetation
Load Factor Fuel Type
Boilers
Equipment Type Number Heat Input/Day Heat Input/Year Boiler Rating Fuel Type
Horse Power Load Factor Fuel Type
10.0 Stationary Equipment
Fire Pumps and Emergency Generators
Equipment Type Number Hours/Day Hours/Year Horse Power
10.8979
9.0 Operational Offroad
Equipment Type Number Hours/Day Days/Year
Total 4.3988 0.2600 0.0000