Embed Size (px)
Citation preview

Maria Norberta de Pinho
Instituto Superior Técnico/ICEMS
11th of March 2014
Membrane Processes for a Sustainable
Development
Objectives for the Development
of Sustainable Processes
More efficient and selective production with:
- reduction of raw materials, water, subsidiary
materials, and energy consumption
- treatment/recycling of process streams as process
water/solvent(s)/surplus raw materials
- treated wastewater reuse preventing degradation
of receiving water bodies and the environment
Potencial reuse/valorization of new products

The Role of Membrane Technology for the
Development of Sustainable Processes
Confinement of raw materials/polutents/secondary products inconcentrated fluxes envisaging their reuse/treatment/valorization
Integration of fractionation technologies with advanced treatmenttechnologies
Treatment of prioritary pollutants through fraccionation/destructiveprocesses sequences
Recovery of process water and organic solvents

Membrane
Ultrafiltration (UF)
Nanofiltration (NF)
Reverse Osmosis (RO)
Pure water
Monovalent salts
Small organic solutes
Divalent salts
Dissociated acids
Macromolecules
Microfiltration (MF)
Particles
Pressure Driven Membrane Processes

Case Studies
Dairy Industry
Coke Plant Waste Waters
Cork Processing Waste Waters

Dairy Industry
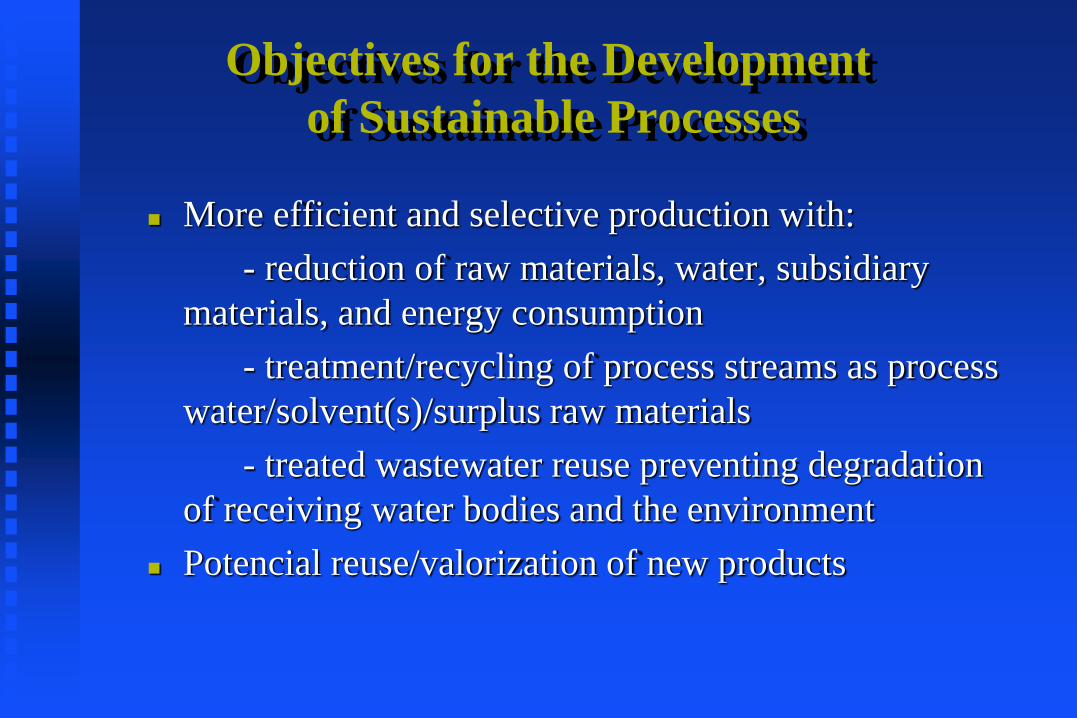
“Serpa” cheese by-products
Cheese whey (CW) from cheese production
Currently used ONLY in curd cheese production
Second cheese whey (SCW) from curd production
Currently WITHOUT further processing
Problem 1: low valorisation of an extremely rich product
Problem 2: Disposal of a strongly pollutant effluent and loss of
another valuable product
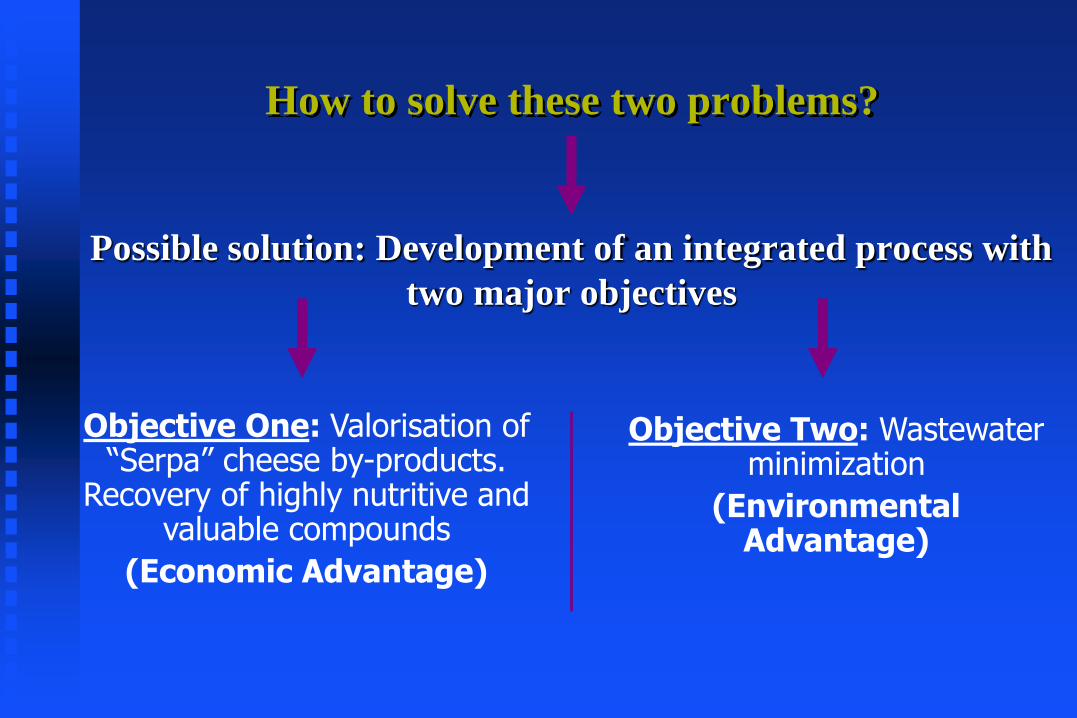
How to solve these two problems?
Possible solution: Development of an integrated process with
two major objectives
Objective One: Valorisation of “Serpa” cheese by-products.
Recovery of highly nutritive and valuable compounds
(Economic Advantage)
Objective Two: Wastewater minimization
(Environmental Advantage)

Proposed integrated process for by-products valorisation
and wastewater minimization
1 2 3UF
Product
3
4 5 6NF
Fines
CW (from
cheese
production)
SCW (from curd
production)
CW
without fines
SCW
without fines
Defatted SCW
Defatted
CW
Water, lactose,
salts and free
amino acids (a. a.)
Water, salts
(depurated
wastewater for
reuse, ex: CIP)
Legend:
1 & 4 – Removal of fines by filtration.
2 & 5 – Removal of fat by centrifugation.
3 & 6 – Ultrafiltration (3) and Nanofiltration (6)
Product1 – Protein concentrate.
Product 2 – Lactose concentrate, free a. a. and some
bivalent salts.Product 3 – Fat for butter production.
Product
1
Product
2

Fractionation of a feed stream (CW) containing
water, proteins, amino acids (a.a.), lactose and
salts
Production of a concentrate stream enriched in
proteins.
Production of a permeate stream enriched in
lactose, a.a., salts.
Objective of the Ultrafiltration unit operation:

Objective of the Nanofiltration unit operation:
Fractionation of a feed stream (SCW) containing essentially water, lactose and salts; but also some residual
proteins and amino acids (a.a.)
Production of a concentrate stream rich in organic matter.
Production of a permeate stream enriched in salts with low organic matter concentration.

Ultrafiltration (UF) & Nanofiltration (NF)
Important quantitative factors:
Permeation flux, Jp (related with process time)
Rejection coefficient, f (related with membrane selectivity)
f = (wA0 – wAp)/wA0
Pressure driven membrane separation process
Feed
wA0
Permeate
wAp
Concentrate

Nanofiltration

Experimental
Permeation experiments
Total Recirculation Mode
(for membrane selection and determination of best operating
pressure)
Concentration Mode
(with selected membrane and selected pressure)

Experimental
NF unit
Lab. Unit M20 from DSS A/S, Denmark
In all permation experiments: circulation flow rate = 9.2 L/min; T = 25ºC.
Second cheese whey characterisation
pH 6.2
Specific conductivity 23.3 mS/cm
Total Organic Carbon (TOC) 31.2 g C/l
Lactose 50.6 g/l
Total nitrogen by Kejdahl method 1.74 g N/l
Proteins and Free amino acids 8.3 g/l

Experimental
Characteristics of tested membranes
Membrane: HR-95-PP NFT50
Material Thin film composite on polypropylene
Thin film composite on polyester
PWP (kg H2O /m2 / hr/ bar) 3.0 6.5
Rejections (f) to reference solutes, % (Pressure=10 bar; T=25ºC) NaCl 97.3 69.0 Na2SO4 99.1 99.0 Glucose 98.5 94.5 Sacharose 98.6 98.5
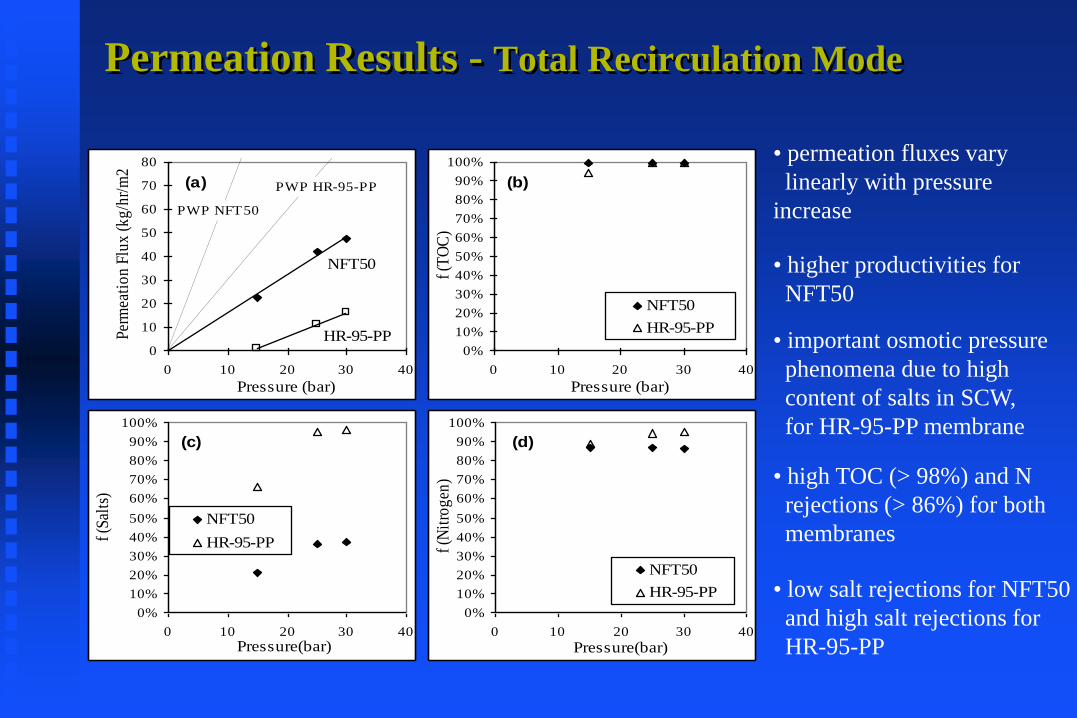
Permeation Results - Total Recirculation Mode
0
10
20
30
40
50
60
70
80
0 10 20 30 40
Pressure (bar)
Per
mea
tio
n F
lux
(k
g/h
r/m
2)
0%
10%
20%
30%
40%
50%
60%
70%
80%
90%
100%
0 10 20 30 40
Pressure (bar)
f (T
OC
)
NFT50
HR-95-PP
0%
10%
20%
30%
40%
50%
60%
70%
80%
90%
100%
0 10 20 30 40
Pressure(bar)
f (S
alts
)
NFT50
HR-95-PP
0%
10%
20%
30%
40%
50%
60%
70%
80%
90%
100%
0 10 20 30 40
Pressure(bar)
f (N
itro
gen
)
NFT50
HR-95-PP
(b)(a)
(c) (d)
HR-95-PP
NFT50
PWP NFT50
PWP HR-95-PP
• important osmotic pressure
phenomena due to high
content of salts in SCW,
for HR-95-PP membrane
• high TOC (> 98%) and N
rejections (> 86%) for both
membranes
• low salt rejections for NFT50
and high salt rejections for
HR-95-PP
• higher productivities for
NFT50
• permeation fluxes vary
linearly with pressure
increase

Permeation Results - Total Recirculation Mode
0
10
20
30
40
50
60
70
80
0 10 20 30 40
Pressure (bar)
Per
mea
tio
n F
lux
(k
g/h
r/m
2)
0%
10%
20%
30%
40%
50%
60%
70%
80%
90%
100%
0 10 20 30 40
Pressure (bar)f
(TO
C)
NFT50
HR-95-PP
0%
10%
20%
30%
40%
50%
60%
70%
80%
90%
100%
0 10 20 30 40
Pressure(bar)
f (S
alts
)
NFT50
HR-95-PP
0%
10%
20%
30%
40%
50%
60%
70%
80%
90%
100%
0 10 20 30 40
Pressure(bar)
f (N
itro
gen
)
NFT50
HR-95-PP
(b)(a)
(c) (d)
HR-95-PP
NFT50
PWP NFT50
PWP HR-95-PPCONCLUSION
only NFT50 allows the feed
stream fractionation !
Selected membrane:
NFT50
Selected pressure:
Higher tested pressure
(30 bar)

Permeation Results - Concentration Mode
• Membrane: NFT50
Pressure: 30 bar
0
10
20
30
40
50
60
0 20 40 60 80 100
RR (%)
Per
mea
te F
lux
(k
g/h
r/m
2)
(a)
0%
20%
40%
60%
80%
100%
0 20 40 60 80 100
RR (%)
f (T
OC
)
(b)
0%
20%
40%
60%
80%
100%
0 20 40 60 80 100
RR (%)
f (N
itro
gen
)
(d)
0%
20%
40%
60%
80%
100%
0 20 40 60 80 100
RR (%)
f (S
alts
)
(c)
• Recovery Rate (RR) =
(Total permeate volume) /
Initial Feed volume) x 100%
•When RR :
f (TOC) and f (N) ~ constant
f (Salts) and flux
When the RR , the organic
matter / salts fractionation is
improved but the process
productivity falls

Permeation Results - Concentration Mode
TOC and Total Nitrogen concentrations in the concentrate
RR (% of water recovered)
TOC (g C/l) Total Nitrogen (g N/l)
Initial: 0 29.06 1.46 34.0 46.21 2.16 50.5 63.24 2.86 67.2 96.67 4.14 73.5 122.8 5.38 Final: 77.8 140.1 7.73

Conclusions - Total Recirculation
• The NFT50 membrane showed in a preliminary set of permeation experiments, the best results in terms of SCW fractionation and productivity.
• Optimal operation conditions: P of 30 bar, T of 25ºCand feed circulation flow rate of 9.2 l/min.

Conclusions – Concentration Mode
• The final concentrate stream is a lactose-enrichedsolution with a lactose conc. approx. 5 times higherthan the initial value Raw material forpharmaceutical, food or paper industries.
• SCW fractionation into a salt depleted lactoseconcentrate and a salt enriched permeate almost freefrom organic matter.
• The salt enriched permeate can be reused in the processor more easily disposed.

Fractionation of cheese whey/second cheese whey by Ultrafiltration, Nanofiltration and Reverse Osmosis leading to:
Recovery of products - protein concentrate, lactose and aminoacids, fat for butter production
Reuse of process water
Reduction of waste waters discharged
Conclusions
Coke Plant Waste Waters

The strategy for the treatment of ammoniacal wastewaters contaminatedwith priority pollutants:
• Ammoniacal wastewaters complex mixture fractionation (ammonia,phenols and cyanides) and confinement of the highly trace pollutantcompounds in separate streams for:
Application of specific treatments for the proprietary pollutantsconfined in the separated streams
Reduction of wastewater flow rate fed into the steam strippingcolumn
Treatment Strategy
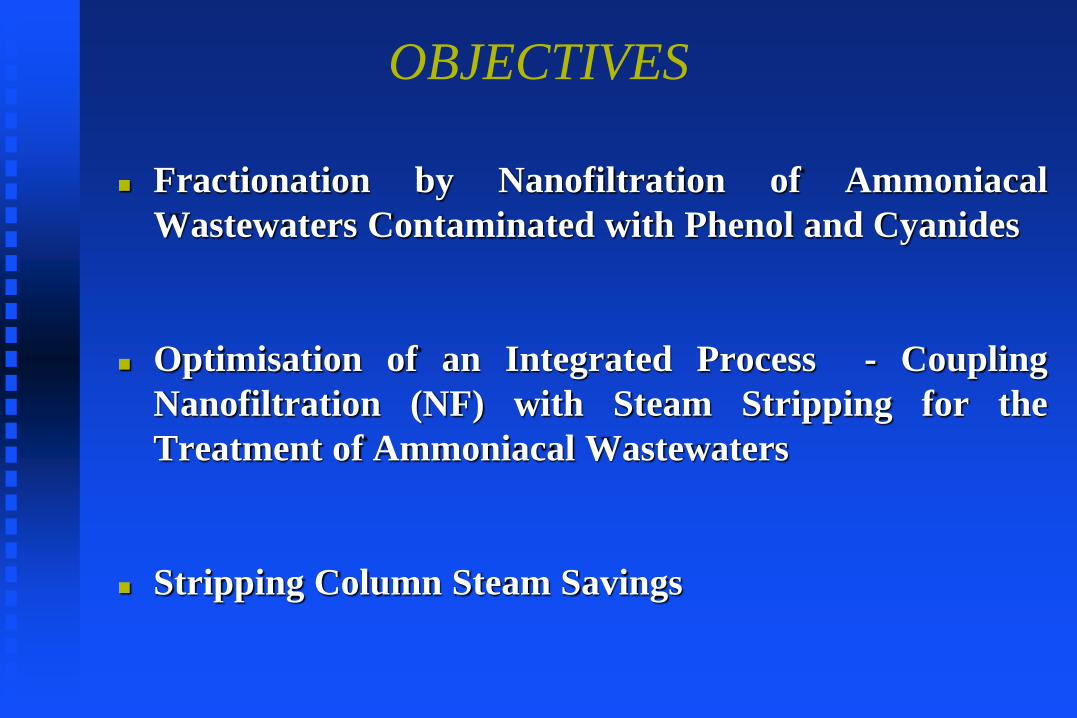
OBJECTIVES
Fractionation by Nanofiltration of Ammoniacal
Wastewaters Contaminated with Phenol and Cyanides
Optimisation of an Integrated Process - Coupling
Nanofiltration (NF) with Steam Stripping for the
Treatment of Ammoniacal Wastewaters
Stripping Column Steam Savings

Integrated Process
NF
Destructive
Process
Cyanides
Phenols
Ammoniacal
Wastewaters
NH3
Stripping
Column
Destructive
Process
NH3, CN-
Phenols
Stripping
Column
Ammoniacal
Wastewaters
NH4+: 7.1-8.7 g/l
CN-: 75 – 276 mg/l
Phenols: 85-185 mg/l
Qcirc: 16 m3/h
NH4+: 0.004 -1.3 g/l
CN-: 7.4 – 9.6 mg/l
Phenols: 13-148 mg/l
Qcirc: 17.9 m3/h
Present Treatment Process Novel Treatment Process
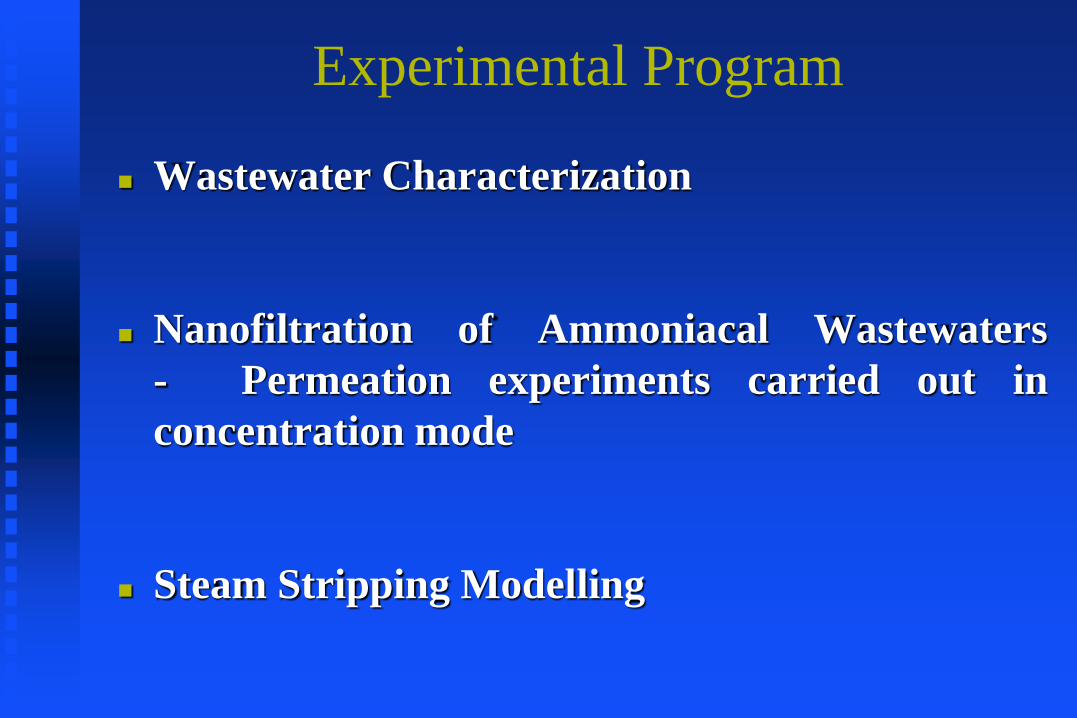
Experimental Program
Wastewater Characterization
Nanofiltration of Ammoniacal Wastewaters
- Permeation experiments carried out in
concentration mode
Steam Stripping Modelling
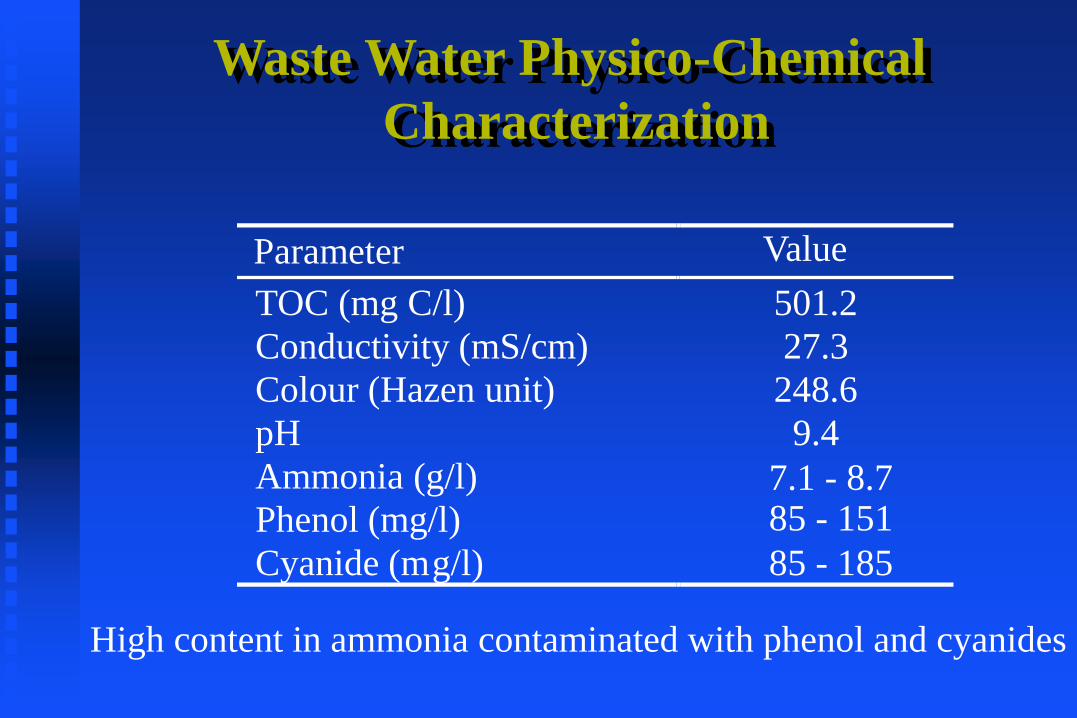
Waste Water Physico-Chemical
Characterization
Parameter Value
TOC (mg C/l) 501.2
Conductivity (mS/cm) 27.3
Colour (Hazen unit) 248.6
pH 9.4
Ammonia (g/l) 7.1 - 8.7Phenol (mg/l) 85 - 151
Cyanide (mg/l) 85 - 185
High content in ammonia contaminated with phenol and cyanides

Nanofiltration Set-Up
Nanofiltration Membranes:
HR-98-PP (DSS)
Membrane Characterisation:
Hydraulic Permeability (Lp): Lp=2.99 kg/h/m2/bar
Solute rejections:
NaCl – 98%
Na2SO4 – 99.9% (Conc.= 0.002 M ,T= 25ºC, P= 30 bar, Qcirc.= 9.2 l/min.)
Lab Unit M20 (DSS)

Operating Conditions:
Membrane Surface Area (Am): 0.144 m2
Temperature (T): 25ºC
Pressure (P): 30 bar
Feed Circulation Flowrate (Qcirc.): 9.2 l/min
Water Recovery Rate (RR):
Rejection Coefficient (f):
Nanofiltration Set-Up
RRvolume of permeate
initial feed volume 100
feed
permeatefeed
C
CCf
NF
Permeate
Cpermeate
Concentrate
Feed Tank
Cfeed
Pump

Nanofiltration Permeation
Results

Variation of Permeate Flux with Water
Recovery Rate (RR)Operating conditions:T = 25ºC, P = 30 bar, Qcirc = 9.2 l/min
0
4
8
12
16
20
0 10 20 30 40 50 60
RR (%)
Per
mea
te F
lux (
kg/h
/m2)
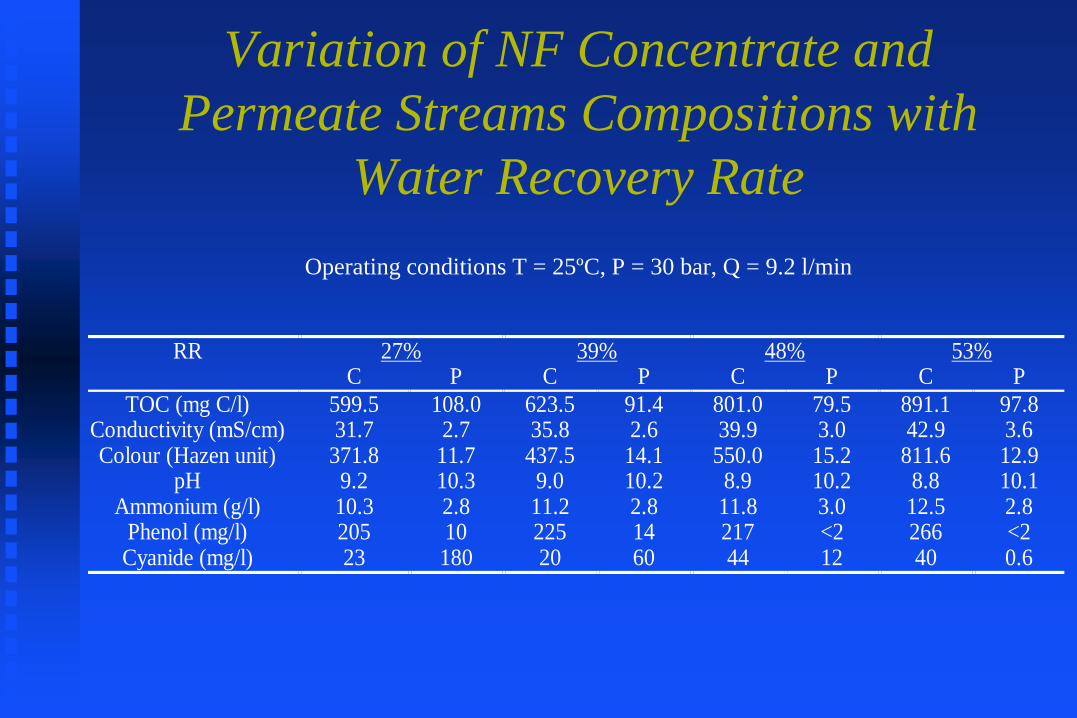
Variation of NF Concentrate and
Permeate Streams Compositions with
Water Recovery Rate
Operating conditions T = 25ºC, P = 30 bar, Q = 9.2 l/min
RR 27% 39% 48% 53% C P C P C P C P
TOC (mg C/l) 599.5 108.0 623.5 91.4 801.0 79.5 891.1 97.8 Conductivity (mS/cm) 31.7 2.7 35.8 2.6 39.9 3.0 42.9 3.6 Colour (Hazen unit) 371.8 11.7 437.5 14.1 550.0 15.2 811.6 12.9
pH 9.2 10.3 9.0 10.2 8.9 10.2 8.8 10.1 Ammonium (g/l) 10.3 2.8 11.2 2.8 11.8 3.0 12.5 2.8
Phenol (mg/l) 205 10 225 14 217 <2 266 <2 Cyanide (mg/l) 23 180 20 60 44 12 40 0.6

• The cyanides maximal
removal occurs at
RR=40%
• Optimal fractionation of
ammonia-phenol/cyanides
at RR>40%
0
2
4
6
8
10
12
14
0% 10% 20% 30% 40% 50% 60%
TR
Co
nc.
(g
/l):
Am
ón
ia
0
50
100
150
200
250
300
350
400
Co
nc. (m
g/l): F
en
ol, C
ian
eto
RR
Am
mo
nia
Ph
eno
l, Cy
an
ides
Variation of the different components concentration
(ammonia, phenol and cyanides) with RR
Operating Conditions: T = 25ºC, P = 30 bar, Qcirc = 9.2 l/min

Variation of Rejection Coefficients with
Water Recovery Rate (RR)Operating conditions: T = 25ºC, P = 30 bar, Qcirc. = 9.2 l/min
Optimal Recovery Rate: RR = 39%
RR (%) f NH4+ f Phenol f CN-
27 73% 95% Negative (enrichement in the permeate 6.8 x)
39 75% 94%
48 75% 100% 73%
53 77% 100% 99%
Negative (enrichement in the permeate 2 x)
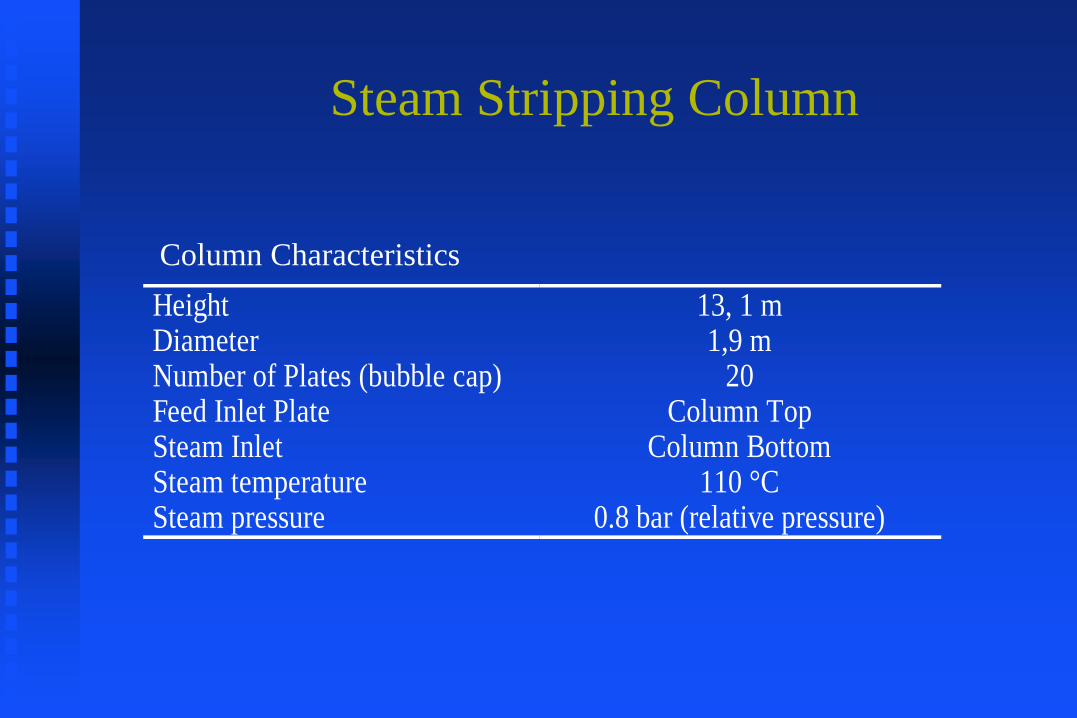
Steam Stripping Column
Column Characteristics
Height 13, 1 m Diameter 1,9 m Number of Plates (bubble cap) 20 Feed Inlet Plate Column Top Steam Inlet Column Bottom Steam temperature 110 °C Steam pressure 0.8 bar (relative pressure)

Steam Stripping Column
• Simulation using ASPEN
• Good agreement between experimental and calculated values
Feed stream Bottom Stream Bottom Stream (simulation) (experimental)
Flow rate (m³/h) 8.3 9.8 - Temperature 24 °C 99.6°C 87 °C PH 9.7 - 9.16 NH3 (mg/l) 14 500 135.7 130 CN- (mg/l) 320 14.9 15.3 Phenol (mg/l) 17.6 14.2 13.1 Steam (kg/h) 1600 - -

Integrated Process NF/Steam Stripping
NF: RR=40%, Pressure=30 bar, T=25ºC, Qcirc.=9.2 l/min
Ammoniacal
Wastewater
NH3
RR= 40%
Stripping Column
40% Steam Savings
Destructive
Process Destructive
Process
Cyanides
Phenols
NF
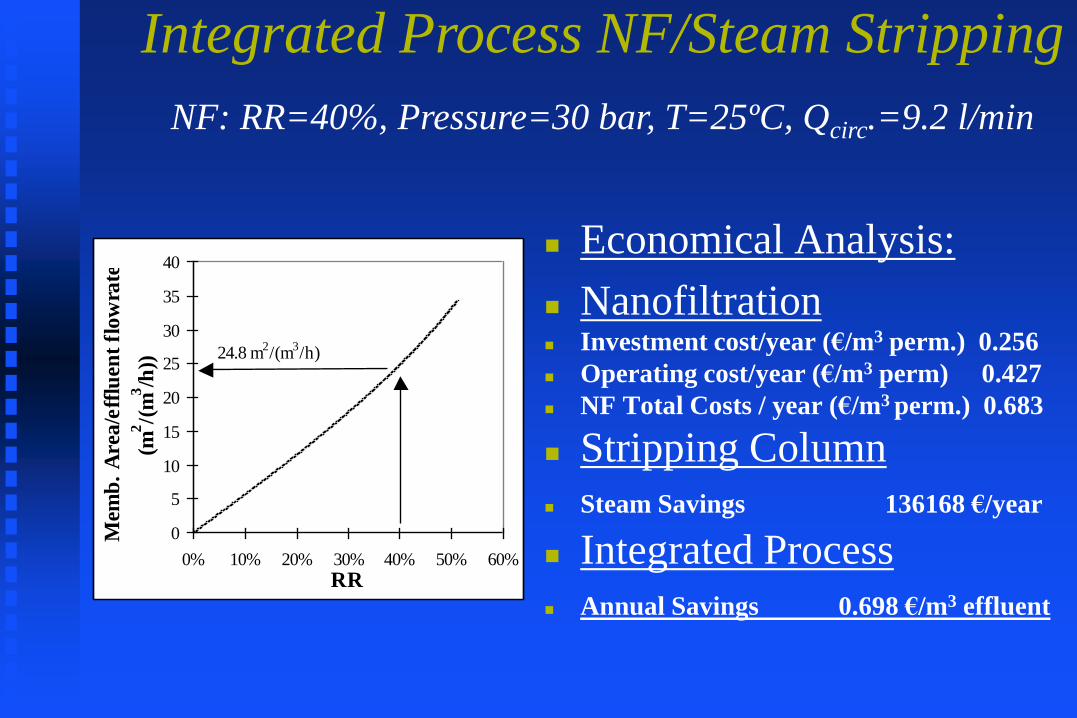
Economical Analysis:
Nanofiltration Investment cost/year (€/m3 perm.) 0.256
Operating cost/year (€/m3 perm) 0.427
NF Total Costs / year (€/m3 perm.) 0.683
Stripping Column
Steam Savings 136168 €/year
Integrated Process
Annual Savings 0.698 €/m3 effluent
Integrated Process NF/Steam Stripping
NF: RR=40%, Pressure=30 bar, T=25ºC, Qcirc.=9.2 l/min
0
5
10
15
20
25
30
35
40
0% 10% 20% 30% 40% 50% 60%
RR
Mem
b.
Are
a/e
fflu
ent
flo
wra
te
(m2/(
m3/h
))
24.8 m2/(m
3/h)

CONCLUSIONS
The ammonium/cyanide fractionation is optimal forthe nanofiltration water recovery rate of 40%
Maximal cyanide depletion from ammoniumconcentrate stream is achieved at a RR of 40%. Theconfinement of cyanide in the permeate stream allowsthe application of specific destructive treatment
The techno-economical analysis ofNanofiltration/Steam Stripping shows annual savingsof 0.698 €/(m3 of treated effluent) when the NFoperates at a 40% RR

Cork Industry

WASTEWATER
Process for softening and disinfection of cork planks generates highly polluted wastewaters
Immersion of cork planks in boiling water for 1 hour generates wastewaters rich in cork extracts -complex mixture of phenolic compounds - with UF fouling characteristics

OBJECTIVES Ultrafiltration Optimization: Membrane Permeation
Characteristics (Fluxes and Rejection Coefficients) andOperating Conditions
Removal of UF Fouling Agents in Cork ProcessingWastewaters Through the Integration of Flocculationand Flotation with UF
Optimization of Flocculation\Flotation\UF Operationfor Minimal UF Fouling

Experimental Program
Wastewater Characterization
Flocculation Optimization: Chitosan concentrationpH
DAF Optimization: Operating pressure
Recirculation Ratio: R\Q
Ultrafiltration Fouling Minimization for OptimalFlocculation\Flotation\UF Operation

Wastewaters Physico-Chemical
Characterization
Parameter Value
pH 4.9
TOC (mg C/L) 2469
Particle size (nm) 383.0
Total Polyphenols (g/L Galic acid) 0.958
Zeta potential (mV) -13.2
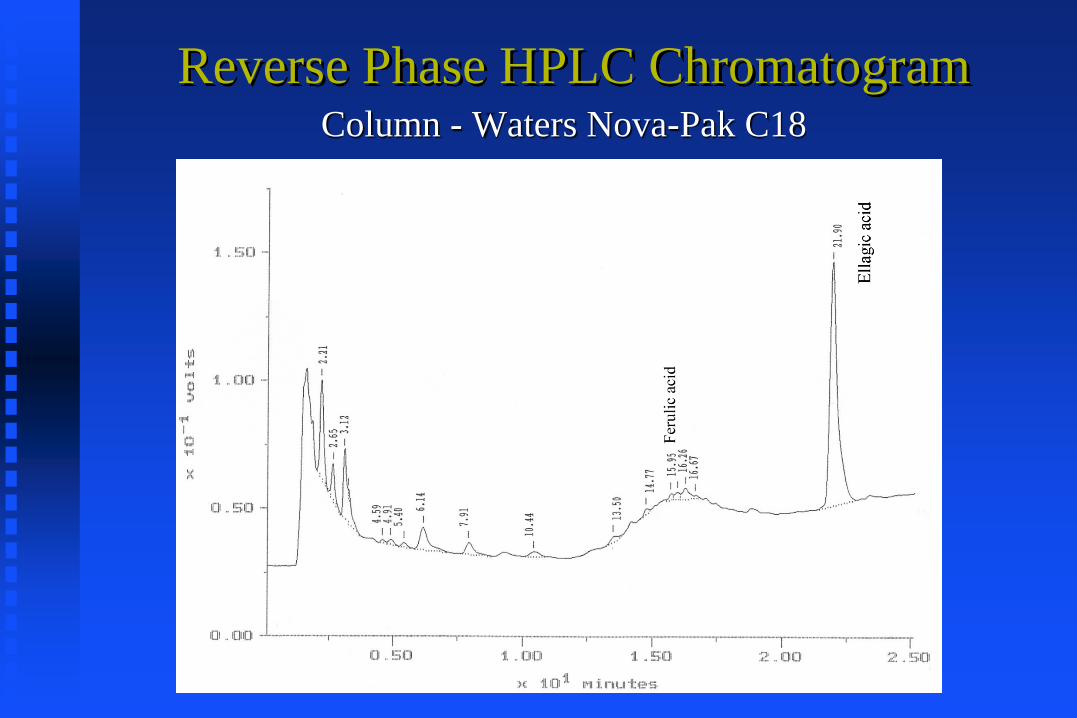
Reverse Phase HPLC ChromatogramColumn - Waters Nova-Pak C18

Wastewater Phenolic Solutes
COOH
OH
HO OH
Gallic acid
COOH
OH
HO H
Protocatechuic acid
COOH
OH
HH3CO
Vanillic acid Ferulic acid
OH
H3CO H
HC=CH-COOH
Ellagic acid
Hydrophilicity scale
Solutes Concentration (ppm)
Gallic acid 103.7
Protocatechuic acid 71.1
Vanillic acid 8.0
Ferulic acid 7.7
Ellagic acid 238.7

Membranes
Commercial Membrane: TS60 (Ropur)

Membrane Characterization
Operating conditions:
Temperature = 25ºC
Transmembrane Pressure = 2 bar
Feed flowrate = 200 L/h
Membrane surface area = 13.2 cm2
fC C
C
feed permeate
feed
Reference solutes: PEG,Dextran
0
1
2
3
4
5
0 10000 20000 30000 40000 50000
MW (Da)
log (
f/(1
-f))
MWCO
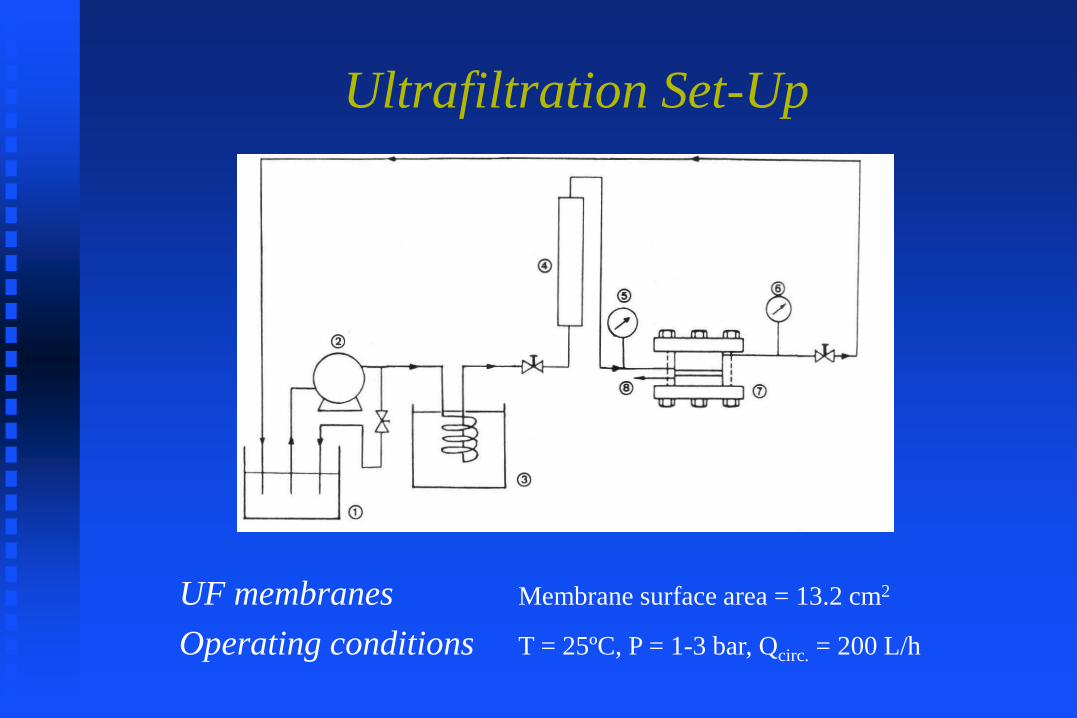
Ultrafiltration Set-Up
UF membranes Membrane surface area = 13.2 cm2
Operating conditions T = 25ºC, P = 1-3 bar, Qcirc. = 200 L/h

Flocculation
Colloid Water Characterization
Low pHs lead to higher particle sizes and to higher
zeta-potencials
pH Particle size zeta potential
(nm) (mV) Raw wastewater 4.9 383.0 -13.2
Clarified effluent: 2.9 763.0 -9.0 100 ppm Chitosan 4.0 379.6 -12.3
4.9 387.2 -13.6 Clarified effluent: 3.0 734.9 -4.7
200 ppm Chitosan 3.9 473.1 -10.6 4.9 426.3 -12.8

FlocculationOrganic Matter Removal
Optimal Operating conditions: 200 ppm chitosan
pH = 3
pH
TOC Total Polyphenols
TOC Removal
Total Poly. Removal
(mg C/l) (g/l galic acid) (%) (%)
Raw wastewater 4.9 2469 0.958 Clarified effluent: 2.9 2038 0.705 17% 26%
100 ppm Chitosan 4.0 2343 0.886 5% 8% 4.9 2386 0.910 3% 5% Clarified effluent: 3.0 1840 0.523 25% 45%
200 ppm Chitosan 3.9 2324 0.801 6% 16% 4.9 2371 0.865 4% 10%

Dissolved-Air-Flotation
SET-UP
Recirculation: R
Feed: Q
Clarified Wastewater
Flotation Unit
Operating Parameters:
Pressure: 4 and 5 bar
Recirculation ratio (R\Q): 0.19 – 0.85

Dissolved-Air-Flotation
Variation of TOC and Polyphenols Content with Pressure
and R\Q
R/Q TOC Total Polyphenols
(mg C/l) (g/l galic acid) Feed solution - 1840 0.523 5 bar (abs) 0.19 1501 0.441
0.48 1194 0.354 0.85 947 0.285 6 bar (abs) 0.19 1353 0.364 0.48 1177 0.311 0.85 946 0.262

R/Q TOC Removal (%)
Total Polyphenols Removal
(%)
5 bar (abs) 0.19 3 0 0.48 4 0 0.85 5 0 6 bar (abs) 0.19 12 17 0.48 5 12 0.85 5 7
Dissolved-Air-Flotation
Organic Matter Removal
Optimal Operating Conditions: R /Q = 0.19
Pressure = 6 bar (abs)
100Q
R1
C
C1Removal%
i
f

Phenolic acids RemovalFerulic and Ellagic acids

Ultrafiltration: TS60(T = 25ºC, P = 1 -3 bar, Qcirc = 200 L/h)
Membrane: TS60
0
1
2
3
4
5
6
7
8
0 1 2 3 4Pressure (bar)
Jv (
kg/h
/m2)
not treated
treated effluent
• Linear variation of permeate flux with pressure
• Enhancement of permeate fluxes in 60%
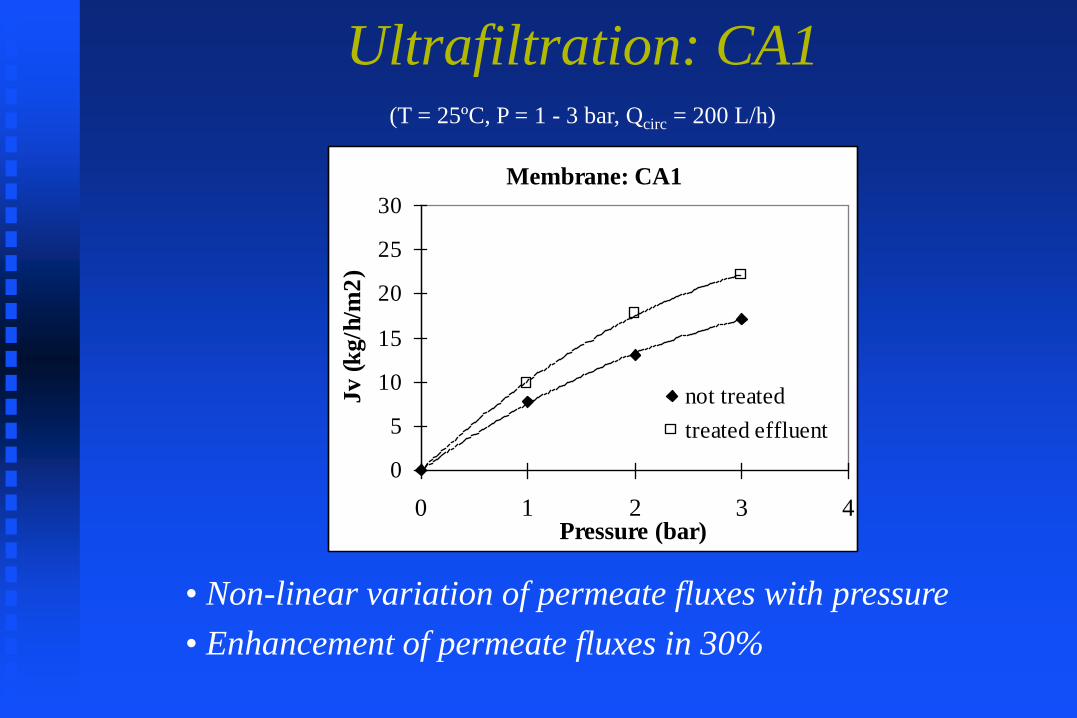
Ultrafiltration: CA1 (T = 25ºC, P = 1 - 3 bar, Qcirc = 200 L/h)
Membrane: CA1
0
5
10
15
20
25
30
0 1 2 3 4Pressure (bar)
Jv
(k
g/h
/m2
)
not treated
treated effluent
• Non-linear variation of permeate fluxes with pressure
• Enhancement of permeate fluxes in 30%
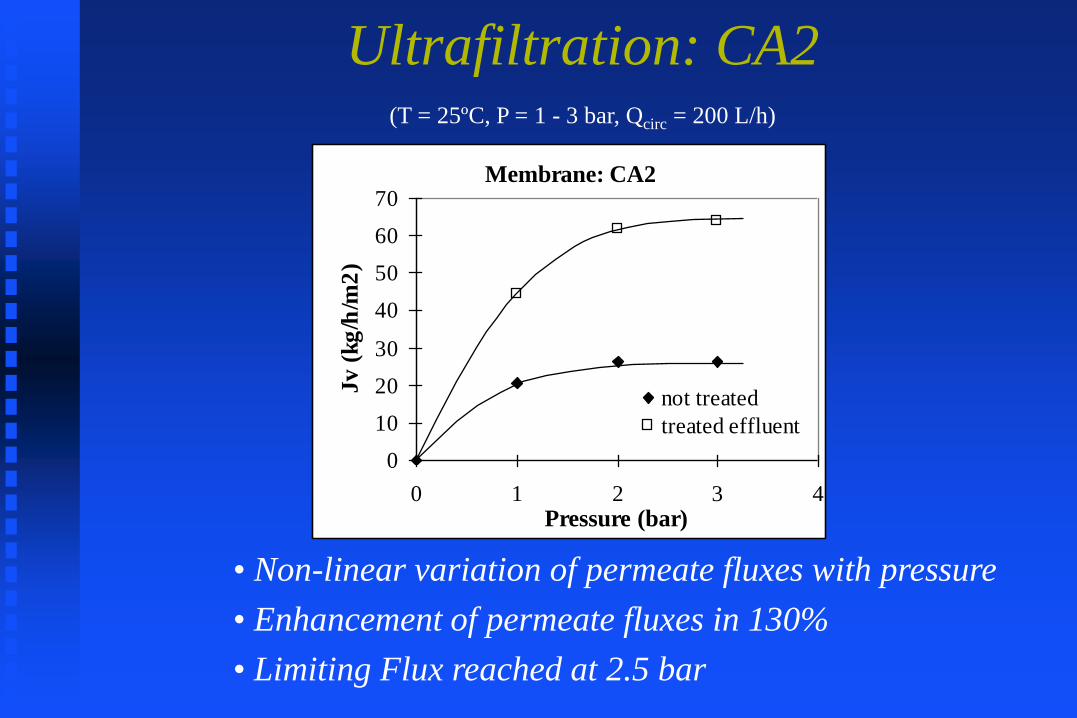
Ultrafiltration: CA2 (T = 25ºC, P = 1 - 3 bar, Qcirc = 200 L/h)
• Non-linear variation of permeate fluxes with pressure
• Enhancement of permeate fluxes in 130%
• Limiting Flux reached at 2.5 bar
Membrane: CA2
0
10
20
30
40
50
60
70
0 1 2 3 4Pressure (bar)
Jv
(kg
/h/m
2)
not treated
treated effluent
CONCLUSIONS
The flocculation removals of total polyphenols reach values inthe order of the 45% when 200 ppm of chitosan are added at apH of 3. The subsequent flotation operation raises the globalpolyphenols removal up to 62%.
The removal of the colloidal matter leads to the increase of the permeate fluxes, being this increase of 60% for the TS60 membrane, 30% for the CA1 membrane and 130% for the CA2 membrane.

CONCLUSIONS The membrane with higher MWCO, CA2, presented the
higher fouling in the treatment of the cork processingwastewater, displaying a limiting flux at a transmembranepressure of 2.0 bar.
Although the permeate flux increase, for the pre-treatedwastewater, was more pronounced for the CA2 membrane,it still presented a limiting flux at a pressure of 2.5 bar.
The performance of ultrafiltration cork processingwastewaters was highly improved by theflocculation/flotation pre-treatment.

REDE CYTED 311RT0438 - Recuperação de metais
por técnicas eletroquímicas e processos de
membranas para produção de materiais
nanoestruturados (RECMET).
The authors would like to thank Siderurgia Nacional
– Empresa de Serviços S.A. for their cooperation.
Miguel Minhalma would like to thank Fundação para
a Ciência e Tecnologia for the financial support.
Acknowledgements