Embed Size (px)
Citation preview
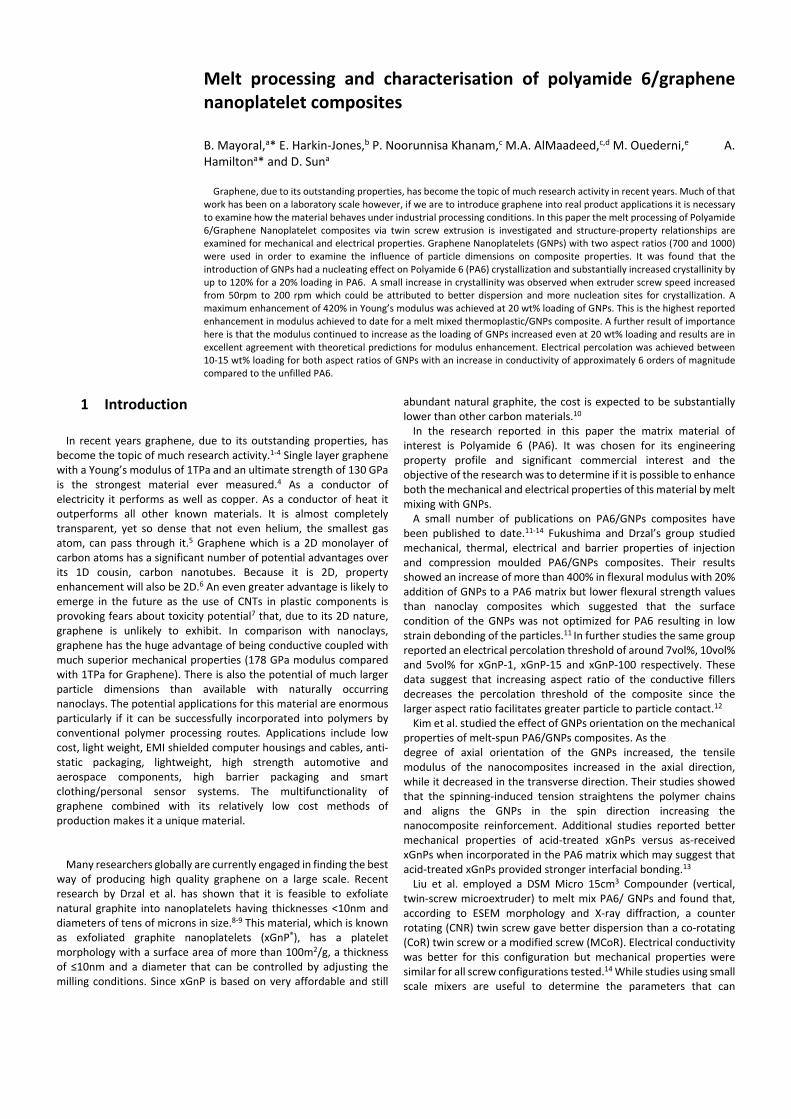
Melt Processing and Properties of Polyamide 6/GrapheneNanoplatelet Composites
Mayoral, B., Harkin-Jones, E., Khanam, P. N., AlMaadeed, M. A., Ouederni, M., Hamilton, A., & Sun, D. (2015).Melt Processing and Properties of Polyamide 6/Graphene Nanoplatelet Composites. RSC Advances, 5(65),52395-52409. https://doi.org/10.1039/c5ra08509h
Published in:RSC Advances
Document Version:Peer reviewed version
Queen's University Belfast - Research Portal:Link to publication record in Queen's University Belfast Research Portal
Publisher rights © The Royal Society of Chemistry 2015
General rightsCopyright for the publications made accessible via the Queen's University Belfast Research Portal is retained by the author(s) and / or othercopyright owners and it is a condition of accessing these publications that users recognise and abide by the legal requirements associatedwith these rights.
Take down policyThe Research Portal is Queen's institutional repository that provides access to Queen's research output. Every effort has been made toensure that content in the Research Portal does not infringe any person's rights, or applicable UK laws. If you discover content in theResearch Portal that you believe breaches copyright or violates any law, please contact [email protected].
Download date:26. Jan. 2020
Melt processing and characterisation of polyamide 6/graphene nanoplatelet composites B. Mayoral,a* E. Harkin‐Jones,b P. Noorunnisa Khanam,c M.A. AlMaadeed,c,d M. Ouederni,e A. Hamiltona* and D. Suna
Graphene, due to its outstanding properties, has become the topic of much research activity in recent years. Much of that
work has been on a laboratory scale however, if we are to introduce graphene into real product applications it is necessary to examine how the material behaves under industrial processing conditions. In this paper the melt processing of Polyamide 6/Graphene Nanoplatelet composites via twin screw extrusion is investigated and structure‐property relationships are examined for mechanical and electrical properties. Graphene Nanoplatelets (GNPs) with two aspect ratios (700 and 1000) were used in order to examine the influence of particle dimensions on composite properties. It was found that the introduction of GNPs had a nucleating effect on Polyamide 6 (PA6) crystallization and substantially increased crystallinity by up to 120% for a 20% loading in PA6. A small increase in crystallinity was observed when extruder screw speed increased from 50rpm to 200 rpm which could be attributed to better dispersion and more nucleation sites for crystallization. A maximum enhancement of 420% in Young’s modulus was achieved at 20 wt% loading of GNPs. This is the highest reported enhancement in modulus achieved to date for a melt mixed thermoplastic/GNPs composite. A further result of importance here is that the modulus continued to increase as the loading of GNPs increased even at 20 wt% loading and results are in excellent agreement with theoretical predictions for modulus enhancement. Electrical percolation was achieved between 10‐15 wt% loading for both aspect ratios of GNPs with an increase in conductivity of approximately 6 orders of magnitude compared to the unfilled PA6.
1 Introduction
In recent years graphene, due to its outstanding properties, has become the topic of much research activity.1‐4 Single layer graphene with a Young’s modulus of 1TPa and an ultimate strength of 130 GPa is the strongest material ever measured.4 As a conductor of electricity it performs as well as copper. As a conductor of heat it outperforms all other known materials. It is almost completely transparent, yet so dense that not even helium, the smallest gas atom, can pass through it.5 Graphene which is a 2D monolayer of carbon atoms has a significant number of potential advantages over its 1D cousin, carbon nanotubes. Because it is 2D, property enhancement will also be 2D.6 An even greater advantage is likely to emerge in the future as the use of CNTs in plastic components is provoking fears about toxicity potential7 that, due to its 2D nature, graphene is unlikely to exhibit. In comparison with nanoclays, graphene has the huge advantage of being conductive coupled with much superior mechanical properties (178 GPa modulus compared with 1TPa for Graphene). There is also the potential of much larger particle dimensions than available with naturally occurring nanoclays. The potential applications for this material are enormous particularly if it can be successfully incorporated into polymers by conventional polymer processing routes. Applications include low cost, light weight, EMI shielded computer housings and cables, anti‐static packaging, lightweight, high strength automotive and aerospace components, high barrier packaging and smart clothing/personal sensor systems. The multifunctionality of graphene combined with its relatively low cost methods of production makes it a unique material. Many researchers globally are currently engaged in finding the best
way of producing high quality graphene on a large scale. Recent research by Drzal et al. has shown that it is feasible to exfoliate natural graphite into nanoplatelets having thicknesses <10nm and diameters of tens of microns in size.8‐9 This material, which is known as exfoliated graphite nanoplatelets (xGnP®), has a platelet morphology with a surface area of more than 100m2/g, a thickness of ≤10nm and a diameter that can be controlled by adjusting the milling conditions. Since xGnP is based on very affordable and still
abundant natural graphite, the cost is expected to be substantially lower than other carbon materials.10 In the research reported in this paper the matrix material of
interest is Polyamide 6 (PA6). It was chosen for its engineering property profile and significant commercial interest and the objective of the research was to determine if it is possible to enhance both the mechanical and electrical properties of this material by melt mixing with GNPs. A small number of publications on PA6/GNPs composites have
been published to date.11‐14 Fukushima and Drzal’s group studied mechanical, thermal, electrical and barrier properties of injection and compression moulded PA6/GNPs composites. Their results showed an increase of more than 400% in flexural modulus with 20% addition of GNPs to a PA6 matrix but lower flexural strength values than nanoclay composites which suggested that the surface condition of the GNPs was not optimized for PA6 resulting in low strain debonding of the particles.11 In further studies the same group reported an electrical percolation threshold of around 7vol%, 10vol% and 5vol% for xGnP‐1, xGnP‐15 and xGnP‐100 respectively. These data suggest that increasing aspect ratio of the conductive fillers decreases the percolation threshold of the composite since the larger aspect ratio facilitates greater particle to particle contact.12 Kim et al. studied the effect of GNPs orientation on the mechanical
properties of melt‐spun PA6/GNPs composites. As the degree of axial orientation of the GNPs increased, the tensile modulus of the nanocomposites increased in the axial direction, while it decreased in the transverse direction. Their studies showed that the spinning‐induced tension straightens the polymer chains and aligns the GNPs in the spin direction increasing the nanocomposite reinforcement. Additional studies reported better mechanical properties of acid‐treated xGnPs versus as‐received xGnPs when incorporated in the PA6 matrix which may suggest that acid‐treated xGnPs provided stronger interfacial bonding.13 Liu et al. employed a DSM Micro 15cm3 Compounder (vertical,
twin‐screw microextruder) to melt mix PA6/ GNPs and found that, according to ESEM morphology and X‐ray diffraction, a counter rotating (CNR) twin screw gave better dispersion than a co‐rotating (CoR) twin screw or a modified screw (MCoR). Electrical conductivity was better for this configuration but mechanical properties were similar for all screw configurations tested.14 While studies using small scale mixers are useful to determine the parameters that can
influence nanoparticle dispersion and the results are helpful for understanding dispersion mechanisms, they must only be considered as guidelines for mixing on larger scales.15 In the work reported in this paper, an industrial scale, fully intermeshing, co‐rotating twin screw was employed which was previously reported as one of the most effective methods of achieving high levels of dispersion and distribution for a range of nano‐particles in polymer melts.16 The focus of the current research is to manufacture PA6/GNPs
composites via melt‐mixing using an industrial, co‐rotating, intermeshing, twin‐screw extruder and to examine the influence of GNPs content (two grades of xGnP® with different aspect ratio) and extruder screw speed on the bulk properties of the nanocomposites.
2 Experimental 2.1 Materials The matrix polymer was Polyamide 6 (PA6) grade BASF Ultramid
B40L (Relative Viscosity 3.89 ‐ 4.17) supplied in pellet form by Ultrapolymers. To achieve a more homogeneous mix, the PA6 pellets were
cryogenically ground to a fine powder (µm) using a Wedco SE‐12 UR pilot plant grinding mill at 7000 rpm and a gap size 400 µm. Liquid nitrogen was used for temperature regulation in order to prevent shear‐induced heating which could degrade the polymer. The nanofillers used were xGnP® Graphene Nanoplatelets supplied by XG Sciences. These are ultrathin particles of graphite that can also be thought of as short stacks of graphene sheets made through a proprietary manufacturing process. The grades used were M‐5 and C‐500 and their technical specifications are detailed in Table 1:
Table 1 xGnP technical specifications
GRADE Product # layers Thickness
(nm) Diameter (µm)
Surf. Area (m2/g)
M M‐5 18‐24 6‐8 5 120‐150
C C‐500 2‐15 1‐5 1‐2 500
2.2 Composite Preparation Due to its hydrophilic nature, the ground PA6 powder was dried at
80⁰C for 12 hours prior to mixing. Pre‐dried PA6 powder and GNPs, both in powder form, were pre‐mixed at 1 wt%, 3wt%, 5 wt%, 7.5 wt% and 10 wt% GNPs using a Thermo Scientific Prism Pilot 3 High Speed Mixer at 2000rpm for 2 mins. The batches of 15 wt% and 20 wt% GNPs were hand‐blended in a plastic bag in compliance with new health and safety regulations regarding nanoparticles handling. An Ezi‐flow system by Ezi‐dock was used to transport and safely discharge the PA6/GNPs batches into the hopper. The melt‐mixing process was performed using a co‐rotating
intermeshing twin‐screw extruder (Collin GmbH), having a screw diameter of 25 mm and a barrel length of 750 mm (L/D=30). On exiting the capillary die the extrudate was drawn through a cooled water bath at a constant haul off rate and pressure. The extrudate was dried by passing through an air ring and then pelletized using a Collin Pelletiser.
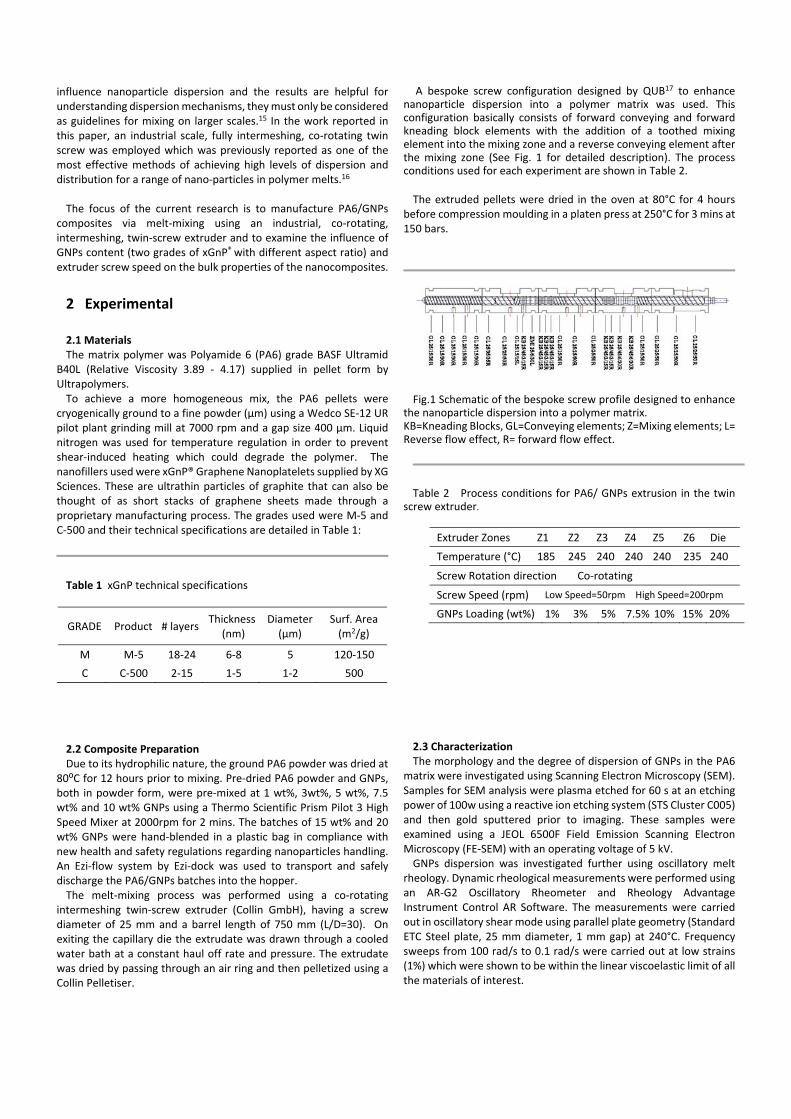
A bespoke screw configuration designed by QUB17 to enhance nanoparticle dispersion into a polymer matrix was used. This configuration basically consists of forward conveying and forward kneading block elements with the addition of a toothed mixing element into the mixing zone and a reverse conveying element after the mixing zone (See Fig. 1 for detailed description). The process conditions used for each experiment are shown in Table 2. The extruded pellets were dried in the oven at 80°C for 4 hours
before compression moulding in a platen press at 250°C for 3 mins at 150 bars.
Fig.1 Schematic of the bespoke screw profile designed to enhance the nanoparticle dispersion into a polymer matrix. KB=Kneading Blocks, GL=Conveying elements; Z=Mixing elements; L= Reverse flow effect, R= forward flow effect.
Table 2 Process conditions for PA6/ GNPs extrusion in the twin
screw extruder.
Extruder Zones Z1 Z2 Z3 Z4 Z5 Z6 Die
Temperature (°C) 185 245 240 240 240 235 240
Screw Rotation direction Co‐rotating
Screw Speed (rpm) Low Speed=50rpm High Speed=200rpm
GNPs Loading (wt%) 1% 3% 5% 7.5% 10% 15% 20%
2.3 Characterization The morphology and the degree of dispersion of GNPs in the PA6
matrix were investigated using Scanning Electron Microscopy (SEM). Samples for SEM analysis were plasma etched for 60 s at an etching power of 100w using a reactive ion etching system (STS Cluster C005) and then gold sputtered prior to imaging. These samples were examined using a JEOL 6500F Field Emission Scanning Electron Microscopy (FE‐SEM) with an operating voltage of 5 kV. GNPs dispersion was investigated further using oscillatory melt
rheology. Dynamic rheological measurements were performed using an AR‐G2 Oscillatory Rheometer and Rheology Advantage Instrument Control AR Software. The measurements were carried out in oscillatory shear mode using parallel plate geometry (Standard ETC Steel plate, 25 mm diameter, 1 mm gap) at 240°C. Frequency sweeps from 100 rad/s to 0.1 rad/s were carried out at low strains (1%) which were shown to be within the linear viscoelastic limit of all the materials of interest.
Differential scanning calorimetry (DSC) was performed to study the effect of GNPs addition on the melting and crystallisation behaviour of PA6. Samples of unfilled PA6 and PA6/GNPs composites were studied using a Perkin–Elmer DSC model 6 under an inert nitrogen atmosphere using a heating and cooling rate of 10 K/min. between 30°C and 275°C. In all cases the samples were held at 275°C for 3 min., then cooled to 30°C at 10K/min. and reheated again to 275°C at 10 K/min. This cooling and heating procedure was adopted to ensure complete melting of the crystalline fraction of PA6 and to remove thermal history. The apparent crystalline content of the composites was determined using a value of 191J/g for the heat of fusion for a theoretically 100% crystalline PA6. Wide‐angle X‐ray diffraction (WAXRD) of compression moulded
samples of PA6 and PA6/GNPs composites were recorded using a PANalytical X'Pert PRO diffractometer with Cu‐Kα radiation (λ=1.5406 Å) at a scanning rate of 0.02°/min over the range 2–60⁰ (2θ). Tensile tests were carried out at room temperature (adhering to BS
EN ISO 527‐1: 1996) using an Instron 5564 Universal Tester with a clip‐on extensometer and a 2 kN load cell. Samples were prepared by compression moulding, from which dumbbell‐shaped samples (type 1BA) were cut using a stamping press. For modulus measurement, nominal strain was determined using an extensometer attached on the narrow portion of the dumb‐bell samples at a crosshead speed of 1 mm/min and a gauge length of 25 mm. Whereas for the strength and elongation, the nominal strain was derived from the grip displacement at a crosshead speed of 50 mm/min. Modulus was determined from the slope of the regression of the stress‐strain data between 0.05 ‐ 0.25 % strain. Volume resistivity measurements were performed in accordance
with ASTM D‐257 on compression moulded samples of all nanocomposites of thickness 1 mm. For high resistivity samples, a Keithley electrometer (Model 6517A) equipped with an 8009 test fixture with circular samples of diameter 60 mm was used. The sample of interest was placed between two circular electrodes and the volume resistivity measured by applying a DC voltage across
opposite sides of the sample and measuring the resultant current through the sample. For more conductive samples (< 107 Ω cm) strips with dimensions of 50×10 mm2 were cut from the sheets and measured using a Keithley electrometer (Model DMM 2000) using a two‐point test fixture (i.e. contact wires with a distance of 50 mm between the measuring electrodes).
3 Results and discussion
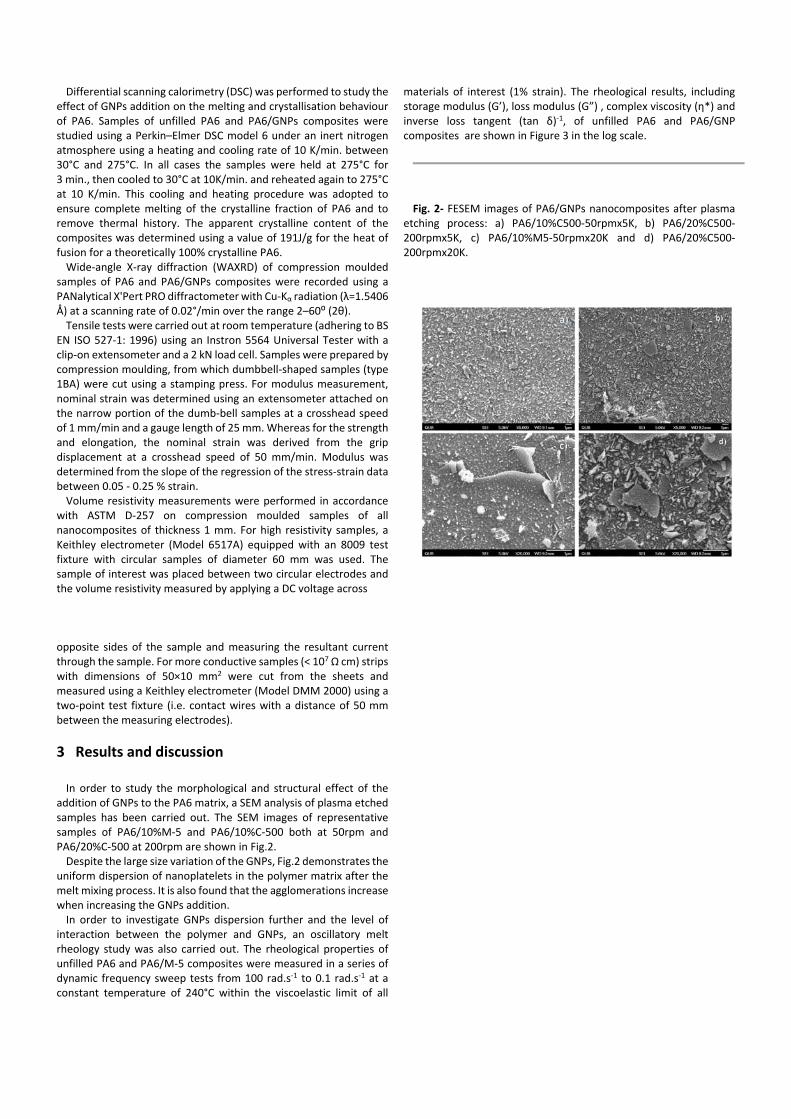
In order to study the morphological and structural effect of the addition of GNPs to the PA6 matrix, a SEM analysis of plasma etched samples has been carried out. The SEM images of representative samples of PA6/10%M‐5 and PA6/10%C‐500 both at 50rpm and PA6/20%C‐500 at 200rpm are shown in Fig.2. Despite the large size variation of the GNPs, Fig.2 demonstrates the
uniform dispersion of nanoplatelets in the polymer matrix after the melt mixing process. It is also found that the agglomerations increase when increasing the GNPs addition. In order to investigate GNPs dispersion further and the level of
interaction between the polymer and GNPs, an oscillatory melt rheology study was also carried out. The rheological properties of unfilled PA6 and PA6/M‐5 composites were measured in a series of dynamic frequency sweep tests from 100 rad.s‐1 to 0.1 rad.s‐1 at a constant temperature of 240°C within the viscoelastic limit of all
materials of interest (1% strain). The rheological results, including storage modulus (G’), loss modulus (G”) , complex viscosity (η*) and inverse loss tangent (tan δ)‐1, of unfilled PA6 and PA6/GNP composites are shown in Figure 3 in the log scale.
Fig. 2‐ FESEM images of PA6/GNPs nanocomposites after plasma
etching process: a) PA6/10%C500‐50rpmx5K, b) PA6/20%C500‐200rpmx5K, c) PA6/10%M5‐50rpmx20K and d) PA6/20%C500‐200rpmx20K.
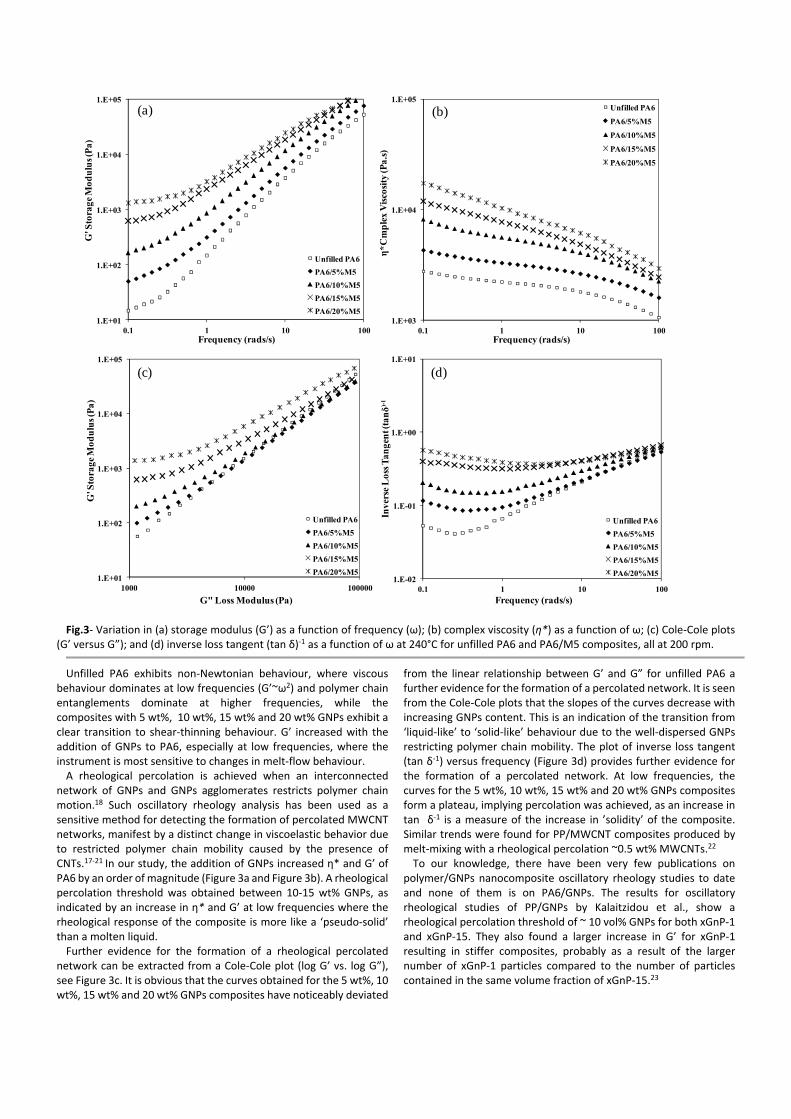
Fig.3‐ Variation in (a) storage modulus (G’) as a function of frequency (ω); (b) complex viscosity (η*) as a function of ω; (c) Cole‐Cole plots (G’ versus G”); and (d) inverse loss tangent (tan δ)‐1 as a function of ω at 240°C for unfilled PA6 and PA6/M5 composites, all at 200 rpm.
Unfilled PA6 exhibits non‐Newtonian behaviour, where viscous behaviour dominates at low frequencies (G’~ω2) and polymer chain entanglements dominate at higher frequencies, while the composites with 5 wt%, 10 wt%, 15 wt% and 20 wt% GNPs exhibit a clear transition to shear‐thinning behaviour. G’ increased with the addition of GNPs to PA6, especially at low frequencies, where the instrument is most sensitive to changes in melt‐flow behaviour. A rheological percolation is achieved when an interconnected
network of GNPs and GNPs agglomerates restricts polymer chain motion.18 Such oscillatory rheology analysis has been used as a sensitive method for detecting the formation of percolated MWCNT networks, manifest by a distinct change in viscoelastic behavior due to restricted polymer chain mobility caused by the presence of CNTs.17‐21 In our study, the addition of GNPs increased η* and G’ of PA6 by an order of magnitude (Figure 3a and Figure 3b). A rheological percolation threshold was obtained between 10‐15 wt% GNPs, as indicated by an increase in η* and G’ at low frequencies where the rheological response of the composite is more like a ‘pseudo‐solid’ than a molten liquid. Further evidence for the formation of a rheological percolated
network can be extracted from a Cole‐Cole plot (log G’ vs. log G”), see Figure 3c. It is obvious that the curves obtained for the 5 wt%, 10 wt%, 15 wt% and 20 wt% GNPs composites have noticeably deviated
from the linear relationship between G’ and G” for unfilled PA6 a further evidence for the formation of a percolated network. It is seen from the Cole‐Cole plots that the slopes of the curves decrease with increasing GNPs content. This is an indication of the transition from ‘liquid‐like’ to ‘solid‐like’ behaviour due to the well‐dispersed GNPs restricting polymer chain mobility. The plot of inverse loss tangent (tan δ‐1) versus frequency (Figure 3d) provides further evidence for the formation of a percolated network. At low frequencies, the curves for the 5 wt%, 10 wt%, 15 wt% and 20 wt% GNPs composites form a plateau, implying percolation was achieved, as an increase in tan δ‐1 is a measure of the increase in ’solidity’ of the composite. Similar trends were found for PP/MWCNT composites produced by melt‐mixing with a rheological percolation ~0.5 wt% MWCNTs.22 To our knowledge, there have been very few publications on
polymer/GNPs nanocomposite oscillatory rheology studies to date and none of them is on PA6/GNPs. The results for oscillatory rheological studies of PP/GNPs by Kalaitzidou et al., show a rheological percolation threshold of ~ 10 vol% GNPs for both xGnP‐1 and xGnP‐15. They also found a larger increase in G’ for xGnP‐1 resulting in stiffer composites, probably as a result of the larger number of xGnP‐1 particles compared to the number of particles contained in the same volume fraction of xGnP‐15.23
1.E+01
1.E+02
1.E+03
1.E+04
1.E+05
0.1 1 10 100
G' S
tora
ge M
odu
lus (
Pa)
Frequency (rads/s)
Unfilled PA6
PA6/5%M5
PA6/10%M5
PA6/15%M5
PA6/20%M51.E+03
1.E+04
1.E+05
0.1 1 10 100
η*C
mp
lex
Vis
cosi
ty (P
a.s)
Frequency (rads/s)
Unfilled PA6
PA6/5%M5
PA6/10%M5
PA6/15%M5
PA6/20%M5
1.E+01
1.E+02
1.E+03
1.E+04
1.E+05
1000 10000 100000
G' S
tora
ge M
odu
lus (
Pa)
G" Loss Modulus (Pa)
Unfilled PA6
PA6/5%M5
PA6/10%M5
PA6/15%M5
PA6/20%M51.E-02
1.E-01
1.E+00
1.E+01
0.1 1 10 100
Inve
rse
Los
s Tan
gen
t (ta
nδ)
-1
Frequency (rads/s)
Unfilled PA6
PA6/5%M5
PA6/10%M5
PA6/15%M5
PA6/20%M5
(a) (b)
(c) (d)

Table 3‐ Effect of M‐5 and C‐500 GNPs addition on the thermal properties of unfilled PA6 and PA6/GNPs composites at two different screw
speeds 50 and 200rpm.
50rpm First heat Cooling Second heat
Tm (⁰C)
∆H (J/g)
Xc (%)
Impr (%)
Tc (⁰C)
∆H (J/g)
Tm (⁰C)
∆H (J/g)
Xc (%)
Impr (%)
PA6 Unfilled 221.5 73.2 38.3 180.3 68.5 221.9 66.5 34.8
PA6/ 1wt% M‐5 221.8 98.9 51.8 35.1 182.4 85.6 222.2 90.3 47.3 35.8
PA6/ 3wt% M‐5 221.9 117.4 61.5 60.4 183.5 86.0 222.4 95.6 50.1 43.7
PA6/ 5wt% M‐5 222.2 125.7 65.8 71.7 184.5 89.8 222.1 112.4 58.8 69.0
PA6/ 7.5wt% M‐5 222.5 134.6 70.5 83.9 185.6 105.6 222.2 124.9 65.4 87.8
PA6/ 10wt% M‐5 222.4 142.9 74.8 95.2 185.8 112.0 222.6 137.1 71.8 106.2
PA6/ 15wt%M‐5 223.5 151.9 79.5 107.5 186.1 115.9 223.1 142.3 74.5 114.0
PA6/ 20wt% M‐5 223.9 155.0 81.2 111.7 186.7 116.7 223.3 145.9 76.4 119.4
50rpm First heat Cooling Second heat
Tm (⁰C)
∆H (J/g)
Xc (%)
Impr (%)
Tc (⁰C)
Impr (%)
Tm (⁰C)
∆H (J/g)
Xc (%)
Impr (%)
PA6 Unfilled 221.5 73.2 38.3 180.3 221.9 66.5 34.8
PA6/ 1wt% C‐500 221.9 115.3 60.3 57.5 183.2 1.61 221.8 112.6 59.0 69.3
PA6/ 3wt% C‐500 221.6 127.7 66.8 74.4 183.9 2.00 222.1 126.9 66.4 90.8
PA6/ 5wt% C‐500 222.1 135.2 70.8 84.7 184.1 2.11 222.4 135.8 71.1 104.2
PA6/ 7.5wt% C‐500 221.9 147.0 77.0 100.8 185.3 2.77 222.5 138.0 72.3 107.5
PA6/ 10wt% C‐500 222.3 149.7 78.4 104.5 185.2 2.72 222.3 140.7 73.7 111.6
PA6/ 15wt% C‐500 222.5 152 79.6 107.6 185.4 2.83 223.2 143.4 75.1 115.6
PA6/ 20wt% C‐500 223.9 154.1 80.7 110.5 186.1 3.22 223.3 145.6 76.2 118.9
200rpm First heat Cooling Second heat
Tm (⁰C)
∆H (J/g)
Xc (%)
Impr (%)
Tc (⁰C)
∆H (J/g)
Tm (⁰C)
∆H (J/g)
Xc (%)
Impr (%)
PA6 Unfilled 222.6 71.5 37.4 179.6 70.7 222.3 68.0 35.6
PA6/ 1wt% M‐5 222.2 111.7 58.5 56.2 183.8 91.0 222.6 97.0 50.8 42.6
PA6/ 3wt% M‐5 222.3 125.1 65.5 75.0 184.1 89.2 222.6 100.7 52.7 48.1
PA6/ 5wt% M‐5 222.6 134.5 70.4 88.1 184.5 90.4 222.4 115.3 60.3 69.5
PA6/ 7.5wt% M‐5 222.6 140.6 73.6 96.6 185.1 118.4 222.2 136.0 71.2 100.0
PA6/ 10wt% M‐5 222.6 149.4 78.2 108.9 185.2 118.3 222.1 142.0 74.4 108.8
PA6/ 15wt%M‐5 224.0 156.4 81.9 118.7 186.4 117.4 223.3 148.7 77.9 118.7
PA6/ 20wt% M‐5 224.7 158.9 83.2 122.2 187.7 118.5 223.9 149.4 78.2 119.7
200rpm First heat Cooling Second heat
Tm (⁰C)
∆H (J/g)
Xc (%)
Impr (%)
Tc (⁰C)
∆H (J/g)
Tm (⁰C)
∆H (J/g)
Xc (%)
Impr (%)
PA6 Unfilled 222.6 71.5 37.4 179.6 70.7 222.3 68.0 35.6
PA6/ 1wt% C‐500 222.5 128.1 67.1 79.2 184.4 112.7 222.7 126.3 66.1 85.7
PA6/ 3wt% C‐500 221.9 136.2 71.3 90.5 184.8 115.6 222.4 132.1 69.2 94.3
PA6/ 5wt% C‐500 221.7 142.3 74.5 99.0 184.8 115.4 222.1 140.4 73.5 106.5
PA6/ 7.5wt% C‐500 221.9 150.4 78.7 110.3 185.7 112.2 222.6 142.9 74.8 110.1
PA6/ 10wt% C‐500 222.1 151.5 79.3 111.9 186.2 113.9 222.1 145.7 76.3 114.3
PA6/ 15wt% C‐500 222.7 154.8 81.0 116.5 186.9 110.3 222.9 146.3 76.6 115.1
PA6/ 20wt% C‐500 224.5 155.1 81.2 116.9 186.6 108.0 223.8 148.3 77.6 118.1
100 120 140 160 180 200 220
Heat Flow
Temperature (oC)
5%M‐5
3%M‐5
1%M‐5
7.5%M‐5
15%M‐5
10%M‐5
20%M‐5
PA6 Unfilled
100 120 140 160 180 200 220
Hea
t Flo
w
Temperature (oC)
5%C‐500
3%C‐500
1%C‐500
7.5%C‐500
15%C‐500
10%C‐500
20%C‐500
PA6 Unfilled
200 220 240
Heat Flow
Temperature (oC)
5%M‐5
3%M‐5
1%M‐5
7.5%M‐5
15%M‐5
10%M‐5
20%M‐5
PA6 Unfilled
200 220 240
Heat Flow
Temperature (oC)
5%C‐500
3%C‐500
1%C‐500
7.5%C‐500
15%C‐500
10%C‐500
20%C‐500
PA6 Unfilled
(c) (d)
(a) (b)
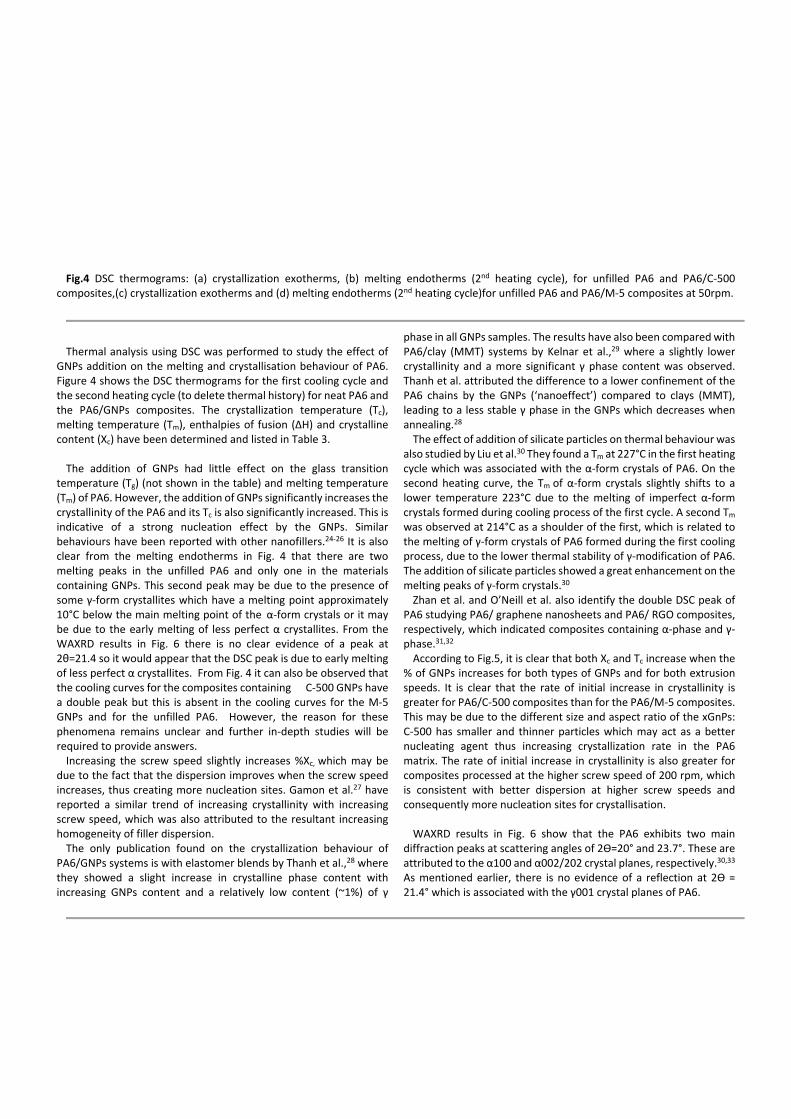
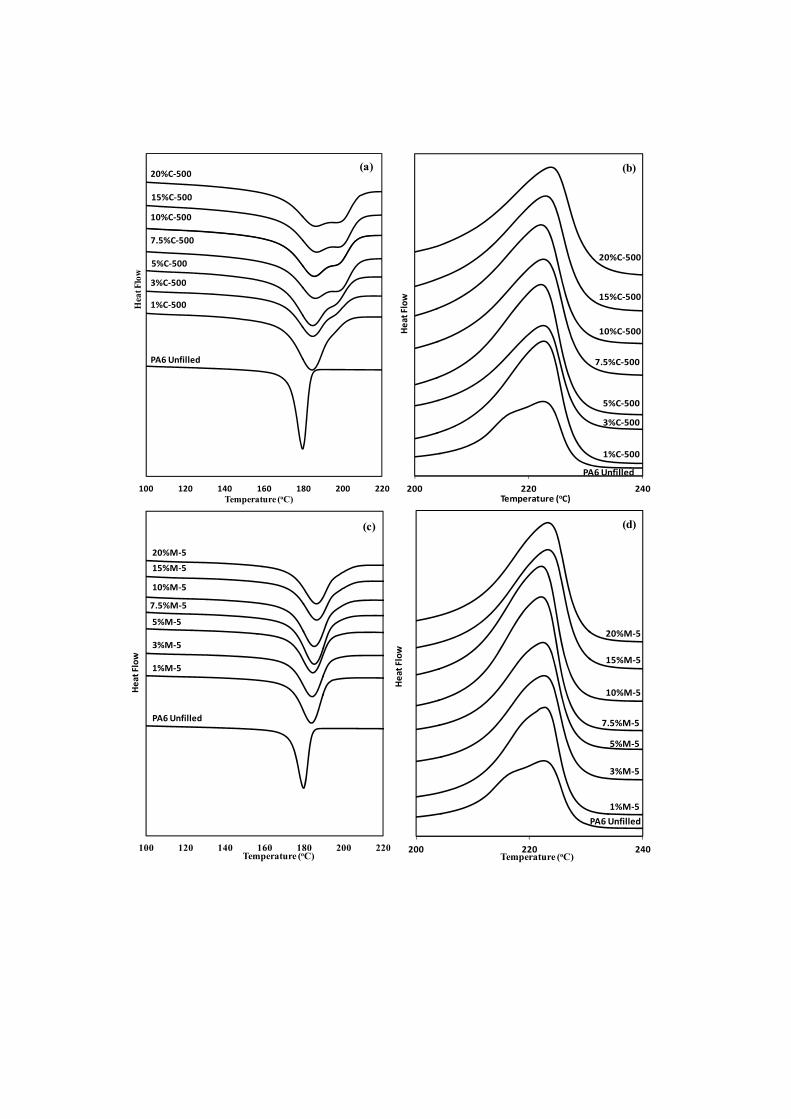
Fig.4 DSC thermograms: (a) crystallization exotherms, (b) melting endotherms (2nd heating cycle), for unfilled PA6 and PA6/C‐500
composites,(c) crystallization exotherms and (d) melting endotherms (2nd heating cycle)for unfilled PA6 and PA6/M‐5 composites at 50rpm.
Thermal analysis using DSC was performed to study the effect of
GNPs addition on the melting and crystallisation behaviour of PA6. Figure 4 shows the DSC thermograms for the first cooling cycle and the second heating cycle (to delete thermal history) for neat PA6 and the PA6/GNPs composites. The crystallization temperature (Tc), melting temperature (Tm), enthalpies of fusion (∆H) and crystalline content (Xc) have been determined and listed in Table 3. The addition of GNPs had little effect on the glass transition
temperature (Tg) (not shown in the table) and melting temperature (Tm) of PA6. However, the addition of GNPs significantly increases the crystallinity of the PA6 and its Tc is also significantly increased. This is indicative of a strong nucleation effect by the GNPs. Similar behaviours have been reported with other nanofillers.24‐26 It is also clear from the melting endotherms in Fig. 4 that there are two melting peaks in the unfilled PA6 and only one in the materials containing GNPs. This second peak may be due to the presence of some γ‐form crystallites which have a melting point approximately 10°C below the main melting point of the α‐form crystals or it may be due to the early melting of less perfect α crystallites. From the WAXRD results in Fig. 6 there is no clear evidence of a peak at 2θ=21.4 so it would appear that the DSC peak is due to early melting of less perfect α crystallites. From Fig. 4 it can also be observed that the cooling curves for the composites containing C‐500 GNPs have a double peak but this is absent in the cooling curves for the M‐5 GNPs and for the unfilled PA6. However, the reason for these phenomena remains unclear and further in‐depth studies will be required to provide answers. Increasing the screw speed slightly increases %Xc, which may be
due to the fact that the dispersion improves when the screw speed increases, thus creating more nucleation sites. Gamon et al.27 have reported a similar trend of increasing crystallinity with increasing screw speed, which was also attributed to the resultant increasing homogeneity of filler dispersion. The only publication found on the crystallization behaviour of
PA6/GNPs systems is with elastomer blends by Thanh et al.,28 where they showed a slight increase in crystalline phase content with increasing GNPs content and a relatively low content (~1%) of γ
phase in all GNPs samples. The results have also been compared with PA6/clay (MMT) systems by Kelnar et al.,29 where a slightly lower crystallinity and a more significant γ phase content was observed. Thanh et al. attributed the difference to a lower confinement of the PA6 chains by the GNPs (‘nanoeffect’) compared to clays (MMT), leading to a less stable γ phase in the GNPs which decreases when annealing.28 The effect of addition of silicate particles on thermal behaviour was
also studied by Liu et al.30 They found a Tm at 227°C in the first heating cycle which was associated with the α‐form crystals of PA6. On the second heating curve, the Tm of α‐form crystals slightly shifts to a lower temperature 223°C due to the melting of imperfect α‐form crystals formed during cooling process of the first cycle. A second Tm was observed at 214°C as a shoulder of the first, which is related to the melting of γ‐form crystals of PA6 formed during the first cooling process, due to the lower thermal stability of γ‐modification of PA6. The addition of silicate particles showed a great enhancement on the melting peaks of γ‐form crystals.30 Zhan et al. and O’Neill et al. also identify the double DSC peak of
PA6 studying PA6/ graphene nanosheets and PA6/ RGO composites, respectively, which indicated composites containing α‐phase and γ‐phase.31,32
According to Fig.5, it is clear that both Xc and Tc increase when the % of GNPs increases for both types of GNPs and for both extrusion speeds. It is clear that the rate of initial increase in crystallinity is greater for PA6/C‐500 composites than for the PA6/M‐5 composites. This may be due to the different size and aspect ratio of the xGnPs: C‐500 has smaller and thinner particles which may act as a better nucleating agent thus increasing crystallization rate in the PA6 matrix. The rate of initial increase in crystallinity is also greater for composites processed at the higher screw speed of 200 rpm, which is consistent with better dispersion at higher screw speeds and consequently more nucleation sites for crystallisation. WAXRD results in Fig. 6 show that the PA6 exhibits two main
diffraction peaks at scattering angles of 2Ɵ=20° and 23.7°. These are attributed to the α100 and α002/202 crystal planes, respectively.30,33 As mentioned earlier, there is no evidence of a reflection at 2Ɵ = 21.4° which is associated with the γ001 crystal planes of PA6.
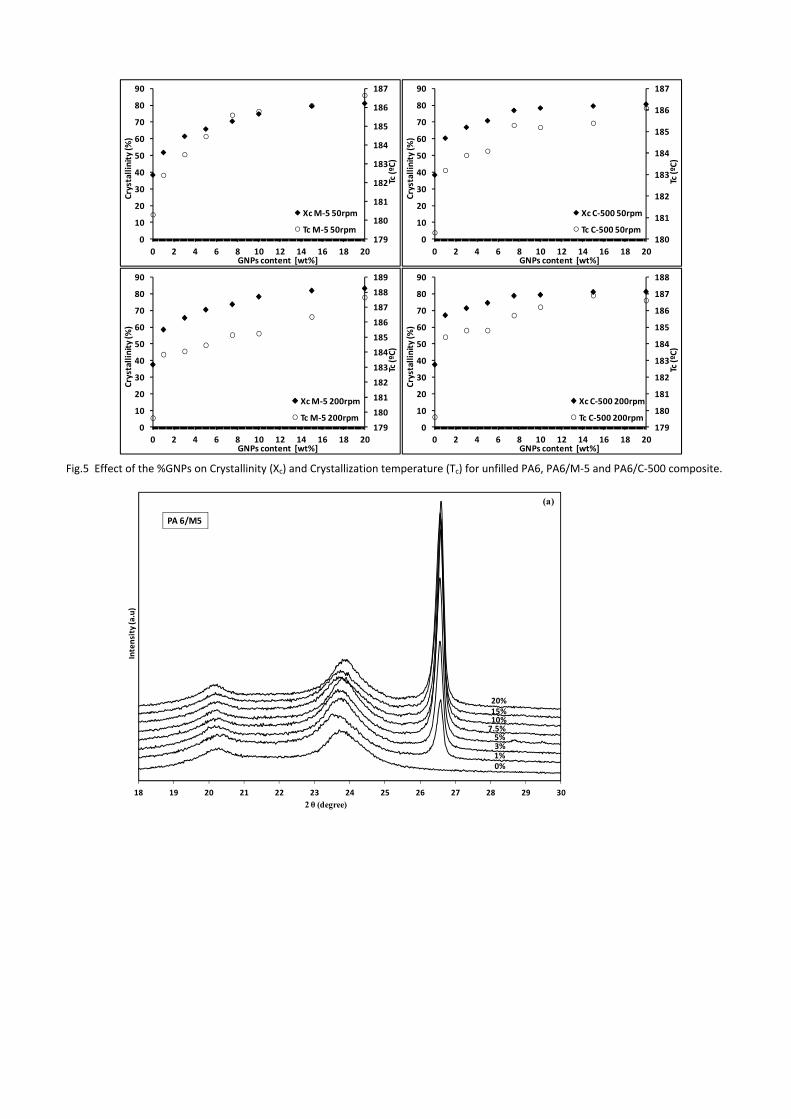
Fig.5 Effect of the %GNPs on Crystallinity (Xc) and Crystallization temperature (Tc) for unfilled PA6, PA6/M‐5 and PA6/C‐500 composite.
18 19 20 21 22 23 24 25 26 27 28 29 30
Intensity (a.u)
2 θ (degree)
20%
(a)
PA 6/M5
15%10%
3%1%0%
7.5%5%
179
180
181
182
183
184
185
186
187
0
10
20
30
40
50
60
70
80
90
0 2 4 6 8 10 12 14 16 18 20
Tc (ºC)
Crystallinity (%
)
GNPs content [wt%]
Xc M‐5 50rpm
Tc M‐5 50rpm180
181
182
183
184
185
186
187
0
10
20
30
40
50
60
70
80
90
0 2 4 6 8 10 12 14 16 18 20
Tc (ºC)
Crystallinity (%
)
GNPs content [wt%]
Xc C‐500 50rpm
Tc C‐500 50rpm
179
180
181
182
183
184
185
186
187
188
0
10
20
30
40
50
60
70
80
90
0 2 4 6 8 10 12 14 16 18 20
Tc (ºC)
Crystallinity (%
)
GNPs content [wt%]
Xc C‐500 200rpm
Tc C‐500 200rpm179
180
181
182
183
184
185
186
187
188
189
0
10
20
30
40
50
60
70
80
90
0 2 4 6 8 10 12 14 16 18 20
Tc (ºC)
Crystallinity (%
)
GNPs content [wt%]
Xc M‐5 200rpm
Tc M‐5 200rpm

Fig. 6 WAXRD traces for (a) unfilled PA6 and PA6/M‐5 composites and (b) unfilled PA6 and PA6/C‐500 composites for 200rpm.
A sharp peak around 26.5° appears for the GNPs composites can
be assigned to the graphite d002 diffraction peak.14 According to Liu et al.14 it is very difficult to achieve a fully exfoliated state with graphite since there is an extremely high physical interaction between layers and it retains the characteristic crystal structure of graphite. As %GNPs increases the α100 peak shifts to the left and the α002/202 peak shifts to the right changing slightly the intensity
indicating a change in the preferential growth of the PA6 crystal planes. Similar trends have been reported by Liu et al. in PA6/silicate clays systems.30 The tensile properties of neat PA6 and the PA6/GNPs compression
moulded samples were measured. Young’s modulus was determined and the values tabulated in Table 4.
Table 4 Effect of addition of M‐5 and C‐500 GNPs to mechanical properties of PA6 unfilled and PA6/GNPs composites at two different
screw speeds 50 and 200rpm.
50rpm Modulus Impr* 50rpm Moduluss Impr* (MPa) (%) (MPa) (%)
PA 6 unfilled Mean 1136.5
PA 6 unfilled Mean 1136.5
SD 97 SD 97
PA6/1%M‐5 Mean 1345.3 18.4
PA6/1%C‐500 Mean 1457.9 28.3
SD 47 SD 45
PA6/3%M‐5 Mean 1390.9 22.4
PA6/3%C‐500 Mean 1683.3 48.1
SD 58 SD 85
PA6/5%M‐5 Mean 1450.7 27.6
PA6/5%C‐500 Mean 1892.7 66.5
SD 36 SD 51
PA6/7.5%M‐5 Mean 1672.8 47.2
PA6/7.5%C‐500 Mean 2170.9 91.0
SD 57 SD 108
PA6/10%M‐5 Mean 3003.9 164.3
PA6/10%C‐500 Mean 2573.7 126.5
SD 101 SD 76
PA6/15%M‐5 Mean 4910.7 332.1
PA6/15%C‐500 Mean 3700.9 225.6
SD 89 SD 78
PA6/20%M‐5 Mean 5410.7 376.1
PA6/20%C‐500 Mean 5793.5 409.8
SD 158 SD 102
200rpm Modulus Impr* 200rpm Modulus Impr* (MPa) (%) (MPa) (%)
PA 6 unfilled Mean 1285.7
PA 6 unfilled Mean 1285.7
SD 69 SD 69
18 19 20 21 22 23 24 25 26 27 28 29 30
Intensity (a.u.)
2 θ (degree)
20%
(b)PA 6/C500
15%
10%
3%
1%
0%
7.5%
5%
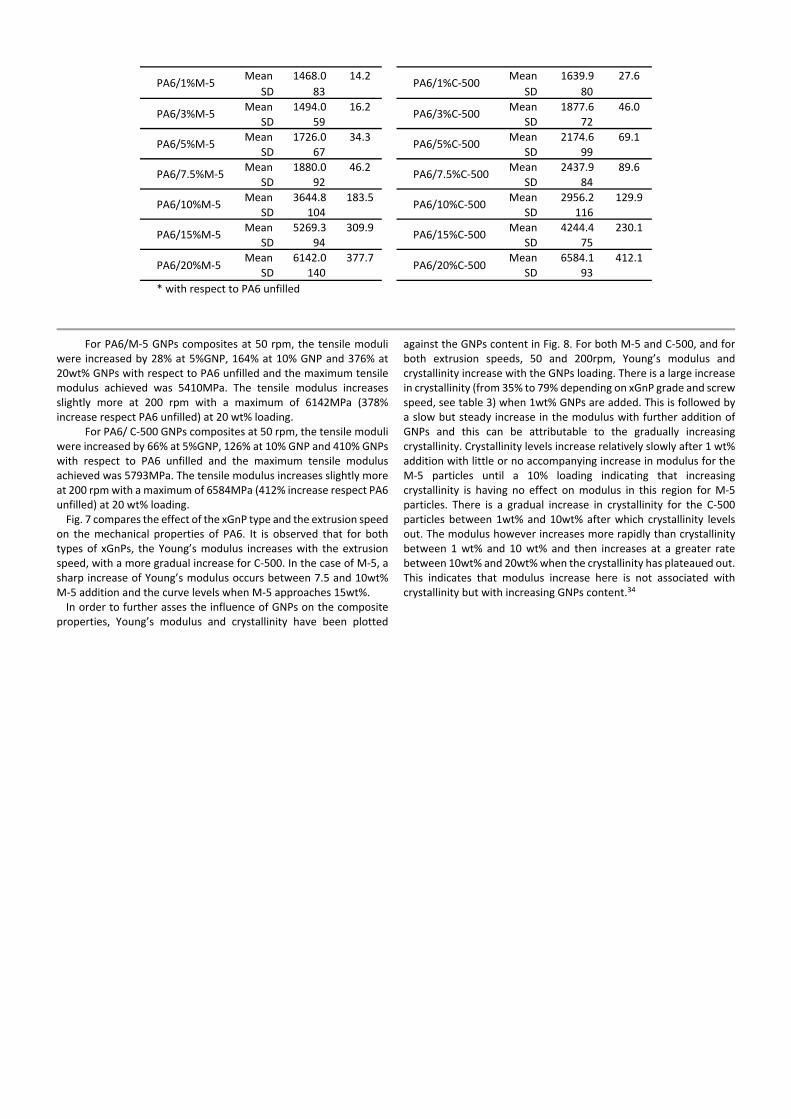
PA6/1%M‐5 Mean 1468.0 14.2
PA6/1%C‐500 Mean 1639.9 27.6
SD 83 SD 80
PA6/3%M‐5 Mean 1494.0 16.2
PA6/3%C‐500 Mean 1877.6 46.0
SD 59 SD 72
PA6/5%M‐5 Mean 1726.0 34.3
PA6/5%C‐500 Mean 2174.6 69.1
SD 67 SD 99
PA6/7.5%M‐5 Mean 1880.0 46.2
PA6/7.5%C‐500 Mean 2437.9 89.6
SD 92 SD 84
PA6/10%M‐5 Mean 3644.8 183.5
PA6/10%C‐500 Mean 2956.2 129.9
SD 104 SD 116
PA6/15%M‐5 Mean 5269.3 309.9
PA6/15%C‐500 Mean 4244.4 230.1
SD 94 SD 75
PA6/20%M‐5 Mean 6142.0 377.7
PA6/20%C‐500 Mean 6584.1 412.1
SD 140 SD 93
* with respect to PA6 unfilled
For PA6/M‐5 GNPs composites at 50 rpm, the tensile moduli were increased by 28% at 5%GNP, 164% at 10% GNP and 376% at 20wt% GNPs with respect to PA6 unfilled and the maximum tensile modulus achieved was 5410MPa. The tensile modulus increases slightly more at 200 rpm with a maximum of 6142MPa (378% increase respect PA6 unfilled) at 20 wt% loading.
For PA6/ C‐500 GNPs composites at 50 rpm, the tensile moduli were increased by 66% at 5%GNP, 126% at 10% GNP and 410% GNPs with respect to PA6 unfilled and the maximum tensile modulus achieved was 5793MPa. The tensile modulus increases slightly more at 200 rpm with a maximum of 6584MPa (412% increase respect PA6 unfilled) at 20 wt% loading. Fig. 7 compares the effect of the xGnP type and the extrusion speed
on the mechanical properties of PA6. It is observed that for both types of xGnPs, the Young’s modulus increases with the extrusion speed, with a more gradual increase for C‐500. In the case of M‐5, a sharp increase of Young’s modulus occurs between 7.5 and 10wt% M‐5 addition and the curve levels when M‐5 approaches 15wt%. In order to further asses the influence of GNPs on the composite
properties, Young’s modulus and crystallinity have been plotted
against the GNPs content in Fig. 8. For both M‐5 and C‐500, and for both extrusion speeds, 50 and 200rpm, Young’s modulus and crystallinity increase with the GNPs loading. There is a large increase in crystallinity (from 35% to 79% depending on xGnP grade and screw speed, see table 3) when 1wt% GNPs are added. This is followed by a slow but steady increase in the modulus with further addition of GNPs and this can be attributable to the gradually increasing crystallinity. Crystallinity levels increase relatively slowly after 1 wt% addition with little or no accompanying increase in modulus for the M‐5 particles until a 10% loading indicating that increasing crystallinity is having no effect on modulus in this region for M‐5 particles. There is a gradual increase in crystallinity for the C‐500 particles between 1wt% and 10wt% after which crystallinity levels out. The modulus however increases more rapidly than crystallinity between 1 wt% and 10 wt% and then increases at a greater rate between 10wt% and 20wt% when the crystallinity has plateaued out. This indicates that modulus increase here is not associated with crystallinity but with increasing GNPs content.34
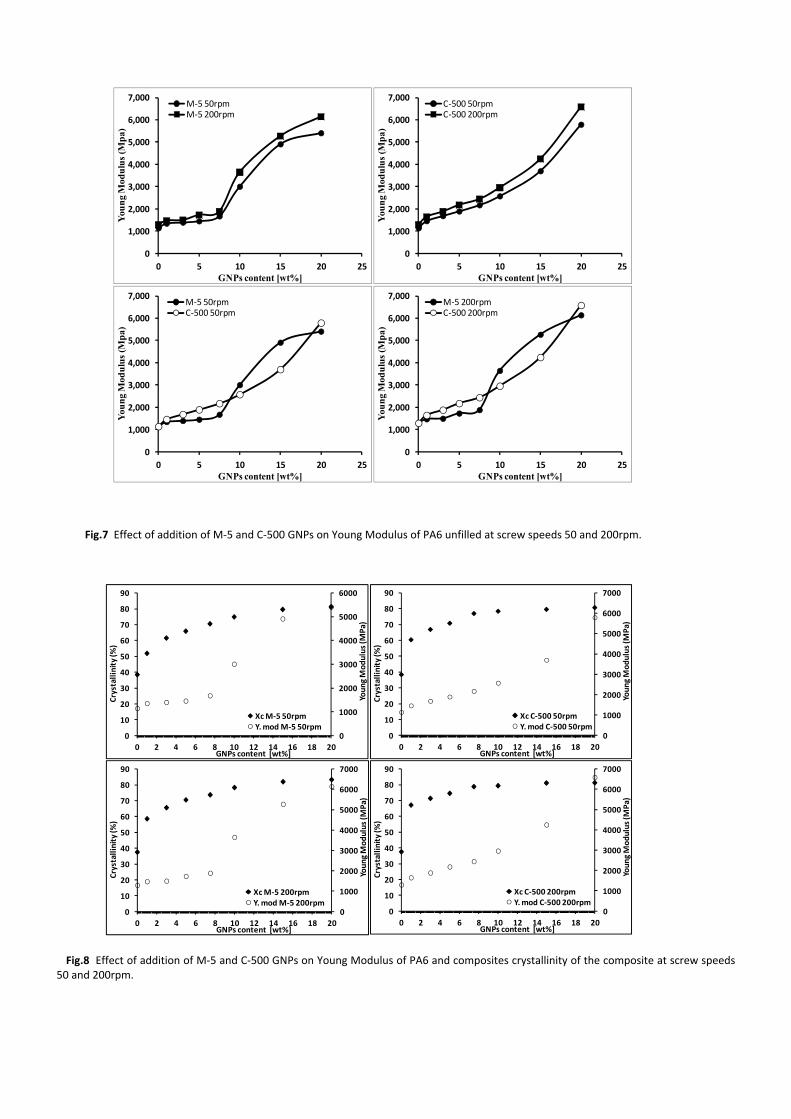
Fig.7 Effect of addition of M‐5 and C‐500 GNPs on Young Modulus of PA6 unfilled at screw speeds 50 and 200rpm.
Fig.8 Effect of addition of M‐5 and C‐500 GNPs on Young Modulus of PA6 and composites crystallinity of the composite at screw speeds
50 and 200rpm.
0
1,000
2,000
3,000
4,000
5,000
6,000
7,000
0 5 10 15 20 25
You
ng
Mod
ulu
s (M
pa)
GNPs content [wt%]
M‐5 50rpmC‐500 50rpm
0
1,000
2,000
3,000
4,000
5,000
6,000
7,000
0 5 10 15 20 25
You
ng
Mod
ulu
s (M
pa)
GNPs content [wt%]
M‐5 200rpmC‐500 200rpm
0
1,000
2,000
3,000
4,000
5,000
6,000
7,000
0 5 10 15 20 25
You
ng
Mod
ulu
s (M
pa)
GNPs content [wt%]
M‐5 50rpmM‐5 200rpm
0
1,000
2,000
3,000
4,000
5,000
6,000
7,000
0 5 10 15 20 25
You
ng
Mod
ulu
s (M
pa)
GNPs content [wt%]
C‐500 50rpmC‐500 200rpm
0
1000
2000
3000
4000
5000
6000
7000
0
10
20
30
40
50
60
70
80
90
0 2 4 6 8 10 12 14 16 18 20
Young Modulus (M
Pa)
Crystallinity (%
)
GNPs content [wt%]
Xc C‐500 50rpmY. mod C‐500 50rpm
0
1000
2000
3000
4000
5000
6000
7000
0
10
20
30
40
50
60
70
80
90
0 2 4 6 8 10 12 14 16 18 20
Young Modulus (M
Pa)
Crystallinity (%
)
GNPs content [wt%]
Xc C‐500 200rpmY. mod C‐500 200rpm
0
1000
2000
3000
4000
5000
6000
7000
0
10
20
30
40
50
60
70
80
90
0 2 4 6 8 10 12 14 16 18 20
Young Modulus (M
Pa)
Crystallinity (%
)
GNPs content [wt%]
Xc M‐5 200rpmY. mod M‐5 200rpm
0
1000
2000
3000
4000
5000
6000
0
10
20
30
40
50
60
70
80
90
0 2 4 6 8 10 12 14 16 18 20
Young Modulus (M
Pa)
Crystallinity (%
)
GNPs content [wt%]
Xc M‐5 50rpmY. mod M‐5 50rpm
It is not clear why the modulus of the M‐5 composites increases at
such a rapid rate at loadings in excess of 8wt% but this jump in properties is also apparent for the electrical properties of the M‐5 composites (See Fig. 10 and 11) and may indicate an improvement in dispersion for these blends. It should however be pointed out that dispersion normally gets worse at increasing loading of nanoparticles so improved dispersion may not be the cause of the enhancement. There are very few publications on PA6/ GNPs composites and only one of them was found to report tensile properties results. Thanh et al.28 studied the effect of GNPs on the structure and mechanical properties of PA6‐elastomer nanocomposites. They used similar PA6 and GNPs grades but a different method of processing (mixer), obtaining a similar trend in PA6/GNPs tensile properties with a maximum Young’s Modulus of 2300MPa (42% enhancement over the unfilled PA6) at 10% GNPs (maximum loading in their study). In our studies an enhancement in Young’s Modulus of 183% at 10% M‐5 at 200rpm (a bit lower values for C‐500 composites and 50rpm extrusion speed, see table 4). The improved results in our study are likely due to improved dispersion of the nanoplatelets in the polymer as a result of the twin screw extrusion process deployed. Increasing the screw speed during melt‐mixing of polymer nanocomposites increased the shear forces applied and consequently the mixing energy input also increased. This led to a decrease agglomerate size as well as enhancing the dispersion and distribution of nanofillers agglomerates and therefore enhances the bulk properties of the final composites.28
Other studies on similar nanocomposites with different polymers but similar GNPs grades showed similar trends to our research. King et al.35 studied PC/GNPs systems produced via extrusion and injection molding and reported a tensile modulus increase from 2.2GPa (neat polymer) to 3.5GPa at 8%wt GNP (59% improvement) and 5.9GPa at 15%wt GNP (168% improvement). Kalaitzidou et al.,36 in a study of an extruded and injection molded PP/GNP system, reported a tensile modulus of ~3GPa at 8wt% GNP and ~5GPa at 15wt% GNPs. In addition to the aggregation, orientation, and alignment of the
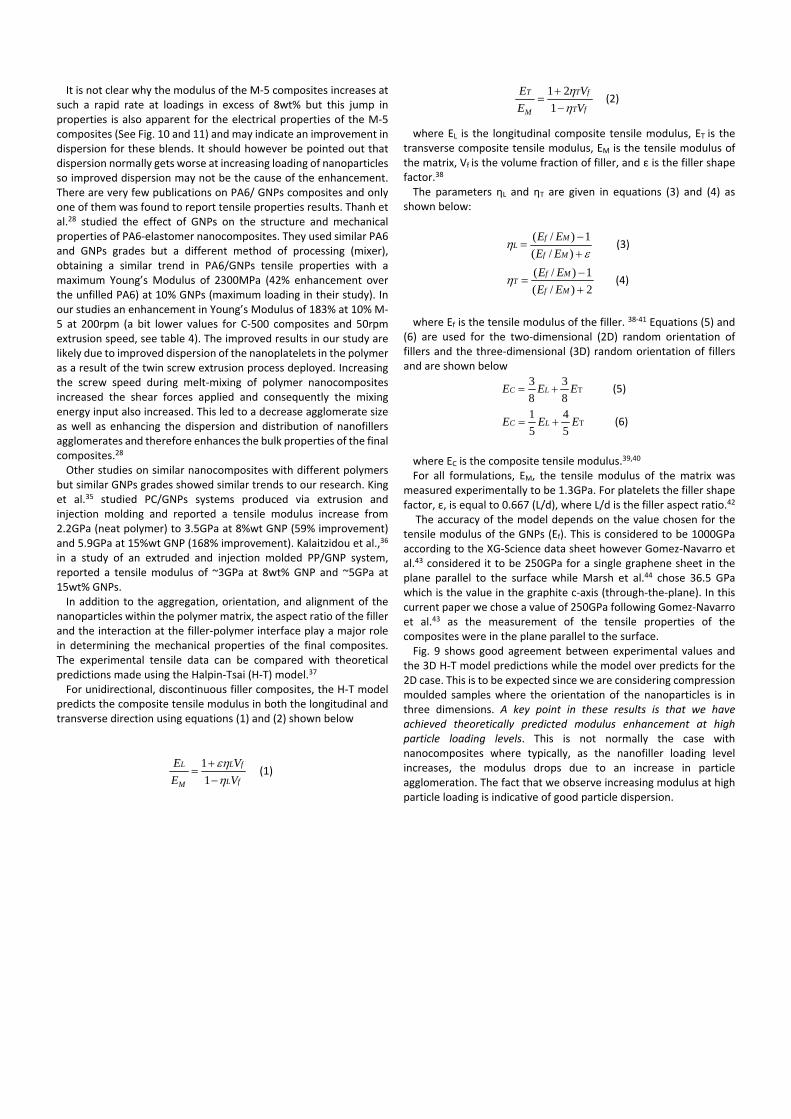
nanoparticles within the polymer matrix, the aspect ratio of the filler and the interaction at the filler‐polymer interface play a major role in determining the mechanical properties of the final composites. The experimental tensile data can be compared with theoretical predictions made using the Halpin‐Tsai (H‐T) model.37 For unidirectional, discontinuous filler composites, the H‐T model
predicts the composite tensile modulus in both the longitudinal and transverse direction using equations (1) and (2) shown below
fL
fL
M
L
V
V
E
E
1
1 (1)
fT
fT
M
T
V
V
E
E
1
21 (2)
where EL is the longitudinal composite tensile modulus, ET is the transverse composite tensile modulus, EM is the tensile modulus of the matrix, Vf is the volume fraction of filler, and ε is the filler shape factor.38 The parameters ηL and ηT are given in equations (3) and (4) as
shown below:
)/(
1)/(
Mf
MfL
EE
EE (3)
2)/(
1)/(
Mf
MfT
EE
EE (4)
where Ef is the tensile modulus of the filler. 38‐41 Equations (5) and
(6) are used for the two‐dimensional (2D) random orientation of fillers and the three‐dimensional (3D) random orientation of fillers and are shown below
T8
3
8
3EEE LC (5)
T5
4
5
1EEE LC (6)
where EC is the composite tensile modulus.39,40 For all formulations, EM, the tensile modulus of the matrix was
measured experimentally to be 1.3GPa. For platelets the filler shape factor, ε, is equal to 0.667 (L/d), where L/d is the filler aspect ratio.42 The accuracy of the model depends on the value chosen for the
tensile modulus of the GNPs (Ef). This is considered to be 1000GPa according to the XG‐Science data sheet however Gomez‐Navarro et al.43 considered it to be 250GPa for a single graphene sheet in the plane parallel to the surface while Marsh et al.44 chose 36.5 GPa which is the value in the graphite c‐axis (through‐the‐plane). In this current paper we chose a value of 250GPa following Gomez‐Navarro et al.43 as the measurement of the tensile properties of the composites were in the plane parallel to the surface. Fig. 9 shows good agreement between experimental values and
the 3D H‐T model predictions while the model over predicts for the 2D case. This is to be expected since we are considering compression moulded samples where the orientation of the nanoparticles is in three dimensions. A key point in these results is that we have achieved theoretically predicted modulus enhancement at high particle loading levels. This is not normally the case with nanocomposites where typically, as the nanofiller loading level increases, the modulus drops due to an increase in particle agglomeration. The fact that we observe increasing modulus at high particle loading is indicative of good particle dispersion.

Fig.9 Experimental data and Halpin‐Tsai Models prediction of the effect of M‐5 and C‐500 GNPs addition on the Young Modulus of unfilled PA6 extruded at 50 rpm and 200rpm.
Fig. 10 shows the change in electrical properties of the composites as the loading of particles is increased. The conductivity in the M‐5 composites increases very slowly with increasing loading up to 8wt% and then increases at a faster rate, similar to the modulus enhancement reported earlier (see Fig. 11 for comparison). For the C‐500 particles there is again a gradual increase in conductivity with increasing particle loading however the maximum conductivity achieved is lower than that for the M‐5 particles at the higher extrusion speed. Increasing extrusion speed has the effect of
increasing the conductivity of the composites which is likely to be due to a better dispersion of the nanoparticles in the matrix. Similar behaviour has been found in other polymer nanocomposite
systems 24, 45‐47 where increasing rotor speed (and the energy input to the system increased) improved nanofiller disentanglement and dispersion, and facilitated the formation of more conductive filler pathways. The electrical percolation threshold for the composites melt‐mixed at 50 and 200 rpm for both M‐5 and C‐500 GNPs is between 10‐15 wt% GNPs.
Fig.10 Effect of addition of M‐5 and C‐500 GNPs to electrical resistivity properties of PA6 unfilled and PA6/ GNPs composites at two
different screw speeds 50 and 200rpm.
0
2
4
6
8
10
12
0 2 4 6 8 10 12 14 16 18 20
You
ng
Mod
ulu
s (G
Pa)
% wt. xGNP M-5
M-5 Experimental Tensile Modulus
M-5 2D Halpin-tsai Model
M-5 3D Halpin-tsai Model
0
2
4
6
8
10
12
0 2 4 6 8 10 12 14 16 18 20
You
ng
Mod
ulu
s (G
Pa)
% wt. xGNP M-5
M-5 Experimental Tensile Modulus
M-5 2D Halpin-tsai Model
M-5 3D Halpin-tsai Model
0
2
4
6
8
10
12
0 5 10 15 20
You
ng
Mod
ulu
s (G
Pa)
% wt. xGNP C-500
C-500 Experimental Tensile Modulus
C-500 2D Halpin-tsai Model
C-500 3D Halpin-tsai Model
0
2
4
6
8
10
12
0 5 10 15 20
You
ng
Mod
ulu
s (G
Pa)
% wt. xGNP C-500
C-500 Experimental Tensile Modulus
C-500 2D Halpin-tsai Model
C-500 3D Halpin-tsai Model
50rpm
200rpm
50rpm
200rpm
1.E+00
1.E+02
1.E+04
1.E+06
1.E+08
1.E+10
1.E+12
1.E+14
1.E+16
1.E+18
0 2 4 6 8 10 12 14 16 18 20
Vol
um
e R
esis
tivi
ty (
Oh
m.c
m)
xGnPs content [wt%]
PA6/ M5 - 50rpm
PA6/C500 - 50rpm
1.E+00
1.E+02
1.E+04
1.E+06
1.E+08
1.E+10
1.E+12
1.E+14
1.E+16
1.E+18
0 2 4 6 8 10 12 14 16 18 20
Vol
um
e R
esis
tivi
ty (
Oh
m.c
m)
xGnPs content [wt%]
PA6/ M5 - 200rpm
PA6/C-500 - 200rpm
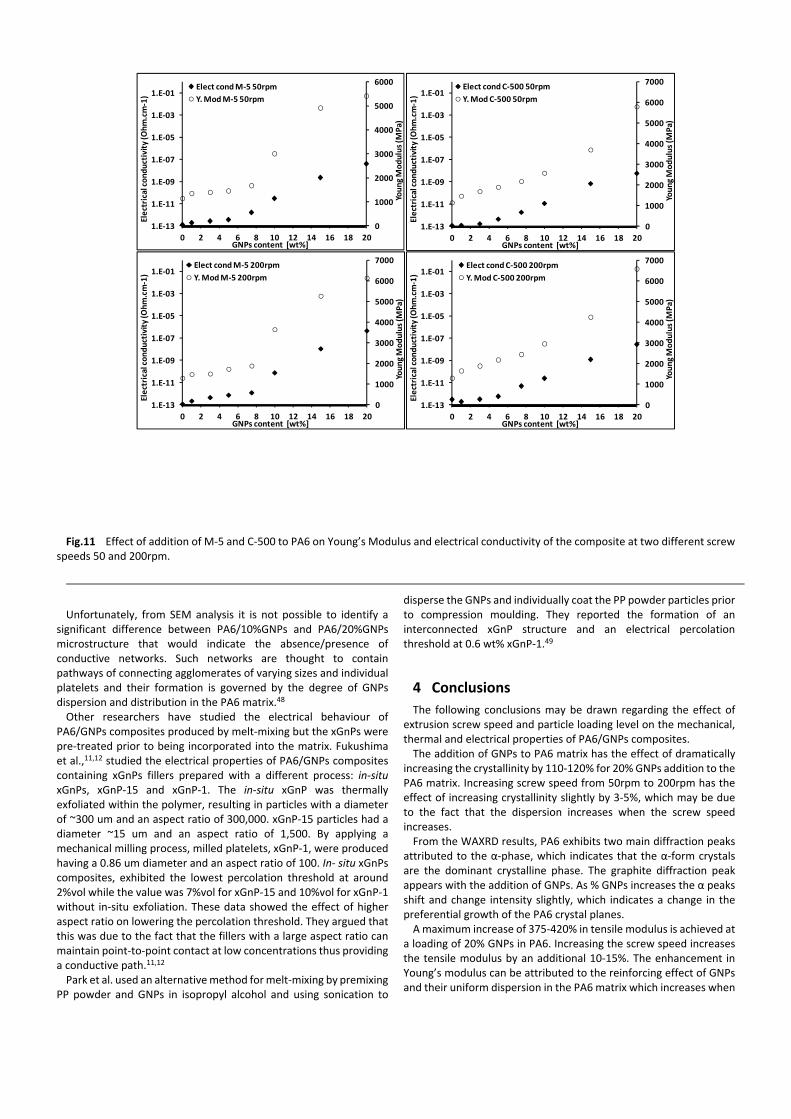
Fig.11 Effect of addition of M‐5 and C‐500 to PA6 on Young’s Modulus and electrical conductivity of the composite at two different screw
speeds 50 and 200rpm.
Unfortunately, from SEM analysis it is not possible to identify a
significant difference between PA6/10%GNPs and PA6/20%GNPs microstructure that would indicate the absence/presence of conductive networks. Such networks are thought to contain pathways of connecting agglomerates of varying sizes and individual platelets and their formation is governed by the degree of GNPs dispersion and distribution in the PA6 matrix.48 Other researchers have studied the electrical behaviour of
PA6/GNPs composites produced by melt‐mixing but the xGnPs were pre‐treated prior to being incorporated into the matrix. Fukushima et al.,11,12 studied the electrical properties of PA6/GNPs composites containing xGnPs fillers prepared with a different process: in‐situ xGnPs, xGnP‐15 and xGnP‐1. The in‐situ xGnP was thermally exfoliated within the polymer, resulting in particles with a diameter of ~300 um and an aspect ratio of 300,000. xGnP‐15 particles had a diameter ~15 um and an aspect ratio of 1,500. By applying a mechanical milling process, milled platelets, xGnP‐1, were produced having a 0.86 um diameter and an aspect ratio of 100. In‐ situ xGnPs composites, exhibited the lowest percolation threshold at around 2%vol while the value was 7%vol for xGnP‐15 and 10%vol for xGnP‐1 without in‐situ exfoliation. These data showed the effect of higher aspect ratio on lowering the percolation threshold. They argued that this was due to the fact that the fillers with a large aspect ratio can maintain point‐to‐point contact at low concentrations thus providing a conductive path.11,12 Park et al. used an alternative method for melt‐mixing by premixing
PP powder and GNPs in isopropyl alcohol and using sonication to
disperse the GNPs and individually coat the PP powder particles prior to compression moulding. They reported the formation of an interconnected xGnP structure and an electrical percolation threshold at 0.6 wt% xGnP‐1.49
4 Conclusions
The following conclusions may be drawn regarding the effect of extrusion screw speed and particle loading level on the mechanical, thermal and electrical properties of PA6/GNPs composites. The addition of GNPs to PA6 matrix has the effect of dramatically
increasing the crystallinity by 110‐120% for 20% GNPs addition to the PA6 matrix. Increasing screw speed from 50rpm to 200rpm has the effect of increasing crystallinity slightly by 3‐5%, which may be due to the fact that the dispersion increases when the screw speed increases. From the WAXRD results, PA6 exhibits two main diffraction peaks
attributed to the α‐phase, which indicates that the α‐form crystals are the dominant crystalline phase. The graphite diffraction peak appears with the addition of GNPs. As % GNPs increases the α peaks shift and change intensity slightly, which indicates a change in the preferential growth of the PA6 crystal planes. A maximum increase of 375‐420% in tensile modulus is achieved at
a loading of 20% GNPs in PA6. Increasing the screw speed increases the tensile modulus by an additional 10‐15%. The enhancement in Young’s modulus can be attributed to the reinforcing effect of GNPs and their uniform dispersion in the PA6 matrix which increases when
0
1000
2000
3000
4000
5000
6000
7000
1.E‐13
1.E‐11
1.E‐09
1.E‐07
1.E‐05
1.E‐03
1.E‐01
0 2 4 6 8 10 12 14 16 18 20
Young Modulus (M
Pa)
Electrical conductivity (Ohm.cm‐1)
GNPs content [wt%]
Elect cond C‐500 50rpm
Y. Mod C‐500 50rpm
0
1000
2000
3000
4000
5000
6000
7000
1.E‐13
1.E‐11
1.E‐09
1.E‐07
1.E‐05
1.E‐03
1.E‐01
0 2 4 6 8 10 12 14 16 18 20
Young Modulus (M
Pa)
Electrical conductivity (Ohm.cm‐1)
GNPs content [wt%]
Elect cond C‐500 200rpm
Y. Mod C‐500 200rpm
0
1000
2000
3000
4000
5000
6000
7000
1.E‐13
1.E‐11
1.E‐09
1.E‐07
1.E‐05
1.E‐03
1.E‐01
0 2 4 6 8 10 12 14 16 18 20
Young Modulus (M
Pa)
Electrical conductivity (Ohm.cm‐1)
GNPs content [wt%]
Elect cond M‐5 200rpm
Y. Mod M‐5 200rpm
0
1000
2000
3000
4000
5000
6000
1.E‐13
1.E‐11
1.E‐09
1.E‐07
1.E‐05
1.E‐03
1.E‐01
0 2 4 6 8 10 12 14 16 18 20
Young Modulus (M
Pa)
Electrical conductivity (Ohm.cm‐1)
GNPs content [wt%]
Elect cond M‐5 50rpm
Y. Mod M‐5 50rpm
increasing the screw speed. Good agreement between experimental data and the 3D Halpin‐Tsai model is indicative of good dispersion at high GNPs loadings. A rheological percolation threshold was obtained between 10‐15
wt% GNPs, as indicated by an increase in η* and G’ at low frequencies, the rheological response of the composite is more like a ‘pseudo‐solid’ than a molten liquid.
The electrical conductivity increased as the weight fraction of GNPs
increased, showing an increase of about 6 orders of magnitude on
the addition of up to 15 wt% GNPs. The electrical percolation
threshold for the composites melt‐mixed at 50 and 200 rpm for both
M‐5 and C‐500 GNPs is between 10‐15wt% GNPs. Increasing
extrusion speed increases the conductivity of the composites which
is likely to be due to a better dispersion of the nanoparticles in the
matrix.
Acknowledgements
This article was made possible by NPRP grant # (NPRP5‐039‐2‐014) from the Qatar National Research Fund (a member of Qatar Foundation). The statements made herein are solely the responsibility of the authors. The authors would like to thank Dr. Roda AlThani from Qatar University for the fruitful discussion, and Mr. Graham Garrett from the Polymer Processing Research Centre in Queen’s University of Belfast for sharing his technical expertise in the extrusion process and contribution to data analysis.
References
1 J. R. Potts, D.R. Dreyer, C. W. Bielawski and R. S. Ruoff, Polymer, 2011, 52 (1), 5.
2 H. J. Salavagione, G. Martínez, and G. Ellis, "Graphene‐based polymer nanocomposites." Physics and Applications of Graphene—Experiments, In‐Tech, Rijeka, 2011, 169.
3 B. Li and W‐H. Zhong, J. Mater. Sci., 2011, 46, 5595. 4 H. Kim, A.A. Abdala and C. Macosko, Macromolecules, 2010,
43 (16), 6515. 5 http://nobelprize.org/nobel_prizes/physics/laureates/2010/
press.html 6 X.Y. Ji, Y.P. Cao and X.Q. Feng, Modelling and Simulation in
Mat. Sci. and Eng., 2010, 18, (4), 045005. 7 http://www.rsc.org/chemistryworld/News/2010/June/14061
001.asp. 8 L. T. Drzal and H. Fukushima , Pat. Appl. Publ., U.S., 2004. 9 L. T. Drzal and H. Fukushima, Pat. Appl. Publ., U.S., 2006. 10 K. Kalaitzidou and H. Fukushima and L.T. Drzal, Carbon, 2007,
45, 1446. 11 H. Fukushima and L.T. Drzal, NSTI Nanotech Technical
Proceedings, 2006, 1, 282. 12 H. Fukushima, K. Kalaitzidou and L.T. Drzal, 16th int, 2007,
Kyoto‐Japan. 13 M. Kim, S‐H. Hwang, B‐J. Kim, J‐B. Baek, H‐S. Shin, H‐W. Park,
Y‐B. Park, I‐J. Bae and S‐Y. Lee, Composites: Part B, 2014, 66, 511.
14 W. Liu, I. Do, H. Fukushima and L.T. Drzal, Carbon Letters, 2010, 11, 4, 279.
15 G. Kasaliwal, A. Göldel and P. Pötschke, J.App. Polym. Sci., 2009, 112, 6, 2494.
16 V.L. Bravo, A.N. Hrymak and J.D. Wright, Polym. Eng. Sci., 2000, 40, 2, 525.
17 B. Mayoral, T. McNally and G. Garrett, Macromol. Mater. Eng., 2014, 299, 748.
18 M. R. Nobile, “Rheology of polymer‐carbon nanotube composite melts”, Polymer‐carbon nanotube composites: Preparation, properties and applications, McNally, T., Pötschke, P., Eds., Woodhead Publishing, Cambridge, 2011, 15, 428‐481.
19 J.A. King, M.D. Via, J.M. Keith and F.A. Morrison, J. Comp. Mat., 2009, 43, 25, 3073.
20 P. Pötschke, M. Abdel‐Goad, I. Alig, S. Dudkin and D. Lellinger, Polymer, 2004, 49, 974.
21 F. Du, R.C. Scogna, W. Zhou, S. Brand, J.E. Fischer and K. Winey, Macromolecules, 2004, 37, 24, 9048.
22 B. Mayoral, J. Lopes and T. McNally, Macromol. Mater. Eng., 2013, 298, 1.
23 K. Kalaitzidou, H. Fukushima and L.T. Drzal, Carbon, 2007, 45, 1446.
24 B. Mayoral, P. R. Hornsby, T. McNally, T. Schiller, K. Jack and D. J. Martin, RSC Advances, 2013, 3, 5162.
25 M. A. AlMaadeed, R. Kahraman, P. N. Khanam and N. Madi, Materials & Design, 2012, 42, 289.
26 M.A. AlMaadeed, M. Ouedernii and P. N. Khanam, Materials & Design, 2013, 47, 725.
27 G. Gamon, Ph. Evon and L. Rigal, Industrial Crops and Products, 2013, 46, 173.
28 T.D. Thanh, L. Kapralkova, J. Hromadkova and I. Kelnar, Eur. Polym. J., 2014, 50, 39.
29 I. Kelnar, V. Khunova, J. Kotek and L. Kapralkova, Polymer, 2007, 48, 5332.
30 T.X. Liu, Z.H. Liu, K.X. Ma, L. Shen, K.Y. Zeng and C.B. He, Comp. Sci. Tech., 2003, 63, 331.
31 P. Zhang, K. Zhu, L. Su and R. Xiao, Adv. Mat. Res., 2013, 621, 31.
32 A. O’Neill, D. Bakirtzis and D. Dixon, Eur. Polym. J., 2014, 59, 353.
33 T.M. Wu and C.S. Liao, Macromol. Chem. Phys., 2000, 201, 2820.
34 M. A. AlMaadeed, Z. Nógellová, M. Mičušík, I. Novák and I. Krupa, Materials & Design, 2014, 53, 29.
35 J. A. King, M. D. Via, F. A. Morrison, K. R. Wiese, E. A. Beach, M. J. Cieslinski and G. R. Bogucki, J. Comp. Mat., 2012, 46(9), 1029.
36 K. Kalaitzidou, H. Fukushima and L.T. Drzal, Composites, Part A, 2007, 38(7), 1675.
37 J.C. Halpin and S.W. Tsai, Air Force Technical Report AFML‐TR 67‐423, 1967, Dayton, OH.
38 J.C. Halpin and J.L. Kardos, Polym. Eng. Sci., 1976, 16, 344. 39 B.D. Agarwal and L.J. Broutman, Analysis and performance of
fiber composites, 1980, New York, NY: Wiley. 40 P.K. Mallick, Composites engineering handbook, 1997,
NewYork, NY, Marcel Dekker, Inc. 41 J.C. Halpin, J. Compos. Mater., 1969, 3, 732. 42 J.A. King, D.R. Klimek, I. Miskioglu and G.M. Odegard, J. Com.
Mat., 2014, 49(6), 659. 43 C. Gomez‐Navarro, M. Burghard, K. Kern, Nano Lett., 2008, 8,
2045. 44 H. Marsh and F. Rodriguez‐Reinoso, Sciences of carbon
materials. 2001, Univ. Alicante, Spain. 45 G. Kasaliwal, A. Göldel and P. Pötschke, J. App. Polym. Sci.,
2009, 112, 2494. 46 G. Kasaliwal, S. Pegel, A. Göldel, P. Pötschke and G. Heinrich,
Polymer, 2010, 51, 2708. 47 B. Krause, P. Pötschke and L. Häuβler, Comp. Sci. Technol.,
2009, 69, 1505. 48 P. Pötschke, S. Dudkin and I. Alig, Polymer, 2003, 44, 5023. 49 Park, H‐M, Kalaitzidou, K., H. Fukushima, and L.T. Drzal.
www.speautomotive.com/.../nanocomposites—part2—paper2—park—msu.pdf., 2007.