Embed Size (px)
Citation preview

Melanie Mucha
Summer Transportation Internship For Diverse Groups
July 25, 2002
National Center for Asphalt Technology Pavement Test Track
Introduction
Research in the form of a road test track provides a logical method to test pavement
behavior under typical roadway conditions. The most recent road test track, the National Center
for Asphalt Technology (NCAT) Test Track, was constructed in 1998. The NCAT Test Track,
located at Opelika, Alabama, was developed to conduct research focused on flexible pavement
performance designs (Asphalt Technology News 1). Road tests conducted prior to NCAT track
have produced valuable information on roadway design and construction procedures. Before
discussing the details of the NCAT Test Track, it is important to understand several of the
methods and objectives used in previous road test tracks.
The AASHO Road Test (American Association of State Highway Officials) was
conducted in Ottawa, Illinois from 1958 to 1962 (Federal Highway Administration I-2). The
American Association of State Highway and Transportation Officials (AASHTO), formerly
known as AASHO, is a non-profit highway and transportation association that provides standard
specifications for the operation and maintenance of the nations’ transportation system (AASHTO
1). The AASHO Test focused on variables such as the effect of pavement thickness,
environment, and the magnitude of the applied loads. The test area included four large and two
Mucha 2
smaller test loops. Results provided information about environmental and structural issues and
were used to form the basis of the AASHTO Design Method (Warren 12,25).
The WesTrack Road Test was conducted from 1996 to 1999, southeast of Reno, Nevada.
The WesTrack facility was constructed under a contract awarded by the Federal Highway
Administration (FHWA), and the “Accelerated Field Test Performance-Related Specifications
for Hot Mix Asphalt Construction” study was completed in 1999. The purpose of this test was to
“evaluate the direct effects of deviations of materials and construction properties” (WesTrack 1).
Many of the design and loading procedures used at WesTrack were modeled at the NCAT Test
Track. WesTrack was a 1.8-mile oval track divided into thirty-four test sections. The track was
loaded over a two-year period using driverless vehicle technology. Test results provided useful
information in areas such as quality control/quality assurance (QC/QA) construction methods,
pavement rehabilitation and materials specifications (WesTrack 2). However, there was some
concern that the driverless vehicles did not provide a realistic effect of wear on the pavement
surface. The computer controlled trucks continuously traveled in the same wheel path causing
extreme wear in that path. Questions arose as to whether these results were an accurate
indication of actual pavement performance under normal traffic conditions.
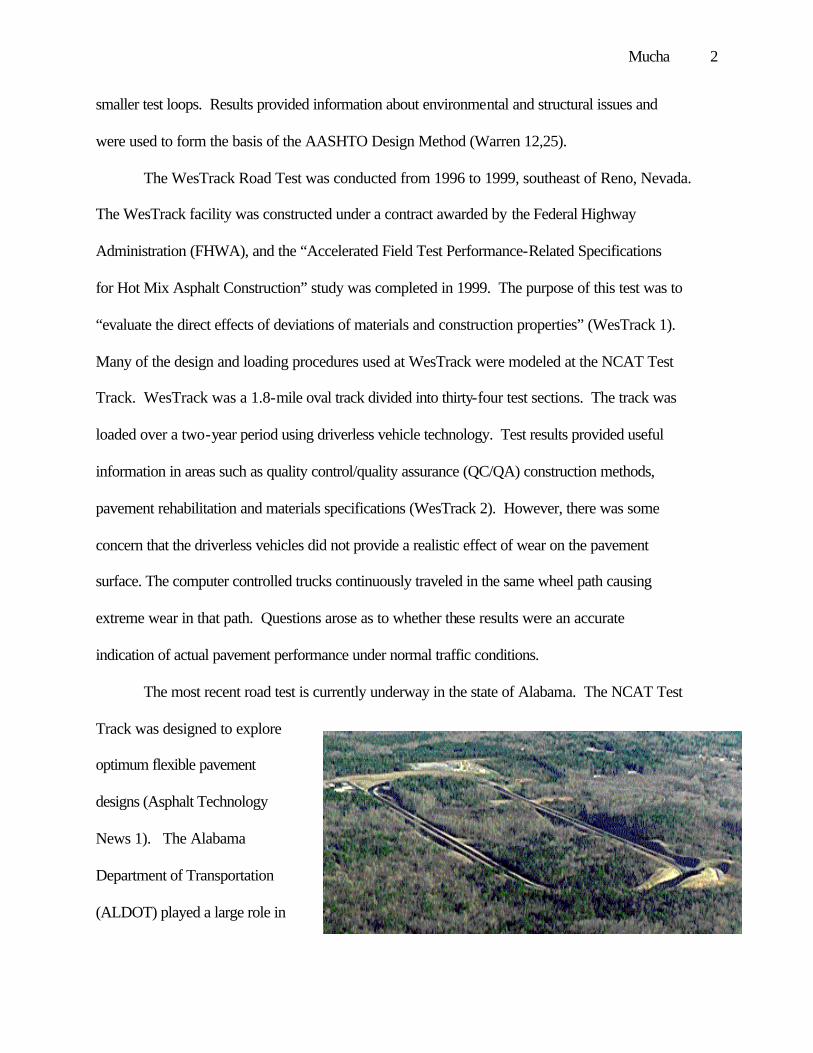
The most recent road test is currently underway in the state of Alabama. The NCAT Test
Track was designed to explore
optimum flexible pavement
designs (Asphalt Technology
News 1). The Alabama
Department of Transportation
(ALDOT) played a large role in

Mucha 3
bringing the NCAT Test Track facility to the state of Alabama. Before the idea of the NCAT
Test Track was considered, a location for the WesTrack road test was needed. Among various
other possibilities, Alabama was under consideration as a site location. In the end, the WesTrack
facility was placed on the Nevada Automotive Test Center proving grounds, southeast of Reno,
Nevada (Westrack 2).
Mr. Mack Roberts, Alabama Director of Transportation at the time, was committed to
bringing a test track facility to the state. He concluded that a test track in Alabama would be a
valuable resource with potential benefits. A large amount of money is spent each year on asphalt
pavements and results from track research through accelerated loading of various design mixes
was expected to provide performance data so that the life cycle costs of asphalt pavements could
be optimized.
Aside from the potential benefits of having the test track, Alabama had a valuable
resource already available. The NCAT research and testing facility, then located at Auburn
University, provided a logical site for conducting research on the test track. NCAT was
developed in 1986, under an
agreement between the
National Asphalt Pavement
Association (NAPA) Education
Foundation and Auburn
University, to focus on
improving performance of
HMA designs through practical research, education and information services (NCAT 1). Hot
Mix Asphalt (HMA) industry contractors, product suppliers and equipment manufacturers

Mucha 4
provided funding for the current NCAT facility, located near Auburn University. Both NCAT
and NAPA were supportive of ALDOT’s commitment to the test track. Mr. Jimmy Butts, who
succeeded Mr. Roberts as Director of Transportation, followed up with the commitment to build
the track. Chief Engineer, Ray Bass (a former Director), was and continues to be a strong
supporter to the test facility and provided continued support as Mr. Roberts left and Mr. Butts
assumed the position as Director. With strong support from ALDOT, NCAT, and NAPA
construction of the NCAT Test Track broke ground in September 1998.
Auburn University purchased land for the new facility. David Volkert & Associates was
the design consultant for the track. ALDOT provided approximately $7.5 million for
construction of the facility, $6.2 million for the test track through the base mix and $1.4 million
for the laboratory and truck maintenance buildings. Construction of the track was divided into
two phases. W.S. Newell was awarded the contract for first phase which included clearing and
grubbing and ending with completion of the sub grade (Asphalt Technology News 1). Couch-
APAC was awarded the contract for the second phase of construction, which included the
pavement structure and experimental mixes (Asphalt Technology News 1). The contract for
laboratory and truck maintenance buildings was awarded to W.W. Dyar. Once the facility was
constructed, NCAT was responsible for operation of the facility and for completing the
performance studies conducted.
In addition to Alabama, nine states participated in the research at the test track. Florida,
Georgia, Indiana, Mississippi, North Carolina, Oklahoma, South Carolina, Tennessee, and
FHWA are participants in the 2000-2002 research. “The states will fund track operation through
the purchase of test sections and share in the costs associated with constructing, trafficking,
collecting and analyzing data on its test section” (Hot Mix Asphalt Technology News 11).

Mucha 5
FUNDING FOR THE NCAT TEST TRACK
63%
33%
4%
Alabama State Sponsors FHWA
CONSTRUCTION OF FACILITY
DOLLAR AMOUNTS
Alabama - Phase 1 $2,290,855.03 Alabama - Phase 2 $3,838,679.32 Alabama - Onsite
Buildings $1,418,262.59
Total $7,547,796.94 POOL FUND STUDY
Florida $495,000.00 Indiana $300,000.00
North Carolina $495,000.00 South Carolina $548,774.45
Georgia $495,000.00 Mississippi $495,000.00 Oklahoma $495,000.00 Tennessee $495,000.00
Purdue University $195,000.00 Total Pool Fund $4,013,774.45
TEA-21 FHWA $500,000.00
TOTAL COST $12,061,571.39
Mucha 6
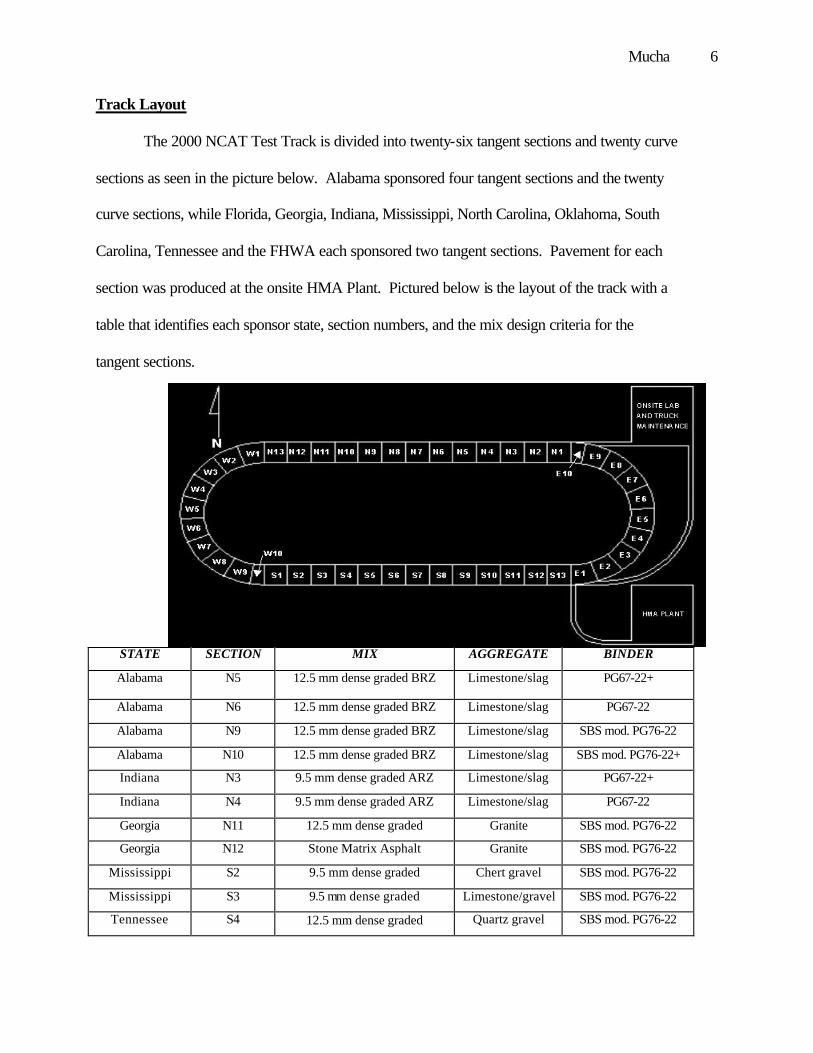
Track Layout
The 2000 NCAT Test Track is divided into twenty-six tangent sections and twenty curve
sections as seen in the picture below. Alabama sponsored four tangent sections and the twenty
curve sections, while Florida, Georgia, Indiana, Mississippi, North Carolina, Oklahoma, South
Carolina, Tennessee and the FHWA each sponsored two tangent sections. Pavement for each
section was produced at the onsite HMA Plant. Pictured below is the layout of the track with a
table that identifies each sponsor state, section numbers, and the mix design criteria for the
tangent sections.
STATE SECTION MIX AGGREGATE BINDER
Alabama N5 12.5 mm dense graded BRZ Limestone/slag PG67-22+
Alabama N6 12.5 mm dense graded BRZ Limestone/slag PG67-22
Alabama N9 12.5 mm dense graded BRZ Limestone/slag SBS mod. PG76-22
Alabama N10 12.5 mm dense graded BRZ Limestone/slag SBS mod. PG76-22+
Indiana N3 9.5 mm dense graded ARZ Limestone/slag PG67-22+
Indiana N4 9.5 mm dense graded ARZ Limestone/slag PG67-22
Georgia N11 12.5 mm dense graded Granite SBS mod. PG76-22
Georgia N12 Stone Matrix Asphalt Granite SBS mod. PG76-22
Mississippi S2 9.5 mm dense graded Chert gravel SBS mod. PG76-22
Mississippi S3 9.5 mm dense graded Limestone/gravel SBS mod. PG76-22
Tennessee S4 12.5 mm dense graded Quartz gravel SBS mod. PG76-22

Mucha 7
Tennessee S5 12.5 mm dense graded Limestone SBS mod. PG76-22
Florida S6 12.5 mm dense graded ARZ Limestone/RAP PG67-22
Florida S7 12.5 mm dense graded BRZ Limestone/RAP PG67-22
South Carolina S8 12.5 mm dense graded Granite SBS mod. PG76-22
South Carolina S9 12.5 mm dense graded BRZ Granite PG67-22
North Carolina S10 12.5 mm dense graded ARZ Granite PG67-22
North Carolina S11 9.5mm dense graded Granite PG67-22
Oklahoma S12 12.5 mm dense graded (Hveem design)
Limestone PG70-28
Oklahoma S13 12.5 mm dense graded ARZ Granite PG70-28
FHWA N7 12.5 mm dense graded BRZ Limestone/slag SBR mod. PG76-22+
FHWA N8 12.5 mm dense graded BRZ Limestone/slag SBR mod. PG76-22
*ARZ – Above restricted zone (fine) gradation. Plus sign – optimum plus ½ % binder *BRZ – Below restricted zone (coarse) gradation.
Materials and Structure
The 1.7-mile track was constructed with a uniform structural buildup up to the placement
of the experimental mixes (top 4 inches). The picture seen to the right is the typical cross-section
layout used at the track. Looking from bottom to top, layers consist of 12 inches of improved
roadbed, 6 inches of crushed granite base, 5 inches of asphalt treated permeable base, 9 inches of
superpave lower base, 6 inches of
superpave upper base, and 4 inches of
experimental mix (NCAT 70).
The only variation in the pavement
structure of the track is found in the
experimental surface mixes. The track is
divided into 200-foot tangent and curve
test sections, each made up of a mix
Mucha 8
selected by the sponsor. With a primary focus on rutting, sponsors were able to compare the
effects of various mix design, aggregate, and binder options (Progress Report 2). Sponsors were
responsible for provided the contractor with materials for the mix designs used on their sections
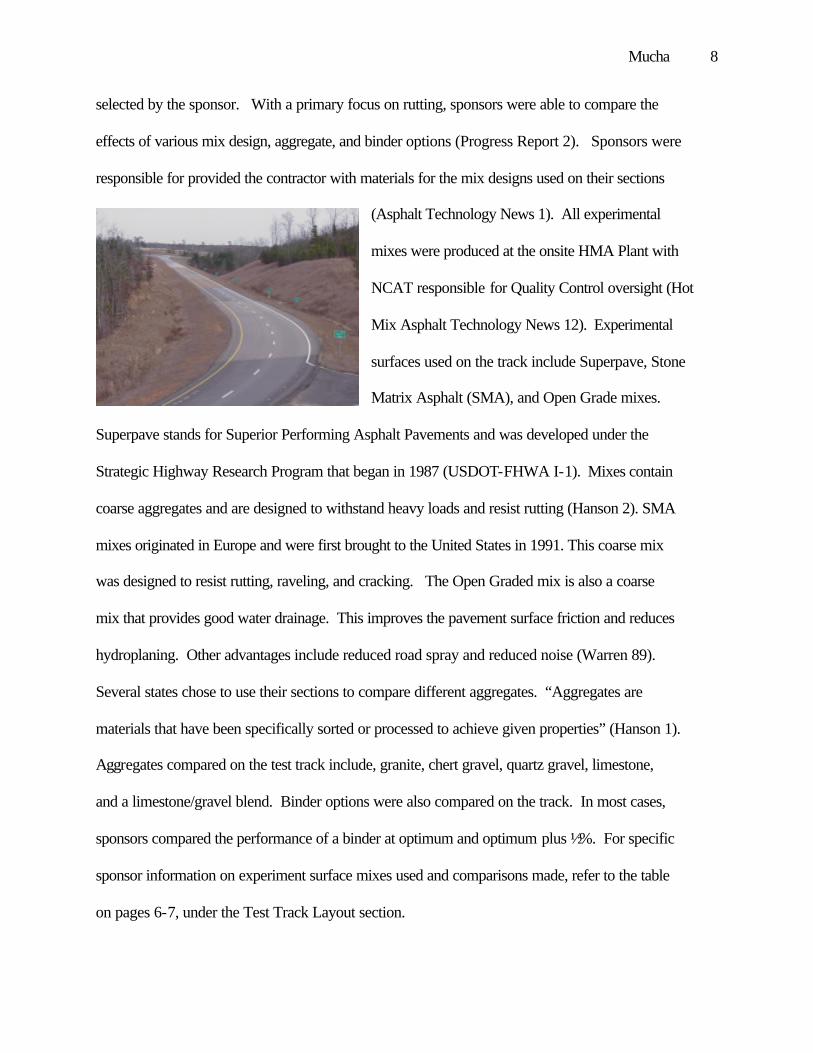
(Asphalt Technology News 1). All experimental
mixes were produced at the onsite HMA Plant with
NCAT responsible for Quality Control oversight (Hot
Mix Asphalt Technology News 12). Experimental
surfaces used on the track include Superpave, Stone
Matrix Asphalt (SMA), and Open Grade mixes.
Superpave stands for Superior Performing Asphalt Pavements and was developed under the
Strategic Highway Research Program that began in 1987 (USDOT-FHWA I-1). Mixes contain
coarse aggregates and are designed to withstand heavy loads and resist rutting (Hanson 2). SMA
mixes originated in Europe and were first brought to the United States in 1991. This coarse mix
was designed to resist rutting, raveling, and cracking. The Open Graded mix is also a coarse
mix that provides good water drainage. This improves the pavement surface friction and reduces
hydroplaning. Other advantages include reduced road spray and reduced noise (Warren 89).
Several states chose to use their sections to compare different aggregates. “Aggregates are
materials that have been specifically sorted or processed to achieve given properties” (Hanson 1).
Aggregates compared on the test track include, granite, chert gravel, quartz gravel, limestone,
and a limestone/gravel blend. Binder options were also compared on the track. In most cases,
sponsors compared the performance of a binder at optimum and optimum plus ½ %. For specific
sponsor information on experiment surface mixes used and comparisons made, refer to the table
on pages 6-7, under the Test Track Layout section.
Mucha 9
Loading
In order to produce pavement fatigue, the track is loaded with 10-million Equivalent
Single Axle Loads (ESALs) over a two-year period (HMAT News 11). In relation to the life of a
pavement this is equivalent to approximately 15 years of wear (Asphalt Technology News 2). A
trucking contract was awarded to Covenant Transport to provide truck tractors, drivers, and
maintenance. Fuel for the trucks is supplied by NCAT and the usage is monitored in relation to
pavement conditions (Progress Report 2). Loading on the track began in October 2000, with one
truck. Addition trucks were phased in, and currently four trucks run on the track Tuesday
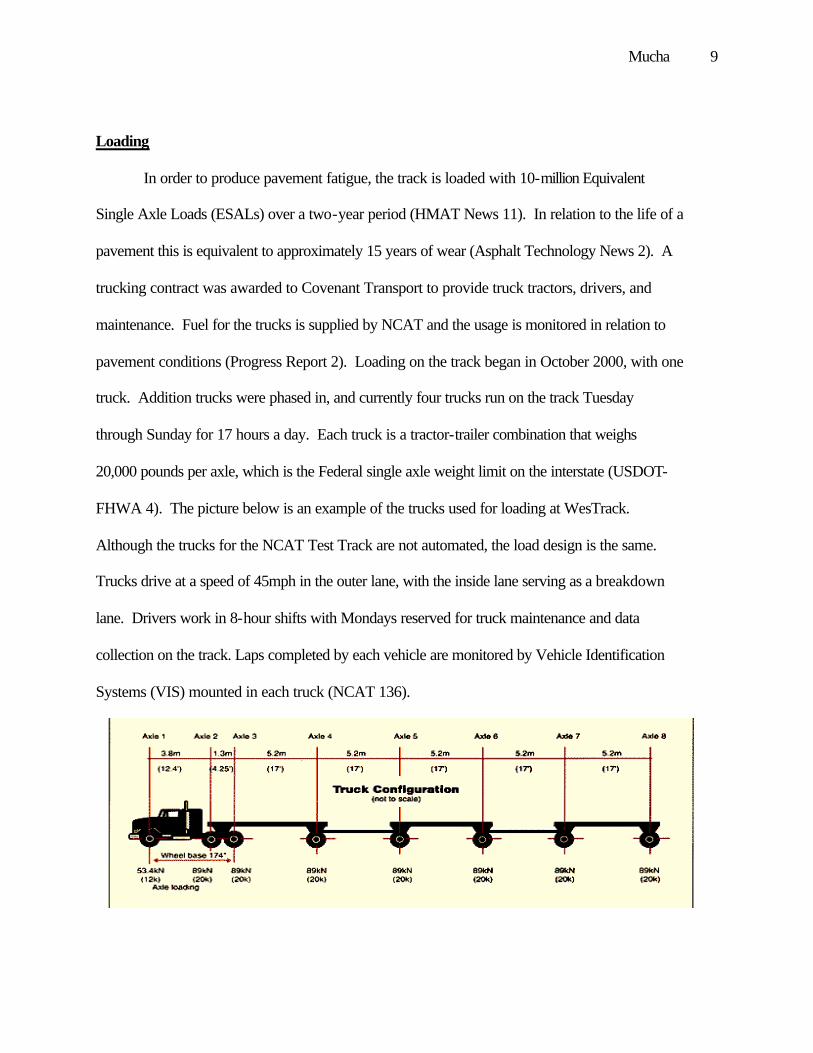
through Sunday for 17 hours a day. Each truck is a tractor-trailer combination that weighs
20,000 pounds per axle, which is the Federal single axle weight limit on the interstate (USDOT-
FHWA 4). The picture below is an example of the trucks used for loading at WesTrack.
Although the trucks for the NCAT Test Track are not automated, the load design is the same.
Trucks drive at a speed of 45mph in the outer lane, with the inside lane serving as a breakdown
lane. Drivers work in 8-hour shifts with Mondays reserved for truck maintenance and data
collection on the track. Laps completed by each vehicle are monitored by Vehicle Identification
Systems (VIS) mounted in each truck (NCAT 136).

Mucha 10
Performance Analysis
Each Monday track performance analysis is recorded for each section. Research
templates for sections consist of two 25-foot buffer segments and three 50-foot replicate
segments (NCAT 118). Surface distresses of pavement sections are documented on a weekly
basis. The ARAN, mounted on the truck pictured below, measures rutting and roughness.
Density profiles, random nuclear density, and random impedence density tests are performed
every other week to monitor the mat densification in the wheel paths. Pavement cores are taken
monthly and used in the lab to monitor additional compaction and reduction of air voids under
truck traffic (NCAT 187).
In addition to monitoring the pavement performance on the track, mix designs are also
subject to lab experiments. Tests used for the track study measure rutting susceptibility, tensile
strength, and shear strength. Results from the lab experiments are then compared to track results.
Correlation between results is used to determine which lab tests produce the most accurate
Mucha 11
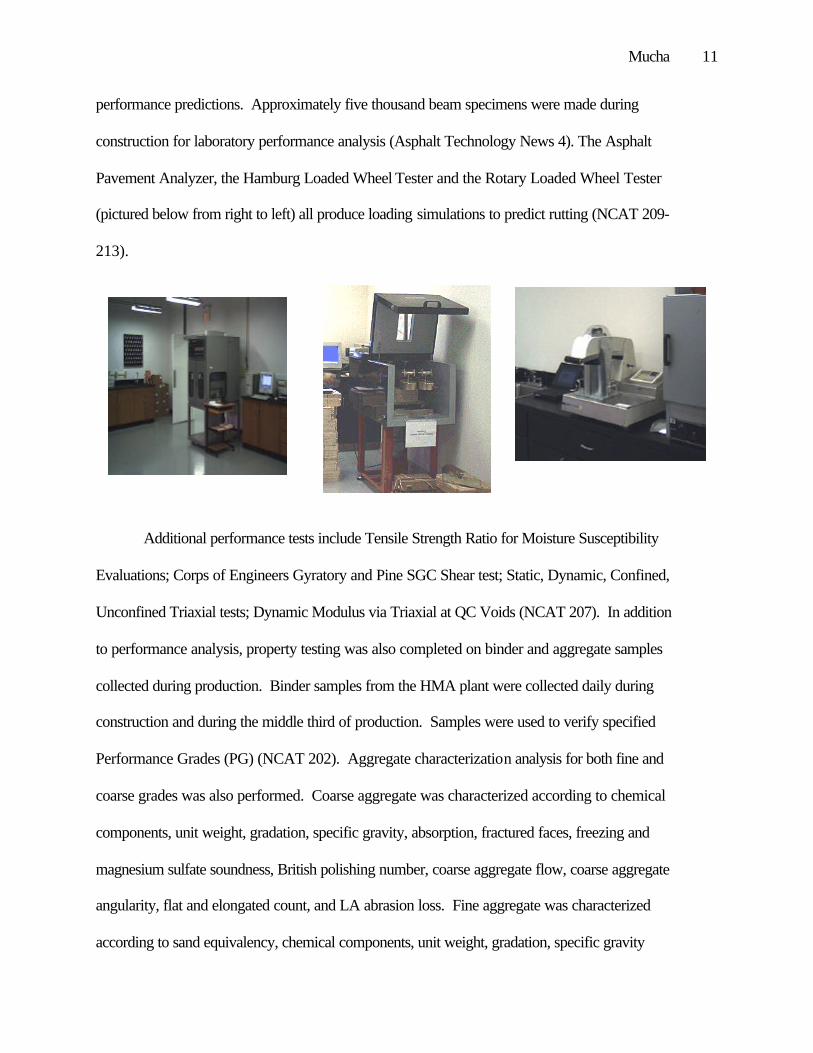
performance predictions. Approximately five thousand beam specimens were made during
construction for laboratory performance analysis (Asphalt Technology News 4). The Asphalt
Pavement Analyzer, the Hamburg Loaded Wheel Tester and the Rotary Loaded Wheel Tester
(pictured below from right to left) all produce loading simulations to predict rutting (NCAT 209-
213).
Additional performance tests include Tensile Strength Ratio for Moisture Susceptibility
Evaluations; Corps of Engineers Gyratory and Pine SGC Shear test; Static, Dynamic, Confined,
Unconfined Triaxial tests; Dynamic Modulus via Triaxial at QC Voids (NCAT 207). In addition
to performance analysis, property testing was also completed on binder and aggregate samples
collected during production. Binder samples from the HMA plant were collected daily during
construction and during the middle third of production. Samples were used to verify specified
Performance Grades (PG) (NCAT 202). Aggregate characterization analysis for both fine and
coarse grades was also performed. Coarse aggregate was characterized according to chemical
components, unit weight, gradation, specific gravity, absorption, fractured faces, freezing and
magnesium sulfate soundness, British polishing number, coarse aggregate flow, coarse aggregate
angularity, flat and elongated count, and LA abrasion loss. Fine aggregate was characterized
according to sand equivalency, chemical components, unit weight, gradation, specific gravity

Mucha 12
and absorption, fine aggregate angularity, freezing and magnesium sulfate soundness, and
methylene blue. The table below gives a comparison between field results and simple laboratory
performance tests (NCAT 218-219).
Superpave – Slg/Lms SMA – Slg/Lms Surface Friction 0.38 0.34 Field Roughness 23 in/mi 24 in/mi
Field Rutting 1.91 mm 1.57 mm APA 1.51 mm 2.43 mm
Hamburg 2.50 mm 4.85 mm Rotary 1.43 mm 1.68 mm
SGC Shear 0.71 GSR 0.57 GSR COE Shear 0.91 GSI 1.03 GSI
Preliminary Results
Although loading of the track will not be completed until November 2002, preliminary
results are currently available. In general all sections have performed well under the loading
conditions. Graphs on the following pages compare track performance in relation to rutting,
surface friction and densification results.
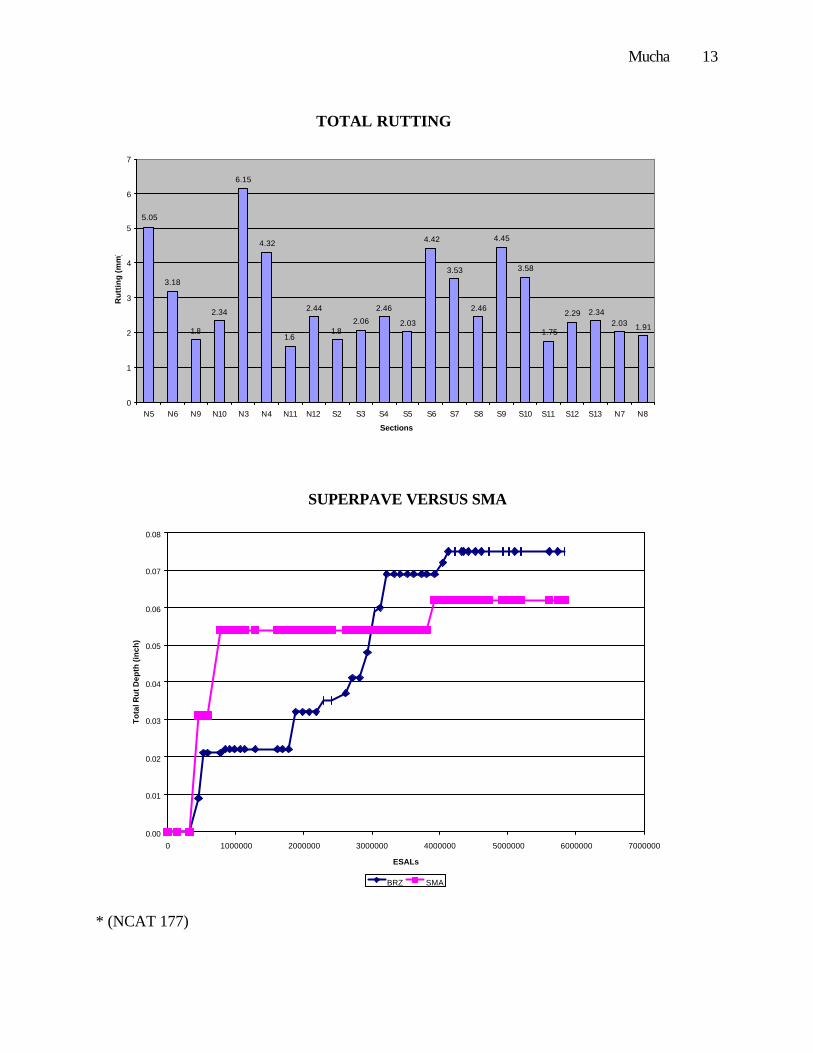
The summer of 2001, brought mild temperatures and mixes experienced minimal rutting.
Coarse mixes experienced about 21% less rutting than fine mixes. In terms of binder selections,
aggregate blends with higher performance grades (PG76-22) experienced less rutting than lower
performance grades (PG67-22). The modified binders (SBS modified PG76-22) rutted about
40% less than the unmodified binders (PG67-22) (NCAT 4). As shown in the following graph,
the section that experienced the most rutting (section number N3) after the first summer of
loading contained unmodified binder at optimum plus ½ % (PG67-22+) (NCAT 2).
Mucha 13
TOTAL RUTTING
5.05
3.18
1.8
2.34
6.15
4.32
1.6
2.44
1.82.06
2.46
2.03
4.42
3.53
2.46
4.45
3.58
1.75
2.29 2.342.03 1.91
0
1
2
3
4
5
6
7
N5 N6 N9 N10 N3 N4 N11 N12 S2 S3 S4 S5 S6 S7 S8 S9 S10 S11 S12 S13 N7 N8
Sections
Ru
ttin
g (
mm
)
SUPERPAVE VERSUS SMA
* (NCAT 177)
0.00
0.01
0.02
0.03
0.04
0.05
0.06
0.07
0.08
0 1000000 2000000 3000000 4000000 5000000 6000000 7000000
ESALs
To
tal R
ut D
epth
(in
ch)
BRZ SMA
Mucha 14
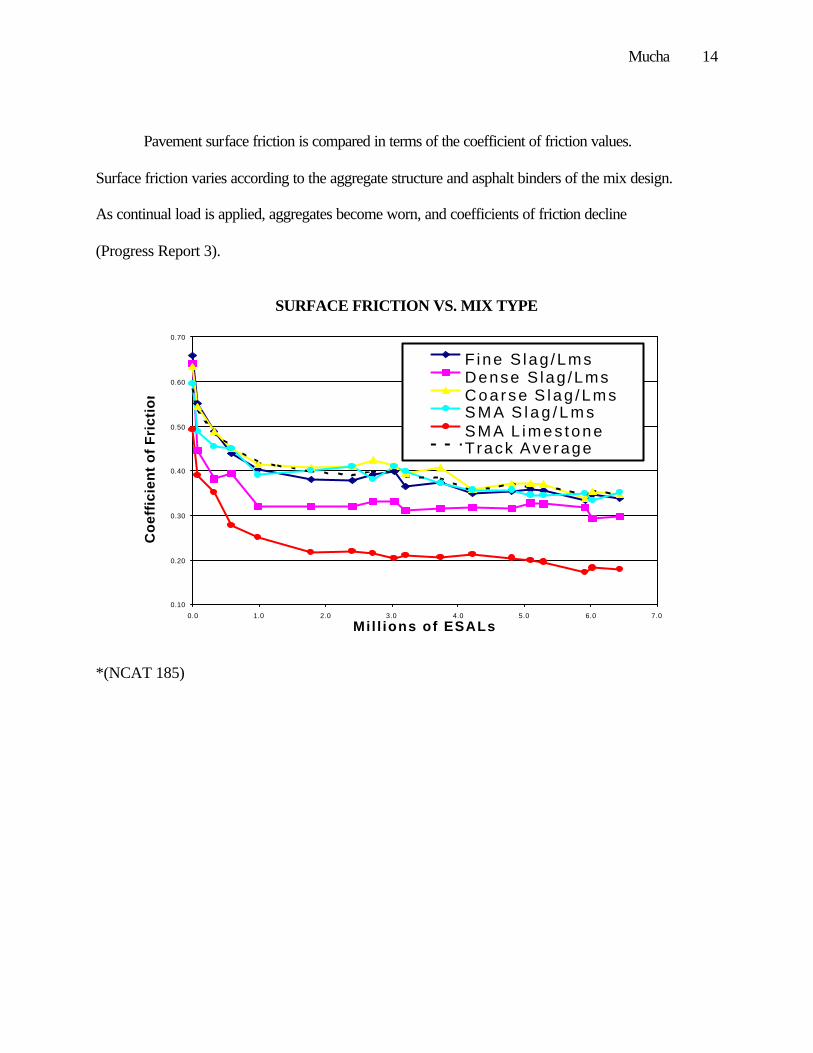
Pavement surface friction is compared in terms of the coefficient of friction values.
Surface friction varies according to the aggregate structure and asphalt binders of the mix design.
As continual load is applied, aggregates become worn, and coefficients of friction decline
(Progress Report 3).
SURFACE FRICTION VS. MIX TYPE
*(NCAT 185)
0.10
0.20
0.30
0.40
0.50
0.60
0.70
0.0 1.0 2.0 3.0 4.0 5.0 6.0 7.0
Mil l ions of ESALs
Co
effi
cien
t o
f F
rict
ion
F ine S lag /LmsDense S lag /LmsCoa rse S lag /LmsS M A S l a g / L m sSMA L imes toneTrack Average

Mucha 15
In order to monitor the densification of mix designs, field tests and monthly coring is
conducted. Measurements for the “reduction of air voids are recorded as truck traffic
accumulates” (Progress Report 3).
MAT DENSIFICATION
*(NCAT 181)
Road spray on the track was also observed. Open graded friction coarse (OGFC) mixes
were the most efficient in draining surface rainwater. Mix designs with coarse surface textures
were also effective in reducing road spray. In general, the more surface voids in the mix, the
more effective the pavement in reducing road spray (Progress Report 3).
Plans for 2003 NCAT Test Track
With research on the current test sections nearing completion, plans for the 2003 research
are underway. The 2000 Test Track was a study on the performance of the surface layer of the
track pavement. Several options for the 2003 Test Track are still under consideration. The first
option allows for some of the 2000 Test Track sections to be left in place. Due to the mild
weather conditions during the summer of 2001, many of the test sections have survived the
CORES FROM LAST 25 FT EACH SECTION
3.0
4.0
5.0
6.0
7.0
8.0
9.0
0 1 2 3 4 5Traffic Applied (ESALs)
Air
Vo
ids
(%)
Avg Core QC Pills

Mucha 16
loading with minimal effects. This option would be a continued surface performance study on
the effects of an addition two-year loading period. Option two would follow a similar method to
the 2000 Test Track. This option requires that forty-six sections be milled and inlayed with new
mix designs. This study would also focus on surface performance. Option three is a structural
study. Currently the track has a uniform structural base. If chosen, this option would require
that the existing top thirty inches be removed. The sponsors would then determine structural
buildup of the layers in each section. The last option involves structure and instrumentation
used. Similar to option three, this choice would allow sponsors to determine the structural build
up of their section. This would also allow sponsors to add additional test instruments in these
layers. Currently, moisture and temperature gauges are found in all sub base layers (NCAT 237-
240).
For additional information and updates, please visit the NCAT Test Track website at
www.pavetrack.com.
Mucha 17
Works Cited
Hanson, Douglas I. “Aggregate Gradation.” Hot Mix Asphalt for the Undergraduate 2000.
“Loading of the NCAT Test Track Begun.” Asphalt Technology News 12.2 (2000): 4-5.
National Center for Asphalt Technology (NCAT). 1999. NCAT. 17 June 2002.
www.eng.auburn.edu
NCAT Pavement Test Track. 4 June 2002. NCAT. 17 June 2002. www.pavetrack.com
“NCAT Test Track Update.” Asphalt Technology News 13.1(2001): 4.
“NCAT Test Track Update.” Asphalt Technology News 13.2(2001): 3-5.
Powell, R.Buzz. “NCAT Pavement Test Track Accelerated Performance Testing” 16 March
1998.
“A Progress Report After One Year of Traffic on the 2000 NCAT Pavement Test Track.”
Online Posting. 17 June 2002. October 2001. www.pavetrack.com
“States to Evaluate Performance at NCAT Test Track.” Focus on Hot Mix Asphalt Technology
3.3 (1998): 11-13.
“Track Takes NCAT to the Next Level.” Focus on Hot Mix Asphalt Technology 3.3(1998): 14-
17.
U.S. Department of Transportation – Federal Highway Administration. “SUPERPAVE for the
Generalist Engineer and Project Staff Participant Manual” FHWA HI 97-031; July 1997.
U.S. Department of Transportation – Federal Highway Administration. “Bridge Gross Weight
Formula” April 1984: 2-11.
Warren, Jim. “Design and Construction of SMA and OGFC Mixtures” NCAT Professors
Training Course in Asphalt Technology. 8 March 2000.

Mucha 18
Warren, Jim. “Modified Asphalt Binders” NCAT Professors Training Course in Asphalt
Technology. 8 March 2000.
Warren, Jim. “Structural Designs of HMA Pavements” NCAT Professors Training Course in
Asphalt Technology. 8 March 2000.
WesTrack Home Page. 1999. Nevada Automotive Test Center. 20 June 2002.
www.westrack.com