Embed Size (px)
Citation preview

Meg LassaratCFO
Mustang
Meg LassaratCFO
Mustang
Thought Leadership onRisk and ChangeThought Leadership onRisk and Change
Plenary Session ThreePlenary Session Three
Session ModeratorECC Board Member

Thought Leadership on Risk and ChangeThought Leadership on Risk and Change

Jerry R. StrawserDean,Mays Business School
Texas A&M University
Jerry R. StrawserDean,Mays Business School
Texas A&M University
Thought Leadership on Risk and ChangeThought Leadership on Risk and Change
Dr. William H. GlickDean and H. Joe Nelson III Professor of Management at the Jesse H. Jones Graduate School of Business
Rice University
Dr. William H. GlickDean and H. Joe Nelson III Professor of Management at the Jesse H. Jones Graduate School of Business
Rice University

Doing Business in the “Reset” Economy
Doing Business in the “Reset” Economy

Jerry Strawser, DeanKPMG Chair in Accounting
Mays Business SchoolTexas A&M University
Jerry Strawser, DeanKPMG Chair in Accounting
Mays Business SchoolTexas A&M University
Doing Business in the “Reset” Economy
Doing Business in the “Reset” Economy

In the last 6 months, have things:In the last 6 months, have things:
4%
44%
22%
22%
8%
1. Gotten much better
2. Gotten a little better
3. Stayed about the same
4. Gotten a little worse
5. Gotten much worse
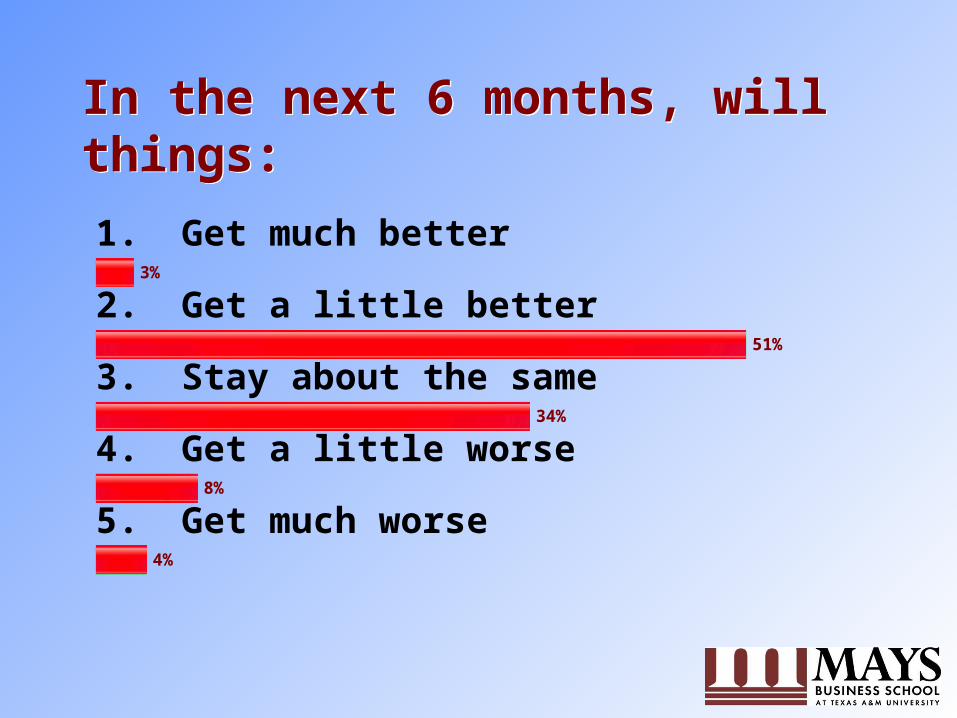
In the next 6 months, will things:In the next 6 months, will things:
3%
51%
34%
8%
4%
1. Get much better
2. Get a little better
3. Stay about the same
4. Get a little worse
5. Get much worse

When do you think things willget back to “normal”?When do you think things willget back to “normal”?
0%
16%
64%
20%
1. Within the next 6 months
2. Sometime during 2010
3. Sometime after 2010
4. Never

So What Happened?So What Happened?

Source: The Conference Board
Consumer Confidence IndexConsumer Confidence Index
30405060708090
100110120130140150
Aug-00
Feb-01
Aug-01
Feb-02
Aug-02
Feb-03
Aug-03
Feb-04
Aug-04
Feb-05
Aug-05
Feb-06
Aug-06
Feb-07
Aug-07
Feb-08
Aug-08
Feb-09
30405060708090
100110120130140150
Aug-00
Feb-01
Aug-01
Feb-02
Aug-02
Feb-03
Aug-03
Feb-04
Aug-04
Feb-05
Aug-05
Feb-06
Aug-06
Feb-07
Aug-07
Feb-08
Aug-08
Feb-09
Source: www.conference-board.org/
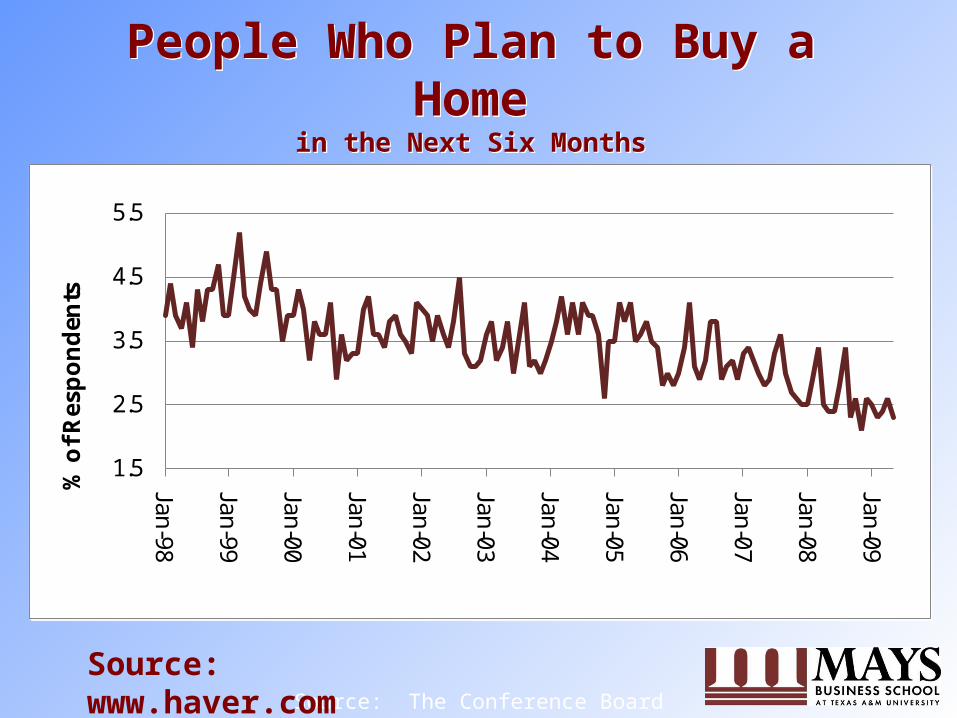
People Who Plan to Buy a Homein the Next Six Months
People Who Plan to Buy a Homein the Next Six Months
Source: The Conference Board
1.5
2.5
3.5
4.5
5.5
Jan-98
Jan-99
Jan-00
Jan-01
Jan-02
Jan-03
Jan-04
Jan-05
Jan-06
Jan-07
Jan-08
Jan-09%
of
Res
po
nd
ents
1.5
2.5
3.5
4.5
5.5
Jan-98
Jan-99
Jan-00
Jan-01
Jan-02
Jan-03
Jan-04
Jan-05
Jan-06
Jan-07
Jan-08
Jan-09%
of
Res
po
nd
ents
Source: www.haver.com
0
5
10
15
20
25
30
Jan-98
Jan-99
Jan-00
Jan-01
Jan-02
Jan-03
Jan-04
Jan-05
Jan-06
Jan-07
Jan-08
Jan-09%
of
Res
po
nd
ents
0
5
10
15
20
25
30
Jan-98
Jan-99
Jan-00
Jan-01
Jan-02
Jan-03
Jan-04
Jan-05
Jan-06
Jan-07
Jan-08
Jan-09%
of
Res
po
nd
ents
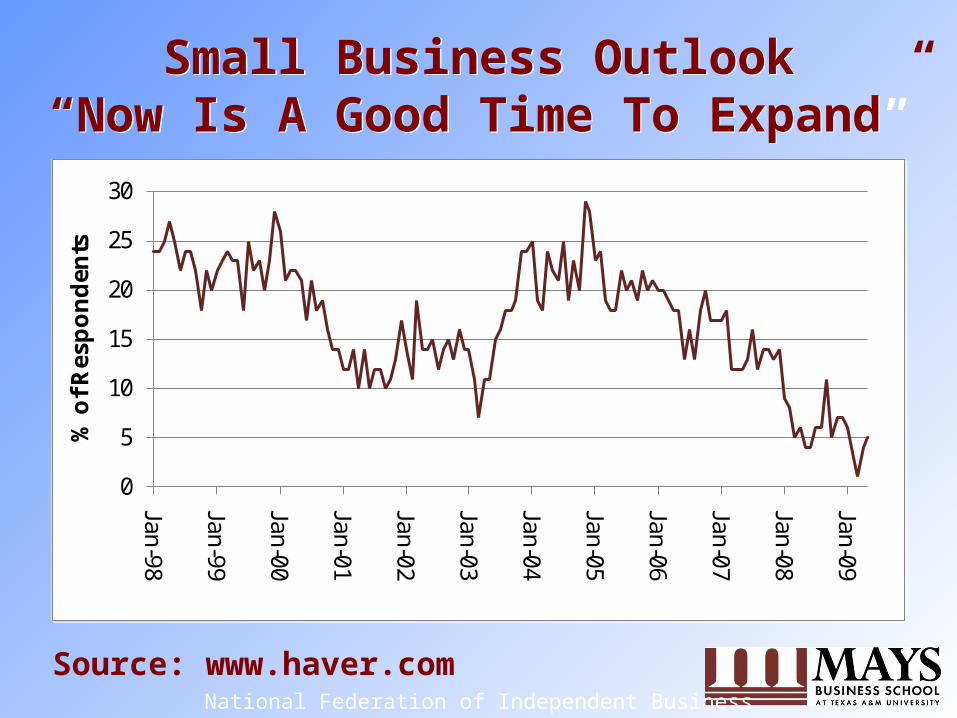
Small Business Outlook“Now Is A Good Time To Expand”
Small Business Outlook“Now Is A Good Time To Expand”
National Federation of Independent Business
Source: www.haver.com
National Federation of Independent Business
-10
-5
0
5
10
15
20
25
Jan-98
Jan-99
Jan-00
Jan-01
Jan-02
Jan-03
Jan-04
Jan-05
Jan-06
Jan-07
Jan-08
Jan-09N
et %
of
Res
po
nd
ents
-10
-5
0
5
10
15
20
25
Jan-98
Jan-99
Jan-00
Jan-01
Jan-02
Jan-03
Jan-04
Jan-05
Jan-06
Jan-07
Jan-08
Jan-09N
et %
of
Res
po
nd
ents
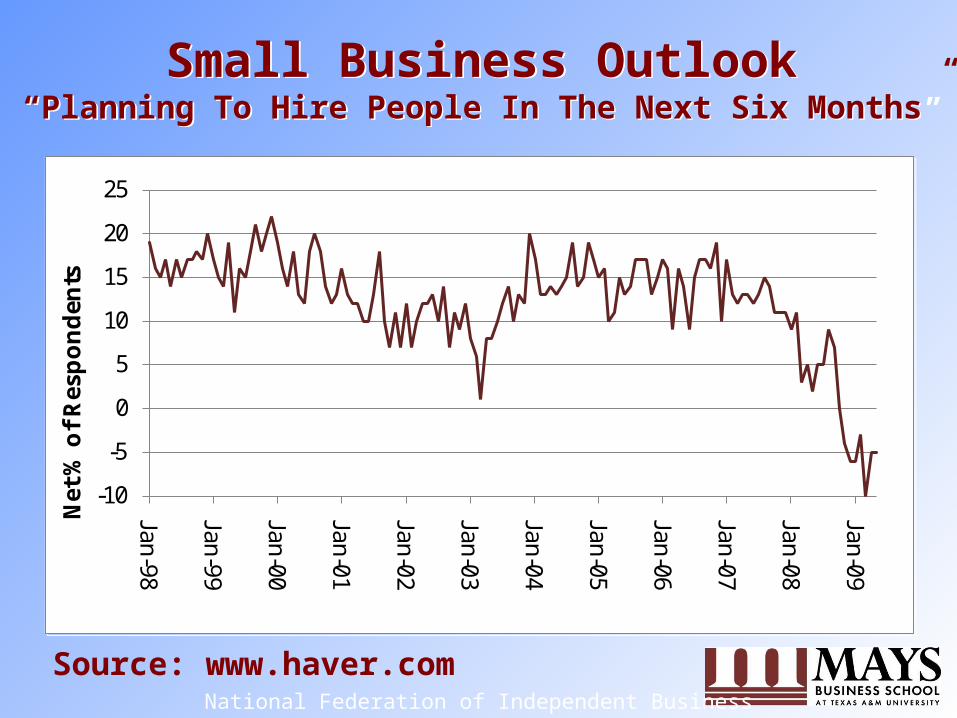
Small Business Outlook“Planning To Hire People In The Next Six Months”
Small Business Outlook“Planning To Hire People In The Next Six Months”
Source: www.haver.com
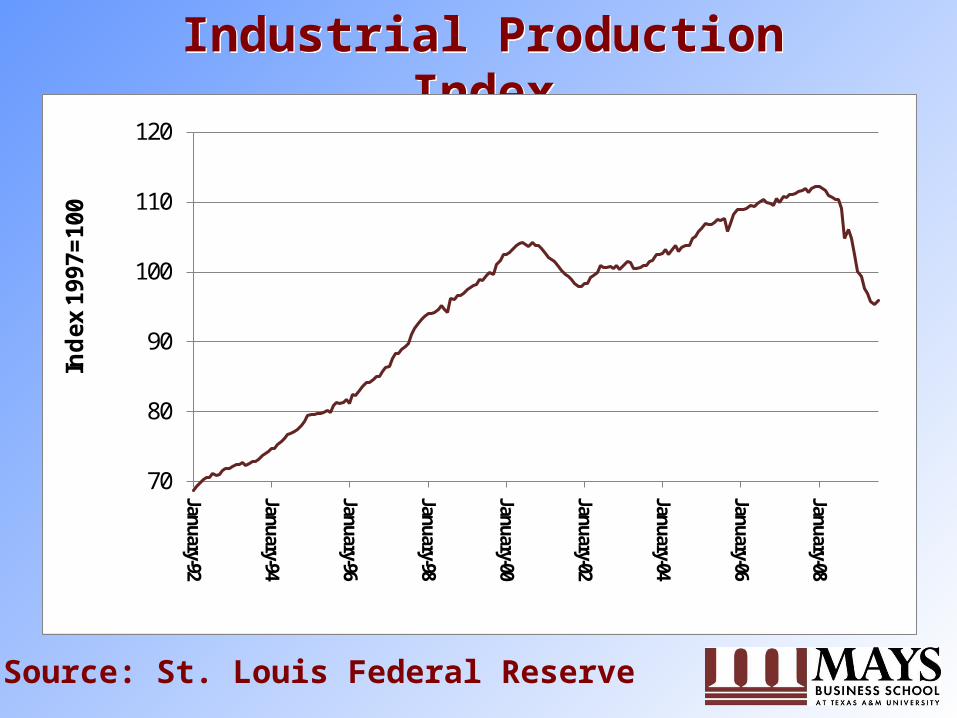
Industrial Production IndexIndustrial Production Index
70
80
90
100
110
120
January-92
January-94
January-96
January-98
January-00
January-02
January-04
January-06
January-08
Ind
ex
1997=
100
Source: St. Louis Federal Reserve
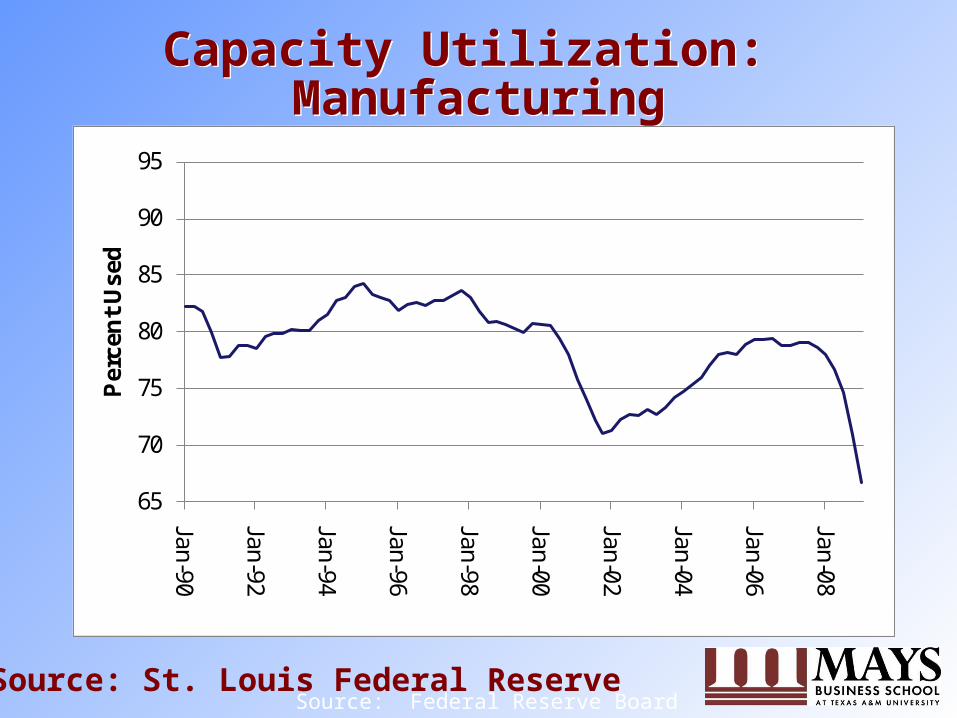
Capacity Utilization: Manufacturing
Capacity Utilization: Manufacturing
Source: Federal Reserve Board
65
70
75
80
85
90
95
Jan-90
Jan-92
Jan-94
Jan-96
Jan-98
Jan-00
Jan-02
Jan-04
Jan-06
Jan-08P
erce
nt
Use
d
Source: St. Louis Federal Reserve
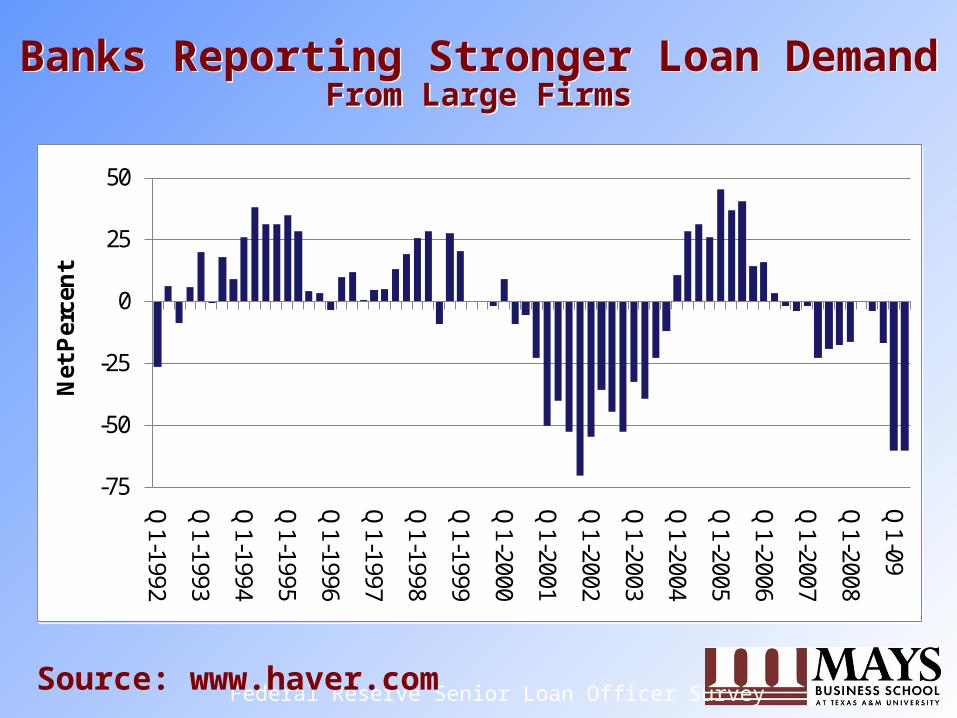
Banks Reporting Stronger Loan DemandFrom Large Firms
Banks Reporting Stronger Loan DemandFrom Large Firms
Federal Reserve Senior Loan Officer Survey
-75
-50
-25
0
25
50
Q1-1992
Q1-1993
Q1-1994
Q1-1995
Q1-1996
Q1-1997
Q1-1998
Q1-1999
Q1-2000
Q1-2001
Q1-2002
Q1-2003
Q1-2004
Q1-2005
Q1-2006
Q1-2007
Q1-2008
Q1-09
Net
Per
cen
t
-75
-50
-25
0
25
50
Q1-1992
Q1-1993
Q1-1994
Q1-1995
Q1-1996
Q1-1997
Q1-1998
Q1-1999
Q1-2000
Q1-2001
Q1-2002
Q1-2003
Q1-2004
Q1-2005
Q1-2006
Q1-2007
Q1-2008
Q1-09
Net
Per
cen
t
Source: www.haver.com
Federal Reserve Senior Loan Officer Survey
-75
-50
-25
0
25
50
Q1-1992
Q1-1993
Q1-1994
Q1-1995
Q1-1996
Q1-1997
Q1-1998
Q1-1999
Q1-2000
Q1-2001
Q1-2002
Q1-2003
Q1-2004
Q1-2005
Q1-2006
Q1-2007
Q1-2008
Q1-2009
Net
Per
cen
t
-75
-50
-25
0
25
50
Q1-1992
Q1-1993
Q1-1994
Q1-1995
Q1-1996
Q1-1997
Q1-1998
Q1-1999
Q1-2000
Q1-2001
Q1-2002
Q1-2003
Q1-2004
Q1-2005
Q1-2006
Q1-2007
Q1-2008
Q1-2009
Net
Per
cen
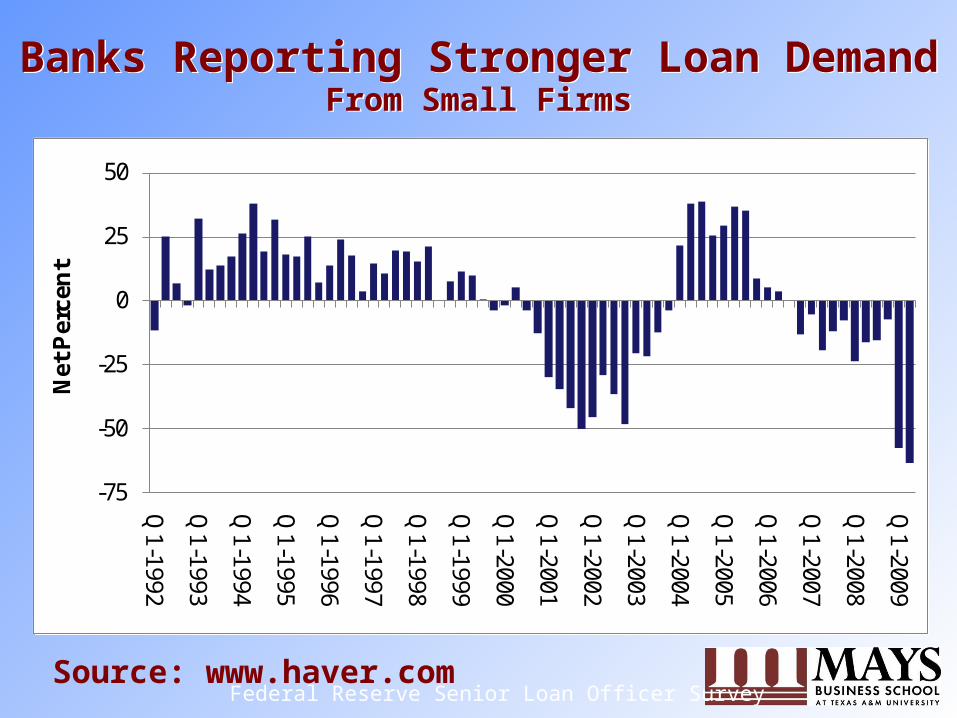
tBanks Reporting Stronger Loan Demand
From Small FirmsBanks Reporting Stronger Loan Demand
From Small Firms
Source: www.haver.com
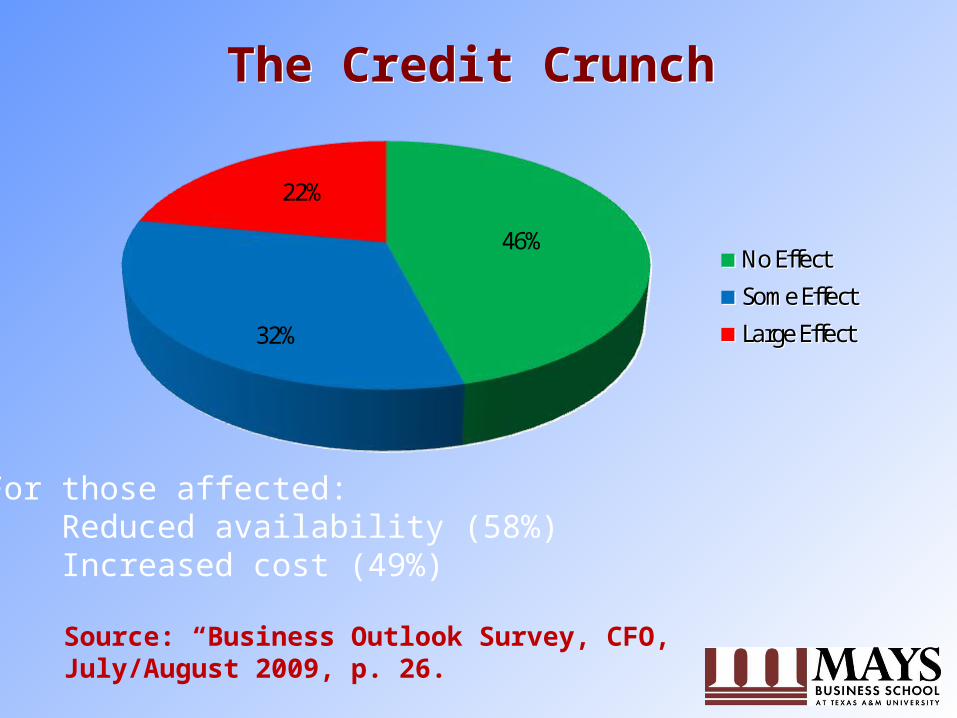
The Credit CrunchThe Credit Crunch
46%
32%
22%
No Effect
Some Effect
Large Effect
46%
32%
22%
No Effect
Some Effect
Large Effect
For those affected:• Reduced availability (58%)• Increased cost (49%)
Source: “Business Outlook Survey, CFO, July/August 2009, p. 26.

US Civilian Unemployment RateUS Civilian Unemployment Rate
0
2
4
6
8
10
12
Jan-81
Jan-83
Jan-85
Jan-87
Jan-89
Jan-91
Jan-93
Jan-95
Jan-97
Jan-99
Jan-01
Jan-03
Jan-05
Jan-07
Jan-09(P
erce
nt)
Source: St. Louis Federal Reserve

US Employment:Construction
US Employment:Construction
Source: Bureau of Labor Statistics
NAICS 23Building, developing, construction of
Houses, buildings, power lines, highways, streets and bridges
4,000
5,000
6,000
7,000
8,000
Jan-90
Jan-92
Jan-94
Jan-96
Jan-98
Jan-00
Jan-02
Jan-04
Jan-06
Jan-08
Th
ou
san
ds
of
Wo
rker
s
Source: St. Louis Federal Reserve

US Employment:Government
US Employment:Government
Source: Bureau of Labor Statistics
Sector 92: Executive, legislative, justice, public safety, humanResources, environmental quality, planning, national security.
National, state and local government.This includes civilian employees only, military personnel are excluded.
18,000
19,000
20,000
21,000
22,000
23,000
Jan-90
Jan-92
Jan-94
Jan-96
Jan-98
Jan-00
Jan-02
Jan-04
Jan-06
Jan-08T
ho
usa
nd
s o
f W
ork
ers
Source: St. Louis Federal Reserve

Oil PricesOil Prices
Source: http://tonto.eia.doe/gov/dnav/pet/hist
In SummaryIn Summary
• Nobody has much confidence
• Activity is slow
• Banks can’t (or won’t) loan.
• Customers aren’t able to borrow (or do so at reasonable terms)
• Unemployment is high
• Nobody has much confidence
• Activity is slow
• Banks can’t (or won’t) loan.
• Customers aren’t able to borrow (or do so at reasonable terms)
• Unemployment is high

The Best Case ScenarioThe Best Case Scenario
• Rise in stock price followed by favorable corporate earnings 4Q09
• Consumer confidence rises with stocks
• Foreclosure pressure continues to be heavy
• More spending results in higher profits
• Layoffs end by the end of the 2009
• “Jobless recovery” in 2010• Higher interest rates and
inflation in 2010-11

The Worst Case ScenarioThe Worst Case Scenario
• No effective fiscal package gets passed
• Treasury and Fed continue to stumble
• Bad banks and businesses propped up
• No price discovery for “toxic” mortgages
• Political risk for business stays high
• Business / investors “sit on their hands”
• Unemployment goes well over 10%
• Commodity deflation and price deflation

Which is it?Which is it?

Take a page from Cisco’s “Playbook”
Take a page from Cisco’s “Playbook”
1. Be realistic. 2. Assess your situation. 3. Get ready for the upturn.4. Get closer to your customers.5. Watch the stock market.6. Always have more cash, not less.7. Be aggressive.
1. Be realistic. 2. Assess your situation. 3. Get ready for the upturn.4. Get closer to your customers.5. Watch the stock market.6. Always have more cash, not less.7. Be aggressive.
Source: “Silicon Valley Survivor,” Wall Street Journal, July 25-26, 2009, p. A11.

Three more ... Three more ...
1. Tough economies will pare the field of weak competitors
2. Tough economies provide cover for certain behaviors and decisions (customers, suppliers, and employees)
3. Everything is up for grabs. Use this as a business development opportunity.
1. Tough economies will pare the field of weak competitors
2. Tough economies provide cover for certain behaviors and decisions (customers, suppliers, and employees)
3. Everything is up for grabs. Use this as a business development opportunity.
How Others Have CopedHow Others Have Coped
• GE: Communicating inside and outside• Nalco: Motivating employees to cut costs• Avon: Changing marketing to reflect the
times• Waste Management: Getting customers to
share the pain
• GE: Communicating inside and outside• Nalco: Motivating employees to cut costs• Avon: Changing marketing to reflect the
times• Waste Management: Getting customers to
share the pain
Source: “My Recovery Playbook,” Fortune, August 31, 2009, pp. 61-66.

What is your Company Doing?What is your Company Doing?
0% 10% 20% 30% 40% 50% 60% 70%
Excuse to restructure
Reducing R&D
Streamlining offerings
Changing terms with suppliers
Reengineering processes
Deferring new hiring
Layoffs
Limiting travel
0% 10% 20% 30% 40% 50% 60% 70%
Excuse to restructure
Reducing R&D
Streamlining offerings
Changing terms with suppliers
Reengineering processes
Deferring new hiring
Layoffs
Limiting travel
Source: “How Bleak is the Landscape?,” Harvard Business Review, July-August 2009, 92-93.

What Opportunities is your Company Considering?
What Opportunities is your Company Considering?
0% 10% 20% 30% 40% 50%
Creating new products/services
Improving current products/services
Negotiating better terms w/suppliers
Encouraging entrepreneurial …
Targeting new customers
Restructuring for efficiency
0% 10% 20% 30% 40% 50%
Creating new products/services
Improving current products/services
Negotiating better terms w/suppliers
Encouraging entrepreneurial …
Targeting new customers
Restructuring for efficiency
Source: “How Bleak is the Landscape?,” Harvard Business Review, July-August 2009, 92-93.

What can Happen During a Recession?
What can Happen During a Recession?
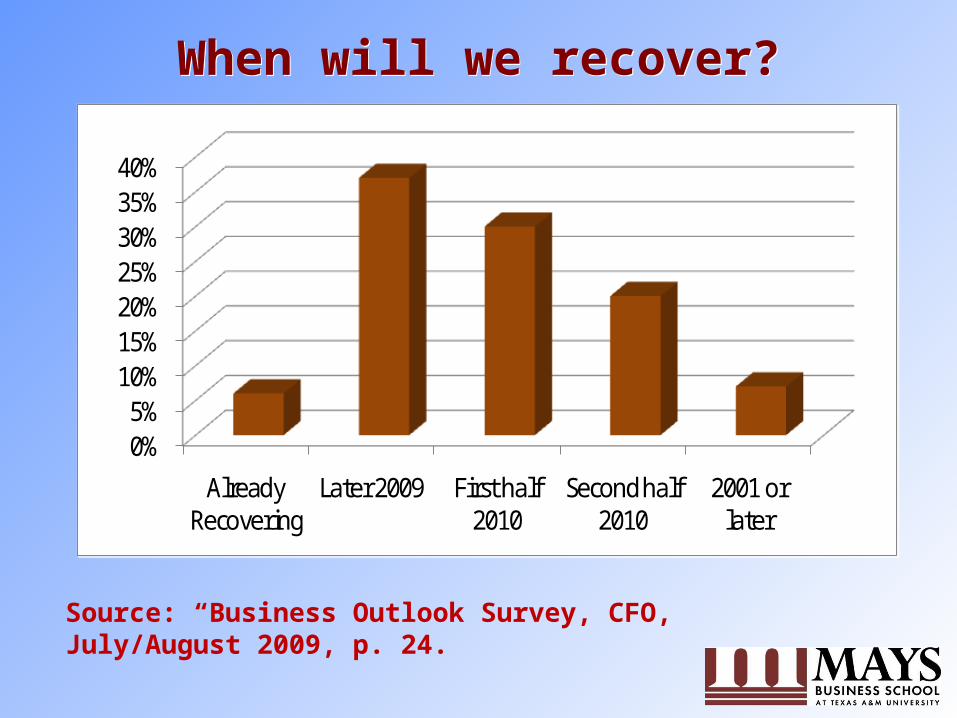
When will we recover?When will we recover?
0%5%
10%15%20%25%30%35%40%
Already Recovering
Later 2009 First half 2010
Second half 2010
2001 or later
0%5%
10%15%20%25%30%35%40%
Already Recovering
Later 2009 First half 2010
Second half 2010
2001 or later
Source: “Business Outlook Survey, CFO, July/August 2009, p. 24.