Embed Size (px)
Citation preview

Meeting the Future: Evaluating the Potential of Waste Processing Technologies to Contribute to Rhode
Island’s Solid Waste Management System
(A White Paper)
Prepared for:
Rhode Island Resource Recovery Corporation
Prepared by:
Gershman, Brickner & Bratton, Inc. 8550 Arlington Blvd, Suite 304
Fairfax, VA 22031 1-800-573-5801
September 30, 2009

White Paper: Meeting the Future: Evaluating the Potential of Waste Processing Technologies to Contribute to Rhode Island’s Solid Waste Management System
GBB/C09032-01 ii September 30, 2009
Table of Contents
1.0 Introduction ........................................................................................ 1
2.0 Future Rhode Island Waste Disposal Needs .............................................. 3
3.0 Proven Waste Processing Technologies .................................................... 4
3.1 Mass-Burn/Waterwall Combustion ................................................. 7 3.1.1 Process Description ........................................................... 7 3.1.2 Worldwide Experience and Vendors in United States .............. 8
3.2 Mass-Burn/Modular Combustion ................................................... 9 3.2.1 Process Description ........................................................... 9 3.2.2 Worldwide Experience and Vendors in United States ............. 10
3.3 Refuse Derived Fuel/Dedicated Boiler ........................................... 10 3.3.1 Process Description .......................................................... 10 3.3.2 Worldwide Experience and Vendors in U.S. .......................... 12
3.4 Refuse-derived Fuel/Fluidized Bed ............................................... 12 3.4.1 Process Description .......................................................... 12 3.4.2 Worldwide Experience and Vendors in U.S. .......................... 14
4.0 Emerging Waste Technologies ............................................................... 14
4.1 Pyrolysis .................................................................................. 14 4.2 Gasification .............................................................................. 15 4.3 Anaerobic Digestion ................................................................... 17 4.4 Mixed Waste Composting ............................................................ 18 4.5 Plasma Arc ............................................................................... 19 4.6 Chemical Decomposition ............................................................. 20
5.0 Recent Reports/Procurements for Waste Processing Technologies ............... 21
5.1 Recent Plans and Reports ........................................................... 23 5.1.1 New York City, NY ........................................................... 23 5.1.2 City of Los Angeles, CA .................................................... 23 5.1.3 Los Angeles County, CA .................................................... 25 5.1.4 King County, WA ............................................................. 26
5.2 Procurements ........................................................................... 27 5.2.1 Frederick and Carroll Counties County, MD .......................... 27 5.2.2 Harford County, MD ......................................................... 28 5.2.3 City of Sacramento, CA .................................................... 28 5.2.4 Broward County, FL ......................................................... 29 5.2.5 St. Lucie County, FL ......................................................... 29 5.2.6 Hawaii County, HI............................................................ 30 5.2.7 Pinellas County, FL .......................................................... 30 5.2.8 Hillsborough and Lee Counties, FL (adding lines to
existing WTE plants) ........................................................ 30 5.3 Comparison of Technologies Chosen in Recent
Reports/Procurements ................................................................ 30

White Paper: Meeting the Future: Evaluating the Potential of Waste Processing Technologies to Contribute to Rhode Island’s Solid Waste Management System
GBB/C09032-01 iii September 30, 2009
6.0 Economic Feasibility of Waste Processing Technologies ............................. 31
6.1 Economic Characteristics of Waste Processing Technologies ............. 31 6.2 Typical Project Economic Estimates .............................................. 32
6.2.1 Assumptions ................................................................... 33 6.2.2 Pro Forma Operating Statement ........................................ 34
7.0 Environmental Characteristics of Waste Processing Technologies ................ 35
7.1 Air Quality ................................................................................ 35 7.1.1 Applicable Regulations ...................................................... 35 7.1.2 Air Quality Impacts .......................................................... 37
7.2 Greenhouse Gases ..................................................................... 40 7.3 Water ...................................................................................... 44 7.4 Residue Disposal ....................................................................... 44
8.0 Waste Processing Technologies for Rhode Island ...................................... 46
9.0 Summary and Conclusions .................................................................... 48
9.1 Conclusions .............................................................................. 49 9.2 Recommendations ..................................................................... 50
List of Tables
Table 2-1. Waste Disposal Projections, with and without Waste-To-Energy
(WTE) in Tons, Selected Years ........................................................ 4 Table 3-1. Recycling Rates in States with Significant WTE ................................... 5 Table 3-2. Use of Waste-to-Energy Facilities Worldwide ...................................... 6 Table 3-3. Waste-to-Energy Plants in New England ............................................ 6 Table 3-4. U.S. Mass-Burn/Waterwall Facilities .................................................. 9 Table 5-1. Technologies/Vendors Mentioned in Recent Procurements .................... 31 Table 6-1. Pro Forma Annual Operating Statement ............................................ 34 Table 7-1. Average Emissions of 95 WTE Plants Compared to EPA Standards ......... 40 Table 7-2. WARM Emissions Savings and Equivalents for 2014 ............................ 43
List of Figures
Figure 3-1. Waterwall Furnace Section ............................................................. 7 Figure 3-2. Typical Mass-Burn Waterwall System ............................................... 8 Figure 3-3. Typical Modular Combustion System ................................................ 9 Figure 3-4. Typical RDF Combustion Facility ..................................................... 11 Figure 3-5. Typical RDF Processing Facility ....................................................... 11 Figure 3-6. Typical RDF Fluid Bed System ........................................................ 13 Figure 3-7. RDF Fluidized Bed Gasification System ............................................. 13 Figure 4-1. Process Diagram of a Pyrolysis System ........................................... 15 Figure 4-2. Typical Gasification System ........................................................... 16 Figure 4-3. EnTech Process Schematic ............................................................ 17 Figure 4-4. Process Flow for Anaerobic Digestion System ................................... 18 Figure 4-5. ArrowBio Facility in Sydney ........................................................... 18 Figure 4-6. Cross-section of a Plasma Arc Furnace ........................................... 20 Figure 7-1. Dioxin Emissions from WTE Facilities, 1990 – 2005 ........................... 37

White Paper: Meeting the Future: Evaluating the Potential of Waste Processing Technologies to Contribute to Rhode Island’s Solid Waste Management System
GBB/C09032-01 iv September 30, 2009
Figure 7-2. Sources of Dioxin Emissions, 1987 – 2002-04 .................................. 38 Figure 7-3. Mercury Emission from WTE Facilities, 1990 – 2005 .......................... 39 Figure 7-4. Mercury Emission from WTE Facilities and Fossil-Fuel Power
Plants ........................................................................................ 39 Figure 7-5. Potential GHG Emissions Reductions ................................................ 42
Appendix A
Table A-1. Firms Evaluated by Recent Waste Processing Studies or Procurements Table A-2. Summary of Municipal Waste Processing Technologies

White Paper: Meeting the Future: Evaluating the Potential of Waste Processing Technologies to Contribute to Rhode Island’s Solid Waste Management System
GBB/C09032-01 1 September 30, 2009
1.0 Introduction
The State of Rhode Island (“State”) set forth a solid waste management hierarchy, a prioritized set of strategies with which to address the solid waste issues facing the state’s citizens and businesses. This hierarchy, codified by State law,1 is as follows:
1. Reduction of the amount of source waste generated 2. Source separation and recycling 3. Waste processing, such as recycling-based technology, to reduce the volume
of waste necessary for land disposal 4. Land disposal
This hierarchy is consistent with the national hierarchy established by the U.S. Environmental Protection Agency (“EPA”),2 although the EPA’s hierarchy explicitly makes “combustion with energy recovery” its third priority after waste reduction and recycling. This hierarchy was changed in 2004. Prior to that, EPA had placed waste combustion and landfilling co-equally at the bottom of the hierarchy. Now, landfilling shares the bottom of the EPA hierarchy only with “incineration without energy recovery.” Rhode Island has been diligently pursuing the first two priorities: waste reduction and recycling. Such activities include the State’s support of local recycling and pay-as-you-throw collection systems, the successful operation of the materials recovery facility (“MRF”) at the Central Landfill and the encouragement of yard waste composting. Overall, about 21.5 percent of the waste generated in the state is diverted, eliminating the need to landfill that portion of the waste stream. The remaining amount of waste generated is landfilled in the Central Landfill, the backbone of the State’s solid waste management system. That landfill is running out of space and must be expanded to accommodate future waste disposal needs. The strategy that has not been pursued so far in Rhode Island is the third in the hierarchy: waste processing to reduce the volume for land disposal. While waste processing technologies can include methods of volume reduction (shredding, compaction, baling, etc.), most such technologies involve some form of controlled thermal treatment – incineration – with fuel production or energy recovery. Since the 1970s, incineration has been banned by law in Rhode Island.3 Given many concerns about the potential public health and environmental impacts of incineration technologies available at that time, the prohibition was a reasonable response. Currently, however, almost 90 waste-to-energy (“WTE”) facilities, like those banned in Rhode Island, have been successfully processing about 12.5 percent of the nation’s municipal solid waste (“MSW”),4 complying with all applicable environmental and health regulations and generally being good neighbors in their communities.5 1 R.I Gen Laws § 23-19-3, ¶11. 2 www.epa.gov/epaoswer/non-hw/muncpl/faq.htm#1 3 R.I Gen Laws § 23-19-3, ¶14,15,16; R.I Gen Laws § 23-19-11, ¶7. 4 In Rhode Island, “municipal solid waste” applies only to residentially generated solid waste the collection or disposal of which is provided for by the municipality. Residential solid waste generated in condominiums or apartment buildings the collection of which is not provided by the municipality is classified as “Commercial Solid Waste.” Other states, EPA, and the solid waste industry nationally, apply the term “MSW” to the combined categories of material classified in Rhode Island as “MSW” and “CSW.” Also, commercial solid waste (CSW) is
White Paper: Meeting the Future: Evaluating the Potential of Waste Processing Technologies to Contribute to Rhode Island’s Solid Waste Management System
GBB/C09032-01 2 September 30, 2009
In April 2009, the Rhode Island Resource Recovery Corporation (Corporation) updated its mission and adopted three key objectives:
1. Extend the useful life of the landfill to 2034 and beyond in order to provide long term affordable waste disposal services for Rode Island municipalities.
2. Remain financially self sufficient by self funding all operational and capital
requirements while returning any and all surpluses to the state and municipalities.
3. Reduce annual operating costs by $20 million to $46.5 million (30%) by the
end of FY2010 as compared to FY 2007 actuals of $66.5 million. The purpose of this White Paper prepared for the Corporation is to initiate that evaluation and brief the State’s solid waste professionals, decision-makers and citizens on the current state of the art of waste processing technologies, potential emerging technologies and their applicability to the State’s needs, and the potential of these technologies to contribute to the State’s overall solid waste management system. Section 2.0 summarizes the future waste disposal needs identified by the Corporation and how waste processing could affect the amount of landfill disposal required. Section 3.0 reviews the available “proven” waste processing technologies, all of which are incineration-based, their track record and operating characteristics. Section 3.0 includes a listing of facilities operating in neighboring New England states. Section 4.0 describes many of the “emerging” technologies for waste processing, including high-temperature gasification and some non-thermal types, such as mixed waste composting and anaerobic digestion. These two sections include review of the technologies, fluidized-bed combustion and plasma-arc processing. Section 5.0 reviews most of the recent activity in the evaluation and procurement of waste processing technologies by U.S. cities and counties with disposal needs of similar size to Rhode Island. These localities are exploring these types of alternatives for increasing their diversion rates, recovering more resources from their solid waste, and delivering better service to their citizens. The final two sections of the paper explore the economic, effectiveness and environmental issues surrounding the use of waste processing technologies and present opinions as to the most applicable technologies for further consideration by the State and the Rhode Island Resource Recovery Corporation. It is hoped that this White Paper engenders discussions about the use of the “third priority” in the solid waste hierarchy as a means to integrate further resource recovery into the overall solid waste management system, extend the life of the Central Landfill, reduce greenhouse gases and make maximum use of available and new technologies in addressing the State’s solid waste issues for generations to
defined as solid waste generated by businesses and institutions. The EPA and the general industry usage combines these two components into Municipal Solid Waste (MSW). In this report the EPA definition for MSW will be used. When one of the components is referred to it will be identified as “residential solid waste” or “commercial solid waste.” 5 EPA, MSW Generation, Recycling, and Disposal in the U.S.: Facts and Figures for 2007.

White Paper: Meeting the Future: Evaluating the Potential of Waste Processing Technologies to Contribute to Rhode Island’s Solid Waste Management System
GBB/C09032-01 3 September 30, 2009
come. Also, by the ongoing study and monitoring of waste reduction technologies, the Corporation will be able to identify emerging technologies that can eliminate or avoid the pollution and health concerns of traditional incineration.
2.0 Future Rhode Island Waste Disposal Needs
In the base year, 2005, a total of 1,170,000 tons of MSW were landfilled at the Central Landfill, or about 3,200 tons per day (“TPD”). Had the rate of waste generation continued at that rate, the percent remaining capacity of 6,250,000 tons would have been consumed by January 2011. The current recession has caused waste generation to decrease in the State and for the waste generated to leave the State to nearby disposal facilities. Also, the updated strategies under the Corporation’s objectives call for the use of market pricing to achieve targeted annual waste volume. These elements have produced a target range of annual disposal at the Central Landfill of between 700,000 and 800,000 tons per year. Currently the rate of waste generation is projected to grow by 4 percent each year and the rate of diversion, is targeted at 38.3 percent for residential solid waste and 25 percent for commercial waste. Implementation of the targeted waste reduction and recycling recommendations, the landfill’s capacity would be extended to 2020. However, the recession will end and waste generation could return to higher levels within three years and decrease the landfill life. To increase the life of the Central Landfill, the Corporation’s current planning calls for an expansion of the facility. This would add about 100 acres to the footprint of the landfill. When executed, this action would extend the life of the landfill to the end of 2035 (at current diversion rates) or 2045 (with enhanced diversion rates) and would give Rhode Island another 20 to 37 years of landfill life. Traditional waste processing technologies now in operation have the potential of extending the life of the landfill as well. Generally, combustion in a WTE plant reduces the incoming waste stream weight by 75 percent and the volume by 90 percent. This leaves a residue that needs to be landfilled in a permitted ashfill or processed further. Most WTE facilities in the U.S. recover ferrous metals and some recover nonferrous metals as well. American Ash Recycling Corporation of York, PA processes ash for metals and produces aggregate recycling 90 percent of the ash. European WTE facilities make similar use of the ash residue. Some emerging technologies could reduce the residual tonnage of the waste stream even further, but those have not yet been proven in the U.S at the scale needed in Rhode Island. With a 90 percent reduction by volume, a WTE facility could have a dramatic effect on extending the life of the Central Landfill. For example, if a WTE plant capable of handling all of the incoming waste to the landfill were to be implemented over the next four and one-half years, so that it was operational at the beginning of 2014, the Central Landfill’s life would be extended (as an ashfill) to the end of 2085 under the status quo diversion rate, and beyond 2120 with enhanced diversion. The four scenarios discussed above are shown in Table 2-1.

White Paper: Meeting the Future: Evaluating the Potential of Waste Processing Technologies to Contribute to Rhode Island’s Solid Waste Management System
GBB/C09032-01 4 September 30, 2009
Table 2-1. Waste Disposal Projections, with and without Waste-To-Energy (WTE) in Tons, Selected Years
With Status Quo Diversion With Diversion Recommendations Implemented w/o WTE w/WTE w/o WTE w/WTE Year Landfilled Cumulative Landfilled Cumulative Landfilled Cumulative Landfilled Cumulative 2005 1,178,871 1,178,871 1,178,871 1,178,871 1,178,871 1,178,871 1,178,871 1,178,8712010 657,728 5,739,060 657,728 5,739,060 657,728 5,739,060 657,728 5,739,0602015 691,812 9,300,907 172,953 8,782,048 470,432 9,079,527 117,608 5,856,6682020 759,544 12,814,591 189,886 9,715,814 516,490 11,619,370 127,205 6,374,0212025 778,724 16,669,659 194,681 10,484,900 529,532 14,240,817 132,383 7,029,3822030 798,387 20,622,072 194,597 11,721,169 542,903 16,928,585 135,726 7,771,2932035 818,548 28,828,828 204,637 12,734,223 556,612 19,683,965 139,153 8,390,1692040 209,804 13,772,858 209,804 22,597,898 142,667 9,096,4412045 215,102 14,837,720 585,078 25,494,322 146,269 9,802,7132050 220,534 15,489,501 149,963 10,545,1042055 226,102 17,037,681 153,750 11,306,2412060 231,812 18,173,873 157,632 12,086,5972065 237,665 19,338,757 161,612 12,886,6592070 243,667 20,533,055 165,693 13,706,9232075 249,820 21,757,510 169,877 14,547,9002080 256,128 23,083,896 174,167 15,410,1122085 262,595 24,383,873 178,565 16,294,0972100 192,436 19,082,2492110 202,277 21,060,2120 212,622 23,139,957
3.0 Proven Waste Processing Technologies
Waste has been converted to beneficial use on a large scale for well over 100 years. Incineration with electric power generation was first applied to municipal solid waste in 1894 in New York City. Since that time, the burning of municipal solid waste with energy recovery (now known as WTE) has matured into a safe, effective and environmentally acceptable technology. The proven large-scale waste processing methods include incineration and starved-air combustion, as defined below: Incineration: This is the controlled combustion of organic or inorganic waste with more than the ideal air (stoichiometric) requirement – excess air -- to assure that complete burning occurs. Starved air combustion: Starved air incineration utilizes less air than conventional incineration, and it produces ash similar in appearance to that from a conventional incineration process. The lower air requirement leads to smaller equipment sizes. This process, however, is an incineration process. It has been found that recycling, which is the most preferred waste management option aside from waste reduction, is high in communities with WTE facilities. This holds in the United States as well as in other countries. As shown in Table 3-1 from BioCycle’s “2008 State of Garbage in America,” most of the states with WTE have recycling rates higher than the national recycling average of 28.6 percent.6
6 The State of Garbage in America, BioCycle, December 2008 BioCycle includes composting, WTE and landfilling, in their recycling figures. EPA reports MSW from a slightly different source. They include collection receipts for domestic waste and for industrial waste, but their recycling quantities are derived from firms that recycle the waste,
White Paper: Meeting the Future: Evaluating the Potential of Waste Processing Technologies to Contribute to Rhode Island’s Solid Waste Management System
GBB/C09032-01 5 September 30, 2009
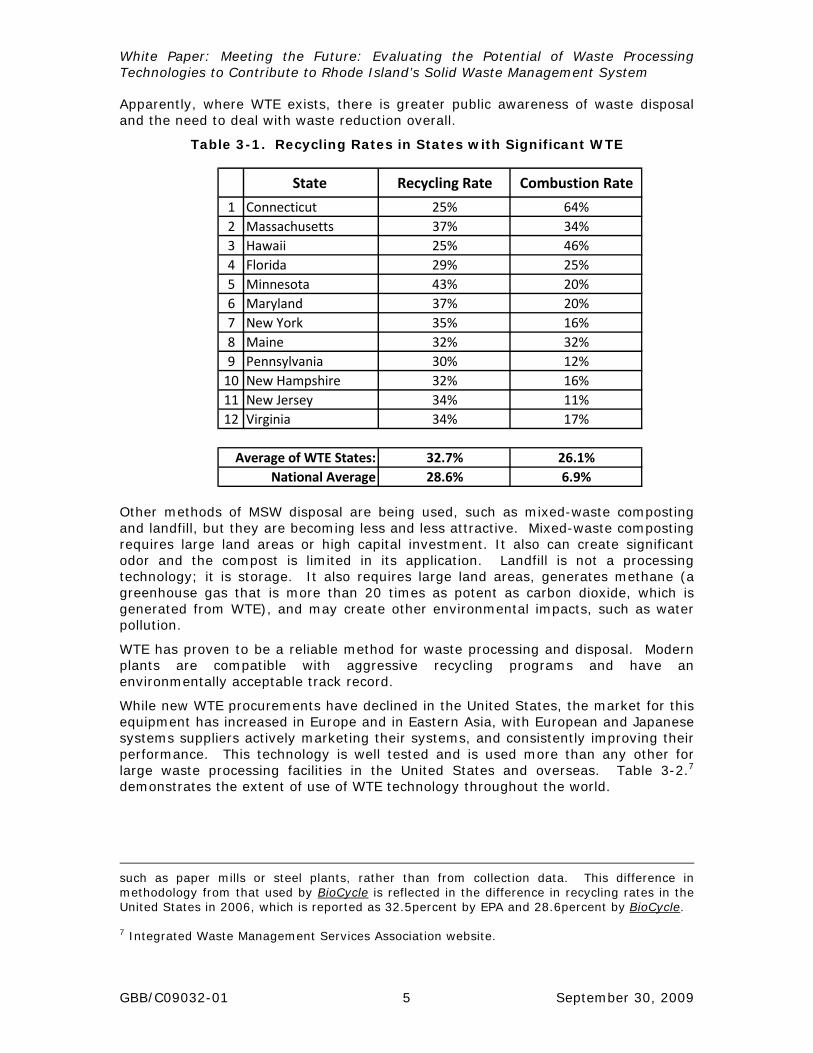
Apparently, where WTE exists, there is greater public awareness of waste disposal and the need to deal with waste reduction overall.
Table 3-1. Recycling Rates in States with Significant WTE
Other methods of MSW disposal are being used, such as mixed-waste composting and landfill, but they are becoming less and less attractive. Mixed-waste composting requires large land areas or high capital investment. It also can create significant odor and the compost is limited in its application. Landfill is not a processing technology; it is storage. It also requires large land areas, generates methane (a greenhouse gas that is more than 20 times as potent as carbon dioxide, which is generated from WTE), and may create other environmental impacts, such as water pollution.
WTE has proven to be a reliable method for waste processing and disposal. Modern plants are compatible with aggressive recycling programs and have an environmentally acceptable track record.
While new WTE procurements have declined in the United States, the market for this equipment has increased in Europe and in Eastern Asia, with European and Japanese systems suppliers actively marketing their systems, and consistently improving their performance. This technology is well tested and is used more than any other for large waste processing facilities in the United States and overseas. Table 3-2.7 demonstrates the extent of use of WTE technology throughout the world.
such as paper mills or steel plants, rather than from collection data. This difference in methodology from that used by BioCycle is reflected in the difference in recycling rates in the United States in 2006, which is reported as 32.5percent by EPA and 28.6percent by BioCycle. 7 Integrated Waste Management Services Association website.
State Recycling Rate Combustion Rate
1 Connecticut 25% 64%2 Massachusetts 37% 34%3 Hawaii 25% 46%4 Florida 29% 25%5 Minnesota 43% 20%6 Maryland 37% 20%7 New York 35% 16%8 Maine 32% 32%9 Pennsylvania 30% 12%10 New Hampshire 32% 16%11 New Jersey 34% 11%12 Virginia 34% 17%
32.7% 26.1%28.6% 6.9%
Average of WTE States:National Average

White Paper: Meeting the Future: Evaluating the Potential of Waste Processing Technologies to Contribute to Rhode Island’s Solid Waste Management System
GBB/C09032-01 6 September 30, 2009
Table 3-2. Use of Waste-to-Energy Facilities Worldwide
Location Number
of Facilities
Amount of MSW Managed by WTE as a percent of Total MSW
Generated
USA 87 8 to 15 percent based on MSW reported
by EPA and BioCycle
Europe 400 varies from country to country
Japan 100 70 to 80 percent
Other nations (Taiwan, Singapore, China, etc.)
70 varies from country to country
In New England, there are 19 WTE facilities currently operating, processing about 19,200 TPD of MSW. Table 3-3 describes those plants.
Table 3-3. Waste-to-Energy Plants in New England8
State Location
Size (TPD)
Start Date
Energy Product
Connecticut Bristol 650 1988 Electricity Hartford 2000 1987 Electricity Lisbon 502 1995 Electricity SECONN/Preston 689 1992 Electricity Wallingford 420 1989 Electricity Bridgeport 2250 1988 Electricity Maine Biddeford - MERC 600 1987 Electricity Auburn 200 1992 Electricity Penobscot/Orrington 720 1988 Electricity Portland 502 1988 Electricity Massachusetts Springfield - Agawam 408 1988 cogeneration Haverhill 1650 1989 Electricity Pittsfield 360 1981 Steam SEMASS/Rochester 3000 1988 Electricity Millbury 1500 1987 Electricity North Andover 1500 1985 Electricity Saugus 1500 1975 Electricity New Hampshire Claremont 200 1987 Electricity Concord 575 1989 Electricity
The following sections describe the basic types of MSW combustion technologies, which have been in use for decades in the U.S.
8 IWSA 2007 Directory, Integrated Waste Services Association (now the Energy Recovery Council; www.energyrecoverycouncil.org)

White Paper: Meeting the Future: Evaluating the Potential of Waste Processing Technologies to Contribute to Rhode Island’s Solid Waste Management System
GBB/C09032-01 7 September 30, 2009
3.1 Mass-Burn/Waterwall Combustion
3.1.1 Process Description
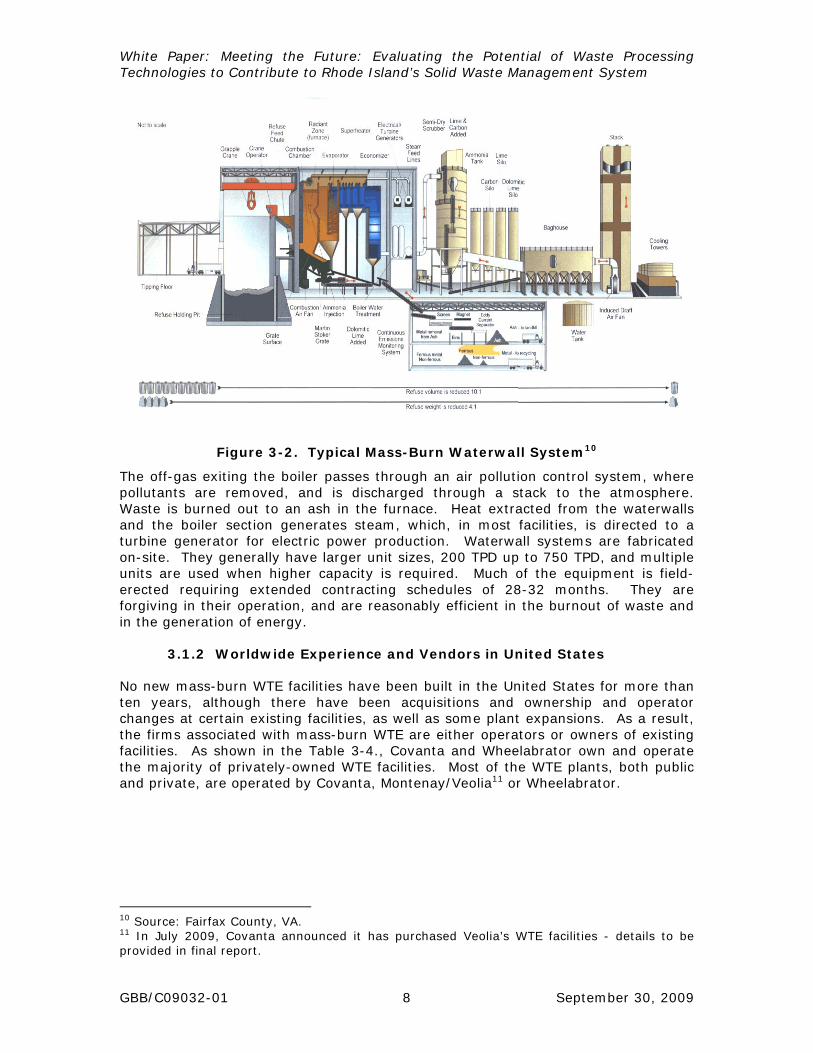
In mass-burn waterwall combustion, MSW is placed directly into the system for incineration with no pre-processing, except for removal of large non-combustible items (refrigerators, washing machines, microwave ovens, etc.). Waste is fed onto a grate at the bottom of a combustion chamber in a furnace with walls built of water tubes, as shown in Figure 3-1.
Figure 3-1. Waterwall Furnace Section9
Half the heat generated from the burning waste is absorbed by the water walls and the balance heats water in the boiler (evaporator, super heater and economizer), as shown Figure 3-2.
9 Source: Babcock and Wilcox.
White Paper: Meeting the Future: Evaluating the Potential of Waste Processing Technologies to Contribute to Rhode Island’s Solid Waste Management System
GBB/C09032-01 8 September 30, 2009
Figure 3-2. Typical Mass-Burn Waterwall System10
The off-gas exiting the boiler passes through an air pollution control system, where pollutants are removed, and is discharged through a stack to the atmosphere. Waste is burned out to an ash in the furnace. Heat extracted from the waterwalls and the boiler section generates steam, which, in most facilities, is directed to a turbine generator for electric power production. Waterwall systems are fabricated on-site. They generally have larger unit sizes, 200 TPD up to 750 TPD, and multiple units are used when higher capacity is required. Much of the equipment is field-erected requiring extended contracting schedules of 28-32 months. They are forgiving in their operation, and are reasonably efficient in the burnout of waste and in the generation of energy.
3.1.2 Worldwide Experience and Vendors in United States
No new mass-burn WTE facilities have been built in the United States for more than ten years, although there have been acquisitions and ownership and operator changes at certain existing facilities, as well as some plant expansions. As a result, the firms associated with mass-burn WTE are either operators or owners of existing facilities. As shown in the Table 3-4., Covanta and Wheelabrator own and operate the majority of privately-owned WTE facilities. Most of the WTE plants, both public and private, are operated by Covanta, Montenay/Veolia11 or Wheelabrator.
10 Source: Fairfax County, VA. 11 In July 2009, Covanta announced it has purchased Veolia’s WTE facilities - details to be provided in final report.

White Paper: Meeting the Future: Evaluating the Potential of Waste Processing Technologies to Contribute to Rhode Island’s Solid Waste Management System
GBB/C09032-01 9 September 30, 2009
Table 3-4. U.S. Mass-Burn/Waterwall Facilities12
Entity Owned Operated Covanta 14 31 Montenay/Veolia 2 10 Public 49 18 Wheelabrator 10 16 Other 12 12 Total 87 87
Source: IWSA 2007 Directory, Integrated Waste Services Association (now the Energy Recovery Council)
Some of the mass-burn facilities were designed by American firms with proprietary technology, such as Detroit Stoker, Combustion Engineering and Babcock & Wilcox, but the majority of these existing systems are of European design. The two leading suppliers of WTE grate systems in the United States and overseas are The Martin Company of Germany and Von Roll of Switzerland represented in the U.S. by Covanta and Wheelabrator respectively.
While new WTE facility procurements have declined in the United States, the market for this equipment has increased in Europe and in Eastern Asia, with European and Japanese systems suppliers actively marketing their systems, they have been consistently improving both their energy production and environmental performance. This technology is mature and is used more than any other for large WTE facilities in the United States and overseas.
3.2 Mass-Burn/Modular Combustion
3.2.1 Process Description
Modular combustion is another incineration process. Unprocessed MSW is placed directly into a refractory lined chamber. The primary chamber of the incinerator includes a series of charging rams which push the burning waste from one level to another until it burns-out to an ash and is discharged to a wet ash pit, as in Figure 3-3.
Less than the ideal amount of combustion air is injected into the primary combustion chamber, and the gas from the burning waste does not fully burn out at this location. It is directed to a secondary combustion chamber where additional air is added to
12 In July 2009, Covanta announced it has purchased some of Veolia’s WTE facilities - details to be provided in final report.
Figure 3-3. Typical Modular Combustion System
Source: Consutech Systems, Richmond, VA

White Paper: Meeting the Future: Evaluating the Potential of Waste Processing Technologies to Contribute to Rhode Island’s Solid Waste Management System
GBB/C09032-01 10 September 30, 2009
complete the burning process. Hot gases pass though a separate waste heat boiler for steam generation, and then through an air pollution control system, before discharge through the stack to atmosphere.
A major advantage of this system is injection of less air than ideal in the primary combustion chamber. With less air, the fans can be smaller and the chamber itself can be smaller than with other systems. Also, with less air flow, less particulate matter (soot) enters the gas stream, resulting in the air pollution system being sized for a smaller load.
Modular systems are factory built and can be brought to a site and set up in a relatively short period of time, e.g., 18-24 months. They are less efficient than waterwall units in waste burn-out and in energy generation. They have been built in unit sizes up to 150 tons per day.
3.2.2 Worldwide Experience and Vendors in United States
Modular systems are used for smaller WTE facilities and for industrial applications. There are a number of American firms supplying such systems in the United States, and they are very competitive in overseas markets as well. The more active of these suppliers are Consutech Systems (formerly Consumat) of Richmond, Virginia, Enercon Systems, Inc. of Elyria, Ohio, and Basic Environmental Engineering of Chicago, Illinois. They have each been supplying incineration systems for MSW and other wastes for over 25 years.
Other U.S. firms, such as Energy Answers of Albany, NY, and Covanta Energy of Fairfield, NJ, are marketing project development and management services for modular WTE facilities.
3.3 Refuse Derived Fuel/Dedicated Boiler
3.3.1 Process Description
In the refuse derived fuel systems, MSW is mechanically processed in a “front end” system to produce a more homogenous and easily burned fuel, Refuse Derived Fuel (RDF). RDF, as shown in Figure 3-4, in its simplest form, is shredded MSW with ferrous metals removed. Additional processing can be applied to the incoming waste stream to remove other non-combustible materials such as glass and aluminum. Additional screening and shredding stages can be placed in the processing line to further enhance the RDF. The RDF produced is blown into the furnace from the left, above the grate, see Figure 3-4. What does not burn in suspension (above the grate) will burn on the grate, and the hot gases generated will pass through a waterwall section and then a boiler section. This system is similar to the mass-burn waterwall facility except in the nature of waste charging and burnout.

White Paper: Meeting the Future: Evaluating the Potential of Waste Processing Technologies to Contribute to Rhode Island’s Solid Waste Management System
GBB/C09032-01 11 September 30, 2009
Figure 3-4. Typical RDF Combustion Facility13
Source: Energy Answers Corporation.
The unique feature of RDF systems is in the pre-processing of waste. As seen in the diagram of a typical RDF processing facility in Figure 3-5, MSW enters the facility and then passes through a pre-trommel, where bags of waste are broken open. Materials dropping out of the pre-trommel passes through another trommel, but the majority of waste go through a shredder. A magnetic separator removes ferrous metals and the balance of the material is fired in the furnace.
Figure 3-5. Typical RDF Processing Facility
Source: generic.
13 Energy Answers Corporation

White Paper: Meeting the Future: Evaluating the Potential of Waste Processing Technologies to Contribute to Rhode Island’s Solid Waste Management System
GBB/C09032-01 12 September 30, 2009
Other configurations may include additional separating equipment, or may not use any trommels, but the RDF generated is always shredded, so that it is capable of being blown into a furnace. Although results vary with the processing configuration, in general about 80 percent of the incoming waste stream is converted into RDF for the thermal process. An advantage of this system is in the removal of metals and other materials from the waste stream. While not all these facilities include this step in the processing line, those that do can realize revenue from the sale of recovered metal. For instance, at the North County Resource Recovery Project in West Palm Beach, Florida, the nominal 3,000 TPD facility removed and sold over 36,000 tons of ferrous metals in 2004, which represents over 3 percent of the weight of the incoming waste stream. With the removal of non-combustibles, the specific heat content of the RDF can be increased by 10 percent over the original MSW.
3.3.2 Worldwide Experience and Vendors in U.S.
As with mass-burn systems, there have not been any new RDF systems constructed in the United States in the past decade. For most of the 12 RDF WTEs currently in operation, Excel, Veolia and Covanta Energy are the operating contractors. Equipment used in this technology is adapted from equipment provided in coal-fired electricity generation plants, and there are many established U.S. system and equipment suppliers, such as Foster Wheeler, Riley Power Inc. (a Babcock Power Inc. company, formerly Riley Stoker Corp.), and Babcock and Wilcox.
3.4 Refuse-derived Fuel/Fluidized Bed
3.4.1 Process Description
For fluidized bed combustion, MSW is shredded to less than four inches mean particle size using an RDF process similar to that described in 3.3.1 above to produce the fuel. The RDF is blown into a bed of sand at the bottom of a vertical cylindrical furnace, as shown in Figure 3-6. Hot air is also injected into the bed from below, and the sand has the appearance of a bubbling fluid as the hot air agitates the sand particles. Moisture in the RDF is evaporated almost instantaneously upon entering the bed, and organics burn out both within the bed and in the freeboard, the volume above the bed. Steam tubes are embedded within the bed and a transverse section of boiler tubes captures heat from the flue gas exiting the furnace; an Energy Products of Idaho (EPI) system is shown in Figure 3-7. EPI fluidized bed system in La Crosse; WI is fueled by RDF and hogged waste wood. It consists of two 251 TPD units. The RDF is produced in a remote facility, located in Elbe River, WI.

White Paper: Meeting the Future: Evaluating the Potential of Waste Processing Technologies to Contribute to Rhode Island’s Solid Waste Management System
GBB/C09032-01 13 September 30, 2009
Figure 3-6. Typical RDF Fluid Bed System
Source: Energy Products of Idaho, Coeur D’Alene, ID.
Fluid bed incineration is more efficient than grate burning-based incineration systems. The fluid bed is very effective in waste destruction and requires less air flow than mass-burn or modular systems. The fluid bed, however, does require relatively uniform sized material and removal of certain slagging materials, therefore RDF preparation is necessary. It is required for operation of the fluidized bed, not, as with the above systems, for materials recovery.
An RDF/Gasification/Incineration technology similar to that described above is a product of Ebara Corporation of Tokyo. They have four such systems in operation for MSW and industrial wastes in Japan, ranging in size from 185 TPD to 460 TPD. Their variation of the fluid bed system described above is the fluidized-bed gasifier, shown in Figure 3-7.
Figure 3-7. RDF Fluidized Bed Gasification System
Source: Ebara Corporation, Tokyo, Japan. This system is described as fluidized bed gasification, and the difference from fluidized bed incineration is that it exports a burnable gas. RDF is first prepared
White Paper: Meeting the Future: Evaluating the Potential of Waste Processing Technologies to Contribute to Rhode Island’s Solid Waste Management System
GBB/C09032-01 14 September 30, 2009
using a process similar to the ones illustrated in Figures 3-4 and 3-5. The RDF (called “wastes” in Figure 3-7) is then charged to the fluid bed and the gas generated is directed to a combustion chamber, shown above, with molten slag dropping out to a water-cooled sump. The molten slag solidifies into a glass-like material which can be used as a construction material or fill. Heat from the gas fired in the combustion chamber is captured in hot water tubes to generate steam which can be used for electric power generation. Without the generation of a usable gas stream, and with the necessity of a combustion chamber for gas burn-out, this system is an incinerator.
3.4.2 Worldwide Experience and Vendors in U.S.
There are several RDF/fluid bed systems operating in Europe (particularly in Scandinavia, where a number of fluid bed incinerator manufacturers are located). In the United States fluidized bed combustion using RDF as a fuel include: French Island, WI, owned and operated by Excel Energy of Minneapolis and Tacoma Washington Municipal Utility. The equipment was supplied by Energy Products of Idaho in Coeur d’Alene, the only U.S. firm currently manufacturing fluid bed furnaces for RDF firing. Other U.S. firms, Foster Wheeler, Babcock & Wilcox, and others, have provided fluidized bed units utilizing coal, rice hulls and other feedstocks.
4.0 Emerging Waste Technologies
There are many technologies currently being proposed for the treatment and disposal of MSW throughout the world. Most of these involve thermal processing, but some others comprise the biological or chemical decomposition of the organic fraction of the waste to produce useful products like compost or energy products, notably synthetic gas (“syngas”) for downstream combustion.
Thermal processing refers to a number of different types of technologies utilizing heat as the mode of waste treatment. There are over 100 offerors of gasification, pyrolysis, plasma arc, and anaerobic digestion technologies. We have selected some example companies to illustrate the technologies; no endorsement is implied.
4.1 Pyrolysis
In pyrolysis, an organic waste (MSW) is heated without oxygen (or air), similar to the generation of coke from coal or charcoal from wood. Both a char and a gas are generated. The gas is burned out in a gaseous phase, requiring much less oxygen than incineration, and the char will usually melt at the temperatures within the pyrolysis chamber and will be discharged as a black gravel-like substance, termed frit. Advantages of this process are in the lack of air entering the chamber and the resulting smaller size of system components. Without air, there is little nitrogen oxide generation, and low particulate (soot) formation. There have been many attempts to develop this technology outside a laboratory or a pilot plant. In past demonstrations in the 1970s, it was difficult to maintain a sealed chamber to keep air out, and waste variability creates problems in maintaining consistent operation. When the pyrolysis gas is fired in a combustion chamber that is part of the system, the system is classified as an incinerator. Currently, there are no full-scale pyrolysis systems in commercial operation on MSW in the United States.
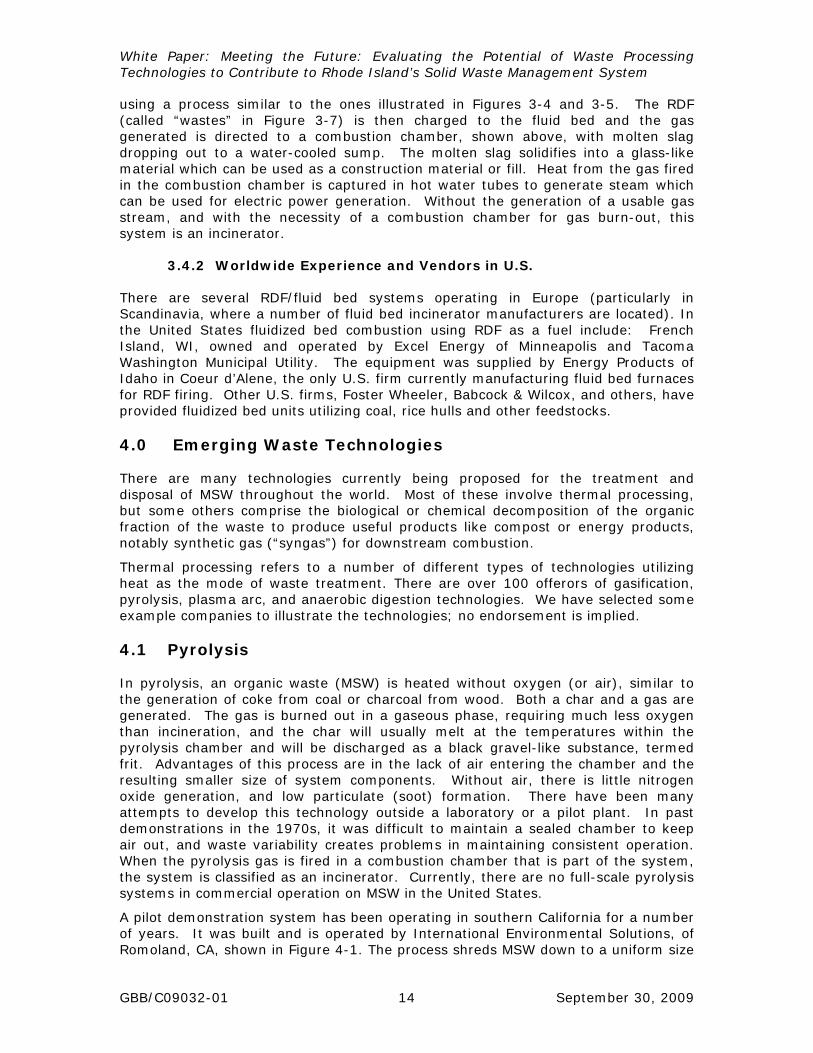
A pilot demonstration system has been operating in southern California for a number of years. It was built and is operated by International Environmental Solutions, of Romoland, CA, shown in Figure 4-1. The process shreds MSW down to a uniform size

White Paper: Meeting the Future: Evaluating the Potential of Waste Processing Technologies to Contribute to Rhode Island’s Solid Waste Management System
GBB/C09032-01 15 September 30, 2009
capable of feeding into the thermal converter, or pyrolysis chamber. The pyrolysis gas generated is fired in a secondary combustion chamber, or thermal oxidizer, and passes through a waste heat boiler for heat recovery. Char drops out the bottom of the pyrolysis chamber for disposal or further processing for recovery of metals and other constituents. Although this system is marketed as a pyrolysis system, a combustion chamber is necessary for its operation (for destroying organics in the off-gas) and the presence of this chamber classifies the system as an incinerator.
Figure 4-1. Process Diagram of a Pyrolysis System14
4.2 Gasification
Gasification is the heating of an organic waste (MSW) to produce a burnable gas (approximately 85 percent hydrogen and carbon monoxide mix) for use off-site. While pyrolysis systems are primarily focused on waste destruction, a gasifier is designed primarily to produce a usable gas. As shown in Figure 4-2, Thermoselect, a European firm represented in the U.S. by Interstate Waste Technologies (IWT) of Malvern, PA, has developed a system composed of 400 TPD modules processing MSW.
14 Source: International Environmental Solutions, Inc., Romoland, CA.

White Paper: Meeting the Future: Evaluating the Potential of Waste Processing Technologies to Contribute to Rhode Island’s Solid Waste Management System
GBB/C09032-01 16 September 30, 2009
Figure 4-2. Typical Gasification System
Source: Interstate Waste Technologies, Malvern, PA. Waste is fed into a gasification chamber to begin the heating process, first having been compressed to remove entrapped air. Some oxygen, sufficient only to maintain the heat necessary for the process to proceed, is injected into the reactor, where temperatures in excess of 3,000oF are generated. At this high temperature, organic materials in the MSW will dissociate into hydrogen, methane, carbon dioxide, water vapor, etc., and non-organics will melt and form a glass-like slag. The gas is cleaned, water is removed, and it can be used for power generation, heating or for other purposes. The glass-like slag can be used as fill, or as a building material for roads, etc.
Seven plants with this technology are currently operating in Japan, with at least two of them firing MSW. The largest of these plants in Kurashibi has a reported furnace size of 185 TPD, with three units of this size. Their largest facility fires up to 555 (Metric) TPD of MSW.
Another gasifier marketed for MSW is built by EnTech of Devon, England.
Zinc Concentrate
Salt
Clean water
Sulfur
Synthesis Gas Production ofHydrogen Methanol Ammonia
or Power
generation
O2Press
Degassing Channel
Oxygen generation facility
Homogenization reactor
QuenchHigh Temperature
Reactor
Wastes
Process water treatment
Synthesis gas scrubbing
Metals and Minerals
1600°C2000°C
1,200°C
Scrubber
H2, CO, CO2, H2O

White Paper: Meeting the Future: Evaluating the Potential of Waste Processing Technologies to Contribute to Rhode Island’s Solid Waste Management System
GBB/C09032-01 17 September 30, 2009
Figure 4-3. EnTech Process Schematic
Source: EnTech.
This system generates, in addition to a salable gas (synthetic natural gas, or syngas), recyclable plastics and other potential revenue streams. As shown in Figure 4-3, MSW is classified by a combination bag breaker and gravity separator process, termed a Kinetic Streamer. Oversize materials, which are basically inorganic, are directed either to a plastics recycler or a non-plastics recycling station, while the majority of waste (presumably organic) is directed to a dryer to remove entrained moisture. The dryer utilizes the latent heat inherent in the organic content of the waste to produce the heat necessary to drive the gasification process. The syngas can be fired in a waste heat boiler for steam and subsequent electric power production. Approximately 20 of these facilities are in operation on MSW in Europe and Asia. Most of them are relatively small (less than 10 tons per day), with none designed for more than 70 tons per day throughput.
Two Canadian firms have advanced gasification. Enerkem, headquartered in Montreal, Quebec, has an operating pilot gasification facility in Sherbrooke, Quebec, and is building a commercial facility in Edmonton, Alberta. These facilities produce ethanol. The Plasco Energy Group, which has a five-TPD research facility in Spain, operates a 100-TPD pilot plant in Ottawa, Ontario. Plasco has a letter of intent from the City of Ottawa for a 400-TPD commercial facility.
4.3 Anaerobic Digestion
As applied to the processing of MSW, anaerobic digestion is a wet treatment process where waste is first pre-sorted and then fed into water tanks. Using agitators, pumps, conveyors and other materials handling equipment, MSW is wetted and formed into slurry. Metals, glass and other constituents of MSW that have no affinity for water are eventually discharged from the system into dedicated containers for recycling, further processing or final disposal. The paper, garbage, soluble components, etc., generate “black water” which has a relatively high organic content. This stream is processed in a series of sealed digesters without air where

White Paper: Meeting the Future: Evaluating the Potential of Waste Processing Technologies to Contribute to Rhode Island’s Solid Waste Management System
GBB/C09032-01 18 September 30, 2009
Figure 4-5. ArrowBio Facility in Sydney
microorganisms break down the solids and generate gas containing methane. The time in the chamber and the residence time will be sufficient to generate the gas. The process is shown in the schematic in Figure 4-4.
Figure 4-4. Process Flow for Anaerobic Digestion System
Source: ArrowBio
This gas is rich in methane and other organics and can be burned as a fuel for heating or for electric power generation. The solid residual from the digestion process is similar to compost and can be used as a soil amendment. The process also separates out recyclable materials such as glass and metals. There are many such facilities processing sewage sludge, manure and other homogeneous wastes.
ArrowBio of Haifa, Israel, is a vendor offering to construct anaerobic digestion facilities to process MSW in the United States. They have responded to procurements in Los Angeles and New York. They operate a 300-TPD, full-scale MSW demonstration process line in Tel Aviv and have a 270-TPD, commercial scale plant for MSW operating in Sydney, Australia, illustrated in Figure 4-5.
The system operates without high temperatures or pressure. In theory, it is extremely simple, relying on non-specialized mechanical equipment (pumps, screens, macerators, tanks, conveyors, etc.) for operation. Digestion occurs through the presence of natural microorganisms in MSW, so charging with specialty or unique bacteria is not necessary.
4.4 Mixed Waste Composting
Composting is a natural process that depends on the action of microscopic organisms to break down organic matter. Composting has been used for hundreds of years to process a variety of agricultural wastes. There are two types of micro-organisms

White Paper: Meeting the Future: Evaluating the Potential of Waste Processing Technologies to Contribute to Rhode Island’s Solid Waste Management System
GBB/C09032-01 19 September 30, 2009
that digest the organic materials: aerobic and anaerobic. The first need oxygen or air to function and the latter work without oxygen. Anaerobic composting produces combustible biogas as a byproduct. There are five factors that influence the composting process: (1) moisture, (2) oxygen or air, (3) temperature, (4) chemical balance of carbon and nitrogen and (5) particle size. Large scale mixed waste composting facilities are industrial plants which receive waste and grind the material in large shredders, removing inert materials by screening and other processes. The feed material is then moved to the composting vessel where the organic materials are digested by the micro-organisms. The process and factors 1 through 3 are controlled by computer. After initial processing the resulting compost product is stored to “cure” and then it is ready to be sold. Using California post-recycling waste composition data,15 it is estimated that aerobic composting would reduce the waste landfilled to 25 percent of the initial feed. There would be 43 percent recovered as compost and material products and 32 percent released to the atmosphere as gases (mainly CO2 and water vapor). There are several hundred mixed waste composting plants in Europe, both aerobic and anaerobic. The trend seems to be toward segregating bio-wastes and then composting to produce biogas. In the United States, composting is used primarily to process yard waste and sewage sludge, and there are thousands of successful projects. BioCycle reports16 that there are 13 mixed solid waste composting facilities operating in the United States. These are generally small units processing less than 120 tons per day, with two facilities processing 200 to 250 tons per day. Large scale plants have been built in Portland, OR, Baltimore, MD, Miami, FL, Atlanta, GA and Pembroke Pines, FL, all of which failed for technical reasons, like odor control, or financial difficulties. A key problem has been that the quality of the products produced was lower than expected, which reduced the revenues and made the projects too costly and/or non-competitive with other available alternatives.
4.5 Plasma Arc
Plasma arc refers to the means of introducing heat into the process. Essentially a plasma arc system is a pyrolysis or starved air process generating heat by firing the waste with a plasma torch using electric current to produce a syngas, which is then combusted to produce steam and/or electricity, and is classified as an incinerator. If the system generates an off-gas that contains burnable gases (e.g., hydrogen and carbon monoxide) that can be used off-site, it can be classified as a gasifier. A typical unit is shown in Figure 4-6.
15 Statewide Waste Characterization Study, California Integrated Waste Management Board,
December 1999. 16 BioCycle Magazine, JG Press, Inc., November 2008.

White Paper: Meeting the Future: Evaluating the Potential of Waste Processing Technologies to Contribute to Rhode Island’s Solid Waste Management System
GBB/C09032-01 20 September 30, 2009
Figure 4-6. Cross-section of a Plasma Arc Furnace
Source: Westinghouse Plasma Corporation
Plasma is a collection of free-moving electrons and ions across a gas volume at reduced pressure. The gas molecules, losing one or more electrons, become positively charged ions capable of transporting electric current and generating heat when the electrons go into a stable state and release energy similar to lighting in the atmosphere. Plasma can reach temperatures exceeding 7,000° F. Molten slag from the process is about 3000° F. The by-products of plasma gasification are similar to those produced in other high-temperature gasification technologies. Similar to other gasification technologies, plasma gasification requires the pre-processing of the MSW feed to reduce the particle size before its introduction into the plasma reactor. One of the primary drawbacks of plasma arc technology is the huge parasitic load of the plasma torches. Therefore, the net electric output of the conversion process, if generating electricity for sale from the system, would be substantially reduced. There are no commercial-scale plasma arc facilities processing MSW in the U.S., although several companies are marketing some form of this technology and proposing facilities. There are three small plasma arc facilities processing MSW and/or auto-shredder residue in Japan reportedly using the Westinghouse plasma technology. Few, if any of the plasma arc pilot facilities have been able to generate a fuel gas (synthetic natural gas, or syngas), and air emissions have been found to be no better than conventional incineration systems. The firm Geoplasma, from Atlanta, has been negotiating a contract for construction of a plasma arc facility for MSW in St. Lucie County, Florida, which is also proposed to be used for processing mined landfill waste. Currently, the development agreement has been signed and the County is waiting on Geoplasma to secure customer agreements for the sale of the syngas to the local energy companies before proceeding with construction.
4.6 Chemical Decomposition
Chemical decomposition, also referred to as depolymerization, is a process whereby waste feedstocks are directly liquefied into useful chemical feedstocks, oils and/or gases. The oils are a replacement for fuel oil and the gases consist of carbon monoxide, hydrogen and methane. The process generally utilizes medium temperature and pressure to break large complex molecules into smaller ones. If higher temperatures are employed, chemical decomposition becomes indistinguishable from gasification. The solid waste feedstock for chemical decomposition will generally be pre-processed to remove recyclable and inert materials and to reduce the particle size. Moisture is favorable to the process and may need to be added to create steam reforming reactions. The process is multi step: gas recovery, liquid separation to isolate the oil product, and processing the solids to separate carbon char from inerts. Chemical

White Paper: Meeting the Future: Evaluating the Potential of Waste Processing Technologies to Contribute to Rhode Island’s Solid Waste Management System
GBB/C09032-01 21 September 30, 2009
decomposition processes require an external energy source to make the reactions take place. Changing World Technologies (CWT) offers a chemical decomposition process that they indicate can be applied to mixed solid waste. Currently, they have a plant operating on poultry waste in Carthage, MO, which was commissioned in 2005. CWT was selected for further consideration by the City of Los Angeles. One form of chemical decomposition is used to break cellulose into sugars for fermenting to produce ethanol. This is the hydrolysis process, of which two types have been applied to the organic components of solid waste: acid hydrolysis and enzyme hydrolysis. They have also been used in combination. The National Renewable Energy Laboratory developed and has operated pilot processes, which have demonstrated technically feasibility. No production plants, however, have been built to date. The City of Los Angeles received nine submissions for hydrolysis processes, including those from Arkenol and Iogen, a DOE demonstration and commercialization project contractor. No hydrolysis process was selected by the City of Los Angeles. Microwaves can be used as the external heat source for chemical decomposition or depolymerization. Microwave systems have been built to decompose some special wastes, particularly tires. Goodyear obtained a patent to “de-vulcanize” tires and built a facility to process in-plant scrap in the late 1970s. Several small units have been operated on tires. The application of microwaves to drying and decomposition of various wastes, including medical waste and nuclear waste, is proven, but its application to municipal solid waste has not been proven but is being promoted by Molecular Waste Technologies, Inc. Global Resource Corporation also proposes microwave plants for MSW, but has not constructed one.
5.0 Recent Reports/Procurements for Waste Processing Technologies
The last new MSW-processing WTE facility constructed in the U.S. commenced operations in 1996.17 Since that time, no new greenfield commercial plant has been implemented. Several reasons accounted for this lull of activity in the WTE field:
1. Loss of Tax Credits – The 1986 Tax Reform Act eliminated the significant tax benefits for project owners/developers, contributing to the pipeline of projects.
2. Environmental Activism – Biased information about air pollution and ash impacts, and preferences for recycling, created public resistance.
3. U.S. Supreme Court’s Carbone Decision18 (1994) – Effectively ended legislated flow control, creating uncertainty in the revenue stream for projects.
4. Megafills – Large landfills with low tipping fees and no put-or-pay waste supply requirement out-competed WTE for the market.
5. Amendment to the Clean Air Act (1998) – New regulations required retrofit on existing plants and drove up WTE costs, effective as of December 2000.
17 Covanta Energy’s 2,250 TPD mass burn plant in Niagara Falls, NY. 18 C & A Carbone, Inc. v. Town of Clarkstown, 511 U.S. 383 (1994).

White Paper: Meeting the Future: Evaluating the Potential of Waste Processing Technologies to Contribute to Rhode Island’s Solid Waste Management System
GBB/C09032-01 22 September 30, 2009
6. Lack of Federal Leadership – Visible opposition by EPA to combustion and preference for waste reduction/recycling sent negative message about WTE.
7. Moderate Fossil Fuel Costs – The rapidly increasing fossil fuel costs of the 70s and 80s stabilized, reducing the value of the energy products from WTE facilities, which were key drivers in facilities developed earlier, and making overall project economics less attractive.
In the past few years, however, interest in WTE and waste conversion has begun to grow again. This renewed interest in waste processing technologies is due to several factors:
1. Proven WTE Track Record – Superior environmental performance, reliability, advancements in technology and successful ash handling, including ash recycling and use in construction and elsewhere, have made WTE an acceptable option to consider as part of waste management planning. In addition, WTE facilities are eligible for Renewable Energy Credits in some 26 states. However, the Rhode Island definition for Eligible Biomass Fuels would need modification. Further, a WTE facility would be eligible for carbon credits under proposed federal legislation
2. Increasing Fossil Fuel Costs – With the price of oil increasing significantly in 2008, the cost of transportation fuels is making MSW hauling and landfilling more expensive; in addition, the cost of electricity from fossil fuels is increasing, making electricity from waste more valuable and making WTE more competitive.
3. Growing Interest in Renewable Energy – Many states are requiring utilities to generate a portion of their electricity from renewable sources, which sometimes includes WTE; the Federal government has included WTE in its definition of renewable energy.
4. Concern About Greenhouse Gases – WTE has a smaller carbon footprint than landfilling or fossil-fuel generated electricity.
5. Reversal of Carbone – The recent Supreme Court decision in the Oneida-Herkimer case19 effectively restored to state and local governments the ability to implement flow control, increasing the security of the waste stream to support the financing of WTE projects.
6. Change in Approach by EPA – The U.S. EPA revised its waste management hierarchy to include WTE explicitly as the third priority after waste reduction and recycling/composting.
These and other local considerations have led a growing number of communities to re-investigate waste processing technologies as a component of their solid waste management systems. The following sections describe several of the recent initiatives to evaluate and choose waste processing technologies – WTE and others – to handle significant waste streams in the future. At the end of Section 5.0 is a summary of the technologies and vendors selected through these evaluation processes that represent the most promising alternatives for adopting WTE as a waste disposal option.
19 United Haulers Assn., Inc. v. Oneida-Herkimer Solid Waste Management Authority, No. 05-1345, 2007 WL 1237912 (U.S. April 30, 2007).

White Paper: Meeting the Future: Evaluating the Potential of Waste Processing Technologies to Contribute to Rhode Island’s Solid Waste Management System
GBB/C09032-01 23 September 30, 2009
5.1 Recent Plans and Reports
5.1.1 New York City, NY20
In 2004, the City of New York commissioned a report to evaluate new and emerging waste management and recycling technologies and approaches. The objective of the evaluation was to provide information to assist the City in its ongoing planning efforts for its waste management system. The report identified which innovative technologies were available at present, i.e., commercially operational processing of MSW, and which were promising, but in an earlier stage of development. It also compared the newer technologies to conventional waste-to-energy technology to identify the potential advantages and disadvantages that may exist in the pursuit of innovative technologies. Conventional waste-to-energy was chosen as a point of comparison since such technology was the most widely used technology available today for reducing the quantity of post-recycled waste being landfilled. The report was released in September 2004. 44 companies responded to the initial request for information. As of November 30, 2007 the City is about to commence with a siting Task Force to look at the five boroughs to identify a site on which to build a pilot facility. Once the site has been identified an RFP will put together based on the specifications and condition of the site and will be made available to all proven and unproven technology vendors.
As part of the process, the City collected information on capital cost from the suppliers. Based on 6 responses, the capital cost per installed ton for anaerobic digestion ranged from $74,000 to $82,000; for gasification, the range was $155,000 to $258,000; one pyrolysis response gave a capital cost of $321,000. These figures were for plants of widely varying sizes and were not standardized. The City has initiated a follow up study, the results of which should be publicly available toward the end of the summer 2009.
5.1.2 City of Los Angeles, CA
Phase I21 In 2004, the City of Los Angeles, Bureau of Sanitation (Bureau) began a study to evaluate MSW alternative treatment technologies capable of processing Black Bin material (curbside-collected residential MSW) to significantly reduce the amount of such material going to landfills. The Bureau’s overall objective was to select one or more suppliers to develop a facility using proven and commercialized technology to process the Black Bin material and produce usable by-products such as electricity, green fuel, and/or chemicals. The first step of this project was to develop a comprehensive list of potential technologies and suppliers. About 225 suppliers were screened, and twenty-six suppliers were selected to submit their detailed qualifications to the City. In order to screen the technology suppliers, they were sent a brief survey based upon the technology screening criteria. The criteria applied were as follows:
20 Evaluation of New and Emerging Solid Waste Management Technologies, September 16, 2004. 21 Evaluation of Alternative Solid Waste Technologies, City of Los Angeles, Prepared by URS Corporation, September 2005

White Paper: Meeting the Future: Evaluating the Potential of Waste Processing Technologies to Contribute to Rhode Island’s Solid Waste Management System
GBB/C09032-01 24 September 30, 2009
• Waste Treatability: The supplier was screened on whether they have MSW or
similar feedstock processing experience.
• Conversion Performance: The supplier was asked if their facility would produce marketable byproducts.
• Throughput Requirement: This criterion was already met because the
technology passed the technology screen.
• Commercial Status: This criterion was already met because the technology passed the technology screen.
• Technology Capability: The supplier was asked if their technology had
processed at least 25 tons/day of feedstock. Of the twenty-six suppliers requested to submit qualifications, seventeen provided responses. These suppliers and their technologies were thoroughly evaluated and an Evaluation Report was published in September 2005, with the findings and ranking of the twenty-six suppliers’ technologies that had met the criteria. A Request for Qualifications (RFQ) was prepared and provided to the suppliers that met the screening criteria. A detailed technical and economic evaluation of the suppliers that responded to the RFQ was completed. This resulted in the development of a short list of alternative treatment technology suppliers. In 2006, several suppliers were added to the short list, based on additional screening and a supplemental RFQ process. As part of the process, the City collected information on capital cost from the suppliers. Based on 18 responses, the capital cost per installed ton for anaerobic digestion ranged from $99,000 to $201,000; for gasification, the range was $50,000 to $266,000; for pyrolysis, the range was $60,000 to $221,000; one mixed waste composting proposer gave a capital cost of $114,000. These figures were for plants of widely varying sizes and were not standardized. Phase II22 On February 7, 2007, the City of Los Angeles released a Request for Proposals (RFP) soliciting competitive proposals for a development partner(s) for processing MSW utilizing alternative technologies premised on resource recovery. The development partner’s(s’) responsibilities were to finance, design, build, own, and operate (with the option to transfer to the City after 20 years) the resource recovery facility, at a throughput rate of 200-1,000 TPD. The facility was expected to provide diversion from landfill of no less than 80 percent of the Black Bin material delivered to the facility. In addition, the City considered proposals from emerging/experimental technologies that could process less than 200 tons/day as a potential second facility for testing emerging technologies. The emerging/experimental technology suppliers were to meet requirements outlined by the City in the RFP in order to be considered
22 Request for Proposals for a Development Partner(s) for Processing Municipal Solid Waste Utilizing Alternative Technologies premised on Resource Recovery for the City of Los Angeles, February 5, 2007.

White Paper: Meeting the Future: Evaluating the Potential of Waste Processing Technologies to Contribute to Rhode Island’s Solid Waste Management System
GBB/C09032-01 25 September 30, 2009
for the potential testing facility. Proposers of emerging/experimental technologies that did not meet those requirements were not evaluated further. A total of 12 technology suppliers submitted applications in August 2007. The City of Los Angeles' Bureau of Sanitation is currently reviewing the submissions. The City has completed the technical analysis of the technologies, produced a short list, completed the internal review and presented a report of recommendations to the Public Works Board. The report will then go to the Clerk’s Office of the Mayor and then to three committees for feedback and recommendations. By August 2009 it should be ready for full Council consideration.
5.1.3 Los Angeles County, CA
Phase I – Initial Technology Evaluation23 Beginning in 2004, Los Angeles County conducted a preliminary evaluation of a range of conversion technologies and technology suppliers, and initiated efforts to identify material recovery facilities (MRFs) and transfer stations (TSs) in Southern California that could potentially host a conversion technology facility. A scope of investigation beyond Los Angeles County itself was considered important, as stakeholders in the evaluation extended beyond the County, and the implications of this effort would be regional. In August 2005, the evaluation report was adopted. Phase I resulted in identification of a preliminary short list of technology suppliers and MRF/TS sites, along with development of a long-term strategy for implementation of a conversion technology demonstration facility at one of these sites. The County intentionally pursued integrating a conversion technology facility at a MRF/TS site in order to further divert post-recycling residual waste from landfilling and take advantage of a number of beneficial synergies from co-locating a conversion facility at a MRF. Phase II – Facilitation Efforts for Demonstration Facility24 In July 2006, the County further advanced its efforts to facilitate development of a conversion technology demonstration facility. The approach was multi-disciplined, including environmental analysis and constructability. Key Phase II study areas included:
• an independent evaluation and verification of the qualifications of selected technology suppliers and the capabilities of their conversion technologies;
• an independent evaluation of candidate MRF/TS sites, to determine suitability
for installation, integration and operation of one of the technologies;
• a review of the required permits to facilitate the project;
• identification of funding opportunities and financing means;
23 Los Angeles County Conversion Technology Evaluation Report ~ Phase I, October 2007. 24 Los Angeles County Conversion Technology Evaluation Report ~ Phase II – Assessment, October 2007.

White Paper: Meeting the Future: Evaluating the Potential of Waste Processing Technologies to Contribute to Rhode Island’s Solid Waste Management System
GBB/C09032-01 26 September 30, 2009
• identification of potential County incentives (i.e., supporting benefits) to encourage facility development amongst potential project sponsors; and
• negotiation activities to assist parties in developing project teams and a
demonstration project. The report described progress to date on Phase II, and represented a culmination of approximately one year of work conducted by the County. As of November 30, 2007, five companies have been selected to be issued a Request for Offers (RFO) early in 2008 for a demonstration to be constructed at any one of four sites by the selected vendor. The County has received site-specific offers from four conversion technology development teams: Arrow Ecology, International Environmental Solutions, Interstate Waste Technologies, and Entech Environmental. These offers have passed the review process and negotiations are taking place. It is the County’s intent to submit a recommendation to the Board of Supervisors for one or more demonstration projects in the summer of 2009. In parallel, the County has also received environmental consultant proposals for Phase III/IV (Phase III – the Completion of 1 or more demonstration facilities and Phase IV - the development of a commercial scale facility in the County) and is evaluating them. A recommendation will be made to the Board at the same time as the demonstration project(s).
5.1.4 King County, WA
A proviso to the 2007 King County Solid Waste Division budget required that the Division prepare a comparative evaluation of waste conversion technologies (i.e. WTE incineration) and waste export. After review and comment on the draft report by the Metropolitan Solid Waste Management Advisory Committee (“MSWMAC”) and others, the final report was submitted to the King County Council on August 6, 2007. Based on the report, MSWMAC made the following recommendations to the Council:
1. That the King County Council continue its current policy course toward waste export by implementing the recommendations in the Solid Waste Transfer and Waste Export System Plan.
2. That every avenue to extend the life of the Cedar Hills Landfill be explored,
including increased recycling and partial early waste export, to keep solid waste rates as low as possible for as long as possible and to provide maximum flexibility for long-term planning.
3. That no further resources be expended on the study of incineration
technologies at this time. They believed that there was sufficient information in the report to analyze waste export and incineration technologies at a programmatic level in the Comprehensive Solid Waste Management Plan update and its EIS.
There were concerns about the practicality of waste conversion technologies in the King County region, and there was a need recognized to continue planning for the existing transfer system and the potential of extending the life of the Cedar Hills Landfill.

White Paper: Meeting the Future: Evaluating the Potential of Waste Processing Technologies to Contribute to Rhode Island’s Solid Waste Management System
GBB/C09032-01 27 September 30, 2009
5.2 Procurements
5.2.1 Frederick and Carroll Counties County, MD
In May 2006, the Northeast Maryland Waste Disposal Authority (“the Authority) began a search for firms with Qualified Technologies to provide waste-to-energy facilities for Frederick and Carroll Counties. The Authority was seeking technologies that demonstrated success in the efficient and feasible conversion of MSW into marketable steam, thermal energy, fuel and electricity. Technologies that produced a fuel were to be considered if the fuel had been demonstrated to reliably and efficiently produce energy (“Qualified Technologies”). The Authority conducted a two-step procurement. The first step was the Request for Qualifications (RFQ) to identify firms with Qualified Technologies. Qualified Technologies were to be eligible for consideration in the second step, the Basis of Negotiation (BON). In order to be deemed a Qualified Technology, operating statistics from a reference facility had to be provided, with a minimum of three consecutive years of operating data, including waste processed, energy produced, air emissions and residue generation. The size of each unit could be as small as 100 TPD and as large as 750 TPD. The selection of unit size for each project was to be determined during the BON phase. The Authority understood that there were many new and emerging technologies which convert MSW into various fuels or energy. However, the Authority is dependent on bond financing for its projects, and the lending community insisted on proven technology as a minimum requirement for making capital available to the Authority. In October 2006, the Authority solicited Proposals from qualified, experienced firms in the refuse management and power facility construction and operation fields to provide for the construction, testing, operation and maintenance of a new refuse power plant (“RPP”) capacity for the counties. The Authority had pre-qualified eight technologies for this solicitation. The facilities would be owned by the Authority and leased to the successful Proposer (the “Company”) on a long-term basis (at least 20 years from the commercial operations date). The site would be provided by the Authority. The Authority would provide most of the refuse (fuel) under a put-or-pay contract, and would apply residues for beneficial use as daily cover at the counties’ landfills. The Company would have the rights to all or a portion of the energy revenues (as specified by it in its proposal) and all of the excess waste disposal capacity that could be used to dispose of non-residential waste from any other Authority jurisdiction. Proposals were requested for the following three facility options:
• A 900 TPD resource recovery facility to be located in Frederick County to process residential and commercial waste generated in Frederick County; and
• A 600 TPD resource recovery facility to be located in Carroll County to process
residential and commercial waste generated in Carroll County; or • A 1,500 TPD resource recovery facility to be located in Carroll County to
process residential and commercial waste generated in both Frederick and Carroll Counties.

White Paper: Meeting the Future: Evaluating the Potential of Waste Processing Technologies to Contribute to Rhode Island’s Solid Waste Management System
GBB/C09032-01 28 September 30, 2009
After receipt of proposals from three vendors, the Authority, in conjunction with the participating jurisdictions, completed an initial review of the proposals and short-listed Covanta Energy and Wheelabrator Technologies. As part of the initial review, the Authority met with Covanta and Wheelabrator to clarify their proposals and to ensure that the initial financial modeling results correctly represented their proposals and met the needs of the local jurisdictions. The Authority is currently seeking approvals from the jurisdictions to begin formal negotiations with the vendors to arrive at a final contract to be voted on by the jurisdictions’ Commissioners. If approved by the jurisdictions, the permitting and construction of the facilities could take up to five years. In July 2009, the Frederick County Council voted to award the project to Wheelabrator. The project is being reviewed by the Public Service Commission.
5.2.2 Harford County, MD
In May 2006, the Northeast Maryland Waste Disposal Authority (“the Authority) began a search for firms with Qualified Technologies to provide an expansion of the waste-to-energy facility for Harford County, similar to the process conducted for Frederick and Carroll counties (see 5.2.1 above). In December 2006, The Authority issued a Request for Proposals (“RFP”) for a Resource Recovery Facility (“RRF”) located in Harford County, Maryland. This was the second step in the two-step competitive procurement being conducted by the Authority. While the RFP was open to all interested and qualified vendors, only those technologies deemed qualified by the Authority were eligible for consideration. The Authority was directed to obtain proposals for expanding the current waste-to-energy capacity in two ways: (1) additional capacity at the current facility to meet Harford County’s needs, but not provide significant additional energy to the Aberdeen Proving Ground (APG), and (2) build a new RRF to accommodate the waste disposal needs of Harford County, including capacity for some of the waste disposal needs of adjacent “Base Realignment and Closure Act” (BRAC) affected counties (Baltimore and Cecil Counties), and provide a greater amount of the energy needs of APG. APG agreed to new lease for 34 acres of land including the existing RRF for the larger regional facility. The Environmental Assessment was completed in February 2009. The Authority has short-listed both Covanta Energy and Wheelabrator Technologies proposals as responsive and will continue the procurement process with those firms for the 1500 TPD replacement facility. The Authority is currently seeking approval from Harford County to begin formal negotiations with the vendors to arrive at a final contract to be voted on by the Harford County Council.
5.2.3 City of Sacramento, CA
In August 2007, the City of Sacramento, CA issued an RFQ soliciting an experienced and qualified firm to partner with it to process MSW utilizing alternative technologies premised on resource recovery and/or energy production. To qualify, firms must have had demonstrated experience and capacity to finance, design, build, own and operate a facility that processed MSW in excess of what the City currently disposed of, approximately 2,300 TPD after diversion. Sacramento was interested in a facility that used treatment technologies including, but not limited to, pyrolysis, gasification, advanced thermal recycling (a second generation advancement of mass-burn

White Paper: Meeting the Future: Evaluating the Potential of Waste Processing Technologies to Contribute to Rhode Island’s Solid Waste Management System
GBB/C09032-01 29 September 30, 2009
technologies), biological, chemical, physical and/or a combination thereof. They wanted technologies that were well proven at commercial scale, had high landfill diversion rates, and could generate a wide range of useful by-products that could be marketed for revenue sharing by the City and its development partner. In October 2007, the City received 11 responses to the RFQ, not all of them waste processing technologies. The City reviewed and evaluated them. Through review and analysis the City requested a proposal for plasma arc technology offered by United States Science and Technology Corp. (USST). The review of the proposal by Advanced Energy Strategies questioned the economic assumption of the USST proposal. In January 2009 the City Council rejected the project because they felt the review process that finally chose plasma arc technology was not done correctly and due to insufficient detail in the proposal.
5.2.4 Broward County, FL
The Broward County Solid Waste Disposal District (District) in July 2007 was considering changes to its solid waste management infrastructure in the near term. Because its disposal contracts with two privately-owned WTE facilities will reach the end of their initial service agreement terms in 2011 and 2012. The District recognized that many options to be considered would require significant development time, and thus began the process to proactively evaluate such options. The District sought, through a Request for Expressions of Interest (RFEI), to identify firms that could meet all or a portion of the District’s future solid waste processing and disposal requirements, and that were consistent with its long-term objectives. While this was not a procurement, it was understood that information obtained during the process would be used to support future procurement(s). The expressions of interest were due in October 2007, and 25 vendors responded to the REFI. The Broward County Solid Waste Disposal District, Resource Recovery Board reviewed all the expressions of interests from the 25 respondents and received 11 presentations made to the Board by some of the respondents. The District and the jurisdictions are advancing a Memorandum of Understanding with Wheelabrator Technologies for the two existing WTE facilities. No further disposal infrastructure is being pursued.
5.2.5 St. Lucie County, FL
On April 30, 2006, the Board of County Commissioners, St. Lucie County, Florida (the "Board") solicited offers for the purpose of obtaining services to permit, finance, construct, operate, and own a Plasma Arc Gasification Facility to process MSW for St. Lucie County. The due date for the qualifications was May 2006. There was only one respondent to the RFQ issued by the County: Jacoby/Geoplasma. In November 2007, the development contract was signed, and the County was moving forward with the project. The developer planned to process 3,000 TPD, generating 120 megawatts of electricity, one-third of which would be consumed internally. According to the developers, the plant was to cost over $425 million and take two years to construct. The development agreement has been signed, and the County is currently waiting for Geoplasma to secure energy agreements and obtain air permits. The County is also waiting for Geoplasma to execute the ground lease and finalize the processing fee number. The size of the facility has been reduced to 200 TPD.
White Paper: Meeting the Future: Evaluating the Potential of Waste Processing Technologies to Contribute to Rhode Island’s Solid Waste Management System
GBB/C09032-01 30 September 30, 2009
5.2.6 Hawaii County, HI
In 1995, the County started searching for a landfill replacement and after searching for more than a decade and spending about $1 million, it selected Wheelabrator Technologies Inc., a wholly-owned subsidiary of Houston-based Waste Management Inc. Wheelabrator emerged from a field of three finalists, including Covanta, which runs HPower on Oahu, and L-Con Contractors, a partnership with Barlow Projects, Inc. In January 2008, the County expected to receive a best-and-final offer from Wheelabrator to design, build and operate the $125 million TPD, single-line, mass-burn-to-electricity plant. This did not happen because Wheelabrator hadn't yet made its final offer because the firm had not reached an agreement with Hawaii Electric Light Co. on a price the electric company would pay for electricity generated by the plant. In 2008, the County Council decided not to award a contract to Wheelabrator Technologies, Inc.
5.2.7 Pinellas County, FL
Pinellas County had three companies bid on the contract to operate the existing WTE plant. The process began with an RFQ to pre-qualify firms. The three firms that were pre-qualified all submitted bids. Those respondents were Wheelabrator, Covanta and Veolia. The IFB or RFP went out in September 2006 for an operator replacement for an existing 3,000-ton-per-day plant and was awarded to Veolia in January 2007. Veolia actually began operating the facility effective May 7, 2007.
5.2.8 Hillsborough and Lee Counties, FL (adding lines to existing WTE plants)
Two operating mass-burn waterwall facilities in Florida began expansions in 2006 and 2007. In 2007, Hillsborough County sole-sourced to Covanta for a new 600-TPD line to add to the existing 1200 TPD facility which consists of three operating 400-TPD lines. The cost to Hillsborough County for the new line will be $123 million or $205,000 per installed ton of capacity. There was no RFP issued for this expansion, and at this point, they are 95 percent complete. The expansion is scheduled for commercial operation in 2009. In 2006, Lee County contracted with Covanta to add a third line with a 636-TPD capacity to the existing 1200 TPD facility. This will use the same Martin technology as the two operating lines, at a cost of $123.2 million or $194,000 per ton of installed capacity. The Lee County Solid Waste Division finished its expansion project in the late summer of 2007.
5.3 Comparison of Technologies Chosen in Recent Reports/Procurements
In the foregoing studies, reports and procurements, a total of 78 technology vendors were represented, evaluated, screened or selected in some way for consideration as waste processing solutions for the local entities. These 78 vendors offered 14 different technologies. The listing of the 78 vendors is presented in Table A-1 in the Appendix of the paper. Several of those technologies/vendors were mentioned more than once. Table 5-1 lists the 14 that were cited three or more times in the various documents.

White Paper: Meeting the Future: Evaluating the Potential of Waste Processing Technologies to Contribute to Rhode Island’s Solid Waste Management System
GBB/C09032-01 31 September 30, 2009
The most often-cited technology was mass burn, represented by Covanta and Wheelabrator, who have the most commercial experience of any of the vendors listed as discussed in Section 3.1. Second on the list is gasification firm IWT, which employs the Thermoselect technology in use in Europe and Japan, which was discussed in Section 4.2. Other gasification technology providers are also mentioned, along with four anaerobic digestion vendors, one plasma arc firm two pyrolysis providers and a thermal depolymerization firm. While this review is not systematic, it does provide a good summary of the firms and technologies that are most active in the field, and those that localities across the U.S have been most interested in using as they contemplate alternatives to landfilling MSW.
Table 5-1. Technologies/Vendors Mentioned in Recent Procurements
Vendor-designated
Technology Vendor Total Times
Cited
Mass-burn Covanta Energy Corporation 9 Mass-burn Wheelabrator Technologies Inc. 8 Gasification Interstate Waste Technologies/Thermoselect (IWT) 6 Anaerobic Digestion Valorga S.A.S. (Valorga)/Waste Recovery Systems 5 Anaerobic Digestion Canada Composting Inc. 4 Anaerobic Digestion Organic Waste Systems N.V. 4 Gasification Ebara 4 Anaerobic Digestion Arrow Ecology Ltd. 3 Anaerobic Digestion Urbaser 3 Anaerobic Digestion Waste Recovery Seattle, Inc. (WRSI) 3 Gasification BRI Energy, LLC 3 Gasification Primenergy 3 Gasification Taylor Recycling Facility 3 Gasification Whitten Group /Entech Renewable Energy System 3 Plasma Gasification Global Energy Solutions 3
Pyrolysis International Environmental Solutions 3
Pyrolysis Pan American Resources 3
Thermal Depolymerization Changing World Technologies 3
6.0 Economic Feasibility of Waste Processing Technologies
6.1 Economic Characteristics of Waste Processing Technologies
The economic characteristics of a WTE facility include capital and operating costs and revenues. Table A-2 in the Appendix provides an estimate of expected cost figures for several of the proven technologies. Generally, capital cost for the proven technologies are in the range of $200,000 to $300,000 per ton of installed capacity, depending on size and plant configuration. Operating costs are in the range of $40 to $65 per ton processed, not including residue disposal, again dependent on size, equipment and operating profile, and assuming a private operator. These figures are

White Paper: Meeting the Future: Evaluating the Potential of Waste Processing Technologies to Contribute to Rhode Island’s Solid Waste Management System
GBB/C09032-01 32 September 30, 2009
based on industry rules-of-thumb, recent operating results from selected facilities, surveys of industry professionals and related references.
A significant factor in the net operating costs for these facilities is revenue from the sale of recovered energy and recyclables. The energy revenue is a function of negotiations between the facility operator and the energy markets, typically a utility, and may include, besides a power rate, revenue for capacity and a requirement for standby power. Capital equipment necessary for utility connections can also be part of the negotiations, and the actual figures have to be developed and refined for specific sites and requirements during a procurement/development and negotiation process.
6.2 Typical Project Economic Estimates
To provide the State with an idea of the project economics that it could expect from adopting a waste-to-energy strategy for the future management of its MSW (Residential Solid Waste and Commercial Solid Waste) that is not reduced/reused/recycled, a representative preliminary project pro forma operating statement was prepared. By deriving an order-of-magnitude cost per ton for the processing and disposal of MSW using a waste processing technology, the State can compare the cost of developing new landfill capacity or other means of disposal after the existing Central Landfill is filled to capacity.
The technology chosen for modeling was mass-burn/waterwall incineration, the technology with the most extensive track record at the size and scale needed to serve the State. As noted in Section 2.0, the waste projected to be landfilled in 2015 if the State continues its present recycling rate is approximately 692,000 TPY. If the recycling goals of the Corporation are met this projected quantity drops to 470,500 tons. Taking into account the growth projections for waste generation and the ramp up of recycling programs, a WTE facility with a nominal 1500 TPD rated capacity was selected for the economic estimates. This size facility would be one of the larger WTE plants in the United States (there are 22 WTE facilities of that size or greater out of the 87 U.S. facilities.
The procurement method assumed for the analysis was a design-build-operate public-private partnership, with public ownership and financing through 100 percent tax-exempt revenue bonds. This structure is the one recommended by numerous solid waste financing professionals and experienced facility owners throughout the U.S. This method gives the State the benefit of single-source private involvement in the construction and long-term operation of the facility, while retaining the advantages of public ownership. Such advantages include:
1. Lower overall financing costs. Tax-exempt debt is generally less costly than private debt-equity structures, even if the private debt portion of the financing is through tax-exempt private activity bonds.
2. More waste flow control. Public owners have a greater ability to control waste flow to their facilities based on the recent Oneida-Herkimer Supreme Court decision (see reference in Section 5.0).
3. Post-financing control. After the expiration of the initial financing, usually 20-30 years, the State would still be the owner of the plant, reaping the benefit of lower disposal costs without debt service payments, and not subject to market pricing by a private owner-operator, Several existing plants, especially in New England, are now reaching the end of their initial service agreements and financings, and the communities they are serving that still

White Paper: Meeting the Future: Evaluating the Potential of Waste Processing Technologies to Contribute to Rhode Island’s Solid Waste Management System
GBB/C09032-01 33 September 30, 2009
need disposal services are facing uncertainty of higher tipping fees or loss of guaranteed available capacity.
Of course, the actual procurement method should be the result of an open procurement process with several alternatives open to proposers to suggest as they deem them advantageous to the State.
6.2.1 Assumptions
The following are the assumptions used for the pro forma operating statement:
1. Implementation Timeline. The implementation of a WTE facility is a complicated and time consuming process. Typically implementation takes between five and seven years. For this example, operation in 2015 is assumed.
2. Size/Throughput. As stated above, the representative plant is 1,500 TPD receiving 547,000 TPY and processing a total of approximately 500,000 tons per year, which equals an availability of about 91 percent. The remainder of the annual waste generated, 47,500 tons per year of bypass waste would need to be landfilled; the current commercial contract rate of $46.00 per ton has been assumed for bypass.
3. Ash Generation/Disposal. Using a rule of thumb, 25 percent of the annually processed waste would remain as ash after the thermal recovery process. About 90 percent of that ash, 95,000 tons, would be bottom ash remaining before ferrous metal recovery and 10 percent, 12,500 tons would be fly ash recovered from the air pollution control system. The bottom ash can be disposed at the Central Landfill at $46.00 per ton but may have to be disposed separately from the bypassed waste in a newly-created ash monofill, adding to the initial capital cost. If found to be hazardous, the fly ash would need to be separately disposed of as a hazardous waste (see Section 7.4). The cost of such fly ash management would be in the range of $150 to $250 per ton, including transportation and disposal at a specially designed and operated landfill, and the Rhode Island hazardous waste generation fee of $46.00 per ton25. For this analysis, a cost of $235 per ton has been assumed, based on a brief survey of available regional hazardous waste landfills.
4. Capital Cost/Financing. The capital cost of the facility should be at the mid range for mass-burn/waterwall incinerators because the size of the plant would lead to some economies of scale in design and construction. The capital cost per ton is set at $250,000 per ton of installed capacity or a total of $375 million. The effective net amount to be financed was estimated at 125 percent of the cost of the installed capacity, taking into account development and permitting costs, financing costs, reserve funds, etc. That brings the total financed to $468.8 million. The all-in cost of financing using revenue bonds was estimated at 5 percent for 30 years, bringing net annual debt service to $30.5 million.
5. Electricity Revenues. The net amount of electricity generated from the system, excluding in-plant use was set at 650 kilowatt-hours per ton processed. The assumed price of the electricity sold was $0.06 per kilowatt-hour. It was also assumed that the plant operator would receive 10 percent
25 Rhode Island Department of Environmental Management, Rules and Regulations for Hazardous Waste Management, Rule 5.12, as amended through February 7, 2007.

White Paper: Meeting the Future: Evaluating the Potential of Waste Processing Technologies to Contribute to Rhode Island’s Solid Waste Management System
GBB/C09032-01 34 September 30, 2009
of the electricity sales as an incentive payment, with 90 percent going to the State.
6. Materials Revenues. Ferrous metals can be recovered from the bottom ash and sold as scrap on the open market. It was assumed that 3.4 percent of the incoming waste or 17,000 tons per year would be recovered and sold at a current price of $76.00 per ton. It was assumed that the plant operator would receive 50 percent of the sales as an incentive payment, a standard industry practice.
7. Operating Costs. Like with the capital costs, the operating and maintenance cost per ton would be at the low end of the range for mass-burn facilities because of economies of scale. A cost of $45.00 per ton processed was assumed for the analysis.
6.2.2 Pro Forma Operating Statement
Based on the assumptions above, the annual operating statement of the system would be as presented in Table 6-1.
Table 6-1. Pro Forma Annual Operating Statement
Revenues Electricity $17,550,000 Ferrous Recovery $646,000 Total Revenues $18,196,000 Costs Operating & Maintenance $22,500,000, Bottom Ash Disposal $4,393 Fly Ash Disposal $2,937,500 Bypass Disposal $2,185,000 Annual Debt Service $30,492,860 Total Costs $62,508,360 Net Cost $44,312,360 Net Cost/Ton $81
If fly ash could be disposed of with the bottom ash as is done in most other states with WTE facilities, Rhode Island could save approximately $2.4 million annually, reducing the net cost/ton to approximately $76 per ton. The net cost of waste disposal per ton of $81 can be compared with the cost ranging from $60 to $90 per ton for shipping the waste out of the state to a remote landfill. This cost per ton can also be compared to the current (2009) contract commercial fee for disposal at the Central Landfill of $46 per ton. The implementation of the WTE facility would increase the cost of disposal for the municipalities to the $81 per ton in 2015. Assuming a four percent (4%) growth rate for the Municipal Tip Fee, the 2009 fee of $32 per ton would increase to $40.50 in 2015 for landfilling. If the WTE facility were implemented, this fee would be doubled to $81 as noted above.

White Paper: Meeting the Future: Evaluating the Potential of Waste Processing Technologies to Contribute to Rhode Island’s Solid Waste Management System
GBB/C09032-01 35 September 30, 2009
The cost per ton is quite sensitive to the price of electricity. For example, if it could be assumed that electricity could be sold for $0.09 per kilowatt-hour instead of $0.06 per kilowatt-hour, the net disposal cost of $81 per ton would be reduced to $65 per ton, a 20 percent reduction in cost, comparable to current landfilling costs. If an alternative incorporating electricity production is pursued by the State, it should vigorously pursue all options to maximize electricity revenues.
The sale of the Renewable Energy Credits (RECs) could result in additional revenues for a Rhode Island WTE facility. This would require a redefinition of the eligible biofuel to include the biogenic portion of MSW. The U.S. Energy Information Administration estimated that the biogenic portion of the MSW was 56 percent. Using the value of the alternative compliance payment of $50 per MWh26 and assuming that 50 percent of the MSW is biogenic, the Corporation could potentially receive revenue from the sale of the RECs of $8.1 million. This would be in addition to the approximately $13 million revenue potential from the sale of CO2 credits if Waxman/Markey becomes law. This is discussed in Section 7. Therefore, if realized along with the economics of Table 6-1, net cost would be reduced to approximately $40/ton. Full implementation of the Renewable Energy Credits and the Waxman/Markey bill including the sale of CO2 credits could make WTE competitive with the Corporation’s projected cost of landfilling.
7.0 Environmental Characteristics of Waste Processing Technologies
7.1 Air Quality
7.1.1 Applicable Regulations
Solid waste incinerators, which EPA refers to as Municipal Waste Combustors, are regulated under the federal Clean Air Act, originally passed by Congress in 1963 and updated in 1967, 1970, 1977,1990 and 1995 and 1998. Numerous state and local governments have enacted similar legislation, either implementing federal programs or filling in locally important gaps in federal programs.
Section 111 of the federal Clean Air Act directs EPA to establish pollution control requirements for certain industrial activities which emit significant "criteria air pollutants." These requirements are known as new source performance standards (NSPS) and regulate pollutants. For thermal destruction of solid waste, the NSPS control particulate matter (PM), sulfur dioxide(SO2), carbon monoxide (CO), nitrogen oxides (NOx), hydrogen chloride (HCl), dioxins/furans, cadmium, lead, mercury, fugitive ash and opacity. NSPS are detailed in Chapter 40 of the Code of Federal Regulations, Part 60 (40 CFR Part 60), and are intended primarily to establish minimum nationwide requirements for new facilities.
Section 112 of the pre-1990 federal Clean Air Act directed EPA to establish standards to reduce emissions of hazardous air pollutants (HAPs). These pollutants include asbestos, benzene, beryllium, inorganic arsenic, mercury, radionuclides, and vinyl chloride. National emission standards for hazardous air pollutants (NESHAPs) are 26 Database of State Incentives for Renewables and Efficiency, Rhode Island State Incentives: Renewable Energy Standard, accessed July 22, 2009.

White Paper: Meeting the Future: Evaluating the Potential of Waste Processing Technologies to Contribute to Rhode Island’s Solid Waste Management System
GBB/C09032-01 36 September 30, 2009
detailed in 40 CFR Part 61 and establish minimum nationwide requirements for existing and new facilities.
The post-1990 NESHAPs require the maximum achievable control technology (MACT) for a particular industrial source category, and are often referred to as "MACT standards." The pre-1990 Clean Air Act prescribed a risk-based chemical-by-chemical approach. The 1990 Clean Air Act Amendments outlined a new approach with two main components. The first component involves establishing technology-based source category standards, and the second component involves addressing any significant remaining risk after the national standards are in place. The NESHAPs promulgated under the 1990 Clean Air Act Amendments can be found in 40 CFR Part 63 and establish nationwide requirements for existing and new facilities.
EPA may implement and enforce the requirements or EPA may delegate such authority to state or local regulatory agencies. Clean Air Act sections 111 and 112 allow EPA to transfer primary implementation and enforcement authority for most of the federal standards to state, local, or tribal regulatory agencies. In general, EPA does not delegate to state or local agencies the authority to make decisions that are likely to be nationally significant, or alter the stringency of the underlying standard.
The Section 111 and 112 emissions limits applicable to new Municipal Waste Combustors are:
Dioxin/furan (CDD/CDF) 13 nanograms per dry standard cubic meter Cadmium (Cd) 10 micrograms per dry standard cubic meter Lead (Pb) 140 micrograms per dry standard cubic meter Mercury (Hg) 50 micrograms per dry standard cubic meter Particulate Matter (PM) 20 milligrams per dry standard cubic meter Hydrogen chloride (HCl) 25 PPM or 95 percent reduction Sulfur dioxide (SO2) 30 ppm or 80 percent reduction Nitrogen Oxides (NOx) 180 ppm dry volume, and 150 ppm dry volume after
first year of operation
A new source review (NSR) permit is required for a new municipal waste combustor and, in addition, depending on its size and emission quantities, it must meet the prevention of significant deterioration (PSD) permit requirements. The PSD review and permitting process will require the following:
• Existing ambient air quality analysis – a detailed analysis of the air quality around the facility site, which may require installing air monitoring equipment to collect data for as long as a year;
• Best Available Control Technology (BACT) analysis – an analysis of all available control technologies for air emissions in a “top down” review. Analyses include economic, environmental and energy costs for each alternative. The criterion for selection is: best control at acceptable cost.
• Emission dispersion modeling – a detailed analysis, using USEPA approved models, of the projected impact of the facility emissions on the ambient air quality.
Rhode Island is a non-attainment area for ozone, which imposes additional permitting requirements on the facility. Because of this condition, any new facility (new source) will be required to adhere to the lowest achievable emissions rate

White Paper: Meeting the Future: Evaluating the Potential of Waste Processing Technologies to Contribute to Rhode Island’s Solid Waste Management System
GBB/C09032-01 37 September 30, 2009
(LAER). This will be the lowest emissions rate achieved by a similar source or the lowest rate for a similar source in a state implementation plan (SIP) anywhere in the country. The two pollutants impacted by this are oxides of nitrogen (NOx) and volatile organic compounds (VOC). These analyses will certainly raise the development cost and increase the time required to go through the permit process for a waste conversion facility. Current technology of NOx “Selective Non Catalytic Reduction (SNCR)” can reduce emissions to 100 ppm, below required limits. Other technologies, “Selective Catalytic Reduction (SCR)” can reduce NOx emissions to as low as 15 ppm27.
7.1.2 Air Quality Impacts
In the early 1980s, dioxins were discovered in the exhaust of a WTE facility on Long Island, NY. This chemical, toxic to animals in even very small quantities, was considered a major pollutant. Other WTE plants were tested, as well as other industries, and were found to be a major dioxin source. In 1995, amendments to the Clean Air Act (CAA) were enacted to control the emissions of dioxins, as well as other toxins, such as mercury, hydrogen chloride and particulate matter.
With the implementation of the CAA requirements in the following years, dioxin emissions from WTE decreased significantly, as shown in Figure 7-1.28
Figure 7-1. Dioxin Emissions from WTE Facilities, 1990 – 2005
While WTE plants had been a major source of dioxins in 1987, as shown in Figure 7-229, they have not been considered significant dioxin sources since 2002. EPA has stated that “Waste-to-Energy is no longer a major contributor of dioxin emissions”30.
27 Waste to Energy Research and Technology Council (WTERT). 2008. Earth Engineering Center, Columbia University. 29 Dioxins from WTE in the USA, J. O’Brien, Comparison of Air Emissions from Waste-to-Energy Facilities to Fossil Fuel Power Plant, SWANA 2005.
D io x in E m is s io n s , T E Q B a s is
3 ,9 9 8
4 0 .6 1 2 .0
4 ,1 7 3
5 7 73 6 6
0
5 0 0
1 ,0 0 0
1 ,5 0 0
2 ,0 0 0
2 ,5 0 0
3 ,0 0 0
3 ,5 0 0
4 ,0 0 0
4 ,5 0 0
1 9 9 0 1 9 9 3 1 9 9 6 1 9 9 9 2 0 0 0 2 0 0 5
Y e a r

White Paper: Meeting the Future: Evaluating the Potential of Waste Processing Technologies to Contribute to Rhode Island’s Solid Waste Management System
GBB/C09032-01 38 September 30, 2009
Figure 7-2. Sources of Dioxin Emissions, 1987 – 2002-04
Mercury is another toxin that was found in WTE exhaust, and that was addressed in the CAA amendments. By modifications in the burning process, and the use of activated carbon injection in the air pollution control system, dioxins and mercury, as well as hydrocarbons and other constituents, have effectively been removed from the
gas stream. The activated carbon removes the contaminants from the emissions by adsorption and other mechanisms. The activated carbon is captured by the APC equipment and would make up part of the fly ash that is captured. Mercury emissions from WTE have been reduced from 1990 levels, as shown in Figure 7-3.31
Overall emissions of mercury in the United States from both WTE and fossil fuel-fired electric power plants are shown in Figure 7-4.32
30 Emissions from Large MWC Units at MACT Compliance, USEPA Docket A-9045, VIII.B.11, Office of Air Quality and Standards, 2002. 31 Ibid 32 Mercury Emissions from High Temperature Sources, N. Themelis, A. Gregory, ASME Solid Wastes Processing Division Proceedings, May 2002, and the Environmental Working Group, 2006, http://www.ewg.org.

White Paper: Meeting the Future: Evaluating the Potential of Waste Processing Technologies to Contribute to Rhode Island’s Solid Waste Management System
GBB/C09032-01 39 September 30, 2009
Figure 7-3. Mercury Emission from WTE Facilities, 1990 – 2005
Figure 7-4. Mercury Emission from WTE Facilities and Fossil-Fuel Power Plants
Whether reviewing dioxin data or mercury emissions, it is clear that WTE facilities have made a concerted effort to reduce these emissions to insignificance. These two pollutants have been identified by the public as the surrogate for all WTE emissions, but other emissions have decreased correspondingly as well, such as carbon monoxide, hydrogen chloride, nitrogen oxides and particulate matter (soot).
Mercury Emissions
51.2
30.5
23.7
6.06
16.9
4.05
0.0
10.0
20.0
30.0
40.0
50.0
60.0
1990 1993 1996 1999 2000 2005
Year

White Paper: Meeting the Future: Evaluating the Potential of Waste Processing Technologies to Contribute to Rhode Island’s Solid Waste Management System
GBB/C09032-01 40 September 30, 2009
Table 7-1 has the average emissions from 95 WTE plants and compares them to US EPA standards. Dioxins and mercury are lower than 20 percent of the limit. Other pollutants, except NOx, range between 5 and 33 percent of the limits.
Table 7-1. Average Emissions of 95 WTE Plants Compared to EPA Standards33
7.2 Greenhouse Gases
The “greenhouse” effect results from sunlight striking the Earth’s surface and, when it gets reflected back towards space as infrared radiation (heat), it gets absorbed by gases trapping the heat in the atmosphere. Many chemicals that are present in the Earth’s atmosphere act as “greenhouse gases (GHG).” These gases allow sunlight to enter the atmosphere freely, but prevent transmission of the reflected sunlight back to space. Many gases exhibit these “greenhouse” properties. Some of them occur in nature (water vapor, carbon dioxide, methane, and nitrous oxide), while others are exclusively human-made, such as chlorofluorocarbon compounds. Prior to large scale industrialization the level of greenhouse gases in the atmosphere had remained reasonably constant for a long period. Since industrialization, however, the levels of several important greenhouse gases have increased by 25 percent. Carbon dioxide (CO2) is a key green house gas. During the past 20 years, about three-quarters of human-made carbon dioxide emissions were from burning fossil fuels. The greenhouse gases that are generated in solid waste processing and disposal that are of concern are: carbon dioxide (CO2), methane (CH4), and oxides of nitrogen (NOx). Each of these gases can be divided into two categories, based on the source of the materials in the waste: (1) biogenic sources and (2) fossil sources. Methane, the principal greenhouse gas emitted from landfills is over 20 times more potent than carbon dioxide, the greenhouse gas resulting from waste combustion/energy generation. CO2 gas that is emitted from biomass sources can be classified as carbon neutral because biomass growth captures atmospheric CO2. This establishes
33 Meg Morris and Jack Lauber. Making a Case: The Benefits of Waste to Energy. May 7, 2007.

White Paper: Meeting the Future: Evaluating the Potential of Waste Processing Technologies to Contribute to Rhode Island’s Solid Waste Management System
GBB/C09032-01 41 September 30, 2009
a balanced cycle of CO2 removal due to biomass growth and release through combustion.34 Solid waste fuels are comprised of a biogenic portion and a petroleum-based portion. The biogenic fraction of the waste can be measured in the gaseous emissions from the stack and be used to determine the percent of emissions that could potentially be counted towards renewable energy credits in a WTE facility, as these are not generated from fossil fuel derived materials. A protocol developed by ASTM is now available, method ASTM D6866.35 This protocol uses radiocarbon dating techniques to measure the C14 portion of the carbon present in the emissions and compares it to the fossil carbon portion. A King County, Washington study36 compares the GHG for five technology options:
1. Mass-burn, waterwall facilities; 2. RDF with dedicated boiler; 3. Advanced thermal recycling (gasification/pyrolysis); 4. Landfilling with landfill gas capture and flaring; and 5. Landfilling with landfill gas combustion, using internal combustion engine.
The study examined the direct emissions from each process and fugitive emissions,37 but did not include the emissions associated with transportation of waste to the disposal facility.38 The emission values in the King County report also include those that are avoided by replacing existing electricity generation emissions. The conclusion of the King County study is that the GHG emissions from any of the conversion approaches are double that of landfilling with landfill gas utilization (Option 5), including landfilling without gas utilization (Option 4). A modeling exercise performed by Thorneloe, et al,39 showed that a WTE plant has a positive impact on the reduction of GHG when analyzed under a life-cycle assessment basis. The results are based on U.S. average waste management practices and energy mix, but show potential reduction for various scenarios comparing landfilling (with and without landfill gas recovery, flaring, and use for energy), recycling and WTE. A scenario recycling 30 percent of the waste stream and taking the remainder 70 percent to a WTE facility shows considerable reductions in GHG emissions as compared to recycling 30 percent and landfilling the rest (with no gas recovery), see Figure 7-5, The results performed for a specific location like Rhode Island would vary due to the waste management practices, waste characterization and local energy mix.
34 Intergovernmental Panel on Climate Change IPCC, http://www.ipcc-nggip.iges.or.jp/public/2006gl/pdf/5_Volume5/V5_5_Ch5_IOB.pdf 35 ASTM International, http://www.astm.org/Standards/D6866.htm 36 Comparative Evaluation of Waste Export and Conversion Technologies Disposal Options, King County, Department of Natural Resources and Parks, Solid Waste Division, R.W. Beck, June 2007 (Draft). 37 Ibid. Landfill gas capture in all landfills is never total. The report estimated an 80 percent capture and 20 percent fugitive emissions. 38 This is reasonable for Rhode Island’s situation, assuming that any facility will be constructed at the existing landfill. 39 Thorneloe SA, Weitz K, Jambeck J. Application of the U.S. Decision Support Tool for Materials and Waste Management. WM Journal, August 2006.

White Paper: Meeting the Future: Evaluating the Potential of Waste Processing Technologies to Contribute to Rhode Island’s Solid Waste Management System
GBB/C09032-01 42 September 30, 2009
Figure 7-5. Potential GHG Emissions Reductions40
The conclusion about net GHG emissions for a similar project in Rhode Island could be different because of the nature of the credits taken for the electricity-generation emissions displaced by a WTE system. In the case of King County, the electricity replaced is generated by hydro and natural gas. Further, the State of Washington does not recognize either all or part of refuse as a renewable fuel. Rhode Island allows separated wood waste as a renewable fuel, but not mixed solid waste.
According to the Energy Information Administration (EIA), the generating facilities in Rhode Island utilize a variety of fuel including coal, petroleum, natural gas and other fuels. In addition, the national grid, which serves Rhode Island, also supplies electricity that is generated from a variety of fossil fuels. This makes the displaced emission calculation complicated, but because of the inclusion of coal and petroleum, the displaced emissions for Rhode Island will be higher than those for King County, WA.
The Waste Reduction Model (WARM) was created by the U.S. EPA to help solid waste planners and organizations estimate greenhouse gas emission reductions from several different waste management practices. WARM calculates GHG emissions for baseline and alternative waste management practices, including source reduction, recycling, combustion, composting, and landfilling. The model calculates emissions in metric tons of carbon equivalent (MTCE) and metric tons of carbon dioxide equivalent (MTCO2E) across a wide range of material types commonly found in municipal solid waste (MSW). In addition, the model calculates energy use for each of the options.
The WARM model was applied to the Corporation waste quantities that are projected to be generated in 2015. These quantities are 397,792 and 294,020 tons per year for Residential Solid Waste and Commercial Solid Waste, respectively, which results in a total MSW landfilled quantity of 691,812 tons for 2015. These quantities were
40 Source: http://www.energyrecoverycouncil.org/userfiles/file/Wastepercent20Notpercent20Wantpercent20Not.pdf

White Paper: Meeting the Future: Evaluating the Potential of Waste Processing Technologies to Contribute to Rhode Island’s Solid Waste Management System
GBB/C09032-01 43 September 30, 2009
reduced from original estimates of waste generation due to recession based decreases in waste and a higher demand of waste by local Waste-to-Energy facilities that have lowered tipping fees in order to attract more waste. WARM requires composition breakdown for the waste streams, which were taken from the 2007 Comprehensive Solid Waste Management Plan. Because these categories do not correspond exactly to those in the WARM, some adjustment was made. For example, the Other Aluminum from the Plan was added to the Aluminum Containers category in WARM.
WARM was applied to four scenario-based goals expressed for the Corporation, as follows:
1. Baseline – 100 percent of MSW landfilled with landfill gas recovery for energy. 2. Current Recycling – Maintain the current 10 percent recycling with the
remaining MSW landfilled with landfill gas recovery for energy. 3. Enhanced Recycling – Meet the 38.3 percent recycling with the remaining
MSW landfilled with landfill gas recovery for energy. 4. WTE with Enhanced Recycling – Meet the 38.3 percent recycling with the
remaining MSW going to a WTE facility for energy recovery.
The results of running the parameters for the four scenarios in WARM are shown in Table 7-2. WARM indicates an emissions savings for landfilling over open dumping of 235,521 metric tons of CO2, which has been subtracted out to give Scenario 1 a baseline of zero (0). Also, Table 7-2 shows the potential barrels of oil and acres of forest saved in 2014, as well as cars taken off the road for each scenario. Note that Scenario 4 with WTE has a lower CO2 reduction due to the plant emissions. However, these are more than compensated for by the increased energy credits and the savings in oil represented.
Table 7-2. WARM Emissions Savings and Equivalents for 2014
Waste Management Scenario
Metric Tons of CO2 in Emissions
per Year
Equivalent to Barrels of Oil
Saved per Year
Equivalent to Carbon Uptake
by Acres of Forest per Year
Equivalent to Cars Taken Off the Road per
Year 1 – Baseline – 100 percent Landfilled 0 0 0 0 2 – Current Recycling – 11.9 percent -169,292 269,802 774 31,007 3 – Enhanced Recycling – 38.3 percent -679,311 1,217,585 3,492 124,420 4 – WTE & Enhanced Recycling – 38.3 percent -672,744 1,657,575 4,753 123,218
The removal of CO2 may be convertible to carbon credits that have potential to be sold for a source of additional revenue to the Corporation. As mentioned above, carbon credits are proposed in the Waxman/Markey Bill based on tax rates and will fluctuate with the market. Recent prices of offsets for the Kyoto program on the European Climate Exchange have been between 10 and 15 Euros per metric ton of CO2. Given the exchange rate, discount (the 1.25 ton reduction per ton of credit),

White Paper: Meeting the Future: Evaluating the Potential of Waste Processing Technologies to Contribute to Rhode Island’s Solid Waste Management System
GBB/C09032-01 44 September 30, 2009
and likely increase in demand, the initial price of $20 per ton appears conservative. After the first five years, this price will increase by the expected rate of inflation.
Using the price of $20.00 for one ton of CO2, the projected revenue to the Corporation based on passage of Waxman/Markey for both Scenario 3 and Scenario 4 is over $13 million per year41. The sale of renewable energy credits could provide additional revenue for Scenario 4.
7.3 Water
Mass-burn and RDF incineration technologies require a water supply and all types of projects have a wastewater discharge. Besides domestic water for workers, potable water is required for the waste heat boilers.
Non-potable water may be used as cooling water for the steam condensers, but the large cooling water supplies necessary for condenser cooling are normally not available, and cooling towers or cooling water ponds are provided as part of the facility. WTE plants also utilize their water discharges from the steam cycle and cooling system in the ash cooling process, which reduces the need for additional water and disposes of any mineral buildup.
If a steam customer is the energy market, the water requirement may be increased significantly from that needed for electricity generation, assuming that the customer generally does not return condensate. Some projects may cogenerate steam and electricity for sale, such as district heating/cooling projects or those with a significant steam user in proximity of the WTE facility site.
Technologies such as gasification and anaerobic digestion will not necessarily use a boiler. They may generate a gas stream for use off-site and not require a condenser cooling water system.
7.4 Residue Disposal
Another consideration is ash disposal. For all but the high-temperature thermal options and the anaerobic digestion system, an ash will be generated. Bottom ash will be discharged from the bottom of the furnace chamber, and fly ash will be collected by the air pollution control system. In accordance with applicable law, waste-to-energy ash must be tested to ensure it is non-hazardous. The test is called the Toxicity Characteristic Leaching Procedure (“TCLP”).
Generally, the bottom ash has not been classified as a hazardous material, subject to ash testing and analysis. Fly ash, however, will have a higher concentration of heavy metals and may also contain residual organics. As such, it would likely be classified as a hazardous material if it fails toxicity testing, unless it is combined with bottom ash, as is the current U.S. practice. Combined ash generally passes the TCLP test and is classified as non-hazardous. Rhode Island environmental regulations are ambiguous on the subject of separate ash disposal. For example, the Solid Waste Landfill Regulation42 requires that any landfill used solely for solid waste generated by an incinerator or resource recovery 41 PJM. Potential Effects of Proposed with Proposed Climate Change Policies on PJM’s Energy Market, January 23, 2009. 42 Rhode Island Department of Environmental Management, Solid Waste Regulation No. 2, Solid Waste Landfills, Rule 2.3.18, January 1997.

White Paper: Meeting the Future: Evaluating the Potential of Waste Processing Technologies to Contribute to Rhode Island’s Solid Waste Management System
GBB/C09032-01 45 September 30, 2009
facility (that is, an ash monofill) be designed, constructed and operated in compliance with all of the specifications for landfills generally, but does not require the segregation of ash from MSW in landfills. If such separate disposal were to be required, it would raise the cost of implementing and operating WTE facilities in the State and differ from the general practice in the rest of the U.S. In fact, in some cases, WTE ash has even been used as daily cover for sanitary landfills (see discussion below). The Rhode Island regulations also do not require the separate disposal of bottom ash and fly ash, but they have a detailed testing protocol and require the disposal at licensed hazardous waste disposal facilities of any ash found to be hazardous.43 These same regulations do require, however, that bottom and fly ash be handled, stored and transported separately, and that all ash storage areas on site be designed in compliance with the regulations for the storage of hazardous waste. The fly ash can be treated with a fixative to prevent the leaching of hazardous constituents, so as to be classified as a non-hazardous material. There are a number of fixatives, such as Wes-PHix marketed by the Wheelabrator Corporation. The cost of a fixative must be compared to the options for ash disposal to determine the cost-effective solution for the ash. Part of that analysis would be determining if a market exists for the bottom ash, or for ash that has been treated with a fixative.
Several states permit the “beneficial use” of ash produced at WTE plants in certain applications subject to the ash passing the TCLP and possibly subject to other restrictions, depending on the state. These applications may include daily landfill cover, landfill shaping and grading material, landfill gas venting layers and certain construction and road fill applications. Some states such as California and Maryland allow ash that is beneficially used to be included in recycling diversion formulas. A substantial number of the WTE facilities in the U.S. report the beneficial use of ash resulting from the waste combustion process. In 2004, it was reported that in a survey of U.S. waste-to-energy plants, 30 facilities responded that ash from their operation was being beneficially used in some manner. Most of this ash, over 2.5 million tons, was reported as being used as alternative daily landfill cover.44 In neighboring Massachusetts, “processed bottom ash” from certain WTE facilities is being beneficially used at certain landfills in Massachusetts as a subgrade fill, shaping and grading material and/or as an alternative daily cover subject to regular testing and the required prior approval of the Massachusetts Department of Environmental Protection (“MADEP”) for a “Beneficial Use Determination (BUD).” To receive a BUD and approval for such use, the processed bottom ash must pass the TCLP, meet conductivity parameters, and demonstrate that it meets the limits set forth in MADEP Policy No. COMM-97-01, Reuse and Disposal of Contaminated Soil at Massachusetts Landfills. It should be noted that communities with aggressive, comprehensive recycling programs and programs focused on removing toxics from the municipal solid waste stream, such as those to divert used electronics (“e-waste”), household hazardous waste (“HHW”), mercury thermometers, fluorescent light fixtures, batteries, various metals and white goods, and the like, could be expected to have a post-diversion municipal solid waste stream for combustion containing less toxic materials and thus 43 Rhode Island Department of Environmental Management, Solid Waste Regulation No. 4, Incinerators and Resource Recovery Facilities, esp. Appendices A and B, January 1997. 44 JVL Kiser, The 2004 IWSA Directory of Waste-to-Energy Plants (June, 2004).

White Paper: Meeting the Future: Evaluating the Potential of Waste Processing Technologies to Contribute to Rhode Island’s Solid Waste Management System
GBB/C09032-01 46 September 30, 2009
the ash from combustion to have a lower potential to exhibit hazardous characteristics upon TCLP testing. The solids residual from high temperature systems, such as plasma-arc or pyrolysis, may have a better opportunity for end-use applications and marketing. These glassy-type granules may be classified as non-hazardous and used in construction materials, or as a fill.
The organic substrate after the digestion process may be beneficially processed and recovered as a compost-like soil conditioner. The residue then from anaerobic digestion is nothing more than stones, glass or similar items, which is normally directed to a solid waste landfill. Otherwise, the residue quantity and characteristics is different and greater in quantity.
8.0 Waste Processing Technologies for Rhode Island
In assessing the applicability of waste processing technologies for Rhode Island, one must consider the overall track record of each, including the operational/commercial experience of the technology, the size and scale of the successful facilities, their environmental performance and impacts, their overall economics, their reliability over time, and the availability of financially strong companies to offer them under full service arrangements. Table A-2 in the Appendix is a matrix summarizing the overall performance of the technologies reviewed in this paper. The first four columns address the technology, whether it has been employed commercially at the scale required for handling Rhode Island’s MSW (Residential Solid Waste and Commercial Solid Waste) stream (at least 1,500 tons MSW per day), and its expected reliability. The next column evaluates its environmental acceptability. The fifth and sixth column address project economics and the last two columns deal with an assessment of the overall risk and liability issues inherent in selecting that technology at this time. A discussion of several of the comparative factors that have gone into the evaluation of technology applicable to Rhode Island follows.
Experience: The mass-burn/waterwall technology has been used for MSW treatment and disposal for over a hundred years. Modular systems and RDF facilities have been used for decades. Anaerobic treatment of MSW is a relatively new application, but it has a long history of application to liquid and sludge wastes. There is little, if any, operating history with MSW for the other listed processes.
Size: The only technologies that has been applied to large MSW feed rates, over 1,500 TPD, are mass-burn/waterwall and RDF/dedicated boiler. None of the other technologies have been built in these relatively large sizes. Many of these facilities are built in modules and, for larger capacities; a number of modules can be installed. For instance, Thermoselect has a 400 TPD module, so a 3,000 TPD facility would require the procurement of 7-8 modules. Likewise, International Environmental Solutions (pyrolysis) and ArrowBio (anaerobic digestion) would also need to provide a large number of modules to achieve the required throughput.
Reliability: Systems that have a long history of successful operation will necessarily have a demonstrable reliability. Such systems include mass-burn, both modular and waterwall. Pyrolysis and gasification systems have limited operating history on which to rely and, although they may have fewer moving parts and appear to be simpler in operation than other systems, they do not have sufficient experience to draw conclusions for reliability of operation. The anaerobic digester system has many constituent unit processes in an operating line, and has the potential for poor reliability.

White Paper: Meeting the Future: Evaluating the Potential of Waste Processing Technologies to Contribute to Rhode Island’s Solid Waste Management System
GBB/C09032-01 47 September 30, 2009
Environmental/Air: Mass-burn, RDF, pyrolysis/gasification and plasma arc systems utilize similar air pollution control systems and equipment. Pyrolysis and “starved-air” gasification technologies use less air than other thermal systems, and will have less flue gas generation; however the characteristics of the air emissions from these systems are similar to mass-burn and RDF systems. They meet the stringent air emissions requirements that were promulgated a decade ago, and that are constantly being upgraded and strengthened. The other processes do not burn an off-gas as part of their process line, but generate a syngas. The syngas, as a gas, will burn cleaner than process gases from the incineration equipment.
Environmental/Water: The anaerobic digestion system will generate a water surplus, but the other systems will require a water supply. Non-potable cooling water is necessary for steam condenser cooling when generating electric power and for other equipment cooling requirements, such as air compressor cooling. Potable water is necessary for boiler water make-up. Water is required for most air pollution control systems: for quenching or for reagent injection. Discharges are generally directed to a residue (ash) pit, and will exit the facility as wetted residue.
Environmental/Other: MSW will generally be discharged from trucks indoors, and exhaust fans in the truck bays will use odorous air as combustion air. With non-burn technologies, odor control systems will have to be installed, consisting of exhaust fans drawing air into a packed-tower chemically-charged odor scrubber. There are a number of sources of noise both within and external to the plant. Trucks entering the plant are one source. Within the plant, major sources of noise include utility trucks, forced draft and induced draft fans, burner operation, and air flow within the furnaces. With RDF or other pre-processing stages, shredders and material handling equipment are other sources of noise. Another environmental concern is residuals handling. The anaerobic digestion process will produce inorganic materials that can safely be landfilled. The other technologies generate an ash, frit, char or glass-like residue, all of which have to be subjected to the aforementioned testing protocol (TCLP) to determined if they can be placed in a municipal waste landfill, need to be deposited in a hazardous waste landfill, or can be converted to a useable product. Costs and Revenue Streams: The only technologies with dependable estimates for capital and operating costs, based on long experience in the U.S., are the proven mass-burn/waterwall, mass-burn/modular and RDF/dedicated boiler technologies. All of the others have cost estimates that are speculative, theoretical, or market-driven. Unless a vendor’s cost proposals are backed by substantial guarantees of performance, they cannot be considered reliable. All of these technologies will generate revenue streams. With mass burn, steam and/or electric power will be produced for sale, and ferrous metals can be reclaimed from the residue (ash) discharge. Ash can be classified and sorted into a size that may be salable or applied for beneficial use without charge. RDF systems normally produce ferrous metals at the front end of the process, rather than at the ash end. Ferrous metals recovered prior to incineration is relatively clean and has a greater value than ferrous metals removed from the ash, which are essentially alloyed with aluminum and other low melting point materials during passage through the heat of the furnace. RDF systems also have the potential to remove aluminum, glass and other constituents from the shredded MSW that may have value. Pyrolysis and gasification systems produce a glass-like material (a frit) that may be salable as a fill or construction material. Gasification and anaerobic digestion will generate a salable

White Paper: Meeting the Future: Evaluating the Potential of Waste Processing Technologies to Contribute to Rhode Island’s Solid Waste Management System
GBB/C09032-01 48 September 30, 2009
off-gas and, as with RDF systems, require pre-processing of MSW, which can generate ferrous and other materials for sale.
As Rhode Island contemplates waste disposal technologies and considers their applicability, it should also keep in mind opportunities that may become available at existing WTE facilities in nearby states (Connecticut and Massachusetts). At some of these facilities, local governments have contracts whose terms are ending in 2010 through 2018. There are also landfills located at further distances that could be reached by either road or rail. Keeping these options in mind for perhaps part of the State’s disposal needs may provide interim solutions to extending the life of the Central Landfill.
9.0 Summary and Conclusions
Rhode Island now has a system of recycling and disposal that supports itself with a $46 per ton service fee for disposal of Residential Solid Waste. The economic downturn has reduced the quantity of waste generated. Facilities with high capital investments, landfills and WTE, have been competing for waste and temporarily depressed the price of disposal. Practically all of the state’s residential and commercial waste is now deposited in RIRRC’s Central Landfill in Johnston. The Corporation projects at current recycling rates the Central Landfill will run out of capacity by January 2011. Even with enhanced diversion, the landfill would be full by mid-2012.
With that in mind, the State has several choices it can make before its landfill reaches capacity. These choices are as follows:
1. Add landfill capacity at the Central Landfill and implement the programs for increased diversion to further extend current and future capacity. Even with these actions, the landfill would reach capacity by 2031. The current $46-per-ton commercial service fee revenue requirement would need to be increased to recover the capital investment in the new capacity. An analysis should be conducted to determine the future total cost of continued landfilling at the expanded Central Landfill to be able to compare it with other alternatives.
2. Do not add landfill capacity and proceed to implement transfer services (truck or rail) to gain access to out-of-Rhode Island WTE capacity in adjacent Massachusetts or Connecticut, or landfills beyond Connecticut, either in New York, Pennsylvania, or Ohio. If facilities in neighboring states are used, trucking of MSW is feasible, but for shipping to remote landfills in western New York, Pennsylvania or Ohio, only rail hauling would be feasible at the tonnages generated in the state. The cost of this option is likely to be in the $60-$100 per ton range for adding transfer functionality and contracting for transportation and disposal. This is a sustainable solution but a more expensive alternative than #1 above. It is important to note that costs for these services are likely to escalate with at least inflation, although recent out of state landfill pricing actually is varying between no inflation and twice inflation.

White Paper: Meeting the Future: Evaluating the Potential of Waste Processing Technologies to Contribute to Rhode Island’s Solid Waste Management System
GBB/C09032-01 49 September 30, 2009
3. Implement a WTE facility sized at approximately 1,500 tons per day (approximately 500,000 tons per year) and add landfill capacity at the RIRRC’s Central Landfill for ash disposal and by-pass waste disposal. Using assumptions noted earlier, the service fee requirement is estimated to be in the $80-$85 per ton range. This is a sustainable solution with costs that are potentially lower those in #2 above, but potentially higher than in #1 above. Service fee escalation would apply to only part of the costs; with power sales escalating, overall escalation would be less than the rate of inflation. Additionally, if the plant were publicly owned, the debt service portion of the service fee goes away at end of bond term, reducing service costs significantly afterward. Depending upon the technology selected, there may be changes required to State law and environmental regulations.
To address these alternatives adequately, the Corporation should conduct a comprehensive procurement, as recommended below, soliciting proposals for WTE options (see below) and out-of-state disposal proposals that would include design-build-operation of transfer facilities, transport and long-term disposal.
9.1 Conclusions
1. The most applicable waste processing technologies for Rhode Island, if the Corporation decides it needs to supplement its recycling and landfill strategies, are the traditional proven technologies of mass burn/waterwall and RDF/dedicated boiler. All of the other technologies have either not been shown to be commercially viable as of yet, or would pose significant scale-up risks to the State in order to provide a comprehensive solution at 1,500 TPD.
2. Meeting the recycling goals and implementation of a 1,500 ton per day facility as described in Section 6 would not eliminate the need for a landfill. As shown in Table 2-1 over 127,000 tons of MSW would need to be landfilled along with the approximately 95,000 tons of ash from the facility.
3. The WTE option discussed in Section 6 does not make economic sense in the current climate. This may change in the future due to legislation, increases in the cost of energy or other economic conditions and/or the approaching end of the landfill life.
4. Rhode Island law and environmental regulations limit access to those proven, well established waste disposal technologies. Changes to laws/regulations are required to be able to access them.
5. There are emerging technologies available to Rhode Island under the current legal/regulatory framework that are less established in the marketplace and that have been demonstrated at smaller scales, notably gasification without on-site energy production. If the State pursues the use of these technologies, it must be prepared to manage the considerable risks involved, including commercialization risks, scale-up risks, performance risks, construction and operating cost risks and environmental compliance risks.

White Paper: Meeting the Future: Evaluating the Potential of Waste Processing Technologies to Contribute to Rhode Island’s Solid Waste Management System
GBB/C09032-01 50 September 30, 2009
6. Accessing these technologies is best done through a competitive public procurement and negotiation process that requests proposals from contractors that are able to provide a facility and services with appropriate financial guarantees to deliver the permitting, design, construction, start-up and acceptance testing, and long-term commercial operations under performance-based full-service contracting arrangements.
7. Recognizing the need to assure waste supply post-recycling, public ownership of the waste processing infrastructure would give the State greater ability to control waste flow destined for disposal originating in Rhode Island and direct it to this new infrastructure.
8. A preliminary review of regional market economics for disposal in either out-of-state WTE facilities or landfills would significantly increase current and forecasted service fee requirements. The current $46 per ton commercial fee level would be doubled or tripled.
9.2 Recommendations
1. The Corporation should expand the approved area for landfilling by getting permits approved for Phase IV. Also, it should conserve the permitted landfill space through competitive pricing.
2. The Corporation and Rhode Island Statewide Planning should consider initiating a request to legislators/regulators to debate appropriate amendments to existing statutes/regulations which would address the viability and timing of using waste processing technologies in Rhode Island.
3. Assuming potential statutory and regulatory hurdles are addressed, the Corporation should take steps to initiate a public procurement process to receive qualifications and proposals for the development of an appropriately sized 1,500-ton-per-day WTE facility to be located on or adjacent to its properties in Johnston; it is recommended that the procurement allow for proposals from full service contractors for either publicly- or privately-owned infrastructure development and be for pre-qualified technologies as are or may become allowed by State law.
4. The Corporation should take steps to expand its landfill capacity in Johnston so that it can accommodate ash and bypass disposal, as well as MSW in the event the facility size is not adequate for waste destined for disposal in Rhode Island in the future.
5. The Corporation should revisit the energy from waste issue when changes occur in law, economics, technology or landfill capacity.

White Paper: Meeting the Future: Evaluating the Potential of Waste Processing Technologies to Contribute to Rhode Island’s Solid Waste Management System
GBB/C99032-01 9-30-09
Appendix A

GBB/C09032-01 A-1 September 30, 2009
Jurisdiction
New York City
City of L
os Angele
s - P
hase 1
&2
Los Angele
s County
- Phas
e 1 & 2
King County,
WA
Freder
ick/C
arroll C
ounty, MD
Harford
County,
MD
City of S
acra
mento
, CA
Broward
County,
FL
St. Lucie
County, F
L
Hawaii C
ounty, HI
Pinellas C
ounty, FL
Marion C
ounty, F
L
Santa
Barbara
, CA
U.S. V
irgin Is
lands
City of T
aunton, M
A
SWA, Palm
Bea
ch C
ounty, FL
City of T
allah
asse
e, FL
San Jo
se, C
A
Total Tim
es S
ubmitted/Eva
luated
VendorsAlter Energy 4 1Basic Envirotech Inc. 1 1Consutech Systems LLC 1 2 2Energy Answers 2 3 2Global Environmental Technologies 1 1American Bio-Tech 1 1Horstmann Recyclingtechnik GmbH 1 1RRI - Switzerland 1 1Wright Environmental Management Inc. (Wright) 1 1 2Zanker 1 1American Bio-Tech 1 1HotRot Exports Ltd, or Outspoken Industries 1 1International Bio Recovery Corporation (IBR) 1 1Mining Organics 1 1Real Earth Technologies 1 1Arrow Ecology Ltd. (ArrowBio) 1 2 3 3Canada Composting, Inc. (CCI) - BTA Process 1 1 1 1 4Citec 1 1Ecocorp 3 1Emerald Waste Systems ???? 2 1Global Renewables/ISKA 1 1 2ISKA GmbH 1 1Kame/DePlano 1 1New bio 1 1Organic Waste Systems N.V. (Dranco) 1 1 1 2 4Orgaworld 1 1 2Urbaser 2* 1 2* 3VAGRON 1 1Valorga S.A.S. (Valorga)/Waste Recovery Systems 1 1 1 2* 1 5Waste Recovery Seattle, Inc. (WRSI) 2 1 2 3BRI Energy, LLC and Bioengineering Resources, Inc. 1 1 1 3Brightstar Environmental 1 1Dynecology 1 1Ebara 1 1 1 1 4Ecosystem Projects 1 1Emerald Power/Isabella City 1 1Energy Products of Idaho (EPI) 1 1Envirepel 1 1GEM America 1 1 2Green Energy Corp 1 1Horizon Energy Group 2 1ILS Partners/Pyromex 1 1Interstate Waste Technologies/Thermoselect (IWT) 1 2 2 2 2 3 6Jov Theodore Somesfalean 1 1Kame/DePlano 1 1Omnifuel /Downstream Systems (Omni) 1 1Omnifuel Technologies, Inc. 1 1Primenergy (RRA) 1 1 2 3Tajiguas Partners - WTE/Entech 3 1Taylor Recycling Facility 1 1 1 3Thermogenics 1 1Whitten Group /Entech Renewable Energy System 1 2 2Zia Metallurgical Processes, Inc. 2 1Arkenal Fuels (Bluefire) 1 1 2Biofine 1 1 2Genahol 1 1Masada Oxynol 1 1 2AE & E, Von Roll 2 1Babcock & Wilcox 3 2 2Barlow Projects, Inc. 3 1Covanta Energy Corporation 2 2 3 1 2 3 3 3 2 9Seghers Keppel Technology, Inc. (Seghers) 2* 2 2Veolia Environmental Services 4 1Waste Recovery Seattle, Inc. (WRSI) Steinmuller 2 1Wheelabrator Technologies Inc. 2 4 4 4 4 3 3 2 8AlterNRG - Westinghouse 1 1Geoplasma LLC 1 3 2Global Energy Solutions 1 1 2 3Green Power Systems 4 1GSB Technologies 1 1Peat International/Menlo Int. 1 1Plasco Energy Group 2 3 2Plasma Environmental Technologies, Inc. 1 1Rigel Resource Recovery and Conversion Company 1 1 2Solena Group 1 1 2Startech Environmental 1 1 2U.S. Science & Technology Group (USST) 4 1Conrad Industries 1 1Eco Waste Solutions 1 1Entropic Technologies Corporation 1 1Graveson Energy Management 1 1International Environmental Solution 2 1 3 3Pan American Resources 1 1 1 3WasteGen Ltd. /TechTrade (WasteGen) 1 1 2BLT/World Waste Technologies 1 2 2Changing World Technologies 1 2 2Herhof 2 3 2Molecular Waste Technologies, Inc. 1 1Red Energy Group 2 1Zeros Technology Holding 1 1Number of Total Responders 36 29 28 1 8 3 9 7 1 3 3 3 23 1 3 3 1 0 162
n
ined proposal to local government

GBB/C09032-01 A-2 September 30, 2009
Table A-2. Summary of Municipal Waste Processing Technologies
Available to the Rhode Island Resource Recovery Corporation Technology
Environmental Issues
Economic Issues Applicability to RI (Risks/Liability)*
RI Risk Summary Alternative Description Experience Record Size Applicability Reliability Capital
Operations/ Maintenance
Mass Burn/WaterWall
Unprocessed MSW fired in a chamber built of water tubes. Heat recovered for steam and/or electricity production
The predominant method of WTE in the US and overseas for decades. Over 60 plants currently in commercial operation
Modules up to 750 TPD, with total facility size over 3,000 TPD
High proven reliability, over 90 percent
Air emissions (controlled by statute). Requires residual disposal.
$200k to $300k per installed ton (high)
$40 to $65/ton (moderate) O&M costs. Minimal materials recovery.
Proven commercial technology at appropriate scale. Requires new legislation.
Very Low
Mass Burn/Modular
Unprocessed MSW fired in a series of refractory chambers followed by a heat recovery boiler for steam and/or electricity production
Substantial experience with facilities firing MSW in Europe and to a lesser extent in the U.S.
Modules up to 150 TPD, with total facility size up to 450 TPD
High proven reliability, over 90 percent
Air emissions (controlled by statute). Requires residual disposal.
$150k to $200k per installed ton (moderate)
$50 to $70/ton (high) O&M costs. Minimal materials recovery.
Proven commercial technology; limitations in scaling up to size needed. Requires new legislation.
Low
RDF/ Dedicated Boiler
Shredded MSW, with ferrous metals removed, fired in a chamber built of water tubes. Preprocessing can increase materials recovery.
Dozens of facilities in operation since the 1970's
Modules up to 750 TPD, with total facility size over 3,000 TPD
Good proven reliability, over 80 percent
Air emissions (controlled by statute). Requires residual disposal.
$158k to $198k per installed ton (moderate)
$50 to $60/ton (high) O&M costs.Good materials recovery revenue potential.
Proven commercial technology at appropriate scale. Requires new legislation.
Low
RDF/Fluid Bed
Shredded MSW fired in a sand bed. Preprocessing can increase materials recovery.
One facility firing MSW in the US, other units in Europe and Japan
Facility size up to 460 TPD
Good proven reliability, over 80 percent
Air emissions (controlled by statute). Requires residual disposal.
High capital cost High O&M costs. Good materials recovery revenue potential.
Proven technology; limited U.S commercial experience; scalability an issue. Requires new legislation.
Moderate
Pyrolysis
Heated MSW in oxygen-starved environment produces a fuel gas that is incinerated to generate usable energy - steam and/or electricity
One pilot plant in California operating for 2 years
Pilot plant sized for 50 TPD MSW
Insufficient experience to establish reliability estimate
Air emissions (controlled by statute), Odors from MSW transport. Residue may have beneficial use.
High capital cost High O&M costs High risk, uncertain commercial potential. No operating experience with large scale operations. May require new legislation.
High
Gasification
Heated MSW in oxygen-starved environment generates a fuel gas that can be exported for heat or power generation
Two facilities firing MSW in Japan since 1998, 10 small units firing MSW in Europe and Asia
Multiple modules of 300 TPD MSW each
Insufficient experience to establish reliability estimate
Limited air emissions (controlled by statute), potential air emissions when gas is fired. Residue may have beneficial use.
High capital cost (one vendor estimates $235k-$250k/installed ton)
High O&M costs Limited operating experience at only small scale. Subject to scale-up issues.
High
Anaerobic Digestion
Extensively preprocessed/Shredded MSW directed to a series of digesters for gas generation that can be exported for heat or power generation
One facility in operation in Israel for less than two years; other limited facilities in Europe
Operating facilities up to 300 TPD
Insufficient experience to establish reliability estimate
Odor, potential air emissions when gas is fired. Residue may have beneficial use.
Low capital cost High O&M costs. Several materials revenue streams may be available,
Limited operating experience at small scale. Subject to scale-up issues.
High
Mixed-Waste Composting
Shredded and screened MSW is aerated, allowing natural organisms to convert waste into a soil amendment. No energy products are generated.
Hundreds of small plants in operation in Europe; 14 the US, mostly less than 120 TPD
Up to 250 TPD facilities Product quality unreliable
Odor; potential for product contamination from MSW toxics
Low capital cost Low O&M costs. Questionable product quality threatens project economics
No large-scale commercially viable plants in operation.. Scale-up an issue.
Moderate to high
Plasma Arc
MSW heated by a plasma-arc in oxygen-starved environment produces a fuel gas that is incinerated to generate usable energy for steam and/or electricity. Similar to gasification.
Two pilot plants in operation since 1999 in Japan
Less than 200 TPD MSW
Insufficient experience to establish reliability estimate
Air emissions (controlled by statute). Residue may have beneficial use.
Very high capital cost
Very high O&M costs No commercial experience to date. Subject to scale-up issues. May require new legislation.
High
Chemical Decomposition
The organic portion of MSW is heated, converted to a gas, and the gas is refined to water, burnable and non-burnable fractions
No operating plants at this time
No operating facilities at this time
Insufficient experience to establish reliability estimate
Odor, potential air emissions (controlled by statute) when gas is fired
Moderate capital cost projected
Unknown at this time Technology under development. Not a commercial option at this time.
High
* Does not include risks related to procurement, such as vendor quality and deep-pockets (ability to provide technical, construction and operating guarantees; underwrite risks, etc.)