Embed Size (px)
Citation preview

Quarterly Presentation
Q2 2021
August 12, 2021
Meet the world
with video communication as it should be

2
Important notice and disclaimer
These materials have been produced by Pexip Holding ASA (the "Company“, and with subsidiaries the “Group”). The materials have been prepared for the
exclusive use of persons attending an oral briefing and meeting to which these materials relate given by a representative of the Company and/or persons to
whom these materials have been provided directly by an authorized representative of the Company (the “Recipients”). For purposes of this notice, "materials"
means this presentation, its contents and appendices and any part thereof, any oral presentation and any question or answer session during or after or in relation
to any of the foregoing.
The materials are for information purposes only, and do not constitute or form part of any offer, invitation or recommendation to purchase, sell or subscribe for
any securities in any jurisdiction and neither the issue of the information nor anything contained herein shall form the basis of or be relied upon in connection
with, or act as an inducement to enter into, any investment activity. The materials comprise a general summary of certain matters in connection with the Group,
and do not purport to contain all of the information that any recipient may require to make an investment decision. Each recipient should seek its own
independent advice in relation to any financial, legal, tax, accounting or other specialist advice.
No representation or warranty (expressed or implied) is made as to any information contained herein, and no liability whatsoever is accepted as to any errors,
omissions or misstatements. Accordingly, the Company or any such person's officers or employees accepts any liability whatsoever arising directly or indirectly
from the use of the materials.
The materials may contain certain forward-looking statements relating to the business, financial performance and results of the Company and/or the industry in
which it operates. Forward-looking statements concern future circumstances and results and other statements that are not historical facts, sometimes identified
by the words "believes", "expects", "predicts", "intends", "projects", "plans", "estimates", "aims", "foresees", "anticipates", "targets", and similar expressions. Any
such forward-looking statements are solely opinions and forecasts which are subject to risks, uncertainties and other factors that may cause actual events to
differ materially from any anticipated development. No liability for such statements, or any obligation to update any such statements or to conform such
statements to actual results, is assumed.
These materials are not intended for distribution to, or use by, any person in any jurisdiction where such distribution or use would be contrary to local laws or
regulations, and by accepting these materials, each recipient confirms that it is able to receive them without contravention of an unfulfilled registration
requirements or other legal or regulatory restrictions in the jurisdiction in which such recipients resides or conducts business.
This presentation and related materials speaks only as of the date set out on the cover, and the views expressed are subject to change based on a number of
factors. The Company does not undertake any obligation to amend, correct or update the materials or to provide any additional information about any matters
described herein.

Recent highlights
3
41% y-o-y
growth in ARR to
USD 93 million
NOK 177 million in
revenue for Q2 2021
Executing on growth
strategy; -23% EBITDA
margin for Q2 2021
Pexip Control Center,
Direct Peering and Avaya
Videoconferencing
Registration
“Best Telehealth
Platform” award in the
annual MedTech
Breakthrough Awards
Continued to add several
new Fortune 500
companies as customers
3
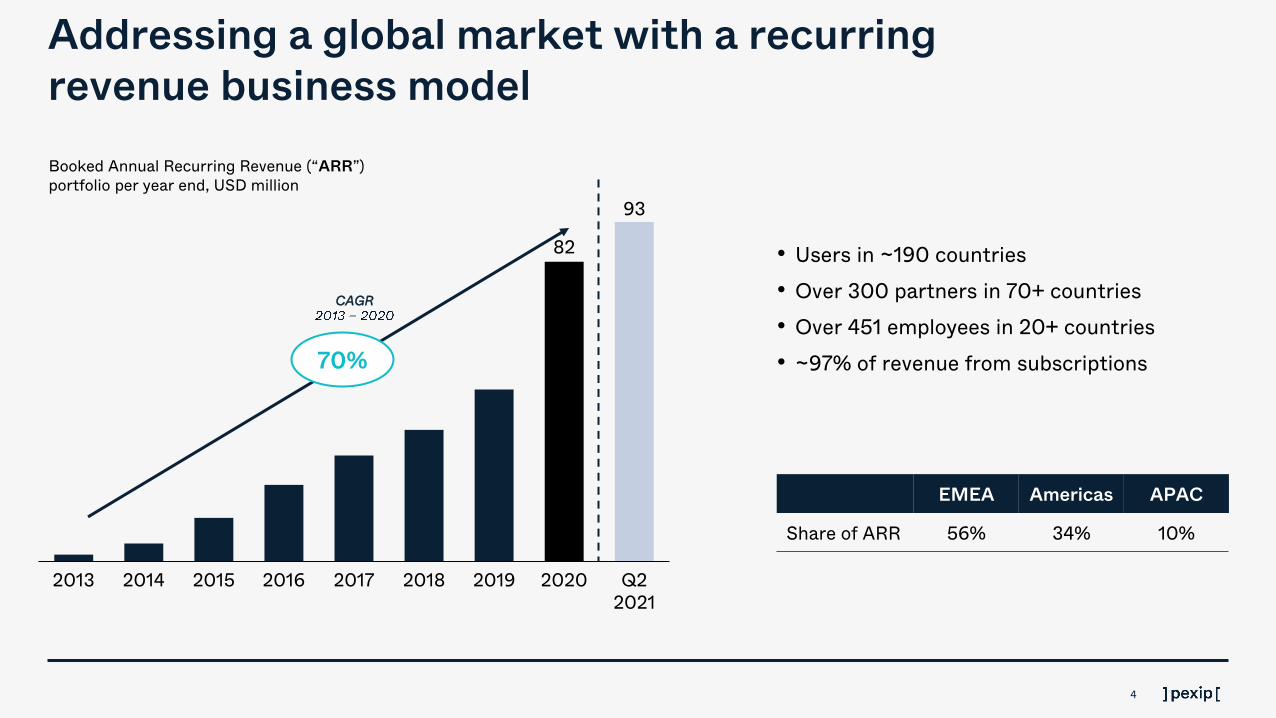
202020152013 20172014 2018 Q2
2021
2016 2019
82
93
Addressing a global market with a recurring
revenue business model
4
• Users in ~190 countries
• Over 300 partners in 70+ countries
• Over 451 employees in 20+ countries
• ~97% of revenue from subscriptions
Booked Annual Recurring Revenue (“ARR”)
portfolio per year end, USD million
70%
EMEA Americas APAC
Share of ARR 56% 34% 10%
CAGR

✓A better way to meet with business-quality
audio/video
✓Securely join from anywhere across multiple
technologies
✓Customize the platform to meet the unique
needs for the organization and IT
✓Full control of data privacy and sovereignty, and
compliance with data security standards
Video communications as it
should be
5

Large organizations choose Pexip for
three main use cases
High-quality video
meetings with focus
on privacy and
security
Vertical market
applications and
integrations
Expanding access to
Microsoft Teams and
Google Meet
6

Pexip’s differentiated customer offering is
underpinned by unique technology
7
• Proprietary real time media engine
• Unique interoperability
• Unique AI capabilities in the cloud
• Proprietary technology allows Pexip’s experience to be delivered on
any existing platform or cloud provider (On-premise, GCP, Azure++)
• Unique data privacy and control
• Unique security capability through by-passing the internet
• Unique customization capabilities
Smart transcoding Cloud agnostic deployment flexibility
On-premise
Self-Hosted
Private Cloud
SaaS
Flexible IT admin experienceRich end-user experience

8
Solid growth path to long-term value creation
Industry recognized video
communication platform with
unique technology
Trusted by high demanding
enterprise customers and
government organizations
4
Massively scalable business
model with high sustainability
impact
5
Massive, high-growth market
with unique position towards
large organizations
2
Exceptional R&D team with a
history of industry defining
innovation
3
Solid growth path to reach
USD 300m by end-of-2024
6 1

Pexip is targeting USD 300 million
in ARR by end of 2024
9
Long-term profitability
Market recognition
Revenue growth ARR of USD 300 million by end-of-2024
2025 EBITDA of +25% with +25% revenue growth
Plan for negative 25-35% EBITDA margin in 2021/2022, neutral to positive EBITDA in 2023
Recognized leader position in the Meeting Solutions market within 3-4 years

Q2 Operational
Update

Recent market developments
11
Broad adoption of video in knowledge worker
organizations – early adoption in frontline
customer care
Increased competitiveness on cloud-based
meetings from large known brands, with
customers mainly focused on PC-to-PC meetings
during pandemic
Return to the office has taken longer time than
expected at the start of 2021

Market impact on Pexip’s main use cases
- exemplified with recent customer wins
12
High-quality video
meetings with focus
on privacy and
security
Vertical market
applications and
integrations
Expanding access to
Microsoft Teams and
Google Meet

Pexip continues to win the trust of new large
enterprises and public organizations
13
Selected by a range of large organizations
*Fortune 500 and Global 500
Selected customer wins in Q2 2021
USD >100,000 USD 30,000-100,000 USD <30,000
Large organizations driving growth
Share of ARR by account size in ARR, USD
Q2 2021
54%
23%
25%
49%
26%
Q2 2020
23%
66M
93M+41% YoY growth:
56%
28%
25%
Added 5 new Fortune 500* customers in Q2
Currently ~15% of Fortune 500* as customers

Pexip’s product and go-to-market model designed for large
organizations
14
Audio / Video
specialists
System
integrators
Service
providers
Pexip
sales
teams
Generate demand internally Partners executing sales and integration services
Sales and go-to-market
teams comprise more
than 200 employees
Scale through
partners
Targeting Large Organizations
Equinor
~15% of Fortune 500 accounts

Continue to build growth capacity and culture
15
68 87 96 113
6870
7282
93
11620
34
41
47
26
Q4
2019
Q2
2021
14
Q2
2019
14
Q3
2019
237
Q1
2020
135
22
Q4
2020
Q3
2020
Q2
2020
31
261
130
Q1
2021
143
160
138
162 171182
215 250
307
361
416
451
197
+80%
Number of employees
Sales and Marketing
R&D
Other
Scaling the team
Strong team and culture is key for future growth
• Plan for 550-600 employees year end 2021
• Approx 100-150 new employees in 2022
• 50-100 new employees in 2023 and 2024
• Investing 60% in sales and marketing, 30% in
R&D and 10% in other
• Strengthening the team is a key enabler for
building stronger growth capacity

Sales and
Financial
Performance

Booked Annual Recurring Revenue (ARR) development Q-o-Q growth in ARR
17
Q3
2020
Q2
2020
87
Q2
2019
Q4
2019
Q3
2019
Q1
2020
Q4
2020
Q1
2021
43
Q2
2021
40
47
57
66
73
82
93
+64%
+41%
9.1
Q2
2019
2.4
Q2
2021
Q2
2020
5.5
41% growth in Annual Recurring Revenue –
Added 5.5 million in Q2 2021
USD million USD million
• Q2 2021 growth in ARR of
USD 5.5 million, compared
to USD 9.1 million in Q2
2020 and USD 2.4 million in
Q2 2019
• Strong development in new
Fortune 500 logos
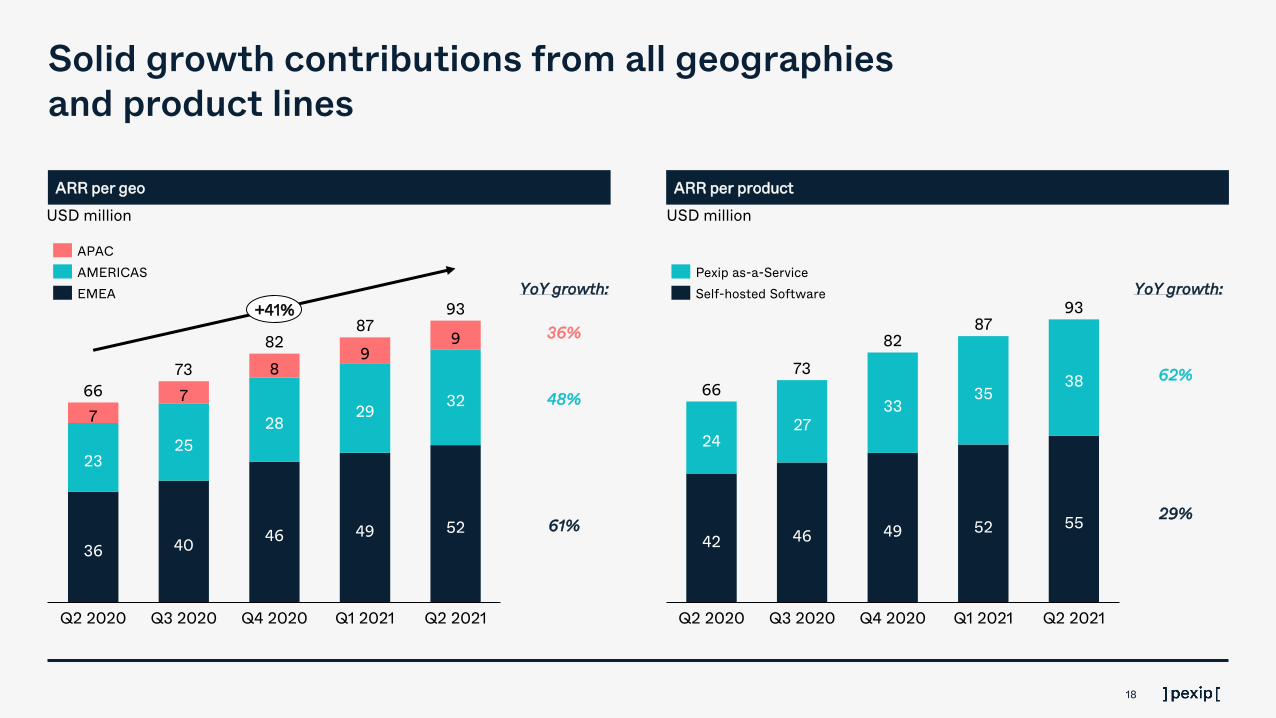
Solid growth contributions from all geographies
and product lines
ARR per geo ARR per product
USD million
YoY growth:
61%
48%
36%
YoY growth:
29%
62%
18
4246
4952
55
24
27
33
35
3866
93
Q2 2020 Q3 2020 Q4 2020
87
82
Q2 2021Q1 2021
73
Pexip as-a-Service
Self-hosted Software
3640
4649 52
23
25
28
29
32
7
7
8
9
9
66
Q2 2020 Q3 2020 Q4 2020 Q1 2021 Q2 2021
73
82
87
93+41%
APAC
AMERICAS
EMEA
USD million

65,8
92,7
26,5
7,3 6,8
Net Upsell ChurnQ2 2020 New Sales Q2 2021
New sales is the main driver for ARR growth
with 40% in the last twelve months
19
Development in ARR portfolio last twelve months
USD million
• Continue to increase last twelve
months new sales
– New sales were USD 1.8 million
lower than Q1 2021, impacted by
delayed returns to office
– Strong performance in new logos
and F500 additions, but on
average somewhat smaller deal
sizes in the quarter
• ARR net retention is at a good level
at 101%, compared to 118% in 2020
and 99% in 2019
+41%
+40%
+11%
Net retention of 101%
-10%

ARR growth driving revenue growth
Quarterly revenue development
NOK million
57
136
2019
Q3
55
159
2726
90
2019
Q4
112
38
2020
Q1
45
229
2020
Q2
76
2019
Q2
70
2020
Q4
108
72
2021
Q1
102
180
75
2021
Q2
117
26
60
119
150
82 81
163
177
2020
Q3
+9%
Cost of goods sold (Percent of revenue)
Self-hosted Software
Pexip as-a-Service
Operating revenues – Pexip as-a-Service
• Overall growth of 68% year-on-year to NOK 75 million, in line with
ARR growth despite development in NOK/USD exchange rate.
Operating revenues – Self-hosted Software
• Overall decline of -14% year-on-year to NOK 102 million
• Q2 2020 saw extraordinary upsell to existing customers, with some
contract renewals in Q4 2020, resulting in revenue recognized in
Q4 2020 instead of Q2 2021
• Software revenue mainly recognized at time of delivery, which leads
to quarterly variations in revenue recognition.
• Currency impacting negatively, as NOK/USD is down ~15%
compared to Q2 2020
Gross margin
• Higher cost of goods sold mainly due to high Pexip as-a-Service
revenue growth and higher usage, as well as lower self-hosted
software revenue due to periodization
• Modernized service platform from own hardware to cloud compute,
for better scale, resiliency and operations as well as lower
investments in own hardware going forward
– Expect COGS to grow less than as-a-Service revenue going
forward as some of the costs related to the platform
modernization are fixed and not volume driven.
Comments
YoY growth:
68%
-14%
17
(7%)
11
(7%)
10
(6%)
5
(6%)
4
(5%)
15
(8%)5
(3%)
4
(4%)
21
(12%)
20

Increase in operating expenses from planned
investments in Sales and R&D capacity
21
Quarterly OPEX development
Other Operating expenses
• Overall increased activity level, while travel expenses remain
low
• Increased investments in marketing in order to capitalize on
the increased demand for video collaboration technology
Salary and personnel expenses
• Increased headcount main driver of increase in salary and
personnel expenses
• Fluctuation in share price giving variation in accrued employer
tax costs
• Periodization of holiday pay shifted to Q3 (in Q2 in 2020) to
harmonize with employee holidays in EMEA
• Other Salary and personnel expenses positively impacted by
weaker NOK/USD exchange rate
Comments
NOK million
15.5
23.9
45.8
17.9
218.8
2020 Q2
42.3
2019 Q2 2019 Q3
1.7
21.4
Q1 2021
59.2
2020 Q42019 Q4
158.9
2020 Q1
1.5
1.1
35.4
43.2
72.6
46.3
32.8
64.4
31.7
14.7
2020 Q3
102.6
32.3
129.2
149.0
163.2
143.0
48.2
147.4
Q2 2021
32.6
109.4
63.7
80.5
196.8
66.1
IPO-related costs
Share option costs
Other operating expenses
Other Salary and personnel expenses

CommentsCash flow from investing activities per quarter
Executing on communicated growth strategy
*Adjusted for IPO expenses
40
-41
14
-15
EBITDA
Q2 2020*
Change in
Other
operating
expenses*
Change in
Salary and
personnell
expenses
Change in
Revenue
-11
Change
in Cost
of sale
-69
EBITDA
Q2 2021
126 additional people
in Sales and
Marketing,
50 additional in R&D
• Significant investments into growth
acceleration, as indicated at the IPO
• Main investments in strengthening the global
sales team as well as R&D
• Ramp-up to productivity for quarterly growth in
ARR for new sellers normally 9-12 months
• Headcount increased by 80% to 451 in Q2
Targeting negative 25-35% EBITDA margin in
2021/2022, break-even in 2023 and above
25% EBITDA margin by 2025
Significant investments in sales-related headcount, impacting EBITDA
22
NOK million, cash outflow

Capitalized investments
23
Cash flow from investing activities per quarter
• Lower spend on PPE and intangibles compared to Q4 2020
and Q1 2021 as majority of UK office move is completed and
no spend related to customer base acquisitions
• Capitalization of software development in line with previous
quarters
Comments
NOK million, cash outflow
14.7
(9%)
7.9
(10%)
0.3
2019 Q2
7.6
2.3
7.36.3
2019 Q3
1.0
2019 Q4
12.0
(7%)
1.8
7.5
2020 Q1
7.2
7.5
2020 Q2
3.2
7.57.5
2020 Q3
27.9
11.2
10.7
(8%)
2020 Q4
9.3
(6%)
14.5
12.3
2021 Q1
4.5
2021 Q2
8.5
(11%)
8.3
(7%)
39.1
(17%)
26.7
(15%)
Software dev.
PPE and intangibles

Cash flow bridge
Cash flow bridge Q2 2021
24
NOKm
• Negative EBITDA and CAPEX main
contributors to cash flow, in addition to
share buy back
• Negative cash flow of NOK 72 million, on the
same level as the net proceeds from March
employee option share issue
– Net H1 cash flow of NOK 0.6 million from
share issuance and share buy backs
• Cash position of NOK 1,031 million out of Q2
2021, Pexip has a solid cash position to fund
the acceleration plan
Comments
Exchange
rate
changes
on cash
holdings
Cash
balance
Q2 2021
Cash
balance
Q1 2021
41
EBITDA
6
1,031
5
Share
buyback
and issues
CAPEX
72
12
NWC Leases,
borrowings
and other
1,147
1
Share-
based
costs
6
-117

Summary and
Outlook

Q2 2021 in brief
Solid top line growth
• Continued ARR growth with USD 5.5 million in
Q2 2021/41% y-o-y growth
• NOK 177 million in revenue for Q2 2021, +9%
compared to Q2 2020
Executing on the acceleration plan
• Launch of Pexip Control Center, Direct Peering
and Avaya Collaboration
• Continue to build sales and R&D capacity -
reached 451 employees end of Q2 2021
• Negative EBITDA in line with announced strategy
• Solid cash position to invest in further growth
26

Positive outlook for video
communication
• Majority of enterprises shifting to hybrid working
• Organizations looking to embed video into their
workflows towards customers
• Pexip’s technology is uniquely positioned to meet
these new customer needs
• Sales pipeline for 2H 2021 is strong
Will continue to execute on growth plan
• Increase investments in future growth by adding
talent in sales and marketing as well as R&D –
targeting 550-600 employees by end of 2021
• Plan for negative 25-35% EBITDA margin in
2021/2022, neutral to positive EBITDA in 2023
• Target 2025 EBITDA of +25% with +25%
revenue growth
Expect to reach long-term target of USD 300
million in ARR by end-of-2024
Outlook
27

Upcoming dates
28
Q3 2021 quarterly
presentation
October 7, 2021Update on Annual Recurring
Revenue
November 11, 2021

Q&A


![[INFOGRAPHIC] To Meet or Not to Meet: Traveling vs. Video Conferencing for Business](https://img.dokumen.tips/doc/110x75/54b6b2784a7959e71f8b4591/infographic-to-meet-or-not-to-meet-traveling-vs-video-conferencing-for-business.jpg)