Embed Size (px)
Citation preview
Medium-term forecasts of half-hourlysystem demand: development of an
interactive demand estimation coefficientmodel
S.V. Allera, B.A., and J.E. McGowan, B.Sc.
Indexing terms: Load forecasting, Modelling, Long-term planning, Management
Abstract: This paper describes a model which predicts half-hourly system demand for representative days in theyear using detailed load research data and electricity sales forecasts. The approach is to construct daily loadcurves for individual consumer categories, expressed in the form of demand estimation coefficients, and aggre-gate these into a total system demand curve by applying the appropriate sales projections. The nature of themodel permits a full interaction with the disaggretated electricity sales forecasts which are produced as part ofthe electricity supply industry's regular review of energy prospects. Results of validation tests are reported, andapplications of the model to demand forecasting and to more general policy issues are discussed.
1 Introduction
As part of the medium-term planning procedure of theelectricity supply industry (ESI) in England and Wales, theElectricity Council each year agrees forecasts of kWhrequirements on the Central Electricity Generating Board(CEGB), and system maximum demand (in MW) for aperiod of 7 years ahead. An important input into thisprocess is a set of forecasts produced jointly by staff fromthe Electricity Council and CEGB. The kWh requirementsforecasts are broken down into considerable detail by typeof final consumer and end use — improvements in fore-casting methodology have tended towards disaggregatedapproaches, with the greater emphasis placed on salesrather than demand. More recently however the ElectricityCouncil's Corporate Development Department has con-structed a model for forecasting system demand, the DECModel, which also has a disaggregated emphasis, so tight-ening the link with the sales forecasting process. An impor-tant attribute of the DEC Model is that it can project theentire daily load for typical periods of the year, and is notrestricted simply to predicting the system peak. Conse-quently the model provides a vital link between forecastsof kWh sales and the costs of operating the electricitysupply system to meet a specified level and pattern ofdemand.
2 Background
Prior to development of the DEC Model, the task of fore-casting maximum demand concentrated on predictingsystem load factor, measured in relation to the peak half-hour demand (typically 17.30 hours) under 'average coldspell' conditions.* Load-factor forecasts, taken in conjunc-tion with separately determined kWh requirements projec-tions, then yielded predictions of peak system demand. Atone time forecast load factor was derived from a salesweighted aggregation of load-factor projections for thethree main consumer classes (domestic, commercial andindustrial). Source data describing each class's contribu-tion to total peak demand originated from statistical
* ACS is defined as conditions such that in 50 years out of 100, peak winter demandwould be higher, and in 50 years lower, than demand in average cold spell weather.
Paper 4871C (P9, Pll) , received 7th February 1986
The authors are with the Forecasting Group of the Corporate DevelopmentDepartment, The Electricity Council, Millbank, London SW1P 4RD, UnitedKingdom
analysis of the relationship between recorded demand atindividual supply points on the day of system peak, andthe appropriate annual consumer class sales. Thisapproach had the advantage that anticipated changes inclass mix could be introduced, but volatility over time inthe underlying consumer class patterns, and reservationson the accuracy of the base data, led to the introduction ofa different method. Instead an econometric model of loadfactor was estimated, in which the effects of variables suchas the share of industrial sales, and the appliance mix ofdomestic sales, were quantified. Both approaches thereforeattempted to isolate certain of the influences on systemdemand, but they forecast only a single half hour, andmade little use of results from the ESI's load researchprogramme.
3 Role of load research surveys
The availability of load research data has become anincreasingly important consideration [1]. Continuousmetering of electricity supplies to representative samples ofconsumers has been conducted by the ESI for many years,but more recently the survey work has been systematicallydeveloped to widen coverage so that over 90% of sales arenow regularly covered by sample results (see Table 1). Ineach of the three main classes (i.e. unrestricted domestic,industrial and commercial), the results are based onsamples of about 700 consumers. While the samples for theother sectors are smaller, they are sufficiently large to giveresults which can be treated with a high degree of con-fidence. Annual analyses for the main consumer classes are
Table 1: Load research sample survey coverage 1983/84
Sample category
Domestic — unrestrictedtEconomy 7 'off-peak'
Industrial*Commercial*FarmCombined domestic and commercialNondomestic Economy 7Total
Percentage share
Peakdemand
40.12.9
28.121.2
1.20.61.0
95.0
Annualsales
28.54.3
36.918.9
1.10.81.1
91.6
* Further subdivisions available from regular samplest Further subdivisions available from occasional surveys/statisticalanalyses.
IEE PROCEEDINGS, Vol. 133, Pt. C, No. 7, NOVEMBER 1986 393

supplemented by finer breakdowns giving details forindustry groups and type of commercial premise. In addi-tion there are less regularly available data relating todomestic end-use demands estimated from direct metering,or indirectly from statistical analysis of more aggregatedload-curve results.
4 DEC model
4.1 ValidationA consequence of the ESI's load research programmetherefore is that in principle half-hourly demands at con-sumers' terminals are available, by consumer category, forany day of the year. The computational effort involved,and the need to standardise results for typical days of theweek and midday temperatures, limits to some extent thenumber of representative daily load curves that can readilybe estimated. Nonetheless the survey results are a powerfulinformation source from which a family of typical dailyload curves can be estimated. The procedure central to theDEC model is to construct standardised load curves foreach consumer category, expressed in the form of demandestimation coefficients derived directly from load researchresults. The DECs represent the half-hourly demands (inkW) divided by the associated annual sales figure (MWh).Thus by multiplying for any one consumer class each DECand the appropriate sales figure, an estimate of classdemand can be made. Aggregation across classes, with anallowance for consumer classes not included in the loadresearch surveys (for example public lighting) and trans-mission and distribution losses, produces an estimate oftotal system demand on the CEGB. Thus for any one ofthe typical load curves:
u = Z zit
where
M = total system demand in year t (MW)S = annual electricity sales in year t (GWh)d = demand estimation coefficient in year t (kW/
MWh)Z = adjustment factor to allow for losses and survey
noncoveragei = 1 ... 48 half hoursj = I ... n consumer categories, with n ranging from
20 to 50, depending on forecasting task
Before the model was used for forecasting it was separ-ately validated for each of the typical days. This was doneusing 1983/84 sales data and DECs for the particular tem-perature and day of the week to estimate total demand onthe system. This estimate was then compared with outturndemands on the CEGB corrected to the same temperatureas the individual DECs using a similar weather correctionprocedure. As part of the validation process the DECModel produces a number of measures of predictive accu-racy, two of which are summarised here: the mean absol-ute percentage error on individual half hours (MAPE), andthe total curve fit (TCF). The former is calculated fromdifferences between estimated and actual demand for eachhalf hour. The latter refers to the percentage differencebetween the estimated and actual GWh supplied duringthe day in question, calculated by aggregating across thehalf-hourly demands. It is possible to have a low MAPE,yet because of consistent under or overprediction stillshow a poor TCF. However a low MAPE and a low TCFare good indicators that the model is providing an accept-able representation of the known load curve. On this cri-
394
terion Table 2 shows that the model's performance againstthe 1983/84 outturn is generally highly satisfactory. For
Table 2: Estimation properties of DEC model, comparisonswith 1983/84 actual
Winter at 32°FWeekdaysSaturdaySunday
Winter at 42°FWeekdaysSaturdaySunday
Spring/early summer at 62°FWeekdaysSaturdaySunday
Mean absolute percentage err
Mean absolutepercentage error.
2.32.03.6
2.31.62.1
2.01.62.4
V48
Totalcurve fit.
0.9-1.6-3.5
1.9-0.6-1.5
1.30.80.2
48
zE,-A,
A,J*100
where E = estimated system demandA = actual system demand/ = 1 ... 48 half hours
Total curve fit (TCF) =
48V JLl "'
48
Z;
48
/ = 1 100
only one curve (Sundays at 32°F) does the MAPE exceed3%, while there is only one instance (also Sundays at 32°F)of the TCF going beyond the range ±2%. An additionalindication of the model's ability to replicate the systemload shape is shown graphically in Fig. 1, with the main
40
35
30
25
O 20
15
10
5
28A 8 12 16clock time,hours
Fig. 1 Validation of the DEC model for 1983/84 winter weekdays at32°F
actual demandestimates from model
consumer-class components of demand on a cold winterweekday depicted in Figs. 2a and 2b.
Because load research survey coverage was extendedonly relatively recently, validation for earlier years in themanner described for 1983/84 is not possible. However theexplanatory power of the model can be tested further byreplicating 1981/82 demand with that year's sales data andthe most recent DEC data. Fig. 3 compares the resultsfrom this analysis with demand on the CEGB in the sameyear. Again the DEC Model produces a good explanationof demand, estimating both the level and the shape of theload curve correctly. The model has also been able to iden-
1EE PROCEEDINGS, Vol. 133, Pt. C, No. 7, NOVEMBER 1986

tify changes in the load shape that have occurred between1981/82 and 1983/84. In particular, it has picked up the
20
15
o 18
8 12 16 28clock t ime, hours
o
20
15
O 10
5
0
•
\
\
i\
4 8 12 16 20clock time,hours
b
Fig. 2 Components of demand on a winter weekday at 32° Fa industrial
commercialfarm, combined premises, public lighting etc.
b domestic unrestricteddomestic off-peak
40
35
30
25
20
15
10
5
020 24
Fig. 332°F
4 8 12 16clock time, hours
Validation of the DEC model for 1981/82 winter weekdays at
actual demandestimates from model
growth in early-morning demand (associated with the risein domestic usage on the Economy 7 tariff which has a lownight price for seven hours) and the faster and steeper fallin demand in the late evening.
42 Model developmentWork is being carried out to increase the number of'typical' load curves, particularly to construct load curvesfor the summer period. The model is also being developedto provide a more detailed disaggregation of demand.Additional results from the standing samples and otherload research analysis provide a considerable number ofdetailed DECs which can be used to extend the break-down to about 50 categories. In many situations there islikely to be a clear benefit from using this finer degree of
8 12 16clock time, hours
20 24
Fig. 4 Components of unrestricted domestic demand on a winterweekday
dJ]] miscellaneous usesL j televisionsp | lighting|_J water heating| space heatingm cookingd§ refrigeration
disaggregation. Fig. 4 gives an example of how a numberof load research results have been drawn together to indi-cate the importance of different appliances within unre-stricted domestic demand. Work is currently taking placeon providing additional detail in the industrial and com-mercial sectors and this will help to refine the model stillfurther.
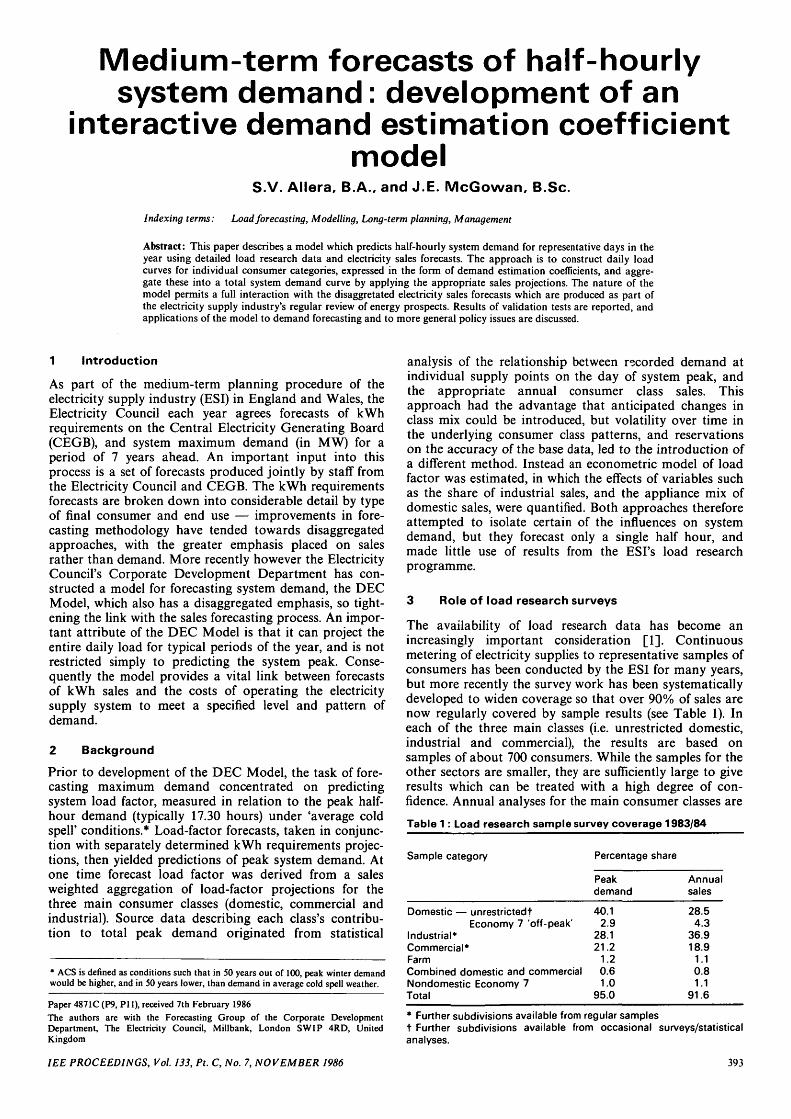
4.3 Model applicationFor forecasting purposes an essential input into the DECModel is the set of electricity sales forecasts which are pre-pared as part of the forecasting work mentioned earlier.Because a time series of DECs for the full set of com-ponent load curves is not yet available, the present prac-tice is to assume no change in the individual load shapes,implying that any variation in the shape of the totalsystem load curve arises only as a result of variations insales mix. This though is an important influence whichneeds to be recognised. For example the ESI's currentadopted electricity forecasts anticipate a comparativelyrapid rate of increase in sales to the commercial sector, butno growth in unrestricted domestic sales. Fig. 5 showswhat the impact on the 1983/84 system load curve forSaturdays at 62°F would be if the sales proportions for theearly 1990s were substituted for those which actuallyoccurred. The lower level of afternoon and eveningdemand reflects the decline in the relative importance ofunrestricted domestic sales.
The DEC Model also has the capability to examine theload curve's sensitivity to changes in the underlying eco-nomic and social framework, for example the introduction
IEE PROCEEDINGS, Vol. 133, Pt. C, No. 7, NOVEMBER 1986 395
of a shorter working day. An assessment of this kind mustbe somewhat speculative in that it involves a number of
20
10
8 20
Fig. 5sales mix
12 16clock time,hours
Effect on summer Saturday demand of substituting early 1990s
actual demand
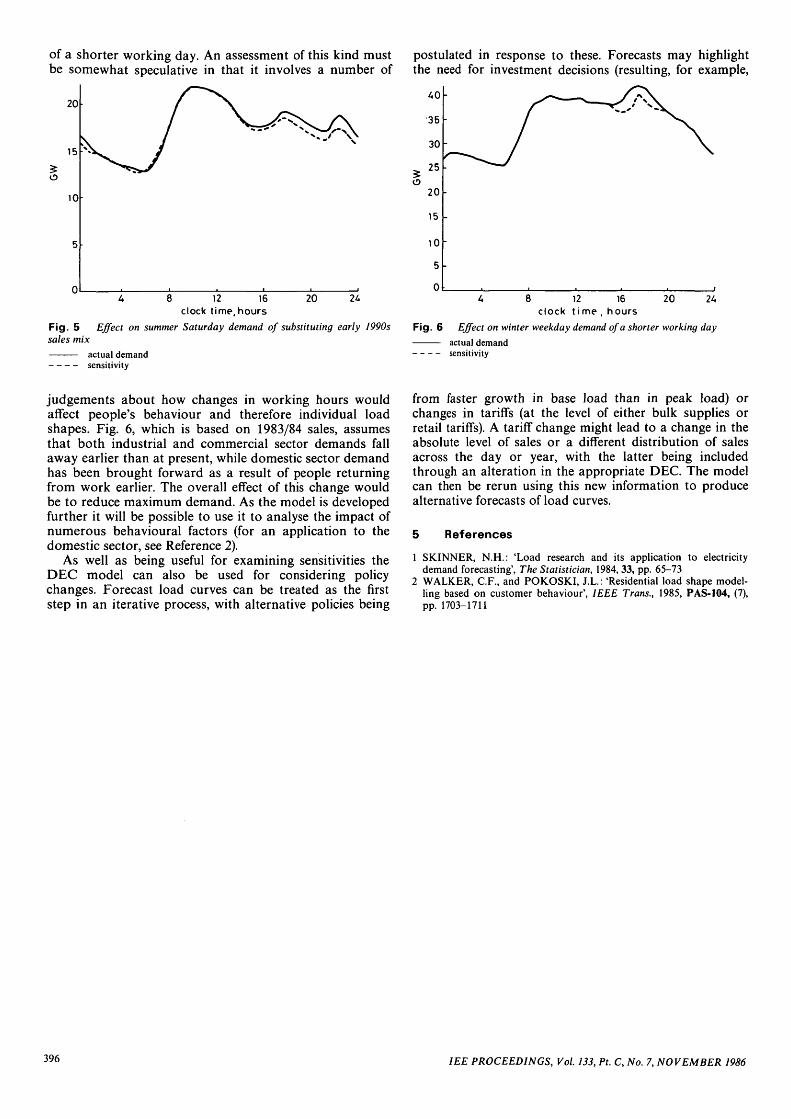
postulated in response to these. Forecasts may highlightthe need for investment decisions (resulting, for example,
40
35
30
25
20
15
10
5
204 8 12 16clock t ime , hours
Fig. 6 Effect on winter weekday demand of a shorter working dayactual demandsensitivity
sensitivity
judgements about how changes in working hours wouldaffect people's behaviour and therefore individual loadshapes. Fig. 6, which is based on 1983/84 sales, assumesthat both industrial and commercial sector demands fallaway earlier than at present, while domestic sector demandhas been brought forward as a result of people returningfrom work earlier. The overall effect of this change wouldbe to reduce maximum demand. As the model is developedfurther it will be possible to use it to analyse the impact ofnumerous behavioural factors (for an application to thedomestic sector, see Reference 2).
As well as being useful for examining sensitivities theDEC model can also be used for considering policychanges. Forecast load curves can be treated as the firststep in an iterative process, with alternative policies being
from faster growth in base load than in peak load) orchanges in tariffs (at the level of either bulk supplies orretail tariffs). A tariff change might lead to a change in theabsolute level of sales or a different distribution of salesacross the day or year, with the latter being includedthrough an alteration in the appropriate DEC. The modelcan then be rerun using this new information to producealternative forecasts of load curves.
5 References
1 SKINNER, N.H.: 'Load research and its application to electricitydemand forecasting', The Statistician, 1984, 33, pp. 65-73
2 WALKER, C.F., and POKOSKI, J.L.: 'Residential load shape model-ling based on customer behaviour', IEEE Trans., 1985, PAS-104, (7),pp. 1703-1711
396 IEE PROCEEDINGS, Vol. 133, Pt. C, No. 7, NOVEMBER 1986