Embed Size (px)
Citation preview

GOVERNMENT OF KERALA
MEDIUM TERM FISCAL POLICY & STRATEGY
STATEMENT WITH MEDIUM TERM
FISCAL PLAN FOR KERALA
2010-11 To 2012-13
FINANCE DEPARTMENT 2010
GOVERNMENT OF KERALA
MEDIUM TERM FISCAL POLICY & STRATEGY STATEMENT
WITH MEDIUM TERM FISCAL PLAN FOR KERALA
2010-11 To 2012-13
FINANCE DEPARTMENT 2010

STATEMENT OF COMPLIANCE
o This 2010-11 Medium Term Fiscal Policy and Strategy Statement
is placed before the Legislature in compliance with Section 3 of the
Kerala Fiscal Responsibility Act, 2003.
o Section 3 of the Act requires the Medium Term Fiscal Policy
Statement to include the following elements all of which have been
incorporated in the document:
1. A statement of recent economic trends and prospects for growth and
development.
2. An assessment of sustainability relating to the revenue deficit and
the use of capital receipts for generating productive assets.
3. An evaluation of the performance against targets for 2009-10 and
2010-11.
4. The medium term fiscal objectives of the Government.
5. Three year rolling targets for fiscal indicators with specification of
underlying assumptions.
6. The strategic priorities and key policies of the Government.
7. Policies of Government for the ensuing financial year relating to
taxation, expenditure, borrowings, other liabilities etc.

Foreword
The Kerala Fiscal Responsibility Act, 2003 stipulates that a medium term fiscal policy and strategy statement is to be prepared and submitted along with the Budget documents every year to the State Legislature. As per this statutory requirement, I present the medium term fiscal policy and strategy statement for Kerala for 2010‐11.
Last year, I was hoping for a just and fair recommendation from the 13th Finance Commission (FC) regarding revenue sharing and allocation of grants, so that the state could achieve the RD/GSDP target by 2010‐11. This has been belied by the award of the 13th FC. The horizontal share of the state out of the shareable portion of the Central Taxes has been fixed at 2.341% by the 13th FC as against 2.665 % in 12th FC period ending 31.3.2010. On a rough estimate, it is found that the loss on account of this would be about Rs.5000 Crore over a period of five years ending 31.03.2015. The conditionalities for the release of grants are severe and against the larger interest of common man. Hence the estimations in MTFP and targets will not be in synchronization with the estimates of last year.
The 13th FC has now devised a revised roadmap as per which the RD/GSDP has to be eliminated by 2014‐15 and FD/GSDP brought down to 3% by 2013‐14.
It is a matter of great satisfaction that the RD/GSDP in 2009‐10 (RE) would register at least a marginal decline. From the RD/GSDP ratio of 1.96% in 2008‐09, it would decline to 1.90%. As far as FD/GSDP is concerned, this would go down from 3.34 % in 2008‐09 to 3.12% in 2009‐10 (RE). Viewed against the revenue fall and stimulus spending in 2009‐10, this is not a mean achievement. Revenue Deficit and Fiscal Deficit are projected at 1.48 percent and 3.49 percent respectively for 2010‐11 (BE).
Amidst all the adversities, the quality of FD has been showing definite sign of improvement in 2010‐11(BE). The RD/FD ratio is projected at 42.48 percent against 60.94 percent in 2009‐10(RE).
The incremental borrowings and other liabilities (net) is projected at Rs.6747.Crore in 2009‐10(RE). This will go up to Rs.8311Crore in 2010‐11(BE). Borrowings at a larger scale within the FD/GSDP target of 3.5 percent is to fund capital expenditure which is projected to grow from Rs.1941.49 Crore in 2009‐10(RE) to 4145.38 Crore in 2010‐11(BE). The record growth in capital expenditure to 113.55 percent over 2009‐10(RE) will improve infrastructure facilities in the State which will bring a conducive atmosphere for faster economic development.
The liquidity management of the State has been consolidated further in the year 2009‐10. Overdraft has not been resorted to till date.
The setbacks to State Finances from exogenous factors will be met boldly through own resources and by mobilizing resources internally.
The challenges ahead in achieving fiscal consolidation in coming days will be numerous and I exhort all the stakeholders in lending me a helping hand towards attaining the objectives of this Medium Term Fiscal Policy and Strategy Statement.
4 March 2010 Dr. T M Thomas Isaac Minister for Finance
Medium Term Fiscal Policy and Strategy Statement with
Medium Term Fiscal Plan for Kerala
1. Overview
1.1 The compliance of having to present the Medium Term Fiscal Plan
(MTFP), as per the Kerala Fiscal Responsibility Act (KFA) 2003 in the
current year, is painfully set against the 13th Finance Commission (FC)
recommendations. The recommendations of the 13th FC are highly
disadvantageous to the state that it is posing severe constraints to the fiscal
consolidation efforts and MTFP targets set out last year. The single most
factor that has been preventing the state from achieving the fiscal goals of
balancing the revenue account and containing Fiscal Deficit (FD) is the
decline of the states’ share of central taxes by the recommendations of
successive Finance Commissions starting from 11th FC. The downward
trend in the share from 3.875 % in the 10th FC period to 2.341% in the 13th
FC period is cumulatively adding to the misery of the state with a
consistent periodicity. But for this distorted sharing pattern of the central
divisible pool, the state would have achieved fiscal consolidation targets
already.

2. Recent Macro Economic Trends at National Level
2.1 After declining to 6.7% in 2008-09, the GDP is expected to post a
growth rate of 7.2% in 2009-10, according to the advance estimates of CSO.
This turnaround has become possible because of the stimulus spending in
India and the world over. Except for agriculture, all other sectors of the
economy have been in a recovery mode. Even without a robust demand
from abroad, the manufacturing sector is posting good growth rate
suggesting to a revival in domestic demand. Yet, the employment growth
rate has not returned to the pre-crisis level. The savings rate in the
economy amidst the slowdown is encouraging and is contributing to the
health of the financial sector. The better liquidity condition even after the
absorption of about Rs.36,000 crore by the recent hike in CRR rates augurs
well. All these positive factors are conducive for a good investment climate
in the economy.
2.2 The positive developments do not imply that sustainable recovery
has returned in the Indian economy. For one, the recovery in the
developed countries is very weak. Secondly, due to the tax concessions
given out, particularly in direct taxes, the fiscal deficit remains high.
Thirdly, the inflationary pressure is continuing unabated. Especially

worrisome is the high level of food inflation, at one time peaking near 18
%. If this percolates to the manufacturing sector, as hinted by the recent
surge in WPI to around 8%, it will have adverse consequences for the
economy. The recent hike in petroleum prices may prove to be a conduit
for the food inflation to be a generalized inflation. A calibrated withdrawal
from stimulus is under the consideration of the GoI. The RBI already has
taken policy measures towards tightening the liquidity condition by
raising CRR and enhancing policy rates. This is likely to push the interest
rate up. The yield from the Government Securities market already has
gone up. The interest rate on SLR borrowing in the days ahead is expected
to be high.
3. State Economy
3.1 The state’s economy has gone through a period of turmoil, but has
been able to withstand its adverse impact. The GSDP estimates for the
State as per the recent quick estimate figures for 2008-09 over the final
figures of 2007-08 is projected at 14.55% in nominal terms. This
achievement amidst declining exports from the State, and a fall in prices of
agricultural produce, is commendable. Though the growth rate of real
GSDP has declined from 9.79% in 2007-08 to 6.98% in 2008-09, Kerala’s
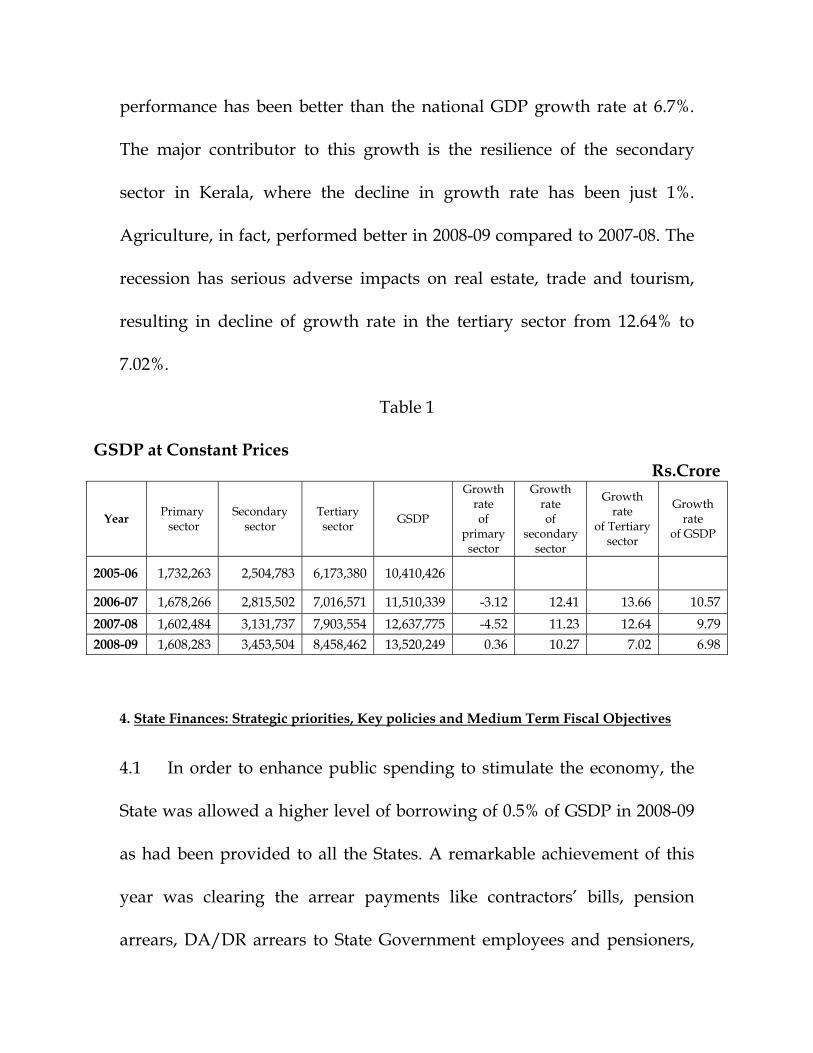
performance has been better than the national GDP growth rate at 6.7%.
The major contributor to this growth is the resilience of the secondary
sector in Kerala, where the decline in growth rate has been just 1%.
Agriculture, in fact, performed better in 2008-09 compared to 2007-08. The
recession has serious adverse impacts on real estate, trade and tourism,
resulting in decline of growth rate in the tertiary sector from 12.64% to
7.02%.
Table 1
GSDP at Constant Prices Rs.Crore
Year Primary sector
Secondary sector
Tertiary sector GSDP
Growth rate of
primary sector
Growth rate of
secondary sector
Growth rate
of Tertiary sector
Growth rate
of GSDP
2005-06 1,732,263 2,504,783 6,173,380 10,410,426
2006-07 1,678,266 2,815,502 7,016,571 11,510,339 -3.12 12.41 13.66 10.57 2007-08 1,602,484 3,131,737 7,903,554 12,637,775 -4.52 11.23 12.64 9.79 2008-09 1,608,283 3,453,504 8,458,462 13,520,249 0.36 10.27 7.02 6.98
4. State Finances: Strategic priorities, Key policies and Medium Term Fiscal Objectives
4.1 In order to enhance public spending to stimulate the economy, the
State was allowed a higher level of borrowing of 0.5% of GSDP in 2008-09
as had been provided to all the States. A remarkable achievement of this
year was clearing the arrear payments like contractors’ bills, pension
arrears, DA/DR arrears to State Government employees and pensioners,

and a major step up in food subsidy and welfare pensions. As a result, the
revenue expenditure for the year increased and consequently, the
Table 2 State Finances
(Rs. in Crore)
Items 2007-08 Accounts
2008-09 Accounts
2009-10 B.E
2009-10 R.E
2010-11 B.E.
1 2 3 4 5 6 A. Revenue Receipts 21106.79 24512.18 28153.90 26526.49 31180.82
1. State Tax Revenue 13668.95 15990.18 18228.28 17403.48 20884.23
2. State Non-Tax Revenue 1209.55 1559.29 1459.58 1780.32 2314.31
3. Central Govt. Transfers 6228.29 6962.71 8466.04 7342.69 7982.28
i). Share of Central Taxes 4051.70 4275.52 5417.12 4387.05 4825.76
ii). Grant-in- Aid 2176.59 2687.19 3048.92 2955.64 3156.52
B. Capital Receipts 6154.48 6231.67 5672.30 6573.31 8201.90
1. Recoveries of Loans 44.85 35.64 72.91 78.06 56.24
2. Other Receipts 7.53 9.11 1.00 5.16 9.50
3. Borrowings and Other Liabilities 6102.10 6186.92 5598.39 6490.09 8136.16
a. Public Debt (Net) 4210.87 5271.05 5484.70 5961.14 7723.21
b. Public Account (Net) 1891.23 915.87 113.70 528.95 412.95
C.Total Receipts ((A+B) 27261.27 30743.85 33826.19 33099.81 39382.73
D. Non Plan Expenditure 22710.51 25441.27 27391.56 27194.19 31726.63
1. On Revenue Account 22614.35 25012.00 26959.08 26679.25 29376.97
a. of which Interest Payments 4329.65 4659.69 5311.66 5201.56 5786.48
2. On Capital Account 22.87 24.84 382.32 379.33 2250.00
3.On Loan Disbursements 73.29 404.44 50.16 135.60 99.67
E.Plan Expenditure (including CSS) 4548.87 5461.87 6516.77 6113.27 8063.21
1. On Revenue Account 2277.29 3211.86 4202.77 3928.87 5433.41
2. On Capital Account 1451.71 1670.76 1327.83 1561.86 1895.38
3. On Loan Disbursements 819.87 579.25 986.17 622.54 734.42
F.Total Expenditure ((D+E) 27259.37 30903.14 33908.33 33307.45 39789.84
1. Revenue Expenditure 24891.63 28223.85 31161.85 30608.12 34810.37
2. Capital Expenditure 1474.58 1695.60 1710.15 1941.19 4145.38
3. on Loan Disbursements 893.16 983.69 1036.33 758.14 834.09

G. Revenue surplus/deficit (A-F(1)) -3784.84 -3711.67 -3007.95 -4081.63 -3629.55
H. Fiscal Deficit (A+B(1)+B(2))-F -6100.20 -6346.21 -5680.52 -6697.74 -8543.28
I. Primary Deficit (H)-D(1a) -1770.55 -1686.52 -368.86 -1496.18 -2756.80
RD/GSDP and FD/GSDP respectively were 1.96 % and 3.34 %. As is in the
case of Centre, the target years for the elimination of Revenue Deficit and
containment of Fiscal Deficit to 3% of GSDP was not adhered to in the
State also, because of the unexpected occurrence of global meltdown.
4.2. There was also a sharp decline in the Central Transfers. As against
the budget estimate of Rs.4711 crore under Share of Central Taxes, the
State received only a sum of Rs.4276 crore . The fall to the extent of Rs.435
crore had to be covered from the additional borrowing ceiling of Rs.850
crore allowed to the State for stimulus spending. In effect, the State was
left with Rs.415 crore only from the additional borrowings to meet
stimulus spending.
4.3 During 2009-10, the Centre decided that the State would be allowed
a borrowing ceiling of 4% of GSDP as against the FRL target of 3%. This
1% increase in borrowing is only Rs.1775 Crore. There have been major
reductions in the State’s revenues, from two sources. The first is the stamp
duty receipts of the State, which has been adversely affected by the
collapse of the real estate sector. The receipts from Stamps and
Registration, from the very first month of the fiscal year, have been
registering negative growth compared to the corresponding period of the
previous year. The latest projection is giving us a hint that the revenue
from this stream of tax is likely to be less by Rs.1100 crore compared to the
budget estimate. The second one is from share of central taxes. The share
of central taxes worked out by the Centre, in the Union Budget 2009-10
was much less than what had been projected by the State and on this
account the reduction in revenue would be around Rs.860 Crore.
4.4 Thus, the additional borrowing allowed is not even sufficient to
meet the fall in resources anticipated from Share of Central Taxes and
Stamps and Registration. It has not deterred the State government from
taking bold actions in drawing up a Rs.5000 Crore stimulus package,
focusing on Irrigation, Roads, Bridges and Buildings. Administrative
sanctions were issued for all the works in record time. Therefore, we have
requested the Ministry of Finance, Government of India to allow the
borrowing ceiling to be at the committed level of 4% of GSDP reckoning
CSO figures. Majority of this payment may occur in 2010-11. This has
adequately been factored in the Budget Estimates.
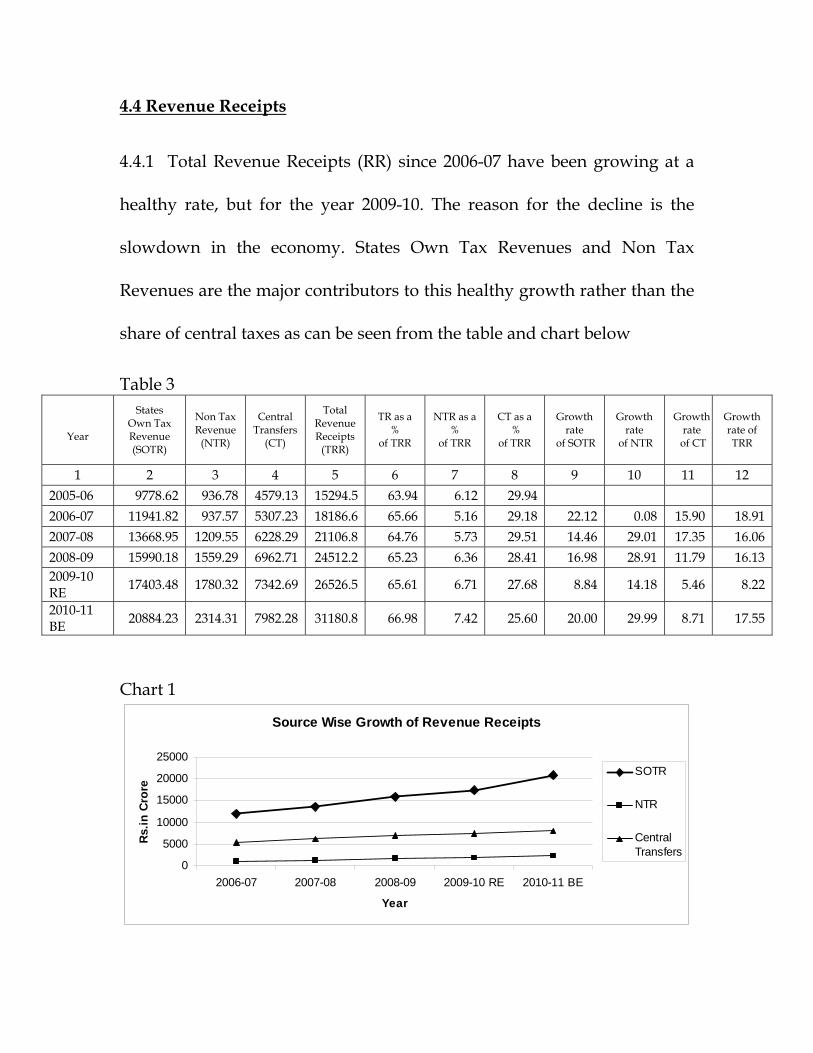
4.4 Revenue Receipts
4.4.1 Total Revenue Receipts (RR) since 2006-07 have been growing at a
healthy rate, but for the year 2009-10. The reason for the decline is the
slowdown in the economy. States Own Tax Revenues and Non Tax
Revenues are the major contributors to this healthy growth rather than the
share of central taxes as can be seen from the table and chart below
Table 3
Year
States Own Tax Revenue (SOTR)
Non Tax Revenue
(NTR)
Central Transfers
(CT)
Total Revenue Receipts
(TRR)
TR as a %
of TRR
NTR as a %
of TRR
CT as a %
of TRR
Growth rate
of SOTR
Growth rate
of NTR
Growth rate
of CT
Growth rate of TRR
1 2 3 4 5 6 7 8 9 10 11 12 2005-06 9778.62 936.78 4579.13 15294.5 63.94 6.12 29.94 2006-07 11941.82 937.57 5307.23 18186.6 65.66 5.16 29.18 22.12 0.08 15.90 18.91 2007-08 13668.95 1209.55 6228.29 21106.8 64.76 5.73 29.51 14.46 29.01 17.35 16.06 2008-09 15990.18 1559.29 6962.71 24512.2 65.23 6.36 28.41 16.98 28.91 11.79 16.13 2009-10 RE 17403.48 1780.32 7342.69 26526.5 65.61 6.71 27.68 8.84 14.18 5.46 8.22
2010-11 BE 20884.23 2314.31 7982.28 31180.8 66.98 7.42 25.60 20.00 29.99 8.71 17.55
Chart 1
Source Wise Growth of Revenue Receipts
0
5000
10000
15000
20000
25000
2006-07 2007-08 2008-09 2009-10 RE 2010-11 BE
Year
Rs.
in C
rore
SOTR
NTR
CentralTransfers
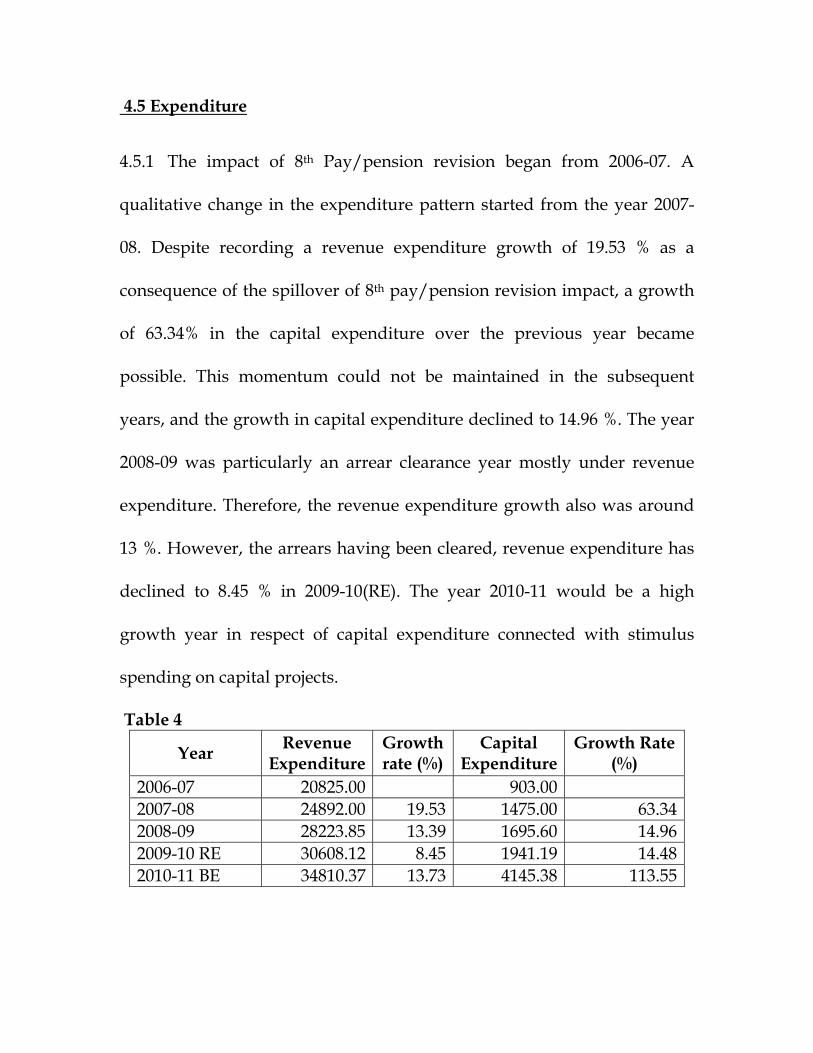
4.5 Expenditure
4.5.1 The impact of 8th Pay/pension revision began from 2006-07. A
qualitative change in the expenditure pattern started from the year 2007-
08. Despite recording a revenue expenditure growth of 19.53 % as a
consequence of the spillover of 8th pay/pension revision impact, a growth
of 63.34% in the capital expenditure over the previous year became
possible. This momentum could not be maintained in the subsequent
years, and the growth in capital expenditure declined to 14.96 %. The year
2008-09 was particularly an arrear clearance year mostly under revenue
expenditure. Therefore, the revenue expenditure growth also was around
13 %. However, the arrears having been cleared, revenue expenditure has
declined to 8.45 % in 2009-10(RE). The year 2010-11 would be a high
growth year in respect of capital expenditure connected with stimulus
spending on capital projects.
Table 4
Year Revenue Expenditure
Growth rate (%)
Capital Expenditure
Growth Rate (%)
2006-07 20825.00 903.00 2007-08 24892.00 19.53 1475.00 63.34 2008-09 28223.85 13.39 1695.60 14.96 2009-10 RE 30608.12 8.45 1941.19 14.48 2010-11 BE 34810.37 13.73 4145.38 113.55

5. Fiscal Sustainability Analysis
5.1 The debt sustainability indicators show some positive movements in
the recent period (Table 5). The Revenue Deficit (RD) and Fiscal Deficit
(FD) as a percentage of GSDP show a declining trend since 2006-07 except
2007-08, the year in which the full impact of 8th Pay Revision was
absorbed. The RD/GSDP in 2010-11(BE) has considerably declined to
1.48% from the 2009-10 (RE) level of 1.90 %.In 2009-10 the FD/GSDP is
estimated to be 3.12 % showing that borrowal allowed to the state is far
less than 4% of the GSDP allowed by Government of India to meet
stimulus spending. This is because of two reasons: (a) non-fungibility of
project-tied loans whose money could not be efficiently utilized and (b) the
Central Government’s insistence on using the GSDP data used by the 12th
FC rather than using the CSO figures.
5.2. The debt as a percentage of GSDP also is declining from 35.51% in
2006-07 to 32.02 % in 2010-11 BE. Interest payments as a percentage of
Total Revenue Receipts (TRR) has been steadily declining and to a low of
18.56% in 2010-11(BE) even though it is still above the benchmark level of
15% fixed by 12th FC. But debt as a percentage of TRR is consistently under
the benchmark of 300% throughout 2006-2011.
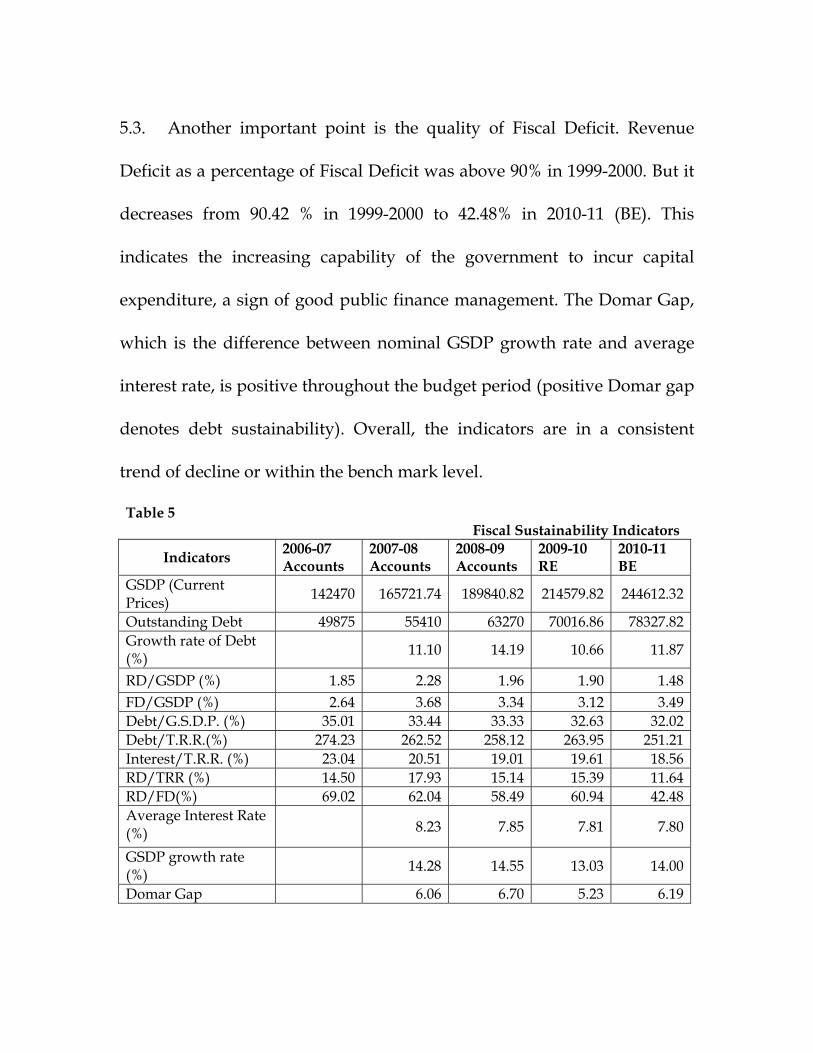
5.3. Another important point is the quality of Fiscal Deficit. Revenue
Deficit as a percentage of Fiscal Deficit was above 90% in 1999-2000. But it
decreases from 90.42 % in 1999-2000 to 42.48% in 2010-11 (BE). This
indicates the increasing capability of the government to incur capital
expenditure, a sign of good public finance management. The Domar Gap,
which is the difference between nominal GSDP growth rate and average
interest rate, is positive throughout the budget period (positive Domar gap
denotes debt sustainability). Overall, the indicators are in a consistent
trend of decline or within the bench mark level.
Table 5 Fiscal Sustainability Indicators
Indicators 2006-07 Accounts
2007-08 Accounts
2008-09 Accounts
2009-10 RE
2010-11 BE
GSDP (Current Prices) 142470 165721.74 189840.82 214579.82 244612.32
Outstanding Debt 49875 55410 63270 70016.86 78327.82 Growth rate of Debt (%) 11.10 14.19 10.66 11.87
RD/GSDP (%) 1.85 2.28 1.96 1.90 1.48 FD/GSDP (%) 2.64 3.68 3.34 3.12 3.49 Debt/G.S.D.P. (%) 35.01 33.44 33.33 32.63 32.02 Debt/T.R.R.(%) 274.23 262.52 258.12 263.95 251.21 Interest/T.R.R. (%) 23.04 20.51 19.01 19.61 18.56 RD/TRR (%) 14.50 17.93 15.14 15.39 11.64 RD/FD(%) 69.02 62.04 58.49 60.94 42.48 Average Interest Rate (%)
8.23 7.85 7.81 7.80
GSDP growth rate (%) 14.28 14.55 13.03 14.00
Domar Gap 6.06 6.70 5.23 6.19
5.4 Contingent liabilities
5.4.1 The contingent liabilities of the state had stood at Rs.12316 crore as
on 31.3.2005 against the statutory guarantee limit of Rs.14000 crore. Since
then this is steadily declining and has been brought down to Rs.7992 crore
by the end of 31.03.09. This is likely to come down to Rs.7193 crore by the
end of March 2010. In the eventuality of any guarantees to be issued by the
Government in 2010-11, it is comfortable that the statutory limit is far off
from the outstanding guarantees.
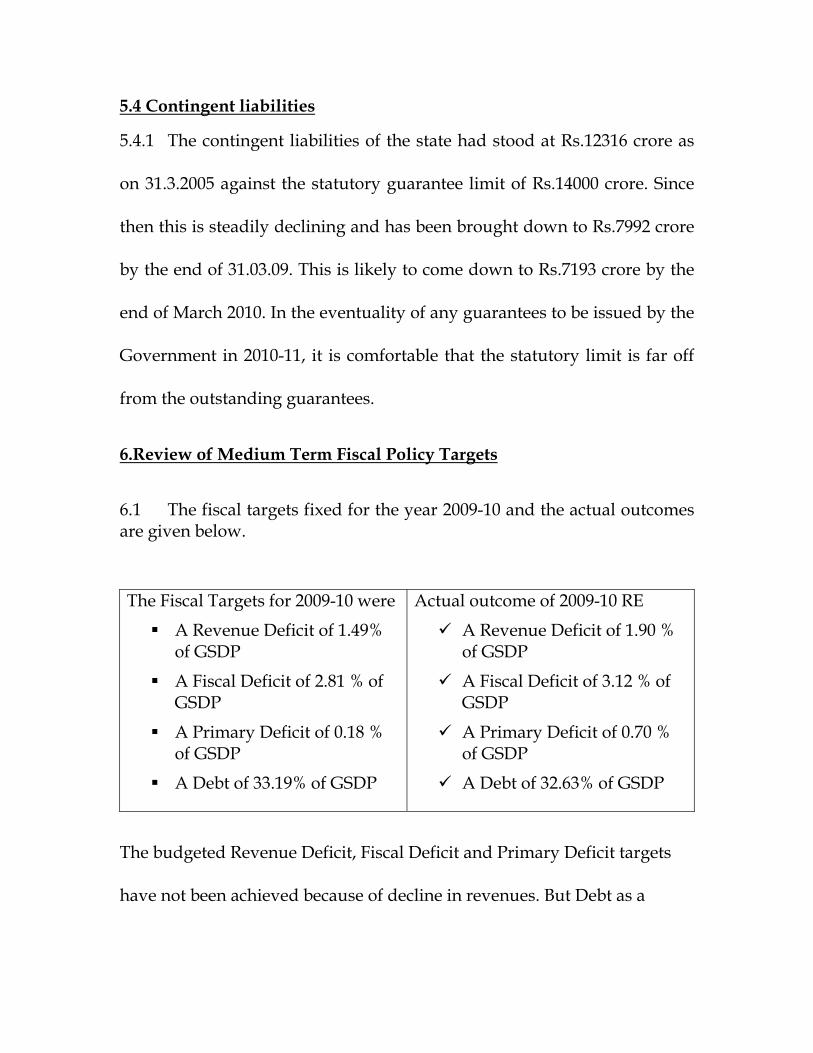
6.Review of Medium Term Fiscal Policy Targets
6.1 The fiscal targets fixed for the year 2009-10 and the actual outcomes are given below.
The Fiscal Targets for 2009-10 were
A Revenue Deficit of 1.49% of GSDP
A Fiscal Deficit of 2.81 % of GSDP
A Primary Deficit of 0.18 % of GSDP
A Debt of 33.19% of GSDP
Actual outcome of 2009-10 RE
A Revenue Deficit of 1.90 % of GSDP
A Fiscal Deficit of 3.12 % of GSDP
A Primary Deficit of 0.70 % of GSDP
A Debt of 32.63% of GSDP
The budgeted Revenue Deficit, Fiscal Deficit and Primary Deficit targets
have not been achieved because of decline in revenues. But Debt as a

percentage of GSDP decreases from 33.19 to 32.63 on lesser borrowings
than anticipated.
7. Fiscal Consolidation-A Road Map
7.1 During the 12th Finance Commission period, the debt consolidation
and Relief Facility was limited to those states which enacted Fiscal
Responsibility Legislation. Midway through, the Centre found that the
targets set under the FRA 2003 were unachievable in the face of global
financial crisis and they took deviation from the targets from the year
2007-08. Hence the states also were allowed to deviate from the targets.
The infirmities inherent in the FRL have thus been exposed.
7.2 Revised Road Map
7.2.1 A new path for fiscal consolidation under the name, ‘Revised
Roadmap for Fiscal Consolidation’ has been recommended by the 13th FC.
Here, the release of all grants and debt relief facilities have been linked to
the amending of the FRL on line with the revised targets fixed for the
⇒ RD/GSDP to be eliminated in 2010-15
⇒ FD/GSDP to be contained to 3 % by 2014-15
⇒ Debt/GSDP to be phased down to 29.8% by 2010-15
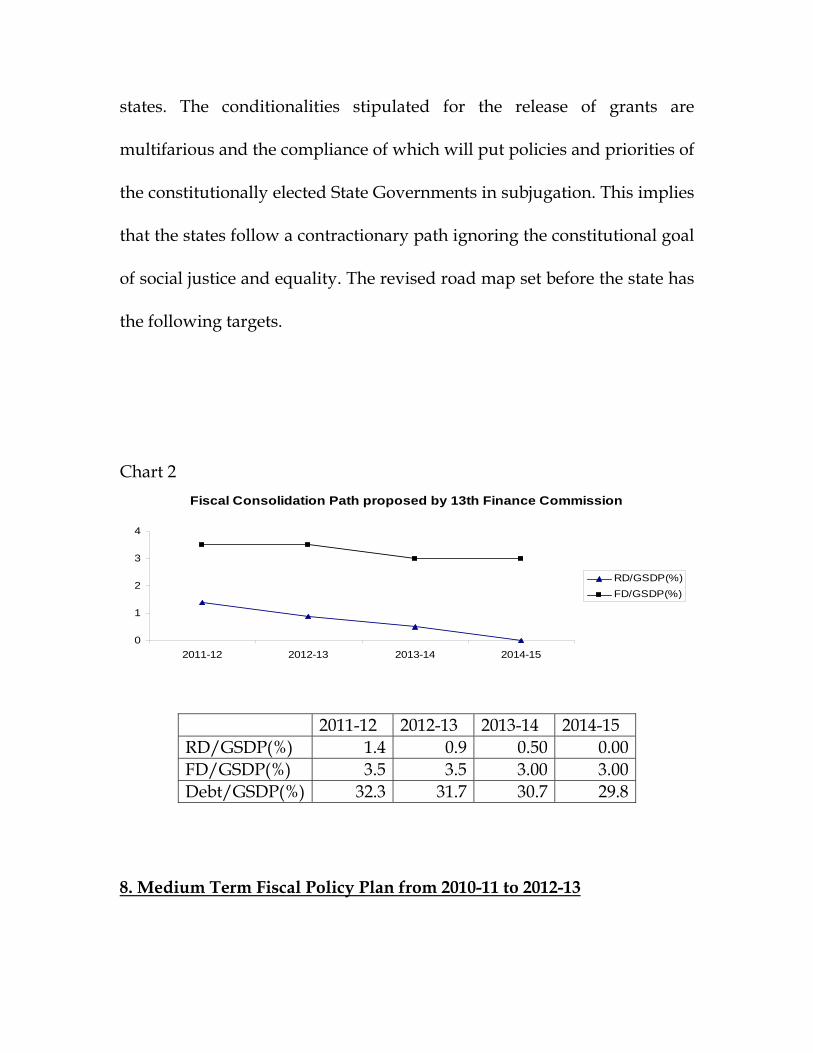
states. The conditionalities stipulated for the release of grants are
multifarious and the compliance of which will put policies and priorities of
the constitutionally elected State Governments in subjugation. This implies
that the states follow a contractionary path ignoring the constitutional goal
of social justice and equality. The revised road map set before the state has
the following targets.
Chart 2
Fiscal Consolidation Path proposed by 13th Finance Commission
0
1
2
3
4
2011-12 2012-13 2013-14 2014-15
RD/GSDP(%)FD/GSDP(%)
8. Medium Term Fiscal Policy Plan from 2010-11 to 2012-13
2011-12 2012-13 2013-14 2014-15 RD/GSDP(%) 1.4 0.9 0.50 0.00 FD/GSDP(%) 3.5 3.5 3.00 3.00 Debt/GSDP(%) 32.3 31.7 30.7 29.8

8.1 The government envisages a revenue-led fiscal consolidation.
Robust growth in the States Own Tax Revenues is essential to achieve the
XI th plan target of Rs.40422 crore and to go beyond so as to make growth
broad based and inclusive. Revenue sources hitherto untapped are being
exploited. Ensuring preparedness to GST implementation is so essential so
that the gains are reaped in the first year of implementation itself.
Unimportant and wasteful expenditure have to be eliminated. For resource
allocation to be effective and productive, faster implementation mode need
to be identified.
8.2 An optimistic anticipation of fair fiscal allocation by the 13th FC
prevailed at the time of presentation of MTFP for 2009-10 to 2011-12. But
the recommendations by the 13th FC have dashed this hope and hence the
MTFP this time will not be in synchronization with the last one. But the
policy framework is not changing to the detriment of common man. The
Government’s Fiscal Policy goals are summarized below.
To augment maximum revenue collection by proper taxation policies.
To enhance Non Tax Revenue through adequate measures. To streamline expenditure to the desired channels to attain inclusive growth and progress, such as subsidized ration of food, higher welfare pensions and other social security measures, health insurance and income support schemes.
Enhanced assistance for the vulnerable sections of society and SC/STs.
To ensure greater gender equality. Environmental and Energy conservation and addressing concerns in climate change and preservation of biodiversity.
Strengthening the public utilities and other public sector units. To undertake mega infrastructure projects and to complete infrastructure projects taken up under stimulus package in a time bound manner.
To promote small and medium enterprises. To tackle the adverse fallout of the Indo-ASEAN trade agreement.
8.3 A number of measures in the Taxes Department have been
undertaken already to strengthen the department and empower it for
better tax administration compliance and to establish a cordial relationship
with traders.
8.4 Measures to strengthen the taxation policy in the direction of
creating preparedness in the taxes department to meet the initial
challenges for entering into the GST regime have also been undertaken.
This readiness will result in reaping immediate benefit under GST regime
once it is implemented. Problems in desilting old dams will be sorted out
to augment revenues through extraction of sand. Necessary amendment to
enactment and rules will be put in place to enhance lease rent rates and fee
for regularization of revenue records related to reclaimed land before 2008.
8.5 The expenditure policy seeks to control expenditure on non priority
items. The Social infrastructure built up over the years will be made
sustainable. Social sector infrastructure need to be manned adequately to
make it functional and ensure proper service to the people especially poor
and marginalized. Fiscal consolidation will not stand in the way of
providing services under social sector. Hospitals and dispensaries cannot
function without doctors and paramedical staff, schools and educational
institutions cannot run without teachers. In the name of fiscal
consolidation social sector spending will not be curtailed.
9. Three Year Rolling Targets and underlying assumptions
9.1 The GSDP figure for these years are taken as projected by the 13th
FC. Unlike during the time of 12th FC, when the MoF largely stuck to the
figures projected by the then FC, the 13th FC has recommended to the
review of base each year on provisional estimates and average estimates
taken from the figures of CSO. This exercise can be built into the MTFP
from the next year.
9.2 Revenue Mobilization
9.2.1 The growth rates of States’ own tax revenue for the year 2011-12 and
2012-13 are taken at 20% and 15% respectively on the assumption that GST

dispensation would be better for the state. Similarly the growth rate under
stamps and registration which has declined in 2008-09 and entered in to
the negative territory in 2009-10 would stabilize in 2010-11 and after that
robust growth would be witnessed on full scale recovery of the economy.
Other tax revenues also will show corresponding buoyancy in tandem
with the growth of the economy. After achieving a high growth rate in
2011-12 it is not anticipated that the same growth rate would recur. But a
15% growth in 2012-13 may safely be assumed.
9.5.2 Non Tax Revenue in 2010-11 is expected to show an abnormal
growth in the wake of sale of sand extracted through desilting of the dams
in Kerala and revision of lease rent. However, from the year 2011-12, it is
expected to grow at 5% on a high base in 2010-11.
9.5.3 In respect of Central Transfers, the plan transfers are expected to
grow at 10 %. The 13th FC transfers are taken at the projected level by the
Commission. The tax devolution arrangement would, however, depend on
the extent of buoyancy in the Central Tax revenues. This again is
dependent on the sustained global recovery from the recent recession.
Releases of FC grant to states are straight-jacketed by imposing several

conditionalities not hitherto imposed by any previous Commissions.
Grants are taken at the level projected by the 13th FC.
9.6 Expenditure Patterns
9.6.1 On the expenditure side, the recommendation of the 9th Pay
Commission will have a major impact. This has been built into the
projection for 2011-12 both in respect of salaries and pensions. In 2012-13
the one time arrears payable in this respect would not recur and growth in
expenditure is likely to normalize. From 2011-12 the state will have to
implement the recommendations of the 4th SFC. Naturally the devolution
on account of this would be at higher levels for which a projection of 15%
has been applied both in the year 2011-12 and 2012-13 tentatively. Interest
is worked out on the debt stock taking effective interest rate at 7.80%
considering the trend in the past. Maintenance expenditure is projected
taking into account the 13th FC grants. Administrative and other
expenditure are projected at 10% considering the long term trend. High
revenue expenditure due to pay/pension revision will constrain the state
to allocate a higher share for capital expenditure in 2011-12. But there will
be a quantum jump in capital expenditure in 2012-13 because of the decline

in revenue expenditure and the possibility of containment of Revenue
Deficit to the targeted level of GSDP at 0.90%.
9.7 Outcomes
Indicators 2011-12 2012-13 RD/GSDP 2.17 0.88 FD/GSDP 3.50 3.50 Debt Stock/GSDP 32.30 31.70
9.7.1 In a deviation from the revised roadmap, RD/GSDP in 2011-12 is
2.17% against the RD/GSDP fixed by 13th FC at 1.40%. This has been
necessitated by reckoning Pay/Pension revision arrears into the
estimations. The 13th FC recommendation is that arrears will not be
payable and monetary benefits have to be allowed only from the date of
order.
Annexure I
MEDIUM TERM FISCAL PLAN (Rs in crore)
Sl No. Item 2007‐08 2008‐09 2009‐10 2010‐11 2011‐12 2012‐13
Accounts Accounts RE BE Forward Estimates
1 Revenue Receipts 21107 24512.18 26526.49 31180.82 37106.97 42470.17
1(a) State's own tax revenue 13669 15990.18 17403.48 20884.23 25061.08 28820.24
1(b) Non Tax Revenue 1210 1559.29 1780.32 2314.31 2430.03 2551.53
1(c ) Resources from Centre 6228 6962.71 7342.69 7982.28 9615.87 11098.41
2 Revenue Expenditure 24892 28223.85 30608.12 34810.37 43035.10 45212.28
2(a) Non ‐Interest Revenue Expenditure 20562 23564.16 25406.56 29023.89 36544.67 37918.36
2(b) Interest 4330 4659.69 5201.56 5786.48 6490.43 7293.92
2(c ) Salaries 7693.66 9063.81 10145.65 11332.37 14012.89 13995.37
2(d) Pensions 4925 4686.43 4628.3 5426.84 8111.32 7954.47
2(e) Non SPI Revenue Expenditure 7943.34 9813.92 10632.61 12264.68 14420.46 15968.52
2(e)(i) Subsidies (food, Housing,Transport and Industry)
219 328.6 488.74 248.90 286.24 314.86
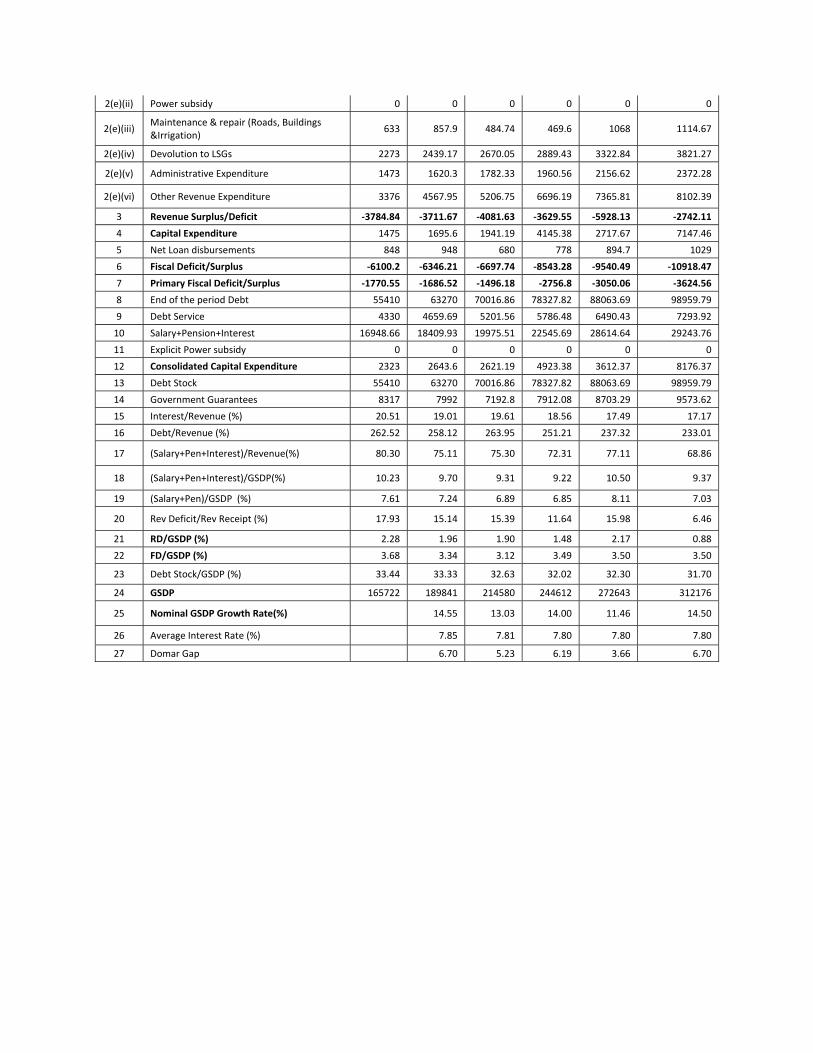
2(e)(ii) Power subsidy 0 0 0 0 0 0
2(e)(iii) Maintenance & repair (Roads, Buildings &Irrigation)
633 857.9 484.74 469.6 1068 1114.67
2(e)(iv) Devolution to LSGs 2273 2439.17 2670.05 2889.43 3322.84 3821.27
2(e)(v) Administrative Expenditure 1473 1620.3 1782.33 1960.56 2156.62 2372.28
2(e)(vi) Other Revenue Expenditure 3376 4567.95 5206.75 6696.19 7365.81 8102.39
3 Revenue Surplus/Deficit ‐3784.84 ‐3711.67 ‐4081.63 ‐3629.55 ‐5928.13 ‐2742.11
4 Capital Expenditure 1475 1695.6 1941.19 4145.38 2717.67 7147.46
5 Net Loan disbursements 848 948 680 778 894.7 1029
6 Fiscal Deficit/Surplus ‐6100.2 ‐6346.21 ‐6697.74 ‐8543.28 ‐9540.49 ‐10918.47
7 Primary Fiscal Deficit/Surplus ‐1770.55 ‐1686.52 ‐1496.18 ‐2756.8 ‐3050.06 ‐3624.56
8 End of the period Debt 55410 63270 70016.86 78327.82 88063.69 98959.79
9 Debt Service 4330 4659.69 5201.56 5786.48 6490.43 7293.92
10 Salary+Pension+Interest 16948.66 18409.93 19975.51 22545.69 28614.64 29243.76
11 Explicit Power subsidy 0 0 0 0 0 0
12 Consolidated Capital Expenditure 2323 2643.6 2621.19 4923.38 3612.37 8176.37
13 Debt Stock 55410 63270 70016.86 78327.82 88063.69 98959.79
14 Government Guarantees 8317 7992 7192.8 7912.08 8703.29 9573.62
15 Interest/Revenue (%) 20.51 19.01 19.61 18.56 17.49 17.17
16 Debt/Revenue (%) 262.52 258.12 263.95 251.21 237.32 233.01
17 (Salary+Pen+Interest)/Revenue(%) 80.30 75.11 75.30 72.31 77.11 68.86
18 (Salary+Pen+Interest)/GSDP(%) 10.23 9.70 9.31 9.22 10.50 9.37
19 (Salary+Pen)/GSDP (%) 7.61 7.24 6.89 6.85 8.11 7.03
20 Rev Deficit/Rev Receipt (%) 17.93 15.14 15.39 11.64 15.98 6.46
21 RD/GSDP (%) 2.28 1.96 1.90 1.48 2.17 0.88
22 FD/GSDP (%) 3.68 3.34 3.12 3.49 3.50 3.50
23 Debt Stock/GSDP (%) 33.44 33.33 32.63 32.02 32.30 31.70
24 GSDP 165722 189841 214580 244612 272643 312176
25 Nominal GSDP Growth Rate(%) 14.55 13.03 14.00 11.46 14.50
26 Average Interest Rate (%) 7.85 7.81 7.80 7.80 7.80
27 Domar Gap 6.70 5.23 6.19 3.66 6.70