Embed Size (px)
Citation preview


MMeedd ii tt ee rr rr aa nn ee aa nn MMeemmoo rr aa nn dd uumm oo ff
UU nn dd ee rr ss tt aa nn dd ii nn gg oo nn PP oo rr tt SS tt aa tt ee CC oo nn tt rr oo ll
AAnnnnuuaall RReeppoorrtt 22001111
(( PPuubb ll ii sshheedd 22001122))

Med MoU – Annual Report – Year 2011
Mediterranean MoU Secretariat
22
FOREWORD
We are pleased to present the seventh issue of the Annual Report on Port State Control in the Mediterranean region which is published under the auspices of the Port State Control Committee of the Mediterranean MoU. 2011 was an active year for port State control in the Mediterranean region. The 10 members of the agreement have carried out 6,225 inspections. The number of detentions decreased from 527 in 2010 to 412 in 2011. In these 15 years the Mediterranean Memorandum has gained an impressive experience in fighting sub-standard shipping. I would like to thank all the members of the MoU Advisory Board (MAB) who serve the Med MoU throughout this year and all of the Member States for their support during the year and I would especially like to thank all of the Med MoU Port State Control Officers and the Administrators for their excellent work throughout the year. In 2011 the port State control officers of our member Authorities continued their work to promote quality shipping and to reward responsible ship owners and operators. Though the detention rate has declined during 2011, the number of detentions is still high. Some ships are repeatedly detained but have made little or no effort for improvement.
Chairman Secretariat Port State Control Committee Med MoU Secretary
Med MoU – Annual Report – Year 2011
Mediterranean MoU Secretariat
33
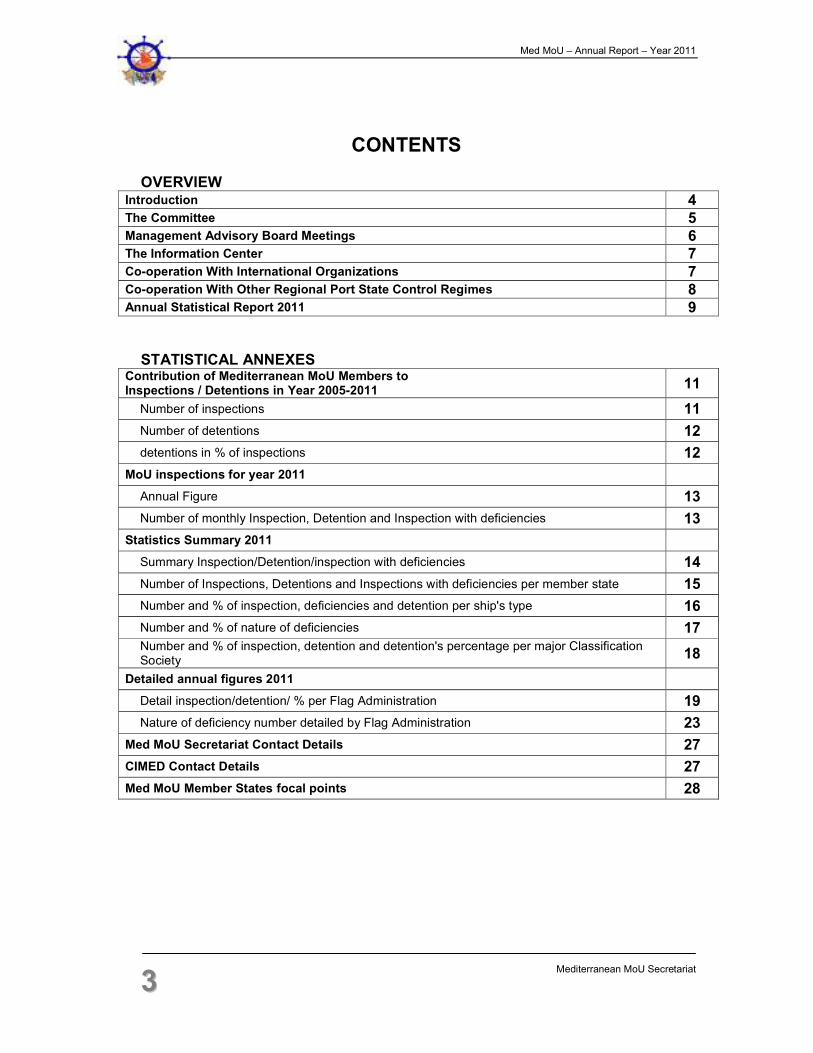
CONTENTS
OVERVIEW Introduction 4 The Committee 5 Management Advisory Board Meetings 6 The Information Center 7 Co-operation With International Organizations 7 Co-operation With Other Regional Port State Control Regimes 8 Annual Statistical Report 2011 9
STATISTICAL ANNEXES
Contribution of Mediterranean MoU Members to Inspections / Detentions in Year 2005-2011
11
Number of inspections 11
Number of detentions 12
detentions in % of inspections 12
MoU inspections for year 2011
Annual Figure 13
Number of monthly Inspection, Detention and Inspection with deficiencies 13
Statistics Summary 2011
Summary Inspection/Detention/inspection with deficiencies 14
Number of Inspections, Detentions and Inspections with deficiencies per member state 15
Number and % of inspection, deficiencies and detention per ship's type 16
Number and % of nature of deficiencies 17 Number and % of inspection, detention and detention's percentage per major Classification Society
18
Detailed annual figures 2011
Detail inspection/detention/ % per Flag Administration 19
Nature of deficiency number detailed by Flag Administration 23
Med MoU Secretariat Contact Details 27
CIMED Contact Details 27
Med MoU Member States focal points 28

Med MoU – Annual Report – Year 2011
Mediterranean MoU Secretariat
44
OVERVIEW Introduction:
This Annual Report is published under the auspices of the Med MoU committee on
PSC. This annual report is the seventh issue and covers port State control activities and
developments in the year 2011.
In accordance with the provisions of the Memorandum, the Authorities which have
signed and formally accepted the Memorandum or which have been accepted with
unanimous consent of the port State control committee would become full members.
Currently; the Memorandum has 10 full members namely: Algeria, Cyprus, Egypt,
Israel, Jordan, Lebanon, Malta, Morocco, Tunisia and Turkey.
The Port State Control Committee established for Monitoring and controls the
implementation and on-going operation of the Memorandum.
The Committee consists of representatives of the member Authorities and also
observers from the maritime Authorities and the inter-governmental organizations
which have been granted observer status by the committee, namely: International
Maritime Organization (IMO), International Labour Organization (ILO), European
Commission (EC), Paris MoU and the Black Sea MoU. The Secretariat of the
Memorandum is located in Alexandria, Egypt and its Information Centre in Casablanca,
Morocco.
For the purpose of the Memorandum, the following instruments are the basis for
Port State Control activities in the region:
* The International Convention on Load Lines, 1966;
* The International Convention for the Safety of Life at Sea, 1974 (SOLAS 74);
* The Protocol of 1978 relating to the International Convention for the Safety of
Life at Sea, 1974;
* The International Convention for the Prevention of Pollution from Ships, 1973,
as modified by the Protocol of 1978 relating thereto (MARPOL 73/78);
* The International Convention on Standards of Training, Certification and
Watch keeping for Seafarers, 1978 (STCW 78, as amended;
* The Convention on the International Regulations for Preventing Collisions at
Sea, 1972;
* The Merchant Shipping (Minimum Standards) Convention, 1976 (ILO
Convention No. 147);

Med MoU – Annual Report – Year 2011
Mediterranean MoU Secretariat
55
THE COMMITTEE
The Thirteenth Committee Meeting was held in Limassol, Cyprus on October 3-5,
2011. The meeting was hosted by Maritime Authority of Cyprus. The meeting was
attended by the representatives of the member Authorities of Cyprus, Egypt, Israel,
Jordan, Malta, Morocco and Tunisia and observers from Paris MoU, Black Sea MoU
the U.S. Coast Guard and REMPEC.
The Med MoU 13th Committee meeting 3
rd – 5
th October 2011
Important outcomes of this meeting:
• The Committee decided to participate in the CIC of the Paris MoU on
September 2012, “Fire Safety System Code”.
• The Committee encouraged the possibility of participation of the Med MoU
Secretariat in the Paris MoU Task Forces of developing CIC.
• The Committee approved the updated version of the Memorandum of
Understanding on Port State Control in the Mediterranean Region “Revision
2012”.

Med MoU – Annual Report – Year 2011
Mediterranean MoU Secretariat
66
• The Committee decided to set up a correspondence group to work on
developing a procedure to calculate the number of individual ships
• The Committee discussed the proposals for training and instructed Med
MoU Secretariat to communicate with all member states to provide a
schema for implementing training and instructed MAB to work on those
schemas to produce a harmonized proposal.
In the 13th
Committee meeting of the Med MoU on PSC, and after serving 3 terms as
Chairman of the Port State Control Committee, Mr. Lino Vassallo will hand over the
Chairmanship to Capt. Mark Chapelle for a term of three years
Mr. Lino Vassallo, who was employed by the Maritime Authority of Malta as General
Registrar of Shipping and Seamen Merchant Shipping Directorate was the driving force of
many new initiatives in the Memorandum. He greatly encouraged stricter targeting criteria,
transparency, quality of information, training of Port State Control Officers and an open
dialogue with the industry. He was also the driving force behind the establishing of
Management Advisory Board.
MANAGEMENT ADVISORY BOARD MEETINGS
The Management Advisory Board for the Mediterranean Memorandum of
Understanding on Port State Control advises the Port State Control Committee on
matters of a technical, political and strategic nature, and provides direction to the task
forces and Secretariat between meetings of the Committee.
The board meets three times in year 2011. It was composed of participants from Cyprus,
Jordan, Morocco, Turkey, Chairman, the Med MoU Secretariat, and CIMED.
• The Fourth meeting of the Management Advisory Board for the Mediterranean
Memorandum of Understanding on Port State Control took place in Marrakesh –
Morocco from 27th – 28
th March 2011.
• The Fifth meeting took place in Alexandria – Egypt from 27th – 28
th July 2011.
• The Sixth meeting took place in Limassol - Cyprus on 2nd of October 2011 one day
before the 13th Committee meeting.
One of the outcomes of those MAB meetings is the MAB recommendation to the
Committee about the Med MoU needs to establish its own procedure to calculate the
number of the individual ships.

Med MoU – Annual Report – Year 2011
Mediterranean MoU Secretariat
77
THE INFORMATION CENTER (CIMED)
The Med MoU Information Center has been established in Morocco, for the purpose of
exchanging information on port State inspection, in order to make available to
authorities information on inspection of ships on other regional ports to assist them in
their selection of foreign flag ships to be inspected and in the exercise of port State
control in the region.
• The Committee discussed the issue of providing Equasis with data of
inspections results and instructed the CIMED to confirm to Equasis that the
Med MoU will cooperate in participation.
CO-OPERATION WITH INTERNATIONAL ORGANIZATIONS
The Med MoU has inter-governmental status (IGO) since 2006 in IMO meetings. The
Med MoU Representatives participated in the Flag State Implementation 19th FSI Sub –
Committee in February, 2011 and the 5th IMO Workshop in June 2011.
The Fifth IMO Workshop for PSC MOU/Agreement Secretariat and Database
Managers was held from 14 to 16 June 2011 at IMO Headquarters. The major agenda
discussed at the workshop were update on activities, information network draft
Assembly Resolution on Procedures on PSC and other PSC – related matters and
technical co-operation activities.
Within the framework of the Euro-Mediterranean Transport Forum, the 2nd Meeting of
the Maritime Affairs, Ports and Short Sea Shipping Working Group was held in
Brussels on 24-25 Oct. 2011. The Meeting consisted of back to back Meetings of the
6th Maritime Safety Sub-Group, which is also the SafeMed II Project Advisory
Committee, was held at the Borschette Conference Centre and was chaired by the
European Commission. The Meeting was attended by the Representatives of the
Mediterranean Memorandum of Understanding on Port State Control.
Med MoU – Annual Report – Year 2011
Mediterranean MoU Secretariat
88
CO-OPERATION WITH PARIS MOU
The Med MoU has established and maintained effective and close cooperation with the
Paris MoU, both at administrative and technical levels.
Representative of the Paris MoU (Deputy General Secretary Mrs. Carien Droppers)
attended the 13th
Med MoU Committee meeting in Cyprus, and update the Committee
with the draft questionnaire of the CIC on “Fire Safety Systems Code”.
During the period of 2011, continuous efforts and further coordinated actions by the two
Memorandums were made.
CO-OPERATION WITH BLACK SEA MOU
The Med MoU has special cooperation with the Black Sea MoU in the area of
exchanging PSCOs to gain experience of harmonization and on the job training between
both MoUs.
In 2011, Russia, Ukraine and Turkey member states of the Black Sea MoU sent PSCOs
to the Med MoU ports.
Representative of the Black Sea MoU (Black Sea Information System (BSIS) Manager
Mrs. Natalia Kharchenko) attended the 13th
Med MoU Committee meeting in Cyprus
CO-OPERATION WITH TOKYO MOU
The 1st General Training Course for PSC officers in the Asia – Pacific was held in
Yokohama, Japan, from 30 August to 27 September 2011. This was the seventh training
course jointly organized by IMO and the Tokyo MoU. A total of 20 PSC offices
participated in the training course. Eight PSC officers from Abuja MOU, the Viña del
Mar Agreement, Black Sea MoU, Caribbean MoU, Indian Ocean MoU, Mediterranean
MoU and Riyadh MoU were invited from the IMO. The Maritime Authority of Lebanon
participated in the course as a representative of the Med MoU.
The course was conducted with the assistance by the Shipbuilding Research Center of
Japan (SRC).

Med MoU – Annual Report – Year 2011
Mediterranean MoU Secretariat
99
ANNUAL STATISTICAL REPORT 2011
In the following annual statistics the facts and figures of 2011 are listed, the figures
show a decrease in the number of inspections, detentions and deficiencies.
INSPECTIONS
With a total number of 6,225 inspections performed in 2011 the inspection figures
showed a decrease of 558 inspections (8.2%) compared with the figures of 2010.
The greatest contribution for inspections was from Egypt with 2,058 inspections then
from Turkey with 1, 812 inspections.
The greatest percentage of inspections was in the "General cargo/multipurpose ship"
which was 2,638 inspections (42% of all inspections).
DEFICIENCIES
Number of deficiencies (22,315)
In 2010 the number of deficiencies recorded was 23,144 deficiencies; in 2011 this
number decreased to a total of 22,315 deficiencies (3.5%) compared with 2010. The
average number of deficiencies per inspections slightly increased from 3.4 in 2010 to
3.5 in 2011.
The greatest percentage of deficiencies recorded was on "Safety of navigation" with
23.1% of total number of deficiencies, then "Stability, structure and related equipment"
with 10.5% of total number of deficiencies.
Number of ships with deficiencies (3,623)
In General cargo/multipurpose ship" the greatest number of deficiencies recorded which
was 1,938 deficiencies (53.5% of total number of deficiencies).
DETENTIONS
The detention figures showed a decrease in the number of detentions in 2011 compared
with 2010.
The average detention rate in 2011 is 6.62% which is lower than 2005 which showed a
detention rate of 21.41%.
The greatest percentage of detentions was on "General cargo/multipurpose ship" which
is 311 detentions (75% of total number of detentions).

Med MoU – Annual Report – Year 2011
Mediterranean MoU Secretariat
1100
A n n u a l R e p o r t 2 0 1 1

Med MoU – Annual Report – Year 2011
Mediterranean MoU Secretariat
1111
CCoonnttrriibbuuttiioonn ooff MMeeddiitteerrrraanneeaann MMooUU MMeemmbbeerrss ttoo
IInnssppeeccttiioonnss // DDeetteennttiioonnss iinn YYeeaarr 22000055--22001111
Number of inspections
3447
4582
5868
6317
69666783
6225
0
1000
2000
3000
4000
5000
6000
7000
8000
2005 2006 2007 2008 2009 2010 2011
Country
Inspections Detentions 2005
2006
2007
2008
2009
2010
2011
Total
2005
2006
2007
2008
2009
2010
2011
Total
Algeria 0 7 741 898 409 13 0 2068 0 3 11 31 17 4 0 66
Cyprus 0 0 0 0 0 0 126 126 0 0 0 0 0 0 10 10
Egypt 103 1320 1360 1692 2124 2711 2058 11368 6 180 264 197 222 182 109 1160
Israel 0 0 213 185 255 208 277 1138 0 0 14 32 47 48 44 185
Jordan 280 312 363 403 404 385 376 2523 24 17 29 14 5 6 4 99
Lebanon 314 292 367 451 530 512 484 2950 0 0 2 5 10 21 9 47
Malta 244 279 262 287 292 238 227 1829 24 24 17 22 9 10 9 115
Morocco 456 371 400 720 731 724 662 4064 62 85 44 28 19 12 9 259
Tunisia 183 232 233 233 177 342 203 1603 10 15 12 15 8 14 1 75
Turkey 1867 1769 1929 1448 2044 1650 1812 12519 612 467 528 285 370 230 217 2709
3447 4582 5868 6317 6966 6783 6225 40188 738 791 921 629 707 527 412 4725

Med MoU – Annual Report – Year 2011
Mediterranean MoU Secretariat
1122
Number of detentions
738791
921
629
707
527
412
0
100
200
300
400
500
600
700
800
900
1000
2005 2006 2007 2008 2009 2010 2011
Detentions in % of inspections
21.41%
17.26%
15.70%
9.96% 10.15%
7.77%6.62%
0
0.05
0.1
0.15
0.2
0.25
2005 2006 2007 2008 2009 2010 2011

Med MoU – Annual Report – Year 2011
CIMED – Annual Statistics Report – year 2011
1133
MMooUU iinnssppeeccttiioonnss ffoorr yyeeaarr 22001111
Annual Figure
Number of monthly Inspection, Detention and Inspection with deficiencies
Inspection: 6225
Detention: 412
Deficiencies: 3623
Deficiencies 55%
Detentions 6%
Without
Deficiencies
39%
Without Deficiencies Detentions Deficiencies

Med MoU – Annual Report – Year 2011
CIMED – Annual Statistics Report – year 2011
1144
SSttaattiissttiiccss SSuummmmaarryy
Summary Inspection/Detention/inspection with deficiencies
Recapitulation of MOU member's inspections: For 2011
PSC State Inspections Inspections with
deficiencies
Inspection without
deficiencies Deficiencies - % Detentions Detention- %
Detention with
classrated
Detainable
deficiencies
Algeria * 0 0 0 0.00% 0 0.00% 0
Cyprus 126 70 56 55.56% 10 7.94% 2
Egypt 2058 1497 561 72.74% 109 5.3% 23
Israel 277 201 76 72.56% 44 15.88% 0
Jordan 376 152 224 40.43% 4 1.06% 2
Lebanon 484 444 40 91.74% 9 1.86% 0
Malta 227 139 88 61.23% 9 3.96% 6
Morocco 662 246 416 37.16% 9 1.36% 0
Tunisia 203 62 141 30.54% 1 0.49% 0
Turkey 1812 813 999 44.87% 217 11.98% 44
Total 6225 3624 2601 412 77
* Algeria: no data input into MedSIS Application

Med MoU – Annual Report – Year 2011
CIMED – Annual Statistics Report – year 2011
1155
Number of Inspections, Detentions and Inspections with deficiencies per member state
Inspection: 6225
Detention: 412
Deficiencies: 3623

Med MoU – Annual Report – Year 2011
CIMED – Annual Statistics Report – year 2011
1166
Number and % of inspection, deficiencies and detention per ship's type
1315
66
858
58
2638
180 222165
87177
338
662
28
412
27
1938
27
184
54 55 84 10241 1 11 4
311
5 19 2 3 6 4
Inspection
deficiencies
detention
Bulk carrier
Chemical
tanker
Containership
Gas carrier
General
cargo/multi-
purpose ship
Oil tanker
Other types of
ship
Passenger ship
Refrigerated
cargo carrier
Ro-ro cargo
ship
Tanker, not
otherwise
specified
• Inspection 21% 1% 14% 1% 42% 3% 5% 3% 1% 3% 6%
• Deficiencie
s
18% 1% 11% ---- 53% 1% 9% ---- 2% 2% 2%
• Detentions 10% ----- 3% ---- 75% 1% 8% ---- 1% 1% 1%

Med MoU – Annual Report – Year 2011
CIMED – Annual Statistics Report – year 2011
1177
Number and % of nature of deficiencies
5155
2335
2169
1708
1553 1540
1188
906799
676567 563
508
2648
0
1000
2000
3000
4000
5000
6000
Safety of
navigation
Stability,
structure and
related
equipment
Propulsion and
auxiliary
machinery
Life saving
appliances
Fire safety
measures
Ship's
certificates and
documents
MARPOL-
annex1
Accident
prevention
(ILO 147)
Load lines
Radio
communication
Crew and
accommodatio
n(ILO 147)
ISM related
deficiencies
Certification
and
Watch keeping
for Seafarers
Others
Code 1500 900 1400 600 700 100 1700 800 1200 1600 300 2500 200
Percentage 23.1% 10.46% 9.72% 7.65% 6.96% 6.9% 5.32% 4.06% 3.58% 3.03% 2.54% 2.52% 2.28% 11.88%
Total number of deficiencies: 22315

Med MoU – Annual Report – Year 2011
CIMED – Annual Statistics Report – year 2011
1188
Number and % of inspection, detention and detention's percentage per major Classification Society
906
854
628
568543
456
406
309
46
1509
23 2912
47
6 13 5 17 9
266
0
200
400
600
800
1000
1200
1400
1600
GL BV NKK RMRS LRS ABS DNV RINA KCS Others
Detention % 2.5% 3.4% 1.9% 8.3% 1.1% 2.85% 1.3% 5.5% 19.56% 17.6%

Med MoU – Annual Report – Year 2011
CIMED – Annual Statistics Report – year 2011
1199
DDeettaaiilleedd aannnnuuaall ffiigguurreess
Detail inspection/detention/ % per Flag Administration
Flag State Inspections Detentions Inspections with deficiencies Detention-% Inspection-% with deficiencies
Albania 5 1 4 0,2 0,8
Algeria 4 1 3 0,25 0,75
Antigua and Barbuda 299 12 165 4.01% 55.18%
Antilles, Netherlands 22 1 13 4.55% 59.09%
Azerbaijan 2 0 1 0 0,5
Bahamas 176 1 65 0.57% 36.93%
Bahrain 5 0 1 0 0,2
Bangladesh 2 0 1 0 0,5
Barbados 24 1 13 4.17% 54.17%
Belgium 8 1 3 12.5% 37.5%
Belize 78 10 62 12.82% 79.49%
Bermuda 20 0 5 0 0,25
Bolivia 20 3 20 0,15 1
Bulgaria 12 1 11 8.33% 91.67%
Cambodia 160 36 149 22.5% 93.12%
Cayman Islands 26 0 11 0 42.31%
Chile 1 0 1 0 1
China, Peopole's Rep. Of 47 0 20 0 42.55%
Comoros 83 15 77 18.07% 92.77%
Cook Islands 13 1 12 7.69% 92.31%
Croatia 7 0 2 0 28.57%
Cyprus 104 1 66 0.96% 63.46%
Denmark 37 1 14 2.7% 37.84%
Dominica 19 2 19 10.53% 1
Egypt 12 0 9 0 0,75

Med MoU – Annual Report – Year 2011
CIMED – Annual Statistics Report – year 2011
2200
Flag State Inspections Detentions Inspections with deficiencies Detention-% Inspection-% with deficiencies
Estonia 1 0 1 0 1
Ethiopia 3 0 2 0 66.67%
Faroe Islands 1 0 1 0 1
Finland 3 0 2 0 66.67%
France 16 0 6 0 37.5%
Georgia 154 26 145 16.88% 94.16%
Germany 73 1 41 1.37% 56.16%
Gibraltar 51 3 30 5.88% 58.82%
Greece 118 3 50 2.54% 42.37%
Honduras 1 0 1 0 1
Hong Kong, China 168 3 55 1.79% 32.74%
India 16 0 9 0 56.25%
Iran (Islamic Republic of) 3 0 2 0 66.67%
Ireland 8 1 6 12.5% 0,75
Israel 1 0 1 0 1
Italy 186 4 79 2.15% 42.47%
Jamaica 3 1 1 33.33% 33.33%
Japan 4 0 1 0 0,25
Jordan 10 1 8 0,1 0,8
Kiribati 3 2 3 66.67% 1
Korea, Democratic People's Rep. 19 6 18 31.58% 94.74%
Korea, Republic of 14 0 7 0 0,5
Kuwait 5 0 3 0 0,6
Latvia 4 0 3 0 0,75
Lebanon 13 3 10 23.08% 76.92%
Liberia 473 7 194 1.48% 41.01%
Libyan Arab Jamahiriya 7 4 6 57.14% 85.71%
Lithuania 6 1 5 16.67% 83.33%
Med MoU – Annual Report – Year 2011
CIMED – Annual Statistics Report – year 2011
2211
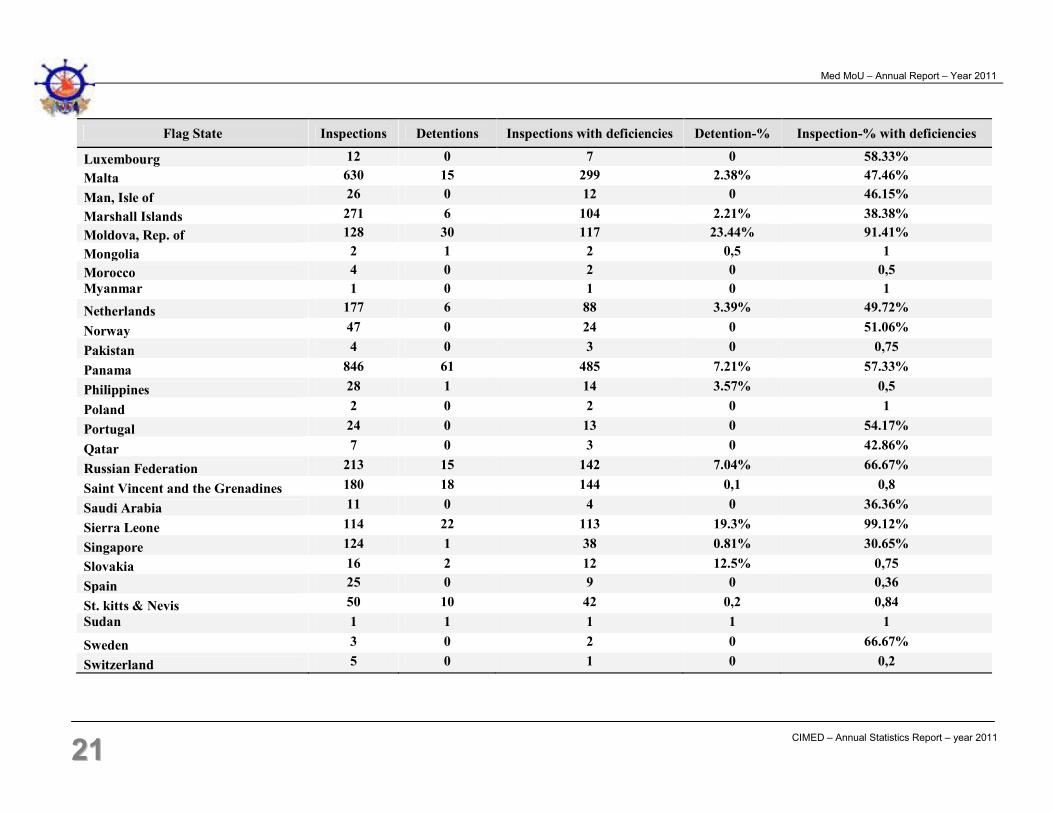
Flag State Inspections Detentions Inspections with deficiencies Detention-% Inspection-% with deficiencies
Luxembourg 12 0 7 0 58.33%
Malta 630 15 299 2.38% 47.46%
Man, Isle of 26 0 12 0 46.15%
Marshall Islands 271 6 104 2.21% 38.38%
Moldova, Rep. of 128 30 117 23.44% 91.41%
Mongolia 2 1 2 0,5 1
Morocco 4 0 2 0 0,5
Myanmar 1 0 1 0 1
Netherlands 177 6 88 3.39% 49.72%
Norway 47 0 24 0 51.06%
Pakistan 4 0 3 0 0,75
Panama 846 61 485 7.21% 57.33%
Philippines 28 1 14 3.57% 0,5
Poland 2 0 2 0 1
Portugal 24 0 13 0 54.17%
Qatar 7 0 3 0 42.86%
Russian Federation 213 15 142 7.04% 66.67%
Saint Vincent and the Grenadines 180 18 144 0,1 0,8
Saudi Arabia 11 0 4 0 36.36%
Sierra Leone 114 22 113 19.3% 99.12%
Singapore 124 1 38 0.81% 30.65%
Slovakia 16 2 12 12.5% 0,75
Spain 25 0 9 0 0,36
St. kitts & Nevis 50 10 42 0,2 0,84
Sudan 1 1 1 1 1
Sweden 3 0 2 0 66.67%
Switzerland 5 0 1 0 0,2

Med MoU – Annual Report – Year 2011
CIMED – Annual Statistics Report – year 2011
2222
Flag State Inspections Detentions Inspections with deficiencies Detention-% Inspection-% with deficiencies
Syrian Arab Republic 34 3 32 8.82% 94.12%
Thailand 12 0 6 0 0,5
Togo 67 15 66 22.39% 98.51%
Tunisia 3 1 1 33.33% 33.33%
Turkey 290 16 188 5.52% 64.83%
Tuvalu 6 0 6 0 1
Ukraine 56 9 47 16.07% 83.93%
United Arab Emirates (UAE) 8 2 4 0,25 0,5
United Kingdom 107 1 39 0.93% 36.45%
United Republic of Tanzania 84 20 84 23.81% 1
United States of America 25 1 16 0,04 0,64
Vanuatu 18 0 11 0 61.11%
Venezuela 1 1 1 1 1
Viet Nam 6 0 2 0 33.33%
Total 6218 412 3624
Med MoU – Annual Report – Year 2011
CIMED – Annual Statistics Report – year 2011
2233
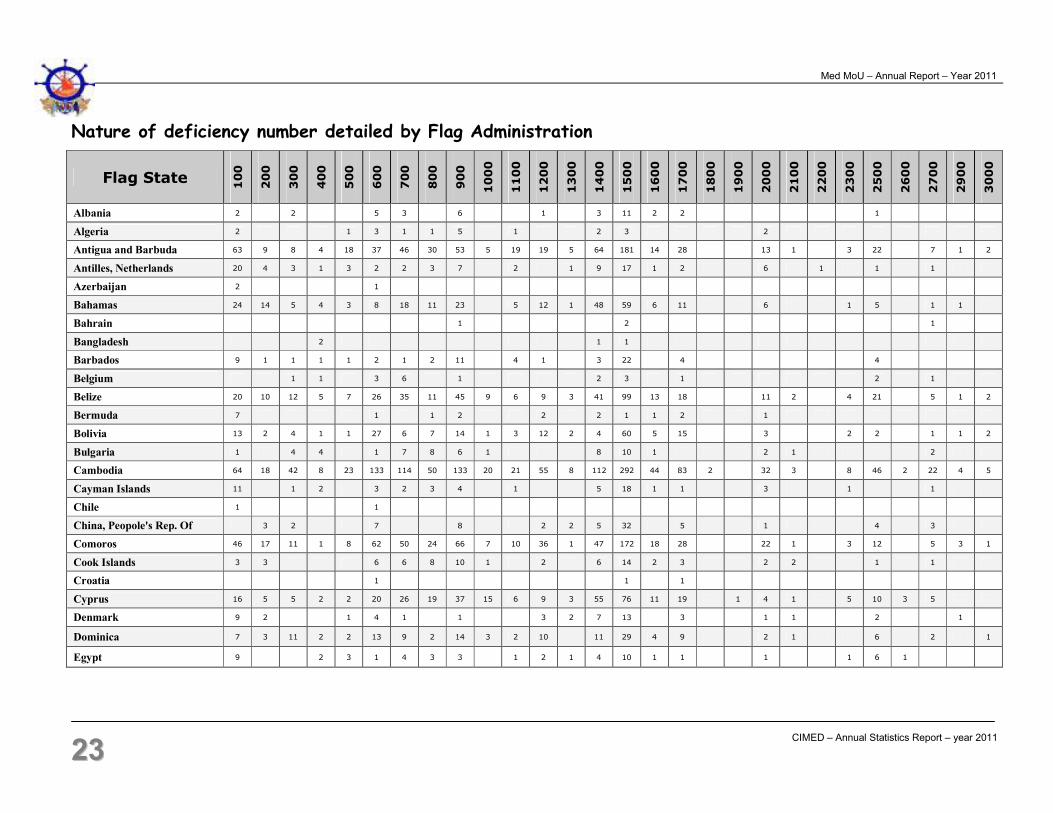
Nature of deficiency number detailed by Flag Administration
Flag State
100
200
300
400
500
600
700
800
900
1000
1100
1200
1300
1400
1500
1600
1700
1800
1900
2000
2100
2200
2300
2500
2600
2700
2900
3000
Albania 2 2 5 3 6 1 3 11 2 2 1
Algeria 2 1 3 1 1 5 1 2 3 2
Antigua and Barbuda 63 9 8 4 18 37 46 30 53 5 19 19 5 64 181 14 28 13 1 3 22 7 1 2
Antilles, Netherlands 20 4 3 1 3 2 2 3 7 2 1 9 17 1 2 6 1 1 1
Azerbaijan 2 1
Bahamas 24 14 5 4 3 8 18 11 23 5 12 1 48 59 6 11 6 1 5 1 1
Bahrain 1 2 1
Bangladesh 2 1 1
Barbados 9 1 1 1 1 2 1 2 11 4 1 3 22 4 4
Belgium 1 1 3 6 1 2 3 1 2 1
Belize 20 10 12 5 7 26 35 11 45 9 6 9 3 41 99 13 18 11 2 4 21 5 1 2
Bermuda 7 1 1 2 2 2 1 1 2 1
Bolivia 13 2 4 1 1 27 6 7 14 1 3 12 2 4 60 5 15 3 2 2 1 1 2
Bulgaria 1 4 4 1 7 8 6 1 8 10 1 2 1 2
Cambodia 64 18 42 8 23 133 114 50 133 20 21 55 8 112 292 44 83 2 32 3 8 46 2 22 4 5
Cayman Islands 11 1 2 3 2 3 4 1 5 18 1 1 3 1 1
Chile 1 1
China, Peopole's Rep. Of 3 2 7 8 2 2 5 32 5 1 4 3
Comoros 46 17 11 1 8 62 50 24 66 7 10 36 1 47 172 18 28 22 1 3 12 5 3 1
Cook Islands 3 3 6 6 8 10 1 2 6 14 2 3 2 2 1 1
Croatia 1 1 1
Cyprus 16 5 5 2 2 20 26 19 37 15 6 9 3 55 76 11 19 1 4 1 5 10 3 5
Denmark 9 2 1 4 1 1 3 2 7 13 3 1 1 2 1
Dominica 7 3 11 2 2 13 9 2 14 3 2 10 11 29 4 9 2 1 6 2 1
Egypt 9 2 3 1 4 3 3 1 2 1 4 10 1 1 1 1 6 1

Med MoU – Annual Report – Year 2011
CIMED – Annual Statistics Report – year 2011
2244
Flag State
100
200
300
400
500
600
700
800
900
1000
1100
1200
1300
1400
1500
1600
1700
1800
1900
2000
2100
2200
2300
2500
2600
2700
2900
3000
Estonia 1 1 1
Ethiopia 1 3 1 1 2 1 1 3 1 2
Faroe Islands 1 1 1 2 1
Finland 1 1 1 1 1 2 2 1
France 2 1 3 1 2 1 3 1
Georgia 73 26 37 4 18 112 77 42 100 16 15 51 8 68 306 39 89 1 1 21 3 1 5 26 3 22 7 7
Germany 21 3 3 8 5 12 1 2 3 2 19 39 1 7 9 1 7
Gibraltar 7 6 9 6 10 10 1 1 12 48 5 7 5 5 1
Greece 27 6 4 1 9 19 31 14 25 2 11 19 1 22 67 14 10 10 4 5 2 4
Honduras 1 3 1 1
Hong Kong, China 12 5 10 5 3 9 21 12 22 2 3 3 35 55 5 9 5 2 3 8 1 1
India 1 4 6 1 1 12 1 5 3 7 7 1 3 1
Iran (Islamic Republic of) 1 4 1 1
Ireland 13 1 4 2 2 2 2 10 2 2 1 1
Israel 1 1 1 1
Italy 18 2 4 3 4 20 24 15 32 5 6 11 1 45 66 5 7 1 7 7 6 2
Jamaica 1 1
Japan 1 1 1
Jordan 4 1 2 1 3 1 3 1 4 5 17 3
Kazakhstan
Kiribati 2 1 1 2 1 1 5 2 1 1 1 1
Korea, Democratic People's
Rep. 17 7 4 6 7 21 17 10 29 2 2 14 3 22 38 10 12 3 2 8 4 1
Korea, Republic of 1 2 1 1 3 2 2 2 2 7 1
Kuwait 1 2 2 3 1 3 1
Latvia 1 1 1 1 2 2
Lebanon 2 1 2 1 3 5 5 4 2 1 6 15 3 7 1 1 2

Med MoU – Annual Report – Year 2011
CIMED – Annual Statistics Report – year 2011
2255
Flag State
100
200
300
400
500
600
700
800
900
1000
1100
1200
1300
1400
1500
1600
1700
1800
1900
2000
2100
2200
2300
2500
2600
2700
2900
3000
Liberia 37 29 18 2 10 35 38 40 70 5 18 14 7 86 196 20 30 17 2 7 14 3 11 1 3
Libyan Arab Jamahiriya 8 2 1 4 13 7 2 9 2 1 6 19 6 2 1 3 3 1 1 1 1
Lithuania 2 2 5 2 2 4 2 6 9 1 1
Luxembourg 1 2 2 1 1 1 1 4 13 2 1 1 1
Malaysia
Malta 82 44 43 13 30 83 116 74 201 10 38 39 11 191 300 54 80 26 6 1 10 31 9 15 5 7
Man, Isle of 4 1 2 3 2 3 6 3 1 3
Marshall Islands 36 13 6 2 8 33 26 23 35 6 10 8 1 36 107 15 19 10 1 1 6 2 3 1 1
Moldova, Rep. of 114 41 29 10 15 107 89 35 132 14 24 64 11 96 262 39 70 24 2 6 28 13 7 3
Mongolia 1 3 1 3 2 8 3 1 1 1 1
Morocco 4 1 1 2 1
Myanmar 2 3 7 5 4 1 2
Netherlands 25 14 1 2 4 25 16 4 27 10 5 14 86 11 25 8 2 2 10 7 1 1
Norway 11 2 3 1 3 3 8 1 3 7 9 18 5 7 11 2 1
Pakistan 1 1 1 2 2 1
Panama 195 79 72 40 60 203 211 125 295 17 68 94 24 332 625 78 151 6 3 67 10 19 91 6 28 10 9
Philippines 4 1 2 2 4 2 9 1 1 11 12 4 4 6 1 1 2 2
Poland 1 2 1 2 1 1 1
Portugal 5 1 1 2 5 3 3 3 2 2 8 3 1 1
Qatar 1 1 1 1 1 1 1
Russian Federation 34 6 27 2 17 76 70 35 85 12 8 31 8 80 184 28 46 4 22 6 2 17 1 15 3 3
Saint Vincent and the
Grenadines 52 22 30 15 19 61 65 33 121 8 32 25 8 91 213 30 40 13 3 8 20 4 16 3 2
Saint Vincent and the
Grenadines 89 42 33 14 27 84 90 45 129 13 6 42 12 160 334 43 54 26 4 4 22 8 9
Saudi Arabia 2 3 2 1 1 6 6 1
Sierra Leone 77 22 34 13 23 98 60 34 120 9 12 32 3 95 268 27 66 15 3 5 19 2 20 8 11

Med MoU – Annual Report – Year 2011
CIMED – Annual Statistics Report – year 2011
2266
Flag State
100
200
300
400
500
600
700
800
900
1000
1100
1200
1300
1400
1500
1600
1700
1800
1900
2000
2100
2200
2300
2500
2600
2700
2900
3000
Singapore 5 10 1 2 5 5 2 15 2 4 1 11 44 5 7 5 1 3 2
Slovakia 5 4 2 1 9 7 1 3 1 1 6 5 5 19 4 4 2 2
Spain 4 1 2 2 1 1 1 2 1 6 1 1
Sri Lanka
St. kitts & Nevis 18 6 10 6 7 29 29 11 38 2 13 2 14 59 10 21 4 2 8 6 2
Sudan 2 2 4 1 6 2 5 1 1
Sweden 2 1
Switzerland 1
Syrian Arab Republic 10 7 7 3 4 25 17 8 27 2 2 2 20 68 5 13 4 13 4 4
Thailand 1 1 1 6 1 1 1 5 4 1 1 2
Togo 53 14 13 3 14 57 43 17 77 5 9 35 5 57 156 20 46 14 3 24 1 16 4 3
Tonga
Tunisia 4 1 2 1 2 7 1
Turkey 56 11 47 3 21 91 56 94 143 15 29 56 6 139 261 39 60 1 1 38 5 3 15 25 4 9
Tuvalu 7 2 1 2 4 5 11 1 1 8 18 1 2 1 1 1
Ukraine 17 3 3 1 4 32 36 7 53 2 6 9 3 32 63 16 7 2 3 1 3 7 5 2
United Arab Emirates (UAE) 1 4 2 1 1 10 4 2 1 1
United Kingdom 14 8 4 1 4 11 11 10 26 3 1 3 14 45 12 5 3 2 2 6 3 1
United Republic of Tanzania 84 14 15 5 19 87 55 23 89 5 10 40 6 62 213 19 58 13 2 3 26 1 14 7 8
United States of America 10 1 2 1 6 1 4 5 20 10 6 6 1 2 1 2
Vanuatu 13 2 3 1 1 2 2 1 1 5 1 3 1 1
Venezuela 7 1 3 1 3 3 1 1 1
Viet Nam 3 2 1 1 1 2 1 1 1
Total
1540
508
567
201
399
1708
1553
906
2335
206
417
799
157
2169
5155
676
1188
11
12
490
72
3
121
563
45
329
82
103

Med MoU – Annual Report – Year 2011
Mediterranean MoU Secretariat
2277
MED MOU SECRETARIAT CONTACT DETAILS
Adm. Mokhtar AMMAR Secretary General
E-mail : [email protected]
Capt. Emad ISLAM
Deputy Secretary
E-mail : [email protected]
Postal Address: MEDMOU Secretariat, ELMANDARA – 746 EL CORNISH STREET
17th FLOOR- (BLUE HORIZON BUILDING)- ALEXANDRIA - EGYPT
Email Address : [email protected]
Website : www.medmou.org
Telephone : + (203) 5505770
+ (203 5505773
Fax : + (203) 5505578
CIMED CONTACT DETAILS
Mr. Omar Hassein
Director MedMoU Information Centre
E-mail : [email protected]
Mr. Mehdi Loutfi
Deputy Director MedMoU Information Centre
E-mail : [email protected]
Postal Address: Immeuble Direction de la Marine Marchande-Boulevard Félix Houphouet
BOIGNY, 20000, Casablanca - Morocco
Email Address : [email protected]
Website : www.medmouic.org
Telephone : + (212) 522 27 17 50/543 46 20
Fax : + (212) 522 27 17 63

Med MoU – Annual Report – Year 2011
Mediterranean MoU Secretariat
2288
MMMeeeddd MMMoooUUU MMMeeemmmbbbeeerrr ssstttaaattteeesss FFFooocccaaalll PPPoooiiinnnttt
AAAlllgggeeerrriiiaaa CCCyyyppprrruuusss EEEgggyyypppttt IIIsssrrraaaeeelll
MR. BENYELLES
ABDERRAHIM LOTFI MR. MICHAEL A. MICHAELIDES R. ADM: Ibrahim Ali Flefel CAPT. ALEXSANDER GERSON
Directeur De la Marine
Marchande et des Ports
Ministere des Transports -
Marine Surveyor A'
Ministry of Communications and
Works Department of Merchant
Shipping
Chairman of Egyptian Authority
for Maritime Safety
Head of Shipping & ports
Inspectore
1, Chemein Ibn Badis EL MOUIZ
EL BIAR – Alger.
Kyllinis Street, Mesa Geitonia
4007, Lemesos
Postal Address: P.O. Box 56193
3305, Lemesos Cyprus
Alexandria – Bab Gomrok ( 1)
Postal code 21513
15A Pal – Yam St. POB 806,
Haifa 31999, Israel
Phone: +213 21920931 Fax: +213 21926096 E-mail:
benyelles@ministere-
transports.gov.dz
Phone: +357 25848 100 - 275
Fax: +357 25848200
E-mail: mmichaelides@ dms.mcw.gov.cy
Phone: +203 4832041
Fax: +203 4837627
E-mail:[email protected]
Phone: +972 48632080
Fax: +972 48632118
E-mail:
JJJooorrrdddaaannn LLLeeebbbaaannnooonnn MMMaaalll tttaaa MMMooorrroooccccccooo
ENG. AL MOUTASEM AL-
SAKET
MR. ABDEL HAFIZ EL KAYSSI MR. IVAN SAMMUT MR. ABDELLAH IDRISSI
ABOUELFETH
Director General– Jordan
Maritime Authority
General Director of Land &
Maritime Transport
Chief Officer Merchant Shipping
& Registrar-General of Shipping
and Seamen
Merchant Shipping Directorate.
Deputy Director of Merchant
Marine
The Hashemite Kingdom of
Jordan P.O.Box 171-Aqaba
77110 Jordan
Ministry of Public Works &
Transport Starco Bldg. 3rd Floor
- Beirut – Lebanon
Malta Transport Center
Marsa, MRS 1917 - Malta
Direction de la Marine Marchande
Boulevard Félix Houphouët
Boigny Casablanca - Maroc
Phone: +962 32015858 Fax: +962 32018049 E-mail: [email protected]
Phone: +9611 3716 44 - 45 Fax: +9611371647 E-mail:
Phone: +356 21250350 Fax: +356 21241460 E-mail:
Phone: +212 522434605 Fax: +212 522273340 E-mail:
TTTuuunnniii sss iiiaaa TTTuuurrrkkkeeeyyy
MR. RACHID FELFEL
MR. CEMALETTIN SEVLI
Director of Fleet and Maritime Navigation Office de
General Director
Office de la Marine Marchande et des Ports – Batiment Administratif 2060 - Tunisia
Ministry of Transport, Maritime Affaires and Communications General Directorate for Maritime and Inland Waters Regulation T.C. Ulaştırma, Denizcilik ve Haberleşme Bakanlığı Deniz ve Đçsular Düzenleme Genel Müdürlüğü Hakkı Turayliç Caddesi No:5 “C Blok” Emek/Ankara/TÜRKĐYE
Phone: +216 71 73 7559 Fax : +216 71 737559 E-mail: [email protected]
Phone: +90 312 203 10 00 Fax: +90 312 231 3306 E-mail: [email protected]