Embed Size (px)
Citation preview

NATIONAL CORE INDICATORS DATA FOR SYSTEMS CHANGE
MEDICATION USE IN ADULTS WITH ID/DD
LIVING IN COMMUNITY HOMES AND STATE EFFORTS TO REDUCE OVERUSE
VALERIE BRADLEY, HSRI SUE KELLY, DELMARVA
EDDIE TOWSON, DDD, GA GAIL GROSSMAN, MA DMR
EMILY LAUER, SHRIVER CENTER
SEPTEMBER 2013 A Collaboration of State Members, NASDDDS & HSRI
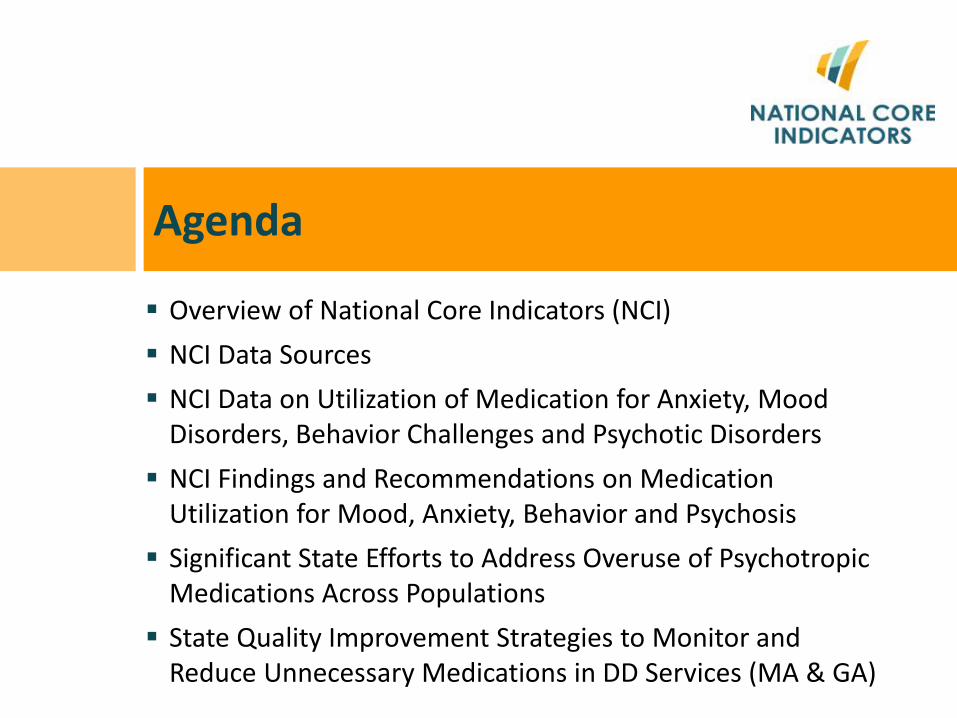
Overview of National Core Indicators (NCI) NCI Data Sources NCI Data on Utilization of Medication for Anxiety, Mood
Disorders, Behavior Challenges and Psychotic Disorders NCI Findings and Recommendations on Medication
Utilization for Mood, Anxiety, Behavior and Psychosis Significant State Efforts to Address Overuse of Psychotropic
Medications Across Populations State Quality Improvement Strategies to Monitor and
Reduce Unnecessary Medications in DD Services (MA & GA)
Agenda

Overview of NCI

National Core Indicators “NCI”
NCI is a voluntary effort by public developmental disabilities agencies to measure and track systemic performance.
Collaboration began in 1997; coordinated by HSRI and NASDDDS
Currently 35 state members plus 23 sub-state entities
Administration on Intellectual and Developmental Disabilities (AIDD) awarded NCI a contract with goal to increase participation to all 50 states and District of Columbia within 5 years.
NASUAD collaboration underway to develop outcome measurement tools and processes for national benchmarking of aging and disability services across funding sources.
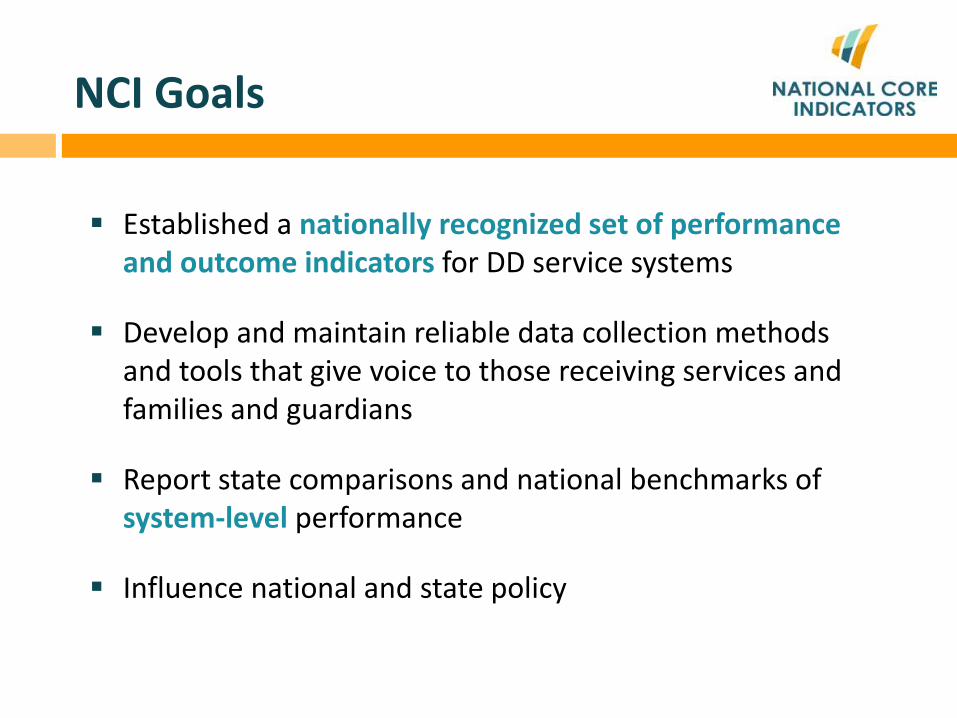
NCI Goals
Established a nationally recognized set of performance and outcome indicators for DD service systems
Develop and maintain reliable data collection methods and tools that give voice to those receiving services and families and guardians
Report state comparisons and national benchmarks of system-level performance
Influence national and state policy
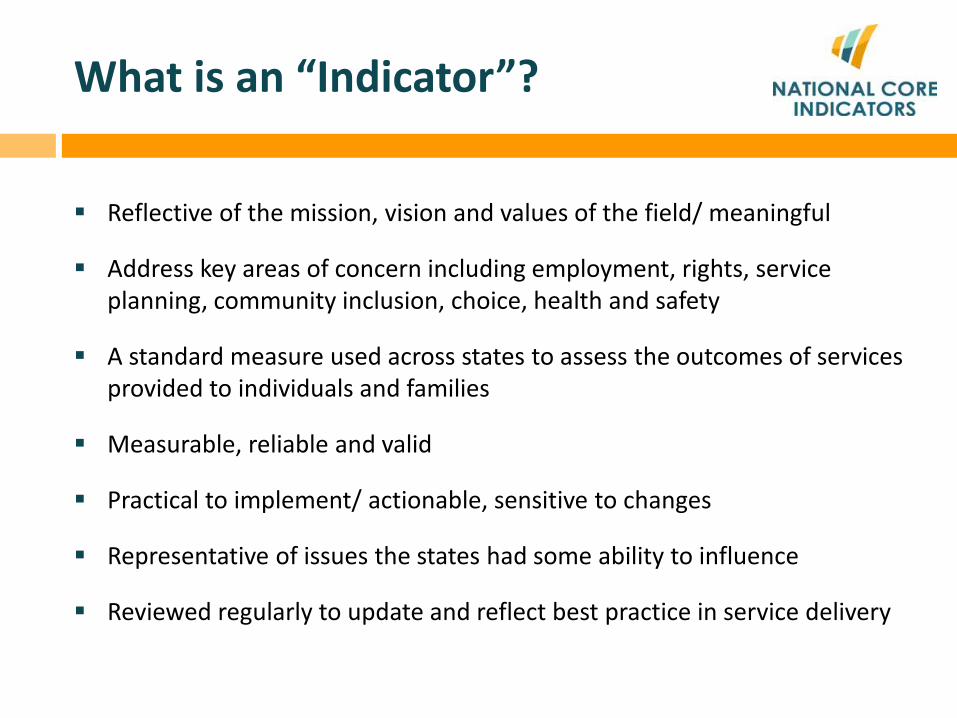
What is an “Indicator”?
Reflective of the mission, vision and values of the field/ meaningful
Address key areas of concern including employment, rights, service planning, community inclusion, choice, health and safety
A standard measure used across states to assess the outcomes of services provided to individuals and families
Measurable, reliable and valid
Practical to implement/ actionable, sensitive to changes
Representative of issues the states had some ability to influence
Reviewed regularly to update and reflect best practice in service delivery
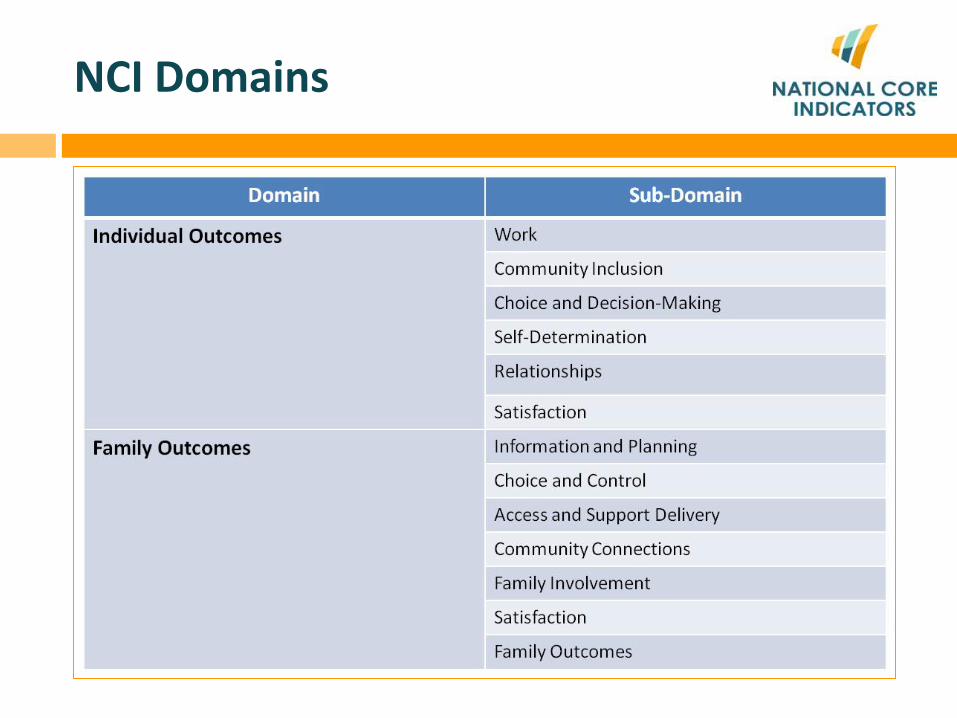
NCI Domains

NCI Domains
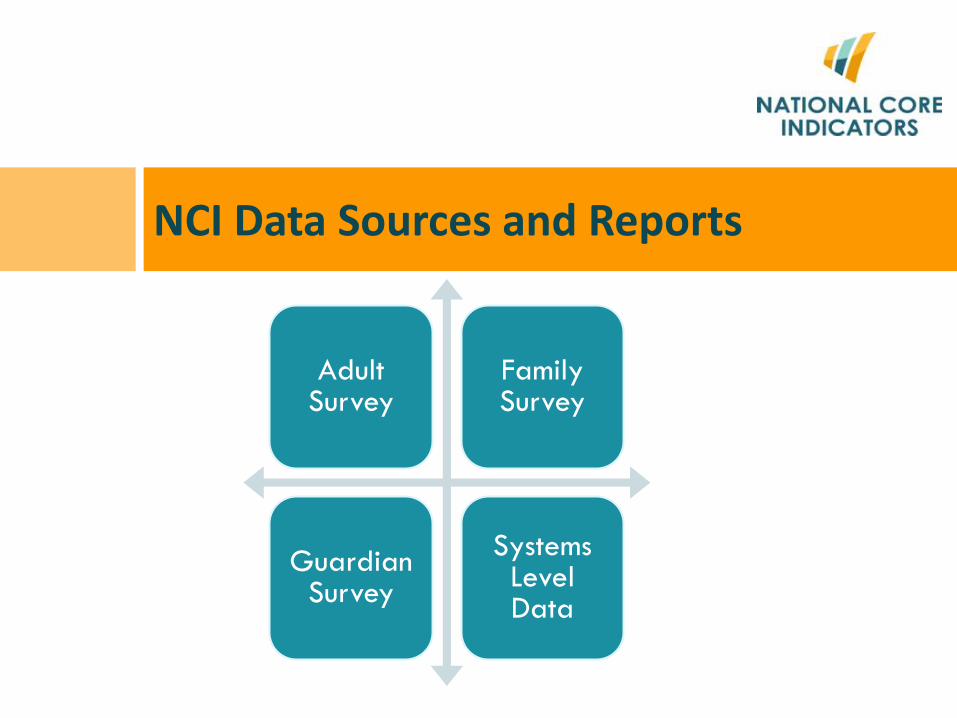
NCI Data Sources and Reports
Adult Survey
Family Survey
Guardian Survey
Systems Level Data

NCI Data Sources
Adult Consumer Survey In-person conversation with a sample of adults receiving services
to gather information about their experiences Keyed to important person-centered outcomes that measure
system-level indicators related to: employment, choice, relationships, case management, inclusion, health, etc.
Adult Family, Child Family, and Family/Guardian Surveys
Mail surveys – separate sample from Adult Consumer Survey
Other NCI state level data: Mortality, Staff Stability

NCI Reporting & Resources
NCI website is a public data source for: Annual national reports Annual state reports Publications: Data used by researchers for journal articles NCI Data Briefs: Medications, Employment Outcomes,
Autism, Dual Diagnosis, Living Arrangement, etc. Webinars: Managed Care, Psychotropic Medication &
Efforts to Reduce Overuse, Interviewer Training Chart creation feature for customized data analysis
http://www.nationalcoreindicators.org/

Ways States Use NCI Data
CMS Waiver Assurance Evidence Reports
Quality assurance and improvement
State to State comparisons
Assist with community transition
DD Councils
Reports and advocacy to State Legislatures
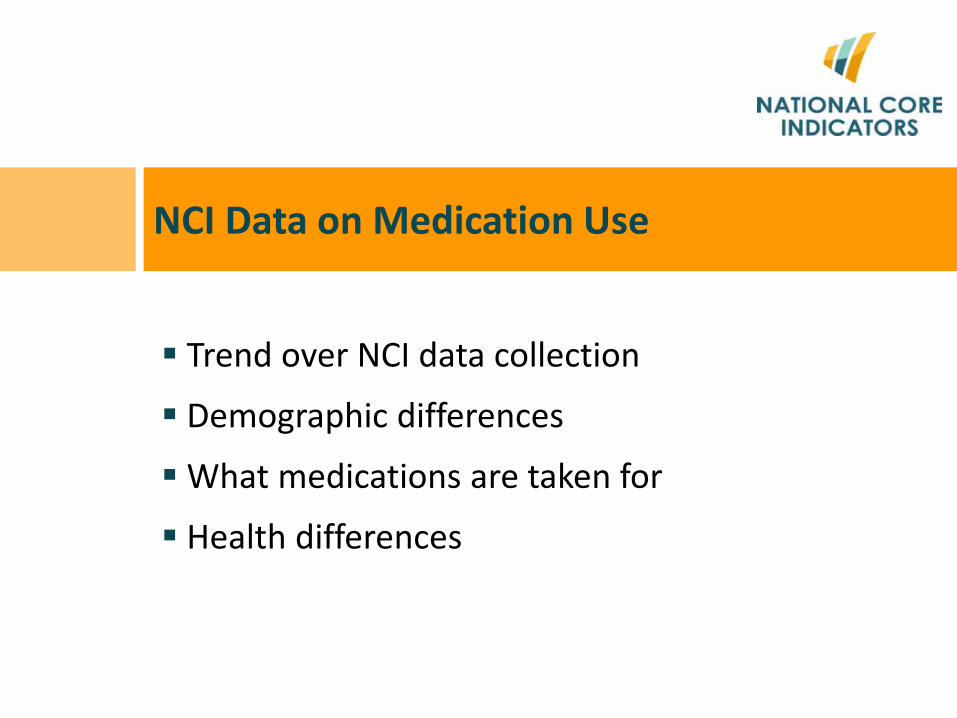
Trend over NCI data collection
Demographic differences
What medications are taken for
Health differences
NCI Data on Medication Use

Source of NCI Medication Information
Adult Consumer Survey • Standardized, face-to-face interview with a sample of
individuals receiving services
• No pre-screening procedures
• Conducted with adults only (18 and over) receiving at least one service besides case management
• Takes 50 minutes on average
• Training materials/interviewers

Source of NCI Medication Information
Background Section - completed by case managers
“Does the person take medications to address…..
• Mood disorder
• Anxiety
• Psychotic disorder
• Behavior”
Total N for whom information available is approximately 8,200 people

Takes Medications to Address
53% of people with IDD receiving services take medications for at least 1 of these conditions: • mood disorders • anxiety • behavior challenges • psychotic disorders
Most common condition medications are taken for is a mood disorder (38%).
14% of those taking at least 1 medication take them for all 4 conditions.
39%
29%
18%14%
Takes medications for….1 condition 2 conditions 3 conditions 4 conditions

Takes Medications to Address
88% of those with a co-occurring psychiatric diagnosis were taking medications for mood, anxiety or psychotic disorders.
However, 30% of people without a psychiatric diagnosis were also taking medications for mood, anxiety or psychotic disorders.
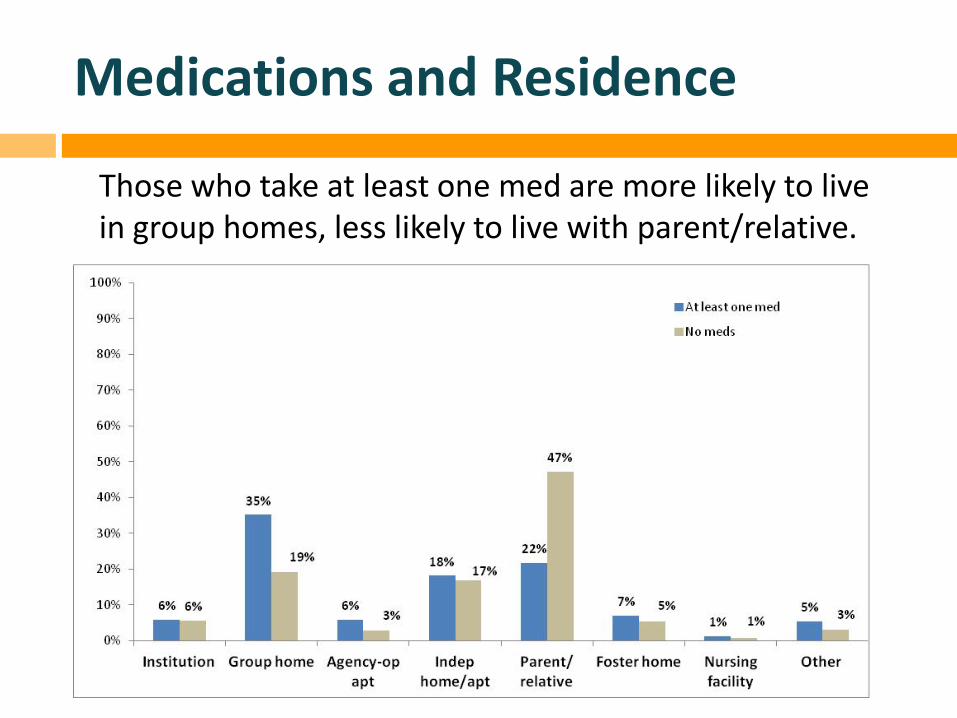
Medications and Residence
Those who take at least one med are more likely to live in group homes, less likely to live with parent/relative.

Medications and Residence
Another look at residence and medications:
53%
68% 71%
55%
34%
60% 68% 67%
0%
10%
20%
30%
40%
50%
60%
70%
80%
90%
100%
Institution(N=470)
Grouphome
(N=2298)
Agency-opapt
(N=362)
Indephome/apt(N=1461)
Parent/relative
(N=2816)
Fosterhome
(N=517)
Nursingfacility(N=76)
Other(N=352)
Proportion taking at least one medication by type of residence
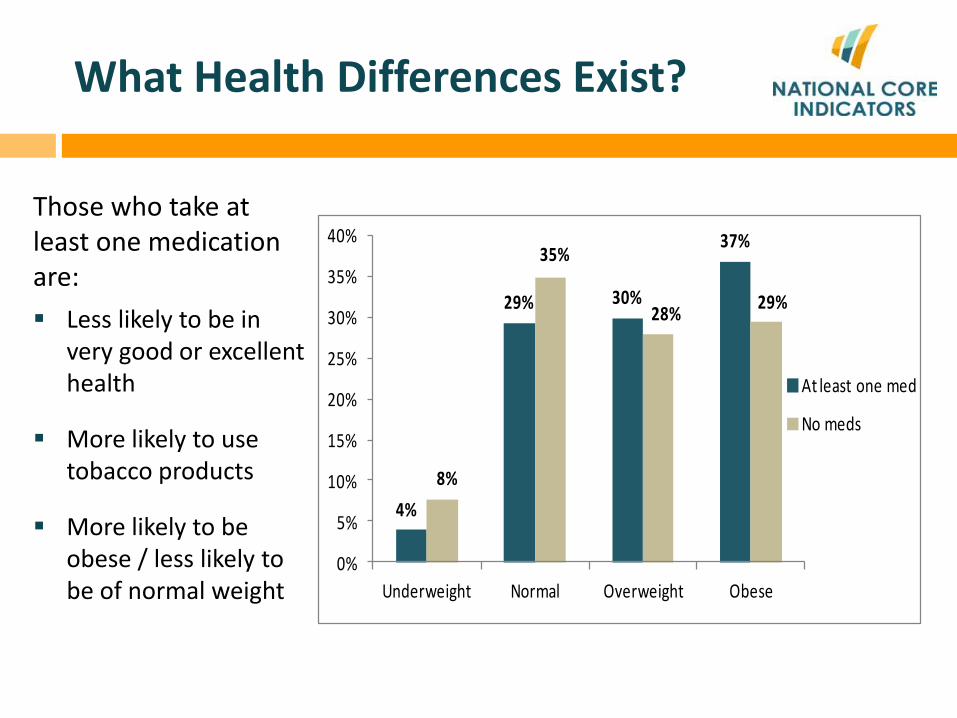
What Health Differences Exist?
Those who take at least one medication are: Less likely to be in
very good or excellent health
More likely to use tobacco products
More likely to be obese / less likely to be of normal weight
4%
29% 30%
37%
8%
35%
28% 29%
0%
5%
10%
15%
20%
25%
30%
35%
40%
Underweight Normal Overweight Obese
At least one med
No meds

What Health Differences Exist?
Another look at weight and meds: Proportion taking at least one med in each weight category:
37%
49% 55%
59%
0%
10%
20%
30%
40%
50%
60%
70%
80%
90%
100%
Underweight (N=411) Normal (N=2298) Overweight (N=2090) Obese (N=2405)
At least one med

Medication use is a cross service population concern.
Awareness is Rising of Overuse of Psychotropic Medications Across Service Populations
Mental Health & Aging Service System Initiatives
In mental health services, courts are involved in ensuring due process protections for people recommended to take certain medications. Advance Directives for medication consent now are used.
In aging services, nursing homes report to CMS on MDS (Minimum Data Set), “The percent of long-stay residents who received an antipsychotic medication.”
Falls are a major cause of morbidity and mortality in aging services. A significant percentage of falls result from effects of medications.

Children using Medicaid & Foster Care
GAO 2012 report found that children in Medicaid program took antipsychotic medications at twice the rate of privately insured children (1.3 % v 0.5%).
GAO found 18% of children in foster care system were taking psychotropic medications. Utilization varied widely by the child’s living arrangement.
30% of children in foster care who may have needed mental health services did not receive mental health services in the previous 12 months.
Source: U.S. Government Accountability Office (GAO) report, Children's Mental Health: Concerns Remain about Appropriate Services for Children in Medicaid and Foster Care. GAO-13-15, December 10. http://www.gao.gov/products/GAO-13-15

DD Service System Initiatives
Statute, policies and procedures in many states affirm that people receiving services cannot be chemically restrained, or prescribed medication that has an impact on behavior, without first conducting an evaluation to determine if there are medical causes for the behavior.
Some states require functional assessments and positive behavior supports be implemented prior to use of medication.
Human Rights Councils review restrictive practices and rights violations, including under what circumstance people can be prescribed multiple psychotropic medications.
Annual service planning allows for review of all treatment regimens and efficacy, and the opportunity to discuss what is least restrictive and most helpful to the person.

DD Service System Initiatives con’t.
Increased care coordination More robust informed consent policies and practices Thorough assessment for potential medical conditions Assess whether behavior or mood disorders are related to
abuse, neglect, or exploitation Cross-analysis with Medicaid paid claims data Enhanced physician education Enhanced state collaboration with community practice
health care practitioners Quality improvement targets
Massachusetts Georgia
State Presentations

MASSACHUSETTS DEPARTMENT OF DEVELOPMENTAL SERVICES
APPROACH TO PSYCHOTROPIC MEDICATION
MANAGEMENT
Gail Grossman Assistant Commissioner of Quality Management, MA DDS
Emily Lauer Consultant Analyst, Center for Developmental Disabilities Evaluation and Research, UMass Medical School

MA Medication Utilization Patterns
Medications are a common intervention in people with ID.
~87% of adults with ID (on Medicaid or Medicaid & Medicare) have one or more prescription within 7 months.
• Adults with ID have substantially more prescriptions filled per year than other Medicaid recipients.
• Utilization increases with age.
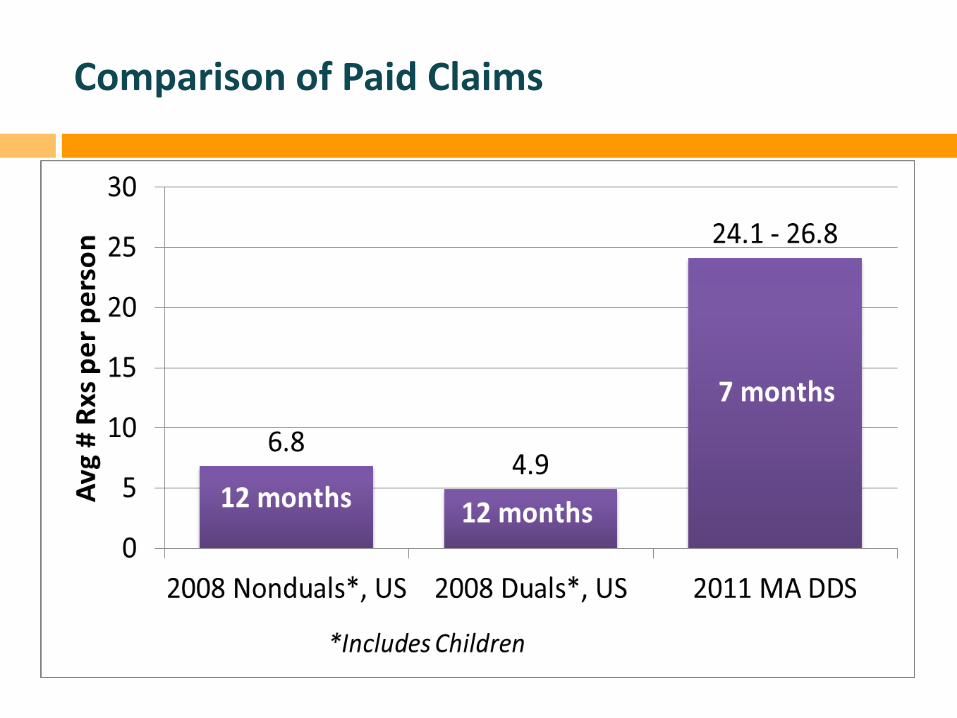
Comparison of Paid Claims

2011 - Top Medication Categories
Rank Category Est. of # MA DDS Adults with 1+ Rx in 7 months All MA Duals3
1 Vitamin/Supplement* 35.1% - 39.0% 5.9% 2 Anticonvulsants 34.6% - 38.5% 9.1% 3 Antibiotics 32.4% - 36.0% <2.2% 4 Antidepressant 25.5% - 28.3% 3.4% 5 Cardiovascular 24.5% - 27.2% 3.4% 6 Analgesic* 24.4% - 27.1% 4.4% 7 Laxatives/Cathartics* 24.2% - 26.9% Unk. 8 Antipsychotics 20.7% - 23.0% 1.7% 9 Gastrointestinal Drugs* 20.2% - 22.5% 2.1%
10 Anxiolytic 19.0% - 21.2% 18.2%
*Includes some OTC medications

2011 - Top Medications
Rank Generic/Brand Name Class
Min. % of Adults
1 Lorazepam/Ativan Antianxiety 11% 2* Prilosec/Omeprazole Gastrointestinal 11%
3 Divalproex sodium/Depakote Anticonvulsant 11% 4* Loratadine Antihistamine 10%
5 Levothyrozine Sodium Thyroid Hormone 9% 6 Risperdal Antipsychotic 8% 7 Clonazepam/Klonopin Anticonvulsant 8% 8 Simvastatin/Zocor Cardiovascular 7% 9 Citalopram/Celexa Antidepressant 6%
10 Fluticasone Propionate/Flonase Corticosteroid 6% 11 Carbamazepine/Tegretol Anticonvulsant 6% 12 Lisinopril Cardiovascular 6%

Psychotropic Medications
Estimated 54-60% of adults on one or more psychotropic medication
18%
15% 12%
7%
4% 2%
1% <1% <1% <1% <1% <1% 0%
5%
10%
15%
20%
1 2 3 4 5 6 7 8 9 10 11 12
Estim
ated
% o
f Pop
ulat
ion
Number of psychotropic medications
2011 Rxs for Adult DDS Population

MA DDS Analysis (2011) Average of 1.4 psychotropic medications (including anticonvulsants) filled per adult. Of people on psychotropics, average of 2.6 different psychotropic medications. More than half of adults receiving anticonvulsants also received 1 or more other psychotropic medication.
Polypharmacy is also common.

Prescribers are not always well prepared to treat the ID population. Majority of medical care from community health care providers.
Communication difficulties may challenge ability to monitor response to medication.
Complex medical picture can result in multiple prescribers.
2004 CAN survey: 53% of medical school deans did not feel their graduates were competent to treat people with N/ID.
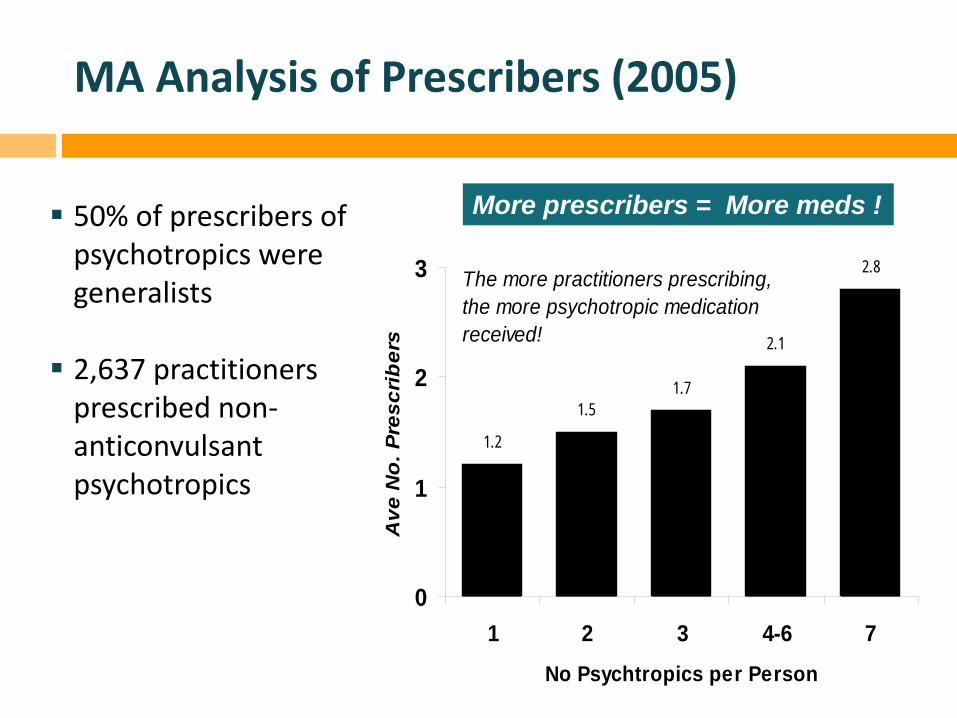
MA Analysis of Prescribers (2005)
50% of prescribers of psychotropics were generalists
2,637 practitioners
prescribed non-anticonvulsant psychotropics
1.2
1.51.7
2.1
2.8
0
1
2
3
1 2 3 4-6 7No Psychtropics per Person
Ave
No
. Pre
scri
ber
s
The more practitioners prescribing,the more psychotropic medicationreceived!
More prescribers = More meds !

MASSACHUSETTS DDS APPROACH
Review on 3 Levels:
1. Individual case review through Medication Consultation Team
2. Targeted outreach to prescribing clinicians
3. Broad outreach regarding practice guidelines and specifically, use of psychotropic medications for people with ID

Medication Consultation Team
Established Medication Consultation Team with a multi-disciplinary approach
Membership includes: Internist Psychiatrist Gerontologist Neurologist
Meets monthly
Registered Nurse & Nurse Practitioner Behavioral Psychologists Clinical Pharmacist
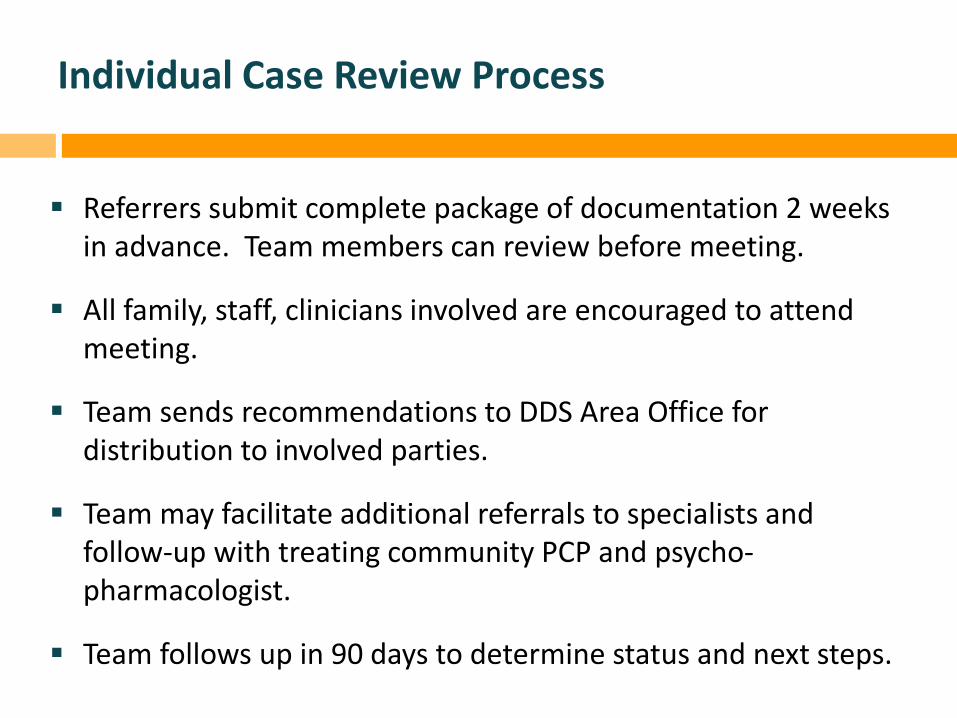
Individual Case Review Process
Referrers submit complete package of documentation 2 weeks in advance. Team members can review before meeting.
All family, staff, clinicians involved are encouraged to attend meeting.
Team sends recommendations to DDS Area Office for distribution to involved parties.
Team may facilitate additional referrals to specialists and follow-up with treating community PCP and psycho-pharmacologist.
Team follows up in 90 days to determine status and next steps.

Individual Case Reviews Preliminary Lessons Learned
Important to stress consultative nature of team to encourage referrals Extremely productive to have clinicians from multiple disciplines; enables
better coordination and problem solving
Referred people: Typically have multiple issues in addition to poly-pharmacy, which may be
the “tip of the iceberg”
May be facing declining health status. Outcomes may focus on quality of life issues.
Role of prescribing physicians: May be hesitant to taper medications. Don’t want to make changes
However well-meaning, tend to add medications when a person is experiencing behavioral or other issues
Try to be responsive to family and/or direct support staff who may be having significant challenges with supporting a person. May lead to increasing medications

Evaluation of Outcomes
Follow-up form developed to measure short and longer term outcomes
Longer Term Changes to physical,
behavioral health
Changes to Quality of life
Improved management by healthcare provider
Caregiver effectiveness in supporting person
Short Term Have recommendations
been followed?
Satisfaction with consultation process
Desired outcomes met?

Outreach to Clinicians
TWO LEVELS: 1. Targeted outreach to prescribing clinicians
Identifies high prescribers and clinicians serving high numbers of people with ID through DDS health care records and Medicaid pharmacy claims data
Letter offering consultation from MCT and/or clinical pharmacist
2. More general outreach to clinicians to share
resources, articles regarding use of psychotropics with people with ID

Next Steps
Analysis of data regarding outcomes of individual case reviews
More in-depth analysis of Medicaid data
Continued outreach to prescribing clinicians
More training and support to caregivers, DDS service providers and service coordinators

Gail Grossman Assistant Commissioner of Quality Management, MA DDS [email protected] Emily Lauer Consultant Analyst, Center for Developmental Disabilities Evaluation and Research, UMass Medical School [email protected]
Massachusetts Contacts

Delmarva Foundation
Psychotropic & Anticonvulsant Medication Use
Individuals Recently Transitioned to the Community (IRTC)
Delmarva Foundation and Georgia Department of Behavioral Health and
Developmental Disabilities
Sue Kelly Eddie Towson

History
National Core Indicators - National average of psychotropic medications is steadily increasing.
Georgia has a history of ranking above the national average (higher utilization of psychotropic meds).
ADA Settlement
Purpose
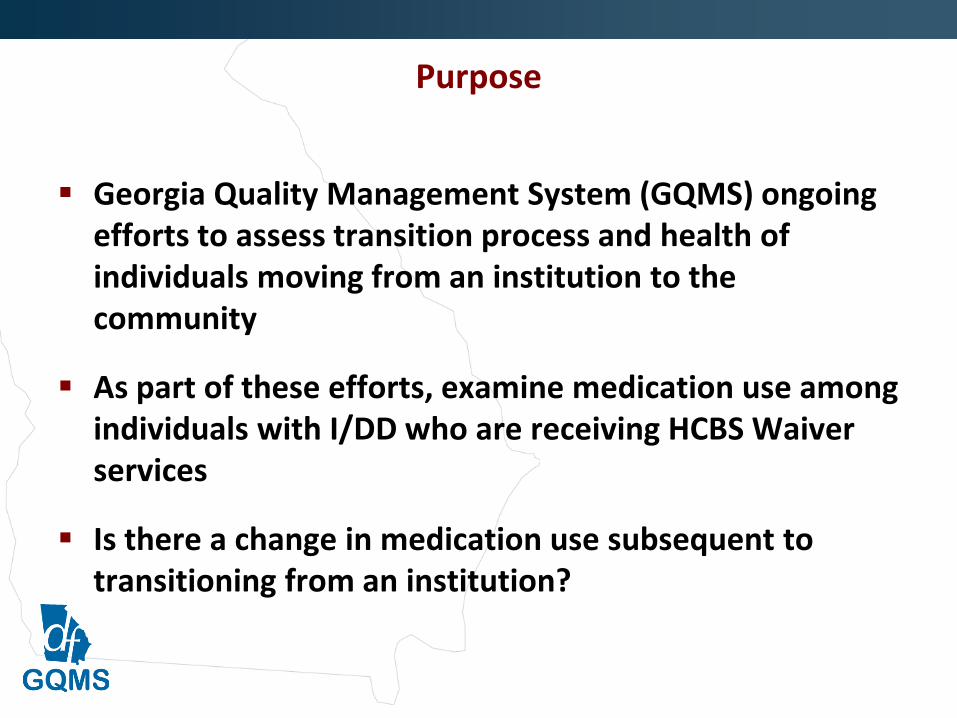
Georgia Quality Management System (GQMS) ongoing efforts to assess transition process and health of individuals moving from an institution to the community
As part of these efforts, examine medication use among individuals with I/DD who are receiving HCBS Waiver services
Is there a change in medication use subsequent to transitioning from an institution?

Methods
Compare IRTC v General I/DD population in community—pre and post transition Average utilization Prevalence rates
Compare prevalence rates on demographic characteristics Race/Ethnicity Gender Disability Residential Setting

Methods
Anchor points for pre/post analysis:
Transition date for IRTC group July 1, 2011 for Comparison group
95% Confidence Levels, +/- 5% used to determine statistical significance

Data
Adults with I/DD receiving HCBS services who:
transitioned to the community between July 2010 and June 2012 (N=325) (IRCT) lived continuously in the community between
January 2010 and December 2012 (N=12,722) (Comparison)
Data
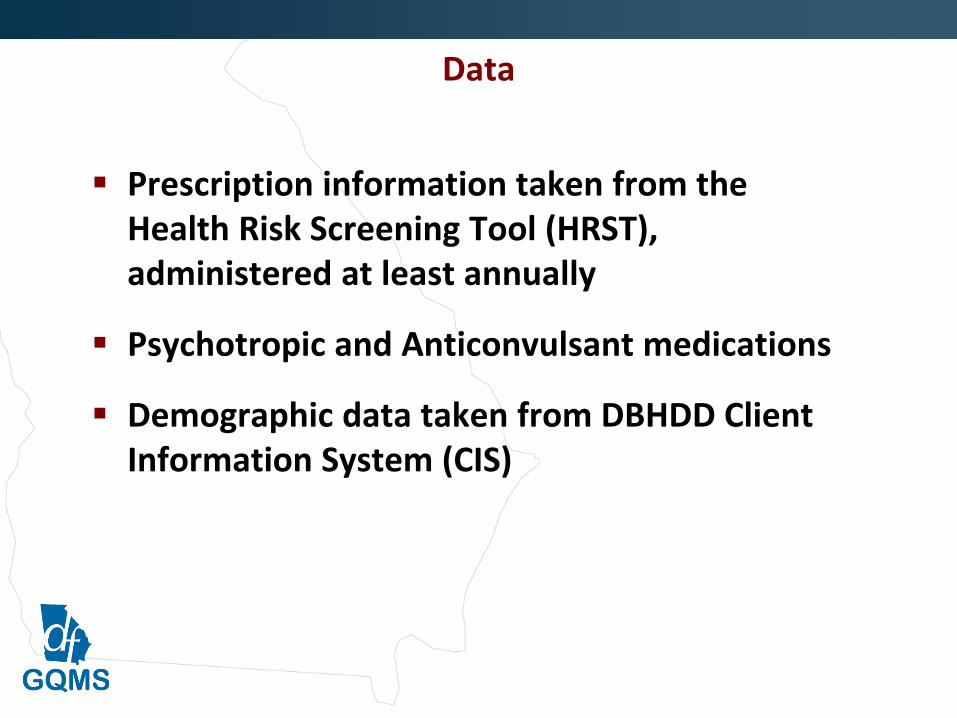
Prescription information taken from the Health Risk Screening Tool (HRST), administered at least annually
Psychotropic and Anticonvulsant medications
Demographic data taken from DBHDD Client Information System (CIS)

Results Demographic Distribution
IRTC Comparison(N=325) (N=12,722)
GenderFemale 35% 42%Male 65% 57%
Home TypeFoster Care or Host Home 15% 8%Group Home 80% 19%Independent Home or Apartment 2% 15%Nursing Facility 1% 1%Parent or Relative's Home 1% 53%

Results Demographic Distribution
IRTC Comparison
(N=325) (N=12,722)RaceAfrican American 37% 45%White 61% 52%Other or Don't know 2% 3%
DisabilityAutism Spectrum Disorder 1% 2%Intellectual Disability 27% 74%Profound Intellectual Disability 72% 23%

Average Number of Medications Both groups show statistically significant increase
1.01 1.09 1.18 1.26 1.31 1.40 1.48 1.56 1.65
1.74 1.83 1.91 1.98
0.68 (6 mo prior) 0.83 (3 mo prior)
1.17 (Transition)
1.84
0.0
0.5
1.0
1.5
2.0
2.5
1/1/2010 4/1/2010 7/1/2010 10/1/2010 1/1/2011 4/1/2011 7/1/2011 10/1/2011 1/1/2012 4/1/2012 7/1/2012 10/1/2012
Mean, Comparison (N=4,371) Mean, IRTC (N=151)

Medication Use Prevalence Rates (Taking >=1) Both groups show statistically significant increase
19% 20% 21% 22% 23% 25% 26% 27% 28% 30% 31% 32% 32%
32% 41% 44%
0%
25%
50%
75%
100%
1/1/2010 4/1/2010 7/1/2010 10/1/2010 1/1/2011 4/1/2011 7/1/2011 10/1/2011 1/1/2012 4/1/2012 7/1/2012 10/1/2012
Comparison (N=12,722) IRTC (N= 325)

Results by Demographic Categories
African American (AA) v White (W)
IRTC Group—AA showed a higher prevalence rate, a 7 point difference in the pre and post transition timeframe
IRTC Group—both demographic groups showed an increase, with a pre to post transition change of 23 percentage points
Comparison Group—AA showed lower prevalence rate, a 2 to 4 point difference in the pre and post transition timeframe
Comparison Group—both demographic groups showed an increase of approximately 13 percentage points

Results by Demographic Categories
Female v Male IRTC Group—males had a higher prevalence rate by
approximately 7 percentage points both pre and post transition
Comparison Group—no gender difference
Intellectual Disability (ID) v Profound ID (PID)
IRTC Group—individuals with ID had a higher prevalence rate than individuals with PID, a difference of 9 points pre and 14 points post transition
Comparison Group—individuals with PID had a higher prevalence rate than individuals with ID, but with smaller differences of 3 to 7 points

Results by Demographic Categories
Residential Setting
95% of the IRTC group transitioned into a group home (80%), foster home, or host home.
Individuals in the Comparison group, in these residential settings, were much more likely to be taking medications, pre and post transition
Differences between the IRTC and Comparison groups are statistically significant

Some Future Work
Examine reasons for the increased medication use over time
for all individuals with I/DD on an HCBS waiver.
Analyze current transition process and modify as needed to ensure providers are trained and prepared for individuals with complex challenges.
Explore the gender and racial/ethnicity disparities identified in this study.
Determine the percent of medications prescribed to individuals with no psychiatric diagnosis, and why.
Identify individuals at high risk who may need medical oversight.

QUESTIONS ? COMMENTS ? INTEREST IN A CROSS POPULATION LEARNING COMMUNITY TO SHARE IDEAS & STRATEGIES ?
What is your state doing to reduce med overuse?

NCI Information & Contacts
NCI website: http://ww.nationalcoreindicators.org
NASDDDS: Mary Lee Fay, Director of NCI, [email protected]
Charles Moseley, Associate Executive Director, [email protected]
HSRI: Val Bradley, President, [email protected]
Julie Bershadsky, Research Associate, [email protected]