Embed Size (px)
DESCRIPTION
I have analysed the Medicare data and costs for obstetric services over the decade since 2003-14 (in some case I have included early data back to 1997-98 to highlight trends over time). The key purpose of this paper is to highlight how little we currently use the available Medicare data to inform both policy making and the updating and reform of health services delivery and financing.
Citation preview

Medicare obstetrics services and costs: an analysis of publicly-available data 2003-04 to 2013-14
Lesley Russell
Adj Associate Professor
Menzies Centre for Health Policy
University of Sydney
March 2015
1

Table of contents
Table of contents.........................................................................................................................................2
Caveats........................................................................................................................................................3
Introduction.................................................................................................................................................4
A note on the Extended Medicare Safety Net.............................................................................................6
Medicare and Australian births...................................................................................................................7
Obstetric services and costs........................................................................................................................8
Medicare labour and delivery costs...........................................................................................................11
Antenatal care...........................................................................................................................................12
Routine..................................................................................................................................................13
Complicated...........................................................................................................................................14
Antenatal cardiotocography..................................................................................................................15
Pregnancy management and planning......................................................................................................17
Increasing use of midwives, Aboriginal Health Workers and nurses.........................................................19
Comments on pregnancy-related diagnostic testing and postnatal care..................................................21
Pregnancy-related diagnostic testing....................................................................................................21
Postnatal care........................................................................................................................................21
Conclusions................................................................................................................................................22
Appendix - data........................................................................................................................................23
2

Caveats
Looking at obstetric services that are billed to Medicare gives a very incomplete picture of how Australian women are receiving and paying for their pregnancy services.
What is not seen includes:
Women who get some or all of their obstetric services from GPs and other providers who do not bill using specific obstetric items;
Women who deliver and receive postnatal care in public hospitals.
It is also not possible to know what antenatal services are delivered as part of outpatient or inpatient care.
I am not an expert on the practice of obstetrics and how specialists are most likely to bill. Therefore I may have made mistakes in my interpretations of the data.
3

Introduction
The key purpose of this paper is to highlight how little we currently use the available Medicare data to inform both policy making and the updating and reform of health services delivery and financing.
I have analysed the Medicare data and costs for obstetric services over the decade since 2003-14 (in some case I have included early data back to 1997-98 to highlight trends over time).
This is an interesting area deserving of more attention and analysis than it currently receives for several reasons: Obstetricians deliver Medicare-funded services to patients in both the community and acute care; There is evidence that surgical interventions and caesarian rates are higher in the private sector
although this does not reflect increased risk; A significant number of obstetricians were seen to be inappropriately rejigging their costs to enable
patients to benefit from the Extended Medicare Safety Net after its introduction in 2004, leading to government curbs;
There have been a number of changes to Medicare items and fees in response to budget blow-outs, although the schedule of Medicare items and fees has not been reviewed or updated in any concerted way to reflect changes in obstetric practice over time.
This is an area where tolerance for risk by both clinicians and patients is low and technology is increasing; and
The schedule of Medicare items and fees has not been reviewed or updated in any concerted way to reflect changes in obstetric practice over time.
I am not aware of any concerted public effort to look at the impacts of these changes and pressures on clinicians, patients and the way obstetrics is practiced.
There is an endless debate about the over-medicalisation of the very natural fact of pregnancy. Australia’s traditional maternity system institutionalises a medical view of pregnancy and birth both in terms of financing arrangements and professional power. Maternity care is funded within a medically dominated, fee-for-service structure and acute hospital budgets. It has been argued that this approach means most mainstream Australian maternity services remain out-of-step with both health service research and evidence-based ‘best practice’. I do not intend to enter this debate except to state that it is important that women are provided with appropriate and affordable choices and that these reflect cultural sensitivities.
It is clear that for many women, especially those who deliver in the private sector, there can be substantial out-of-pocket (OOP) costs for obstetric services. Although the bulk billing rate for obstetric services (41%) is considerably higher than the average rate for specialist services (27%), the average OOP cost per service for those who are not bulk billed is $218. I have previously written on the need to do more to constrain OOP costs for specialist services.
4

Regardless of who oversees a woman’s pregnancy, childbirth and post-natal care, and where the woman decides to deliver her baby, this episode in the life of a woman and her child / children is critical for their future health and wellbeing. This requires that all appropriate tests and screenings are done and the pregnancy, delivery and post-natal care is well planned and well managed by the appropriate team, focused on the mother’s needs.
It also means that there are unexplored opportunities for Medicare to look at different, more efficient and more cost-effective ways to deliver and finance obstetrics care.
The aim of this paper is to instigate discussion, further and more detailed analyses, and curiosity and interest about what is happening with the delivery and financing of our health care system in this important area. I hope that my work will encourage others with data and evaluations to enter the discussion so that Australian health care funders (both public and private) and policy makers have the best evidence on which to base their policies and programs. Only then can we hope to develop and find support for reforms that will benefit public and private health funders, clinicians and health care professionals, and – most especially – mothers and children.
5

A note on the Extended Medicare Safety Net
The Extended Medicare Safety Net (EMSN) provides an additional rebate for Australians who incur out-of-pocket (OOP) costs for Medicare-eligible out-of-hospital services. Once the relevant annual threshold has been met, Medicare will pay for 80% of any future OOP costs for out-of-hospital Medicare services for the remainder of the calendar year. However, there is an upper limit on the amount of benefit that can be paid under the EMSN for a number of Medicare services, including obstetrics.
The 2015 EMSN thresholds are:
$638.40 for Commonwealth concession cardholders, including those with a Pensioner Concession Card, a Health Care Card or a Commonwealth Seniors Card, and people who receive Family Tax Benefit (Part A); and
$2,000 for all other families and singles.
With the introduction of EMSN capping on 1 January 2010, a number of structural changes were made to obstetrics services, including the introduction of new items and changes to Medicare rebates. The base Medicare rebates for 15 obstetrics items was increased at a cost of $157.6 million over four years; rebates for obstetrics attendance items were increased by 10% and labour and delivery items were increased by 30%. In addition the fee for planning and management of a pregnancy was increased significantly. The existing planning and management of labour item (16590) for medical practitioners who intend to undertake the delivery of a privately admitted patient was increased by 150% (from $122.50 to the $306.30) and a new planning and management item (16591) was introduced for medical practitioners who do not intend to be involved in the delivery.
6

Medicare and Australian births
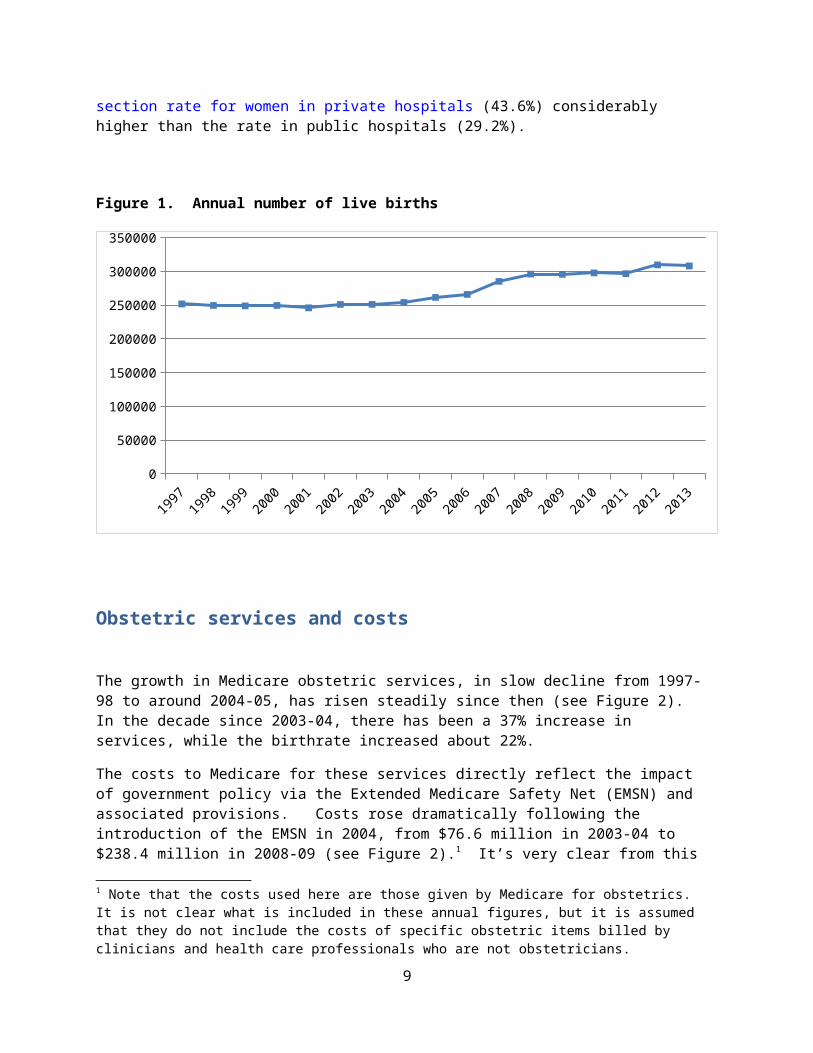
In 2013 there were 308,065 live births in Australia (ABS data). The number of births rose from a plateau of around 250,000 over the years 2005-08 (this is usually attributed to the Howard- Costello baby bonus payments) and then reached the current plateau of around 300,000 in 2012-13 (see Figure 1).
Australian Institute of Health and Welfare data show that in 2012, 97% of births were in hospital; of these 29% were in public hospitals and 31.4% were delivered to patients with private cover. These data reflect almost exactly those from the 4-year period 2001-04, so we can assume little change over the decade under consideration.
If the total of services for labour and delivery is assumed to represent the number of women giving birth in the private system , then there is a reasonable correlation of these research findings with the data I am using. For example, in 2013 there were 308,065 live births (fewer deliveries as this includes multiple births), and in CY 2013 there 88,593 services billed for labour and delivery (some of which may not have resulted in a live birth).
Women delivering in private hospitals have a higher mean age and are more likely to be having their first baby. Larger proportions of Indigenous women and those who lived outside major cities deliver in public hospitals. Australia has high rates of medical and surgical intervention (including caesarean section) during birth, especially in private hospitals. Of women who gave birth in hospitals in Australia in 2012, 33.4% had a caesarean section delivery, with the caesarean section rate for women in private hospitals (43.6%) considerably higher than the rate in public hospitals (29.2%).
Figure 1. Annual number of live births
1997 1998 1999 2000 2001 2002 2003 2004 2005 2006 2007 2008 2009 2010 2011 2012 20130
50000
100000
150000
200000
250000
300000
350000
7

Obstetric services and costs
The growth in Medicare obstetric services, in slow decline from 1997-98 to around 2004-05, has risen steadily since then (see Figure 2). In the decade since 2003-04, there has been a 37% increase in services, while the birthrate increased about 22%.
The costs to Medicare for these services directly reflect the impact of government policy via the Extended Medicare Safety Net (EMSN) and associated provisions. Costs rose dramatically following the introduction of the EMSN in 2004, from $76.6 million in 2003-04 to $238.4 million in 2008-09 (see Figure 2).1 It’s very clear from this huge growth in costs why the government of the day was impelled to act to limit the reimbursement of out-of-pocket costs under the EMSN. Costs now are continuing to rise but in much more slowly, in a way that is related to the services delivered.
A rough ‘back-of-the-envelope’ estimate of the number of services / birth obtained by using the number of labour and delivery services as an indicator is that these have risen from 17 to 25 over the decade 2003-04 to 2013-14 and that Medicare costs / birth have risen from $920 to $2,300.
Figure 2: Medicare obstetrics costs and services
1997-98
1998-99
1999-00
2000-01
2001-02
2002-03
2003-04
2004-05
2005-06
2006-07
2007-08
2008-09
2009-10
2010-11
2011-12
2012-13
2013-140
50
100
150
200
250
300
0
0.5
1
1.5
2
2.5
servicescosts
Cost
s $m
illio
Serv
ices m
illio
n
Although the costs reflect the changes in EMSN policy with startling accuracy, not all the costs graphed in Figure 2 are due to out-of-hospital services (the only costs which count towards the EMSN threshold).
1 Note that the costs used here are those given by Medicare for obstetrics. It is not clear what is included in these annual figures, but it is assumed that they do not include the costs of specific obstetric items billed by clinicians and health care professionals who are not obstetricians.
8
This paper analyses costs for antenatal care, planning and management of pregnancy and delivery, labour and delivery, postnatal care, pregnancy-related diagnostic services and obstetric services delivered by midwives, Aboriginal Health Workers (AHWS) and nurses. The total of these is more that the total given for Medicare obstetric costs: 10% more in 2013-14, and 5% more in 2008-09, before the impact of EMSN changes, so likely reflecting an increased use of obstetric items by GPs and midwives.
Figure 3: Costs for obstetrics categories of care
2003-04
2004-05
2005-06
2006-07
2007-08
2008-09
2009-10
2010-11
2011-12
2012-13
2013-14
0
50
100
150
200
250
300
totalantenatal caremanagementlabour & deliverypostnatal carediagnostic servicesnonmedical care
$ m
illio
ns
9

As Figure 3 highlights, the biggest impact on Medicare obstetric costs over the past decade has been due essentially to one MBS item, 16590 (which was later divided and so now also includes item 16591). While these costs have now been substantially reined in from Medicare’s perspective, there is every reason to believe that vulnerable women, wanting the best for themselves and their babies, are continuing to pay substantial sums OOP for this aspect of their care.
Rewarding obstetricians for focusing on the needs of their patients and working in partnership with other members of the obstetrics team is laudable. But is this what is happening via these management items? We have no idea whether women with a management plan receive better care, are more satisfied with their care and if they and their babies have better outcomes. There is certainly no data to link higher Medicare charges and OOP costs with better safety and quality.
10

Medicare labour and delivery costs
For a woman giving birth as a private patient who has the same doctor at her birthing as she has seen throughout her pregnancy, and regardless of whether she has a c-section, the MBS item most applicable is 16519 (for which in 2015 Medicare reimburses 75% of $693.95). If there is a risk to the health of the mother or the child or there is a multiple birth, then the most applicable MBS item is 16522 (Medicare reimbursement 75% of $1629.35). Both these items include postpartum care. Reimbursement rates are less if the doctor present at delivery has not previously managed the patients.
As Figure 4 shows, the total number of Medicare-reimbursed labor and delivery services has declined slowly since 2009-10. Thus the increase of deliveries in the private sector seen in 1997 following the introduction of PHI incentives has not continued over time. It’s possible this recent decrease reflects more women choosing to give birth in the public system, perhaps because of concern about OOP costs.
Figure 4. Medicare-reimbursed labour and delivery services
2003-04
2004-05
2005-06
2006-07
2007-08
2008-09
2009-10
2010-11
2011-12
2012-13
2013-14
0
10000
20000
30000
40000
50000
60000
70000
80000
90000
100000
Item 16522Item 16519Total servicesSe
rvice
Figure 2 shows that an increasing proportion of deliveries are billed as more complicated (item 16522, fee is $1629.35) and receive a higher reimbursement rate than an uncomplicated birth (item 16519, fee is $693.95), regardless of whether a c-section is performed. If this trend continues, the majority of private births will soon be billed as complicated.
11

With older mothers and more multiple pregnancies via IVF this could be due to an increasing number of more risky births. But as the analyses in the next section shows, there is little indication of this in the antenatal items that are billed. So more likely it represents specialist obstetricians billing at the highest rate to maximize their income. This argument is supported by the fact that this trend is heightened post 2009-10 when constraints on reimbursements under the EMSN were introduced.
There is some basis for arguing that Medicare reimbursements for delivery and 5-7 days post-partum care do not adequately reflect the specialist’s time and skill (assuming of course they personally deliver this care and do not rely upon nurses, midwives and registrars), although it should be noted that the MBS fees for these items were increased by 30% in 2010.
The consequences for patients, especially those who do not have no-gap PHI cover, are large out-of-pocket costs. The AMA says that the MBS fee for delivering a baby represents only 18% of the recommended AMA fee and many specialists charge more than the AMA fee.
12

Antenatal care
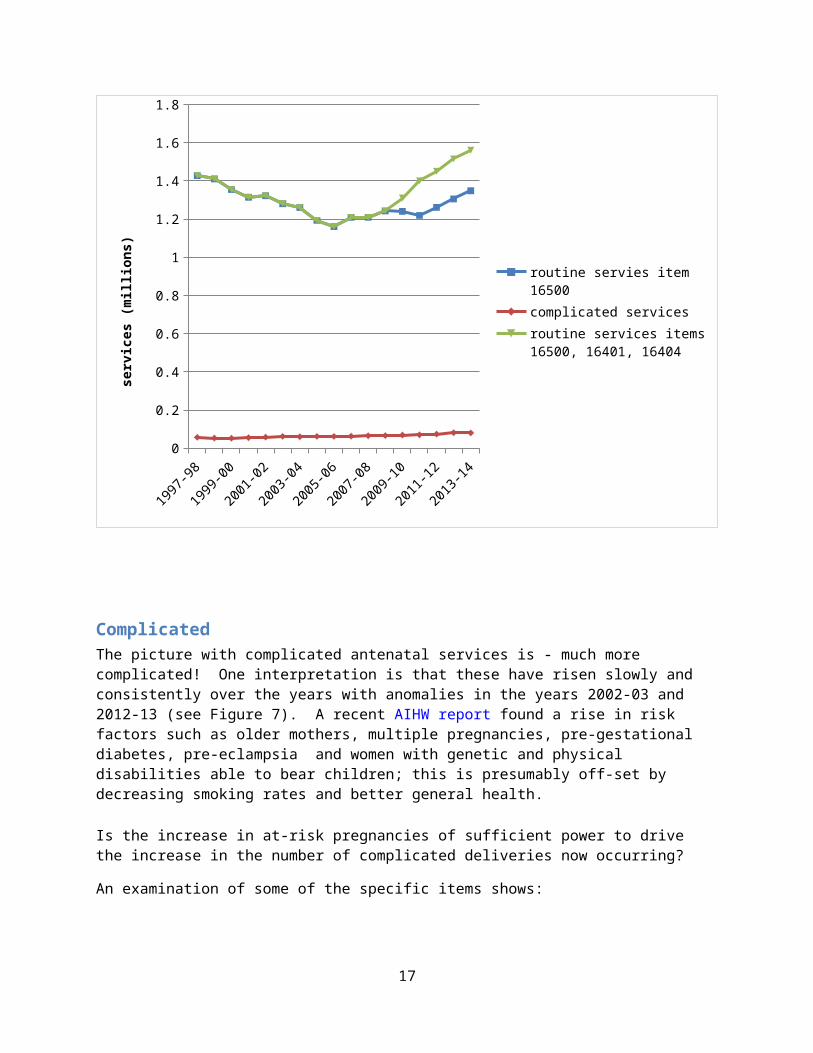
Routine The number of routine antenatal visits (item 16500) was surprisingly constant over the period 2003-04 to 2011-12, with small increases seen in each of the years 2011-12 to 2013-14 (see Figure 5).
Note that this item can also be used by those GPs who participate in shared care. It is likely that the increases noted in recent years reflect a move to shared care.
Figure 5: Routine and complicated antenatal care - 1
1997-98
1998-99
1999-00
2000-01
2001-02
2002-03
2003-04
2004-05
2005-06
2006-07
2007-08
2008-09
2009-10
2010-11
2011-12
2012-13
2013-140
0.2
0.4
0.6
0.8
1
1.2
1.4
1.6
routine servicescomplicated services
serv
ices (
mill
ion)
However a more accurate measure of routine antenatal care should probably also include the services provided by obstetricians and billed under MBS items 16401 and 16404 (see Figure 6). These items pay the same as specialist MBS items 104 and 105 but are subject to the EMSN. There is no way to know how many items now billed as 16401 and 16404 were previously (prior to January 2010) billed as 104 and 105.
13
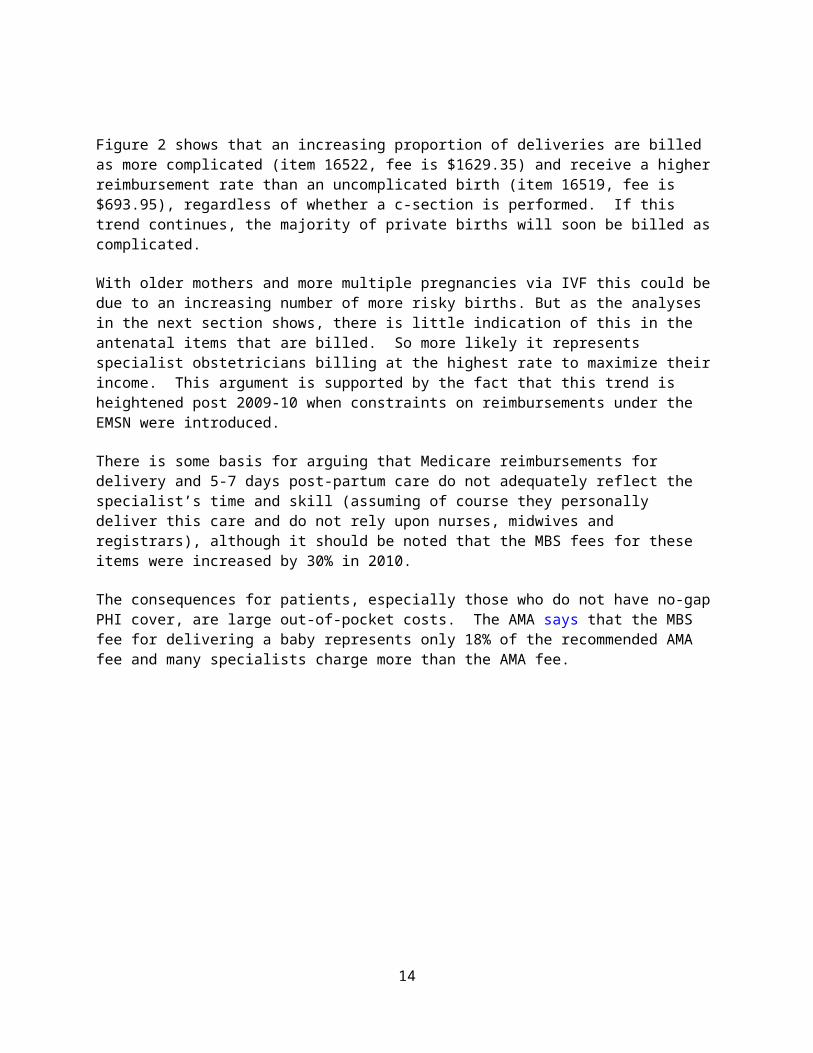
Figure 6: Routine and complicated antenatal care - 2
1997-98
1998-99
1999-00
2000-01
2001-02
2002-03
2003-04
2004-05
2005-06
2006-07
2007-08
2008-09
2009-10
2010-11
2011-12
2012-13
2013-140
0.2
0.4
0.6
0.8
1
1.2
1.4
1.6
1.8
routine servies item 16500complicated servicesroutine services items 16500, 16401, 16404
serv
ices (
mill
ions
)
Complicated The picture with complicated antenatal services is - much more complicated! One interpretation is that these have risen slowly and consistently over the years with anomalies in the years 2002-03 and 2012-13 (see Figure 7). A recent AIHW report found a rise in risk factors such as older mothers, multiple pregnancies, pre-gestational diabetes, pre-eclampsia and women with genetic and physical disabilities able to bear children; this is presumably off-set by decreasing smoking rates and better general health.
Is the increase in at-risk pregnancies of sufficient power to drive the increase in the number of complicated deliveries now occurring?
An examination of some of the specific items shows:
There has been a 2.7 fold increase in the number of external cephalic versions for breech presentation (item 16501) over the past decade;
14
There has been a decline in the number of cases of threatened abortion, miscarriage or hyperemesis gravidarum requiring admission to hospital (item 16505);
There has been a decline in pre-eclampsia, eclampsia and antepartum haemorrhage that require admission to hospital (item 16509);
There may be some unrecognised confounding factors here.
Figure 7. Complicated antenatal care
1997-98
1998-99
1999-00
2000-01
2001-02
2002-03
2003-04
2004-05
2005-06
2006-07
2007-08
2008-09
2009-10
2010-11
2011-12
2012-13
2013-14
0
0.01
0.02
0.03
0.04
0.05
0.06
0.07
0.08
0.09
serv
ices (
mill
ion)
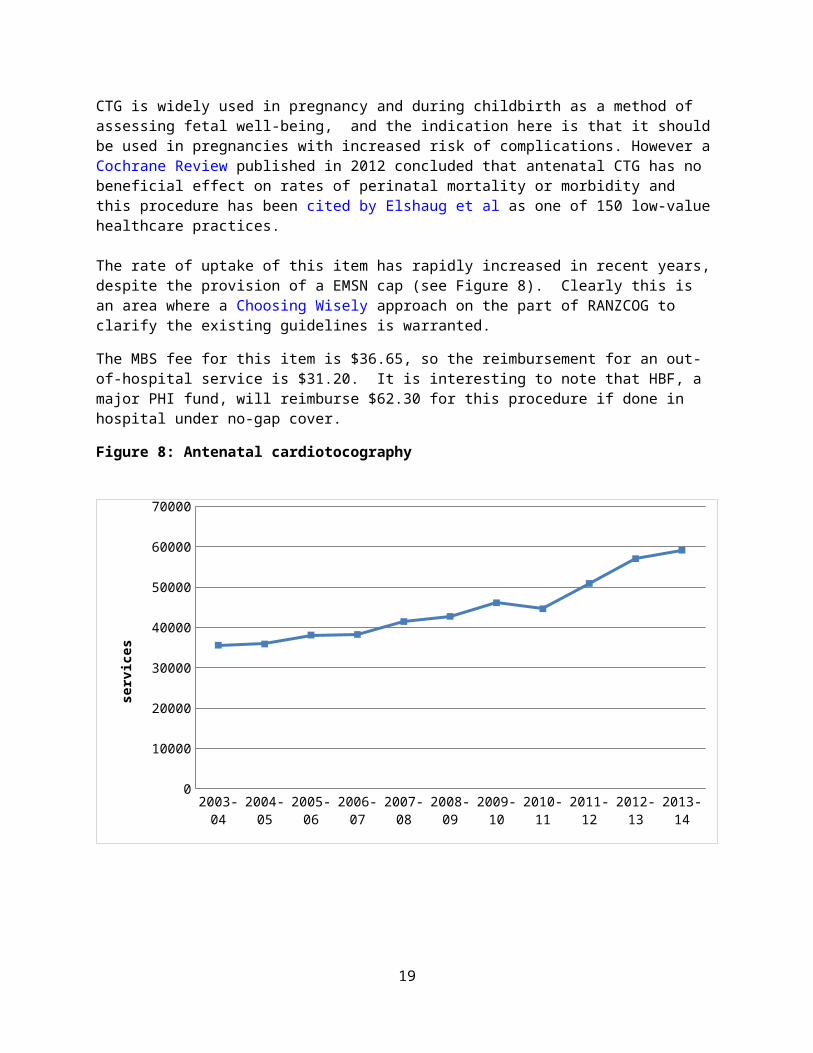
Antenatal cardiotocographyIncluded in the Medicare items for complicated antenatal care is 16514 which covers antenatal cardiotocography (CTG) - is a continuous recording of the fetal heart rate obtained via an ultrasound transducer placed on the mother's abdomen.
CTG is widely used in pregnancy and during childbirth as a method of assessing fetal well-being, and the indication here is that it should be used in pregnancies with increased risk of complications. However a Cochrane Review published in 2012 concluded that antenatal CTG has no beneficial effect on rates of perinatal mortality or morbidity and this procedure has been cited by Elshaug et al as one of 150 low-value healthcare practices.
The rate of uptake of this item has rapidly increased in recent years, despite the provision of a EMSN cap (see Figure 8). Clearly this is an area where a Choosing Wisely approach on the part of RANZCOG to clarify the existing guidelines is warranted.
15

The MBS fee for this item is $36.65, so the reimbursement for an out-of-hospital service is $31.20. It is interesting to note that HBF, a major PHI fund, will reimburse $62.30 for this procedure if done in hospital under no-gap cover.
Figure 8: Antenatal cardiotocography
2003-04
2004-05
2005-06
2006-07
2007-08
2008-09
2009-10
2010-11
2011-12
2012-13
2013-14
0
10000
20000
30000
40000
50000
60000
70000
serv
ices
16
Pregnancy management and planning
On 1 January 2010, MBS item 16590 for the planning and management of a pregnancy was split into two items. Item 16590 is claimable for planning and managing a pregnancy that has progressed beyond 20 weeks where the practitioner intends to perform the labour and delivery. Item 16591 is claimable for planning and managing a pregnancy that has progressed beyond 20 weeks where the practitioner does not intend to perform the labour and delivery.
There has been a steady rise in the number of specialist visits for pregnancy planning and management, using these items, which are relatively well reimbursed (see Figure 9). There appears to be no analyses of the uptake of these items and whether they deliver improved outcomes. In particular it is interesting to note how item 16591 is being used and what the implications are for this.
Figure 9: Use of Medicare items for pregnancy planning and management
2004-05
2005-06
2006-07
2007-08
2008-09
2009-10
2010-11
2011-12
2012-13
2013-14
0
0.02
0.04
0.06
0.08
0.1
0.12
0.14
0.16
item 16590item 16591total
serv
ices (
mill
ions
)
17

The policy and reimbursement changes have had a major impact in controlling costs in this area; the total Medicare cost of these two items in 2013-14 was $48.4 million, compared to $130.4 million for item 16590 alone in 2008-09. It can be argued that these items and the reimbursement rates for them have been used as political levers by governments and as income boosters by obstetricians. A google search of the internet turns up many discussion forums where pregnant women share information about the charges and OOP costs for pregnancy management and planning.
18
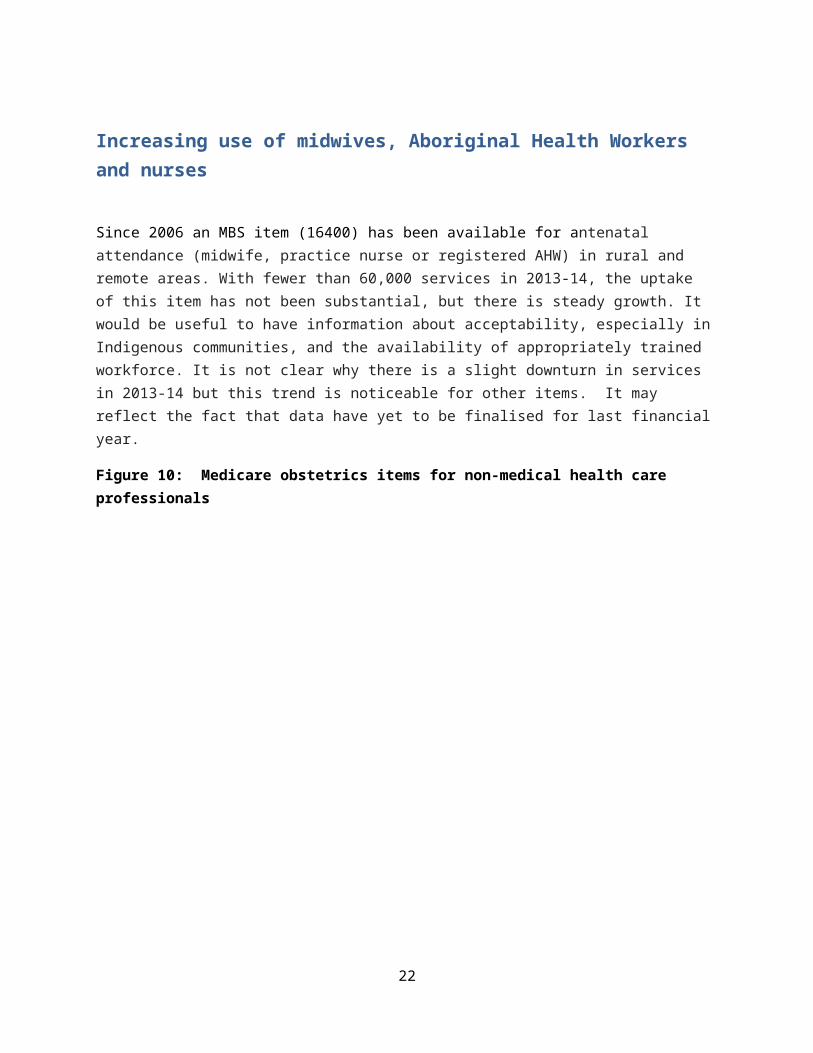
Increasing use of midwives, Aboriginal Health Workers and nurses
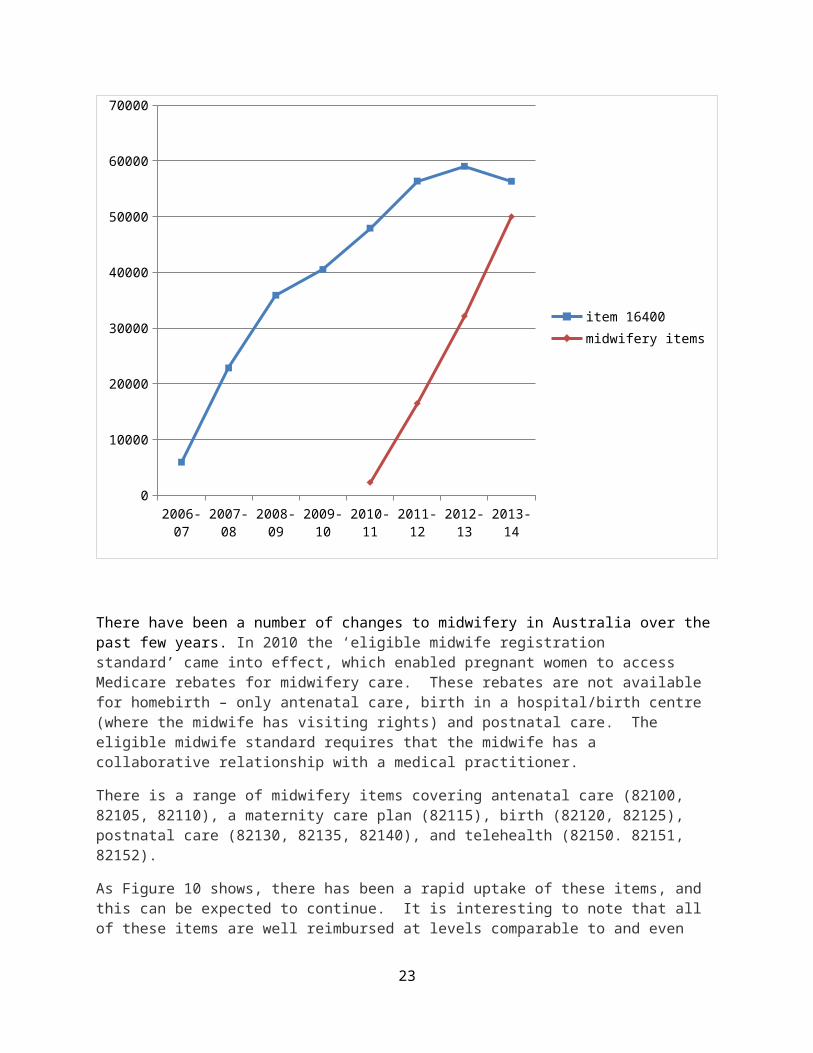
Since 2006 an MBS item (16400) has been available for antenatal attendance (midwife, practice nurse or registered AHW) in rural and remote areas. With fewer than 60,000 services in 2013-14, the uptake of this item has not been substantial, but there is steady growth. It would be useful to have information about acceptability, especially in Indigenous communities, and the availability of appropriately trained workforce. It is not clear why there is a slight downturn in services in 2013-14 but this trend is noticeable for other items. It may reflect the fact that data have yet to be finalised for last financial year.
Figure 10: Medicare obstetrics items for non-medical health care professionals
2006-07 2007-08 2008-09 2009-10 2010-11 2011-12 2012-13 2013-140
10000
20000
30000
40000
50000
60000
70000
item 16400midwifery items
There have been a number of changes to midwifery in Australia over the past few years. In 2010 the ‘eligible midwife registration standard’ came into effect, which enabled pregnant women to access Medicare rebates for midwifery care. These rebates are not available for homebirth – only antenatal care, birth in a hospital/birth centre (where the midwife has visiting rights) and postnatal care. The
19

eligible midwife standard requires that the midwife has a collaborative relationship with a medical practitioner.
There is a range of midwifery items covering antenatal care (82100, 82105, 82110), a maternity care plan (82115), birth (82120, 82125), postnatal care (82130, 82135, 82140), and telehealth (82150. 82151, 82152).
As Figure 10 shows, there has been a rapid uptake of these items, and this can be expected to continue. It is interesting to note that all of these items are well reimbursed at levels comparable to and even above those for specialists (although a midwife spends much more time with their patient). Even so, there is already a marked tendency for midwives to bill using the higher paid items. This may reflect the fact that they and the women they look after need and value the time and consultation spent together. But to date we have no evaluations to inform us, and likewise no knowledge about the OOP costs faced by women who use midwives.
On the assumption that every woman whose pregnancy is managed by a midwife has a management plan (item 82115), 3920 women used a midwife in 2013-14. This might be an over-estimate because only 2543 services were billed for an initial visit. Moreover, in that year there were only 467 services for confinement billed by midwives. This suggests team work arrangements with obstetricians.
20

Comments on pregnancy-related diagnostic testing and postnatal care
Pregnancy-related diagnostic testingAlthough the costs are not high, the cost of pregnancy-specific diagnostic services has almost doubled ). over the past decade. The biggest cost in this area comes from item 55700 (ultrasounds). Interestingly, there is a decrease in the number of oral glucose challenge tests ordered to detect gestational diabetes, despite this being cited by the AIHW as an increasing risk factor.
Postnatal care The use of these Medicare items is very low and has changed little over the past decade. Hopefully this represents the quality and safety inherent in the Australian system. However it is possible that these data do not pick up the women who return for problems after the immediate postnatal period.
21
Conclusions
Childbirth is the single most important reason for hospitalization in Australia and accounts for the highest number of occupied bed days. It is important to ensure that Medicare funds spent to provide a variety of choices of models care for pregnant women are spent as effectively and efficiently as possible. There is currently a level of unexplained variation that exists in the care of obstetrics patients that contributes to poorer quality care and unnecessary healthcare costs.
Australian Medicare data are not designed to evaluate the effectiveness of healthcare programs; they are derived for administrative and financial purposes. Nevertheless there has been too little interest in Australia in using these data to question the design and funding of healthcare programs.
Australia is making small steps towards the implementation of new ways to provide and fund obstetric care but much more needs to be done. This effort needs to involve all stakeholders.
I hope that this preliminary work will stimulate more. If you disagree with my findings, then please counter with your own evidence-based case.
22
Appendix - data
23

MEDICARE OBSTETRICS SERVICES AND COSTS (Data from Medicare Australia website)
Item Med. Reimbur(2014)
2003-04 2004-05 2005-06 2006-07 2007-08 2008-09 2009-10 2010-11 2011-12 2012-13 2013-14
OBSTETRICSSERVICES (mill) 1.418 1.429 1.432 1.499 1.524 1.877 1.659 1.746 1.824 1.893 1.942COST2 $76.6m $141.6m $163.2m $185.1m $211.3m $238.4m $238.9m $182.5m $190.6m $198.5m $201.3m
1. Antenatal carea. routine165003 $47.15* 1.260m 1.193m 1.160m 1.209m 1.209m 1.242m 1.240m 1.219m 1.261m 1.305m 1.348m16401 $85.55* - - - - - - 33,805 91,551 102,759 107,525 113,57616404 $43.00* - - - - - - 36,782 84,040 90,105 97,528 100,231b. complicated16501 $140.55* 270 274 342 352 361 362 570 655 582 724 72316502 $47.15* 5756 5409 5949 6769 6415 7129 6615 7046 7205 6723 685016504 $47.15* 60 49 90 43 59 80 120 128 123 111 5416505 $47.15* 3328 3152 2844 2529 2884 2048 1947 2159 1888 1858 168316508 $47.15* 6378 7245 6882 6109 7078 6781 6933 6288 6515 7264 636616509 $47.15* 8284 8125 7238 7051 7097 6548 6081 6131 5692 6136 531516511 $219.95* 348 340 353 390 412 442 455 447 464 484 47816512 $63.50* 185 170 206 195 205 251 254 246 259 267 269c. antenatal cardiotocography16514 $36.65* 35562 35886 38085 38255 41426 42717 46090 44614 50879 57036 59140Totalservices
1.320m 1.255m 1.222m 1.272m 1.274m 1.308m 1.379m 1.464m 1.527m 1.591m 1.642m
Totalcost
$36.3m $55.7m $45.2m $50.1m $52.7m $56.2m $62.1m $67.5m $71.9m $75.9m $78.4m
2 Note this is the total Medicare cost for obstetrics provided by Medicare. The total cost of the services analysed here is greater. Presumably this reflects the billings of GPs, midwives, AHWs and nurses.3 Can be used by GP or specialist
24
Item Med Reimbur(2014)
2003-04 2004-05 2005-06 2006-07 2007-08 2008-09 2009-10 2010-11 2011-12 2012-13 2013-14
d. management16590 $324.10* - 76830 108732 119369 122975 126845 120867 104970 106513 105365 10175616591 $142.65* - - - - - - 10,488 26,022 30,975 35,873 42,256Total Services
- 76830 188732 119369 122975 126845 131355 130992 137488 141238 144013
Total Cost
- $4.4m $73.9m $88.8m $109.4m $130.4m $115.9m $45.9m $47.7m $48.7m $48.5m
2. Labour and delivery16515 $450.65* 66 64 54 77 72 79 60 89 74 59 5216518 $450.65* 300 332 329 277 334 368 354 449 369 432 38116519 $693.95* 55542 54631 57158 58065 57978 58848 58957 55669 53872 52437 50549165204 $811.05* 259 288 263 297 312 316 299 392 378 413 43716522 $1629.35* 26879 27390 28472 29290 30959 31874 33601 33279 34001 35805 36578Totalservices
83044 82705 86276 88006 89655 91485 93271 89878 88694 89146 87997
Totalcost
$39.2m $40.3m $42.9m $44.7m $46.4m $49.6m $58.5m $66.m $68.2m $71.0m $71.5m
Item Med 2003-04 2004-05 2005-06 2006-07 2007-08 2008-09 2009-10 2010-11 2011-12 2012-13 2013-14
4 This item is for a Caesarian section, but C-sections can also be done under 16519 and 16522.
25

Reimbur(2014)
3. Postnatal care5
16564 $218.00# 1196 1137 1093 1154 1131 1217 1132 1173 1118 1155 106516567 $318.00# 297 376 363 379 369 439 473 451 516 543 59516570 $416 .05# 8 12 6 8 13 7 12 9 12 8 916571 $318.80# 21 20 16 18 25 20 18 19 24 16 1816573 $259.80# 218 209 199 224 286 308 373 349 311 351 343Totalservices
1740 1754 1677 1783 1824 1991 2008 2001 1981 2073 2030
Totalcost
$0.25m $0.27m $0.26m $0.28m $0.3m $0.33m $0.35m $0.35m $0.36m $0.38m $0.38m
4. Pregnancy specific diagnostic services6
55700 $60.00* 135000 150197 162827 175128 187044 202292 221670 240191 260157 266869 28678259503 $89.40* 128 103 65 53 66 61 38 37 38 27 3266545 $15.80* 114865 122208 134162 141764 141229 14140 144021 135974 131028 113857 9310073527 $10.00* 185026 174728 169822 168219 167151 163269 150521 146906 133489 122000 109493Totalservices
435019 447236 466876 485164 495490 506762 516250 523108 524712 502753 489407
Totalcost
$10.0m $11.3m $12.2m $12.8m $13.6m $14.4m $15.9m $16.6m $17.6m $17.6m $18.2m
.
5 These items are only for surgical care after childbirth
6 Not all of these services (especially 73527 – pregnancy test) would be ordered solely by obstetricians.
26

Item Med Reimbur(2014)
2003-04 2004-05 2005-06 2006-07 2007-08 2008-09 2009-10 2010-11 2011-12 2012-13 2013-14
4. Non-medical carea. Midwives
82100 $53.40* - - - - - - - 167 1048 1590 254382105 $32.30* - - - - - - - 232 4583 8215 1010582110 $53.40* - - - - - - - 754 5168 9454 1510482115 $319.00^ - - - - - - - 166 841 2289 392082120 $753.00# - - - - - - - 4 48 138 28482125 $753.00# - - - - - - - 3 104 76 18382130 $53.40* - - - - - - - 203 521 1012 145582135 $78.50* - - - - - - - 735 4017 8978 1585282140 $53.40* - - - - - - - 35 236 328 63282150 $28.30^ - - - - - - - - 4 5 -182151 $53.70^ - - - - - - - - 5 3 882152 $78.95^ - - - - - - - - - 16 1Total services
- - - - - - - 2296 16474 32132 49979
Total cost - - - - - - - $0.15m $1.03m $2.26m $4.07m
b. Nurses, Aboriginal Health Workers, Midwives16400 $27.25* - - - 5916 22825 35868 40499 47910 56363 59012 56323Cost $0.1m $0.5m $0.7m $0.9m $1.1m $1.3m $1.4m $1.3m
^ 85% of MBS fee
* 85% of MBS fee ; 75% of fee is payable if these services are provided to an admitted patient
# 75% of MBS fee
27

28