Embed Size (px)
Citation preview
Medicare and Medicaid Audit Sampling Strategies Developing Sampling Plans and Challenging Flawed CMS Audit Samples
Today’s faculty features:
1pm Eastern | 12pm Central | 11am Mountain | 10am Pacific
The audio portion of the conference may be accessed via the telephone or by using your computer's
speakers. Please refer to the instructions emailed to registrants for additional information. If you
have any questions, please contact Customer Service at 1-800-926-7926 ext. 10.
TUESDAY, AUGUST 14, 2012
Presenting a live 90-minute webinar with interactive Q&A
Anna M. Grizzle, Member, Bass Berry & Sims, Nashville, Tenn.
Patricia L. Maykuth, Ph.D, President, Research Design Associates, Decatur, Ga.

Sound Quality
If you are listening via your computer speakers, please note that the quality of
your sound will vary depending on the speed and quality of your internet
connection.
If the sound quality is not satisfactory and you are listening via your computer
speakers, you may listen via the phone: dial 1-866-370-2805 and enter your
PIN -when prompted. Otherwise, please send us a chat or e-mail
[email protected] immediately so we can address the problem.
If you dialed in and have any difficulties during the call, press *0 for assistance.
Viewing Quality
To maximize your screen, press the F11 key on your keyboard. To exit full screen,
press the F11 key again.

For CLE purposes, please let us know how many people are listening at your
location by completing each of the following steps:
• In the chat box, type (1) your company name and (2) the number of
attendees at your location
• Click the word balloon button to send
FOR LIVE EVENT ONLY

Medicare and Medicaid Audit Sampling Strategies
Anna M. Grizzle
Partner
Bass, Berry & Sims PLC
Patricia Maykuth, Ph.D.
President
Research Design Associates, Inc.
August 14, 2012

Agenda
• When is statistical sampling and extrapolation used?
• What is the legal basis for statistical sampling and extrapolation?
• How is statistical sampling and extrapolation performed?
• How can I defend against extrapolated overpayment results?
5
Use of Statistical Sampling for Overpayment Estimation
• Acceptable tool in different audits: Medicare, Medicaid, tax, financial statements, etc.
• Appropriate when records are too voluminous for individual review
• Used in Medicare overpayment reviews since the 1970’s
6

Use of Statistical Sampling for Overpayment Estimation
• CMS overpayment audit
• OIG self-disclosure protocol
• Internal compliance audit
7

Legal Basis for Statistical Sampling for Overpayment Estimation
“The use of statistical sampling to project an overpayment. . . does not deny a provider or supplier due process. Neither the statute nor regulations require that a case-by-case review be conducted in order to determine that a provider or supplier has been overpaid and to determine the amount of overpayment.”
HCFA Ruling 86-1
8

Legal Basis for Statistical Sampling for Overpayment Estimation
Statistical sampling does not violate due process “so long as extrapolation is made from a representative sample and is statistically significant.”
Chaves County Home Health Service, Inc. v. Sullivan, 931 F.2d 914 (D.C. Cir. 1991), cert. denied, 402 U.S. 1091 (1992).
9

Legal Basis for Medicare Statistical Sampling and Extrapolation
A Medicare contractor may not use extrapolation to determine overpayment amounts . . . unless . . .
– There is a sustained or high level of payment error; or
– Documented educational intervention has failed to correct the payment error
42 U.S.C. §1395ddd(f)(3)
10

Legal Basis for Medicare Statistical Sampling and Extrapolation
• Sustained or high level of payment error can be determined by: – Error rate determinations by MR unit, ZPIC
– Probe samples
– Data analysis
– Provider/supplier history
– Information from law enforcement investigations
– Allegations of wrongdoing by current or former employees of provider or supplier
– Audits or evaluations conducted by the OIG
Source: Chapter 8 – Benefit Integrity; Medicare Program Integrity Manual; available at:
http://www.cms.gov/manuals/downloads/pim83c08.pdf (Previously found in Chapter 3) 11
Legal Basis for Medicare Statistical Sampling and Extrapolation
• Additional Factors to Consider
– Number of claims in universe
– Dollar values associated with claims
– Available resources
– Cost effectiveness of expected sampling results
Source: Chapter 8 – Benefit Integrity; Medicare Program Integrity Manual; available at:
http://www.cms.gov/manuals/downloads/pim83c08.pdf 12

Legal Basis for Medicaid Statistical Sampling and Extrapolation
• Dictated by state law
• If no explicit authority, look to due process requirements
13

Numbers vs. Statistics
• Numbers can readily be manipulated and outcomes understood through the use of simple math: addition, subtraction, multiplication, multiplication and division e.g., %s, differences, sums and averages.
• Statistics is branch of applied math concerned with the collection and interpretation of quantitative data and the use of probability theory to estimate universe parameters e.g. correlations, t-tests and point estimates
14

MPIM Requirements
• Key Rules
– Obtain and properly execute “probability sample”
– Keep data and records so work can be replicated
• More content and direction given in RAT-STATS Manuals and standard of care expected of statisticians under Generally Accepted Statistics Procedures and Policies (“GASPP”)
15

Validity Sample
If a particular probability sample design is properly executed, i.e., defining the universe, the frame, the sampling units, using proper randomization, accurately measuring the variables of interest, and using the correct formulas for estimation, then assertions that the sample and its resulting estimates are “not statistically valid” cannot legitimately be made. In other words, a probability sample and its results are always “valid.” MPIM § 8.4.2
16

“Always Valid” Does Not Mean Results Cannot Be Challenged
Rather the “always valid” refers to the idea that internal operation of a statistical process which, when executed, will (with respect to its mathematical assumptions) yield internally consistent results.
The concept of statistically “valid” includes the understanding that there is an expectation of error.
“Valid” results include expectation of error: wrong 10 times in 100, precision demonstrated inaccuracy, validly rejecting hypothesis.
17

Valid Outcomes Require Properly
• defined universe
• defined the frame
• defined sampling units
• use proper randomization
• Accurate measuring the variables of interest
• using the correct formulas for estimation
• tests of key assumptions
• accurate reporting of actual findings
18

Typical Problems with Extrapolation
Sample size, not associated with precision or confidence
Incorrect use of formulas
Use of wrong formulas - choose wrong method
Use of inapplicable methodology – simple, stratified, cluster, multi-stage
Non-representative sample
Fail to meet key assumptions of statistic – math basis of statistic
Exclusion of zero paid claims
Accuracy outside of recommended range – too little precision
Reporting precision and/or confidence levels that are wrong
19
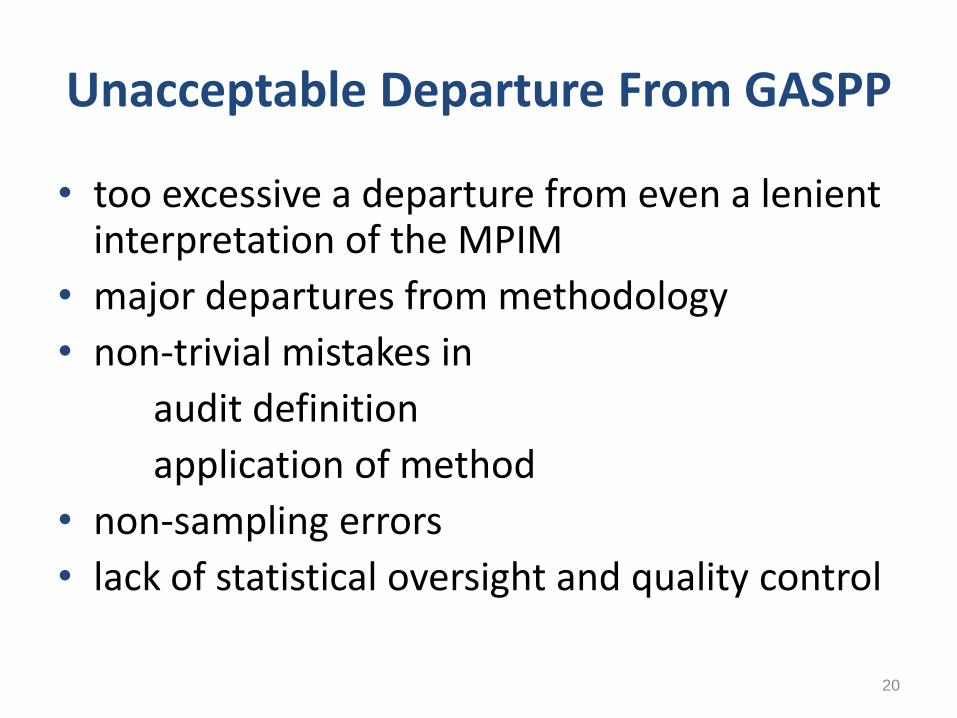
Unacceptable Departure From GASPP
• too excessive a departure from even a lenient interpretation of the MPIM
• major departures from methodology
• non-trivial mistakes in
audit definition
application of method
• non-sampling errors
• lack of statistical oversight and quality control
20
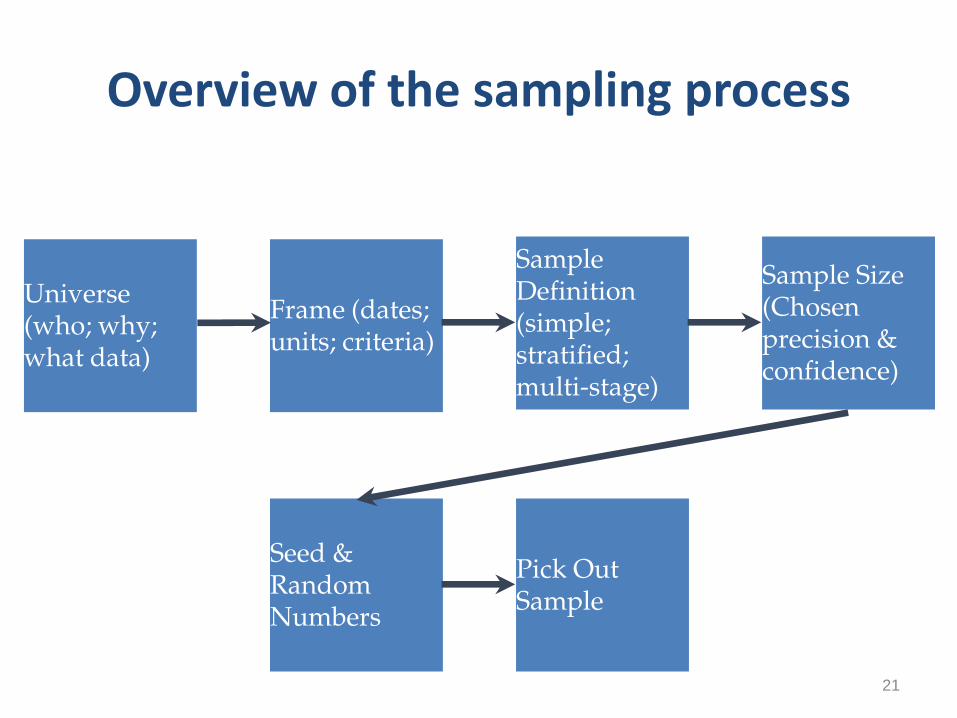
Overview of the sampling process
Universe (who; why; what data)
Frame (dates; units; criteria)
Sample Definition (simple; stratified; multi-stage)
Sample Size (Chosen precision & confidence)
Seed & Random Numbers
Pick Out Sample
21
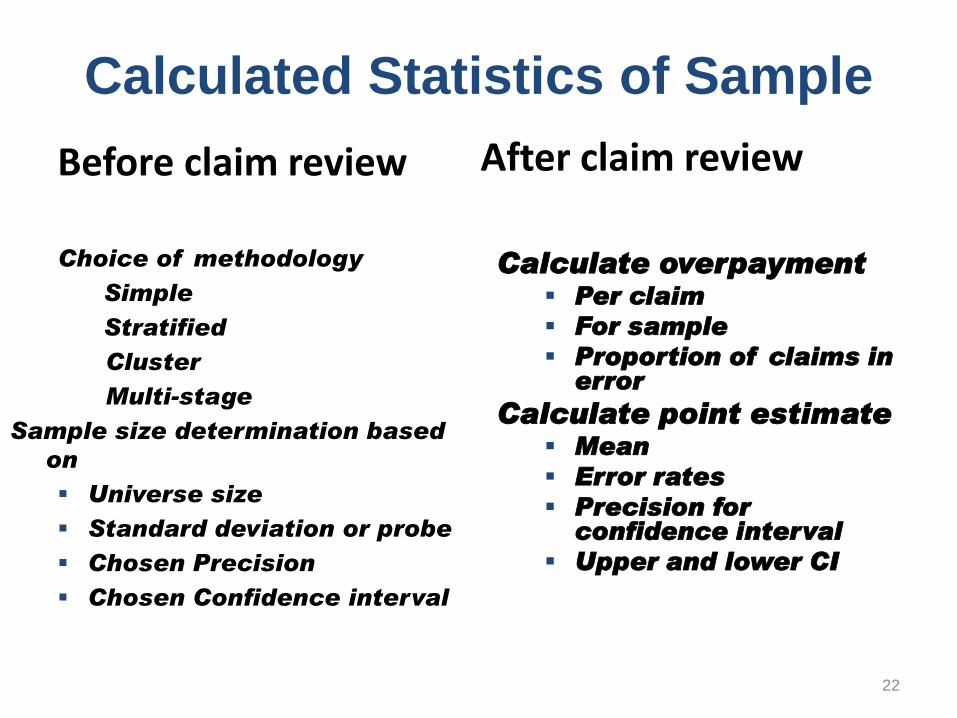
Calculated Statistics of Sample
Before claim review
Choice of methodology
Simple
Stratified
Cluster
Multi-stage
Sample size determination based
on
Universe size
Standard deviation or probe
Chosen Precision
Chosen Confidence interval
After claim review
Calculate overpayment Per claim
For sample
Proportion of claims in error
Calculate point estimate Mean
Error rates
Precision for confidence interval
Upper and lower CI
22

Key Requirements for Use of Parametric Statistics
Use a sample that:
• Is made up or independent observations
• Randomly selected
• Normally distributed
• Is representative of the frame from which it was chosen and over which it will be extrapolated
23

Random
– … each distinct sample of the set has a known probability of selection….
– … one of the possible samples is selected by a random process according to which each sampling unit in the target population receives its appropriate chance of selection….
24

25

Representative Sample
26

27

SEED NUMBER: 50007.27 FRAME SIZE: 80 Frame Sort
Selection Order Value 3 4 10 6 11 7 13 40 9 42 5 43 1 49 6 51 14 56 15 60 4 62 7 64 2 73 12 76 8 77 16 13 17 45 18 70 19 15 20 5 SUMMATION OF RANDOM NUMBERS = 858 28

Sample Size
Statistical sampling is used to calculate and project (i.e., extrapolate) the amount of overpayment(s) made on claims. The Medicare Prescription Drug, Improvement, and Modernization Act of 2003 (MMA), mandates that before using extrapolation to determine overpayment amounts to be recovered by recoupment, offset or otherwise, there must be a determination of sustained or high level of payment error, or documentation that educational intervention has failed to correct the payment error. By law, the determination that a sustained or high level of payment error exists is not subject to administrative or judicial review. MPIM, § 8.4.1.2
29

Example Frame Frequency
N 70 Mean 49.99 Median 50.00 Mode 51 Std. Deviation 11.544 Variance 133.261 Skewness 0.156 Kurtosis 0.856 Minimum 20 Maximum 80 Sum 3,499
30
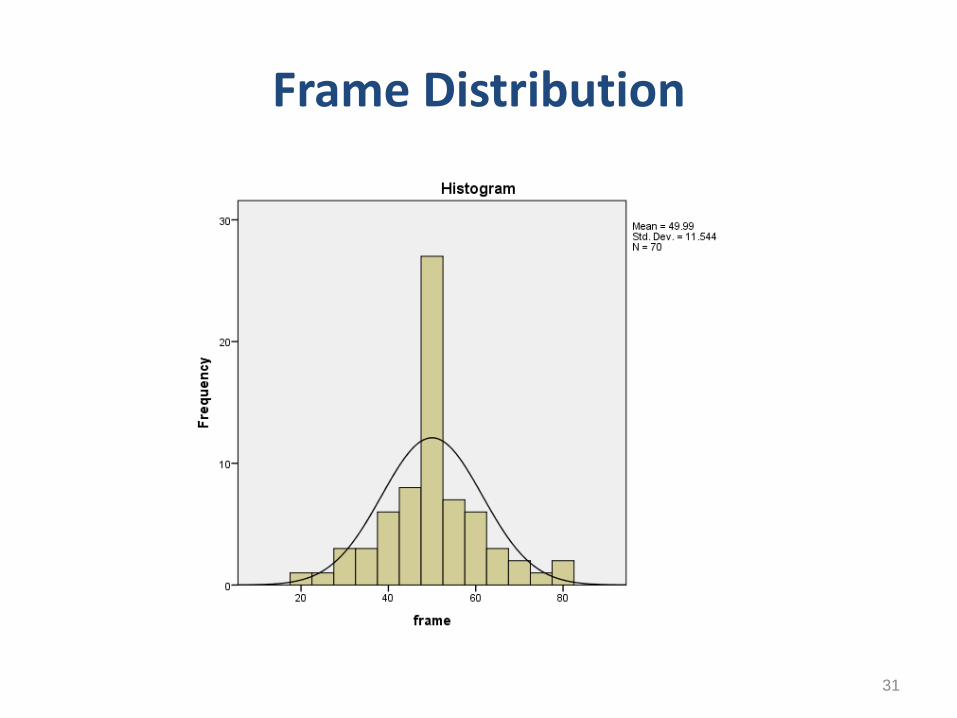
Frame Distribution
31
32

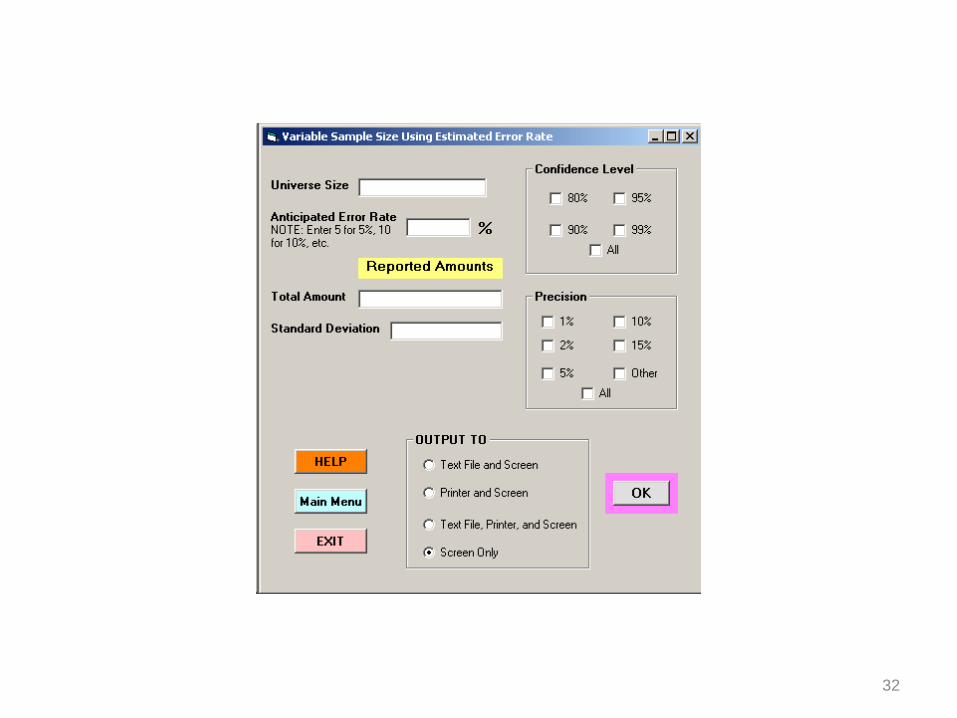
Sample Size Determination Based on Chosen Precision and Confidence
33

RAT-STATS Results
Confidence Level 80% 90% 95% 99% 1% 75 77 78 79 2% 63 68 71 75 Precision 5% 29 * 39 46 56 Level 10% 10 * 15 * 20 * 29 * 15% 5 * 8 * 10 * 16 *
34
Probability Sample
Probability theory mathematics allow the comparison of sample data to a described distribution (in this case a “normal distribution”) to describe the pattern of that data. Many inferential statistics are based on the reality that the data being analyzed were “normally distributed”
35

Normal Distribution
36

This is the standard normal distribution’s
mathematical formula.
37

Basic statistical terminology
Mean (average) the arithmetic sum of all scores divided by the number of cases
Median – the middle most real score
Mode the score that occurs most frequently in the data set (does not have to be unique – sometimes more than 1 value is equally likely)
Measures of variability (variance, standard deviation, precision and confidence interval)
38
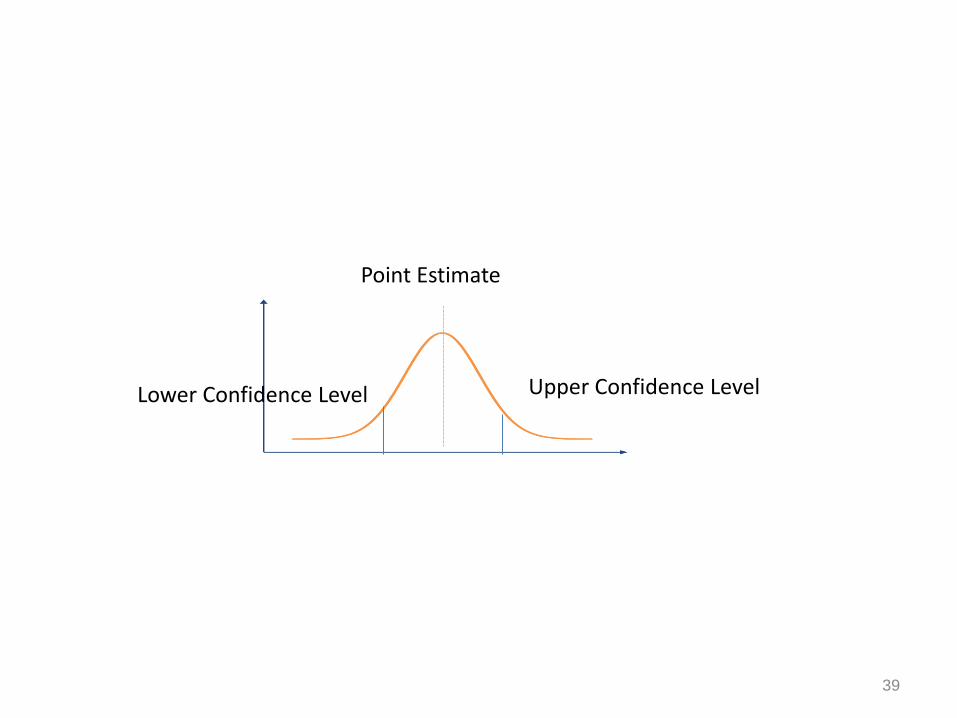
Lower Confidence Level Upper Confidence Level
Point Estimate
39
40

Sample Frequency in $
N 15 Mean 430.93 Median 112.00 Mode 120 Std. Deviation 525.519 Variance 76,170.210 Skewness 0.816 Kurtosis 0.580 Minimum 10 Maximum 1,300 Sum 6,464
41

Non Normal Mean and SD
Sample mean +/- 1 standard deviation
Mean = $430.92 + sd = 525.510 = 956.43
430.92 - 525.510 = -94.18
42

Posterior Distribution
• Sample selected from amount paid to provider
• Sample analyzed using overpayment data
• Never know up front what the overpayment amount is going to be unless – There is a known history of overpayment dollar
amount
– Conduct a probe
• Overpayment amounts must meet criteria for using parametric statistic or the confidence levels are destroyed.
43

Sample Overpay Frequency in $
N 15 Mean 339.333 Median 100.00 Mode 0.0 Std. Deviation 511.62 Variance 261,763.810 Skewness 1.197 Kurtosis -0.524 Minimum 10 Maximum 1,300 Sum 6,464
44

RAT-STATS Overpayment Estimation
Formulae:
Confidence Level
45

RAT-STATS Point Estimate & CI
POINT ESTIMATE 27,147 90% CONFIDENCE LEVEL LOWER LIMIT 10,368 UPPER LIMIT 43,925 PRECISION AMOUNT 16,778 PRECISION PERCENT 61.81% T-VALUE USED 1.761310135775 Lower 27,147 + 16,778 = $43, 925 Upper 27,147 - 16,778 = $ 10,368 Confidence Interval = 16,778 + 16,778 = 33,556
46

Confidence Levels Non Normal Data
Point Estimate +/- ½ Confidence Interval
Lower 27,147 + 16,778 = $43, 925
Upper 27,147 - 16,778 = $ 10,368
Confidence Interval = 16,778 + 16,778 = 33,556
Lower confidence Level ??? Unknowable
47

Overpayment Calculations
POINT ESTIMATE $27,147
90% CONFIDENCE LEVEL
LOWER LIMIT 10,368
UPPER LIMIT 43,925
PRECISION AMOUNT 16,778
PRECISION PERCENT 61.81%
T-VALUE USED 1.761310135775
48

Requirements of Every Study • Define objectives of study
• Define the universe to be sampled
• All relevant data sampled, none omitted or added
• Ascertain the degree of precision acceptable
• Specify people who conduct study with expertise necessary and documented records
• Define the frame
• Select the sample (correct size, random, independent, representative, normal) SVRS
• Organize field work, quality controls and assurance
• Summarize and analyze results of validity sample
49

Poor Audit Design & Execution Produce Only “Invalid Results”
Statistics in the hands of an inept auditor are like a lamppost to a drunk--they're used more for support than illumination.
50

Defending Against Extrapolation Results
• Medicare Appeals Process
– Redetermination
– Reconsideration
– Administrative Law Judge Hearing
– Medicare Appeals Council
– Federal District Court
• Medicaid Appeals Process
– Appeal rights under state law
51

Defending Against Medicare Extrapolation Results
• No administrative or judicial review of determination of high level of payment error BUT determination must be made
• Failure to follow one or more requirements in Benefit Integrity Manual does not necessarily affect validity
• Not sufficient to argue better or more precise methods are available
52

Defending Against Medicare Extrapolation Results
• Can challenge validity of sampling methodology based on “the actual statistical validity of the sample as drawn and conducted”
• Test: Was the sample statistically valid?
• Provider has burden of establishing sample was not statistically valid
53

Defending Against Extrapolation Results
• Procedural Challenges
– Did the contractor follow the MPIM or state law requirements?
– Were allowed claims included in overpayment sample calculation?
– Were calculations performed correctly at each level of appeal?
54

Defending Against Extrapolation Results
• Substantive Challenges
– Likely need a statistician
• Where can you find one?
– “One size does NOT fit all.”
– It is not your job to explain how it should be done.
55

Defending Against Extrapolation Results
• Examples of Substantive Challenges
– Is the sample representative?
– Is the sample statistically significant?
• Is the sample size reliable?
• Is the sample within the required precision and confidence levels?
56

Defending Against Extrapolation Results
• Obtain all documentation related to sampling calculations
– Consider provider’s prior audit history
• Know appeal timelines and requirements for each level
• Understand reasons for denial at each level
• Present reasons in written protest or position paper
• Prepare for oral testimony at hearing
57

Questions
Anna M. Grizzle
Bass, Berry & Sims PLC
Patricia Maykuth, Ph.D.
58