Embed Size (px)
Citation preview

Women’s Health Issue
M E D I C A L S U R V E I L L A N C E M O N T H L Y R E P O R T
msmrmsmr
A publication of the Armed Forces Health Surveillance Center
DECEMBER 2011
Volume 18Number 12
P A G E 2 Complications and care related to pregnancy, labor and delivery, active component, U.S. Armed Forces, 2001-2010
P A G E 6 Urinary stones, active component, U.S. Armed Forces, 2001-2010
P A G E 1 0 Uterine fibroids, active component females, U.S. Armed Forces, 2001-2010
P A G E 1 4 Historical snapshot: Dr. Anna Baetjer, industrial hygiene pioneer, military occupational health advocate
B R I E F R E P O R T S
P A G E 1 6 Births, active component, 2001-2010
P A G E 1 8 Numbers and characteristics of women in the active component, U.S. Armed Forces, 2011
S U M M A R Y T A B L E S A N D F I G U R E S
P A G E 2 0 Deployment-related conditions of special surveillance interest

M S M R Vol. 18 No.12 December 2011 Page 2
Complications and Care Related to Pregnancy, Labor and Delivery, Active Component, U.S. Armed Forces, 2001-2010
Diagnoses of “complications of pregnancy, childbirth, and the puerperium” (ICD-9-CM: 630-679) include both morbid complications and indications for routine care of pregnant women. During 2001-2010, U.S. service mem-bers with live births (n=156,314) had 1.16 million medical encounters with primary diagnoses of “pregnancy complications”. Th e most frequent diag-noses were “other current conditions”, “other threatened labor” (e.g., false labor), “previous cesarean delivery” and “normal delivery”. Th e number of complication-related medical encounters per pregnancy more than dou-bled during 2001-2010. Diagnoses of gestational diabetes, previous cesar-ean delivery and advanced maternal age contributed to the largest increases in pregnancy-related medical encounters during the period. Th e complica-tions that accounted for the largest increases in the percents of pregnancies aff ected by them were urinary tract infections, fetal heart rate/rhythm abnor-malities and back pain in pregnancy.
during the past 10 years, there have been more service mem-bers hospitalized for labor and
delivery than for any other specifi c condi-tion.1 Previous surveillance analyses have shown recent increases in the numbers of health care encounters for “pregnancy complications” as indicated by diagnoses of “complications of pregnancy, childbirth, and the puerperium” (International Clas-sifi cation of Diseases, 9th revision [ICD-9] codes 630-679) on administrative records of the medical encounters of U.S. military members. Because diagnostic codes in this range include both morbid complications and indications for routine care of preg-nant women (e.g. ICD-9 code 650 “normal delivery”), recent increases in diagnoses suggestive of pregnancy “complications” may refl ect actual increases in pregnancy-related morbidity and/or changes in diag-nostic coding and reporting practices. For example, a pregnant woman who expe-riences back pain (ICD-9 code 648.7 “bone and joint disorders of back aff ect-ing pregnancy”) and delivers three days past her due date (ICD-9 code 645 “late pregnancy”) at the age of 35 (ICD-9 code 659.5 “elderly primagravida”) may have these “complications” coded and reported in the record of the hospitalization, even if
the pregnancy and delivery were clinically unremarkable. Also, in 2006, a new series of codes was added to the “pregnancy com-plications” category of the ICD-9-CM to indicate “other conditions or status of the mother” (ICD-9-CM: 649.00-649.64); the additional pregnancy complication-related codes enabled reporting of tobacco use and obesity as specifi c pregnancy-related con-ditions. Prior to 2006, such conditions were coded using non-specifi c ICD-9 codes such as “other complications of pregnancy”.
Th is report characterizes the numbers and trends of the most frequent diagnoses of “complications” and indications for care related to pregnancy and childbirth among active component service members from 2001 through 2010.
M E T H O D S
Th e surveillance population consisted of all active component female service mem-bers 17 to 49 years of age with delivery hos-pitalizations resulting in live births during 2001-2010. Delivery hospitalizations were defi ned by an inpatient record with one of the following in any diagnostic position: ICD-9 code V27.0-V27.9 “outcome of deliv-ery”, ICD-9 code 650 “normal delivery” or
fi ft h-digit classifi cations of “delivered” or “postpartum condition” with ICD-9 codes in the range 640-679 “complications of pregnancy”. For summary purposes, indi-viduals were allowed one delivery hospital-ization every 280 days.
Endpoints of analysis were compli-cations and indications for care related to pregnancy, labor and delivery as defi ned by four-digit level ICD-9 diagnosis codes from 640.0-679.1 (“indicator diagnoses”) that were reported during hospitalizations and ambulatory visits in U.S. military and civilian (reimbursed care) medical treat-ment facilities within 280 days before to 7 days aft er each delivery hospitalization during the surveillance period. Th e pri-mary summary measures used for analyses were numbers of “medical encounters” for and “pregnancies aff ected” by each four-digit level coded diagnosis of complications or care. Numbers of medical encounters of interest were the numbers of inpatient or outpatient visits with indicator diagnoses in the primary (fi rst-listed) diagnostic posi-tion. Pregnancies aff ected were the number of pregnancies or deliveries during which an indicator diagnosis was recorded in any diagnostic position.
R E S U L T S
From 1 January 2001 to 31 December 2010, there were 156,314 deliveries ending in live births among active component ser-vice members (summarized on pages 16-17 of this report). Th ese pregnancies were associated with 1.16 million outpatient vis-its (84% of all encounters) or inpatient stays (16%) during which complications and indications for care (ICD-9 codes 640.0-679.1, hereaft er “complications”) were diag-nosed. Of the 262 diff erent four-digit level coded diagnoses that documented compli-cations of these pregnancies, the majority (52%) of the diagnoses aff ected fewer than 0.5 percent each of all pregnancies during the period (data not shown).

December 2011 Vol. 18 No. 12 M S M R Page 3
T A B L E 1 . Numbers of medical encountersa for and pregnancies affectedb by “pregnancy complications” (ICD-9-CM: 640.0-679.1) among active component women who delivered during the surveillance period, 2001-2010
aInpatient or outpatient encounters with a primary (fi rst-listed) diagnosisbInpatient or outpatient encounters with a diagnosis in any diagnostic position (one diagnosis per pregnancy)
ICD-9 code Description No. encountersa Rank % of all
encountersNo. pregnancies
affectedb Rank % pregnancies affected
648.9 Other current conditions complicating pregnancy 65,697 1 5.6 59,858 1 38.3646.8 Other specifi ed complications of pregnancy 60,153 2 5.2 38,507 2 24.6644.1 Other threatened labor 55,082 3 4.7 37,612 3 24.1654.2 Previous cesarean delivery 51,867 4 4.5 14,089 16 9.0644.0 Threatened premature labor 50,761 5 4.4 26,211 9 16.8650 Normal delivery 46,516 6 4.0 36,537 4 23.4648.8 Abnormal glucose tolerance 45,645 7 3.9 11,468 22 7.3640.0 Threatened abortion 33,513 8 2.9 22,659 12 14.5659.5-659.6 Elderly primagravida and multigravida 32,913 9 2.8 12,182 19 7.8664.0 First-degree perineal laceration during labor 31,102 10 2.7 30,440 6 19.5664.1 Second-degree perineal laceration during labor 30,339 11 2.6 29,376 7 18.8646.9 Unspecifi ed complications of pregnancy 29,680 12 2.5 18,169 14 11.6651.0 Twin pregnancy 26,934 13 2.3 2,806 65 1.8645.1 Postterm pregnancy 26,304 14 2.3 27,937 8 17.9659.7 Abnormality in fetal heart rate or rhythm 24,446 15 2.1 31,536 5 20.2648.2 Anemia complicating pregnancy 24,148 16 2.1 24,266 11 15.5646.6 Infections of genitourinary tract in pregnancy 21,530 17 1.8 20,156 13 12.9655.7 Decreased fetal movements 19,513 18 1.7 16,548 15 10.6656.5 Poor fetal growth 18,598 19 1.6 11,492 21 7.4642.4 Mild or unspecifi ed pre-eclampsia 17,281 20 1.5 9,503 27 6.1
Complications associated with the most medical encounters
Th e four most frequent complica-tions (at the 4-digit level of the ICD-9-CM) accounted for one-fi ft h (20.0%), and the 14 most frequent accounted for the majority (50.4%), of all complication-related medical encounters during the period (Table 1). Th e most frequent condition complicating preg-nancy was “other current conditions in the mother classifi able elsewhere” (ICD-9-CM code 648.9). Among outpatient encoun-ters with this as a primary (fi rst-listed) diagnosis, most secondary diagnoses were among the most common causes of medi-cal visits among female service members in general (e.g., abdominal symptoms, back pain, headache and acute upper respiratory infections) or were indications of a positive Group B streptococcus urine culture with-out symptoms of infection (code V02.51 “carrier or suspected carrier of Group B streptococcus”) (data not shown).
Th e second through fourth most fre-quent pregnancy complications were “other specifi ed complications of preg-nancy” (code 646.8, which includes “fatigue
during pregnancy” and “herpes gestationis”, according to its ICD-9 description), “other threatened labor” (e.g., false labor, Braxton Hicks contractions) (code 644.1) and previ-ous cesarean delivery (code 654.2) (Table 1).
Complications that affected the most pregnancies
Virtually every pregnancy was aff ected by one or more conditions that were docu-mented with complication-related diagno-sis codes. Th e three diagnoses that aff ected the most pregnancies (24-38% of pregnan-cies during the period) were the same as the three leading causes of medical encoun-ters (Table 1). Th ree additional conditions each aff ected approximately one-fi ft h of all pregnancies: “normal delivery” (code 650), “abnormality in fetal heart rate or rhythm” (code 659.7) and “fi rst-degree perineal lac-eration” during labor (code 664.0) (Table 1).
Trends in complication-related medical encounters
Numbers of medical encounters with a primary (fi rst-listed) diagnosis of
any pregnancy complication increased in each year from 2001 (n=71,885) to 2010 (n=178,336) (Figure 1). In each age group, the numbers of pregnancy complication-related encounters per delivery more than doubled during the period, with the sharpest increases among 35-49-year-olds between 2005 and 2010. Women 35 and older who delivered in 2010 had an aver-age of 4.7 more complication-related medi-cal visits per pregnancy than their younger counterparts. Th e trend of increasing num-bers of encounters per pregnancy among women overall was observed for care pro-vided in both military and non-military facilities (data not shown).
One-quarter (25.3%) of the increase in the numbers of medical encounters between the fi rst fi ve years (2001-2005) and the last fi ve years (2006-2010) was attribut-able to the fi rst, second and fourth lead-ing causes of medical encounters described above (“other current conditions”, “other specifi ed complications” and “previous cesarean delivery”). Th e third most fre-quent cause of medical encounters, “other threatened labor”, caused 2.4 percent fewer

M S M R Vol. 18 No.12 December 2011 Page 4
F I G U R E 2 . Percentage of pregnancies affected by “abnormal glucose tolerance” (ICD-9-CM: 648.8), by age group and year, active component, U.S. Armed Forces, 2001-2010
F I G U R E 1 . Medical encounters with a primary (fi rst-listed) diagnosis of a “pregnancy complication” (ICD-9-CM: 640-679) for all ages, and number of encounters per pregnancy by age group, 2001-2010
0
2
4
6
8
10
12
14
16
18
0
20,000
40,000
60,000
80,000
100,000
120,000
140,000
160,000
180,000
200,000
2001 2002 2003 2004 2005 2006 2007 2008 2009 2010
No.
of e
ncou
nter
s pe
r pre
gnan
cy (l
ines
)
No.
of e
ncou
nter
s (b
ars)
No. of encounters, all ages (bars) 35-49 25-34 17-24
0.0
2.0
4.0
6.0
8.0
10.0
12.0
14.0
2001 2002 2003 2004 2005 2006 2007 2008 2009 2010
Per
cent
age
35-49 25-34 18-24
visits in 2006-2010 as compared to 2001-2005 (data not shown).
Of note, “abnormal glucose tolerance” (i.e., gestational diabetes, code 648.8) and “unspecifi ed hypertension complicating pregnancy” (code 642.9) accounted for 6.2 percent and 3.1 percent of the increases of medical encounters for complications between the fi rst and last fi ve years of the period. Indications of advanced maternal age (i.e., 35 or older) (codes 659.5, 659.6) and new codes introduced into the ICD-9 in 2006 (code 649) each accounted for approximately fi ve percent of the increase
in the number of complication-related encounters between the periods (data not shown).
Trends in pregnancies affected by complications
Of the complications that aff ected at least one percent of all pregnancies dur-ing the period, the diagnoses that caused the largest increases in the percents of pregnancies aff ected between 2001-2005 and 2006-2010 were the “other” complica-tions discussed above as well as “unspeci-fi ed” complications or indications for care
(Table 2). Of the 20 conditions with the largest increases between the periods in the percents of pregnancies aff ected by them, four had codes that were introduced into the ICD-9 in 2006. Specifi ed complica-tions responsible for three to six percent increases between the fi ve-year periods in the percent of pregnancies by them aff ected included (a) common diagnoses among female service members in general (e.g., genitourinary tract infections, back pain), (b) common conditions or indications for care during pregnancy or labor (e.g., edema, anemia, post-term pregnancy, fi rst-degree perineal laceration) and (c) condi-tions frequently detected during routine fetal monitoring (abnormality in fetal heart rate/rhythm). Of note, between the periods, there were 3-4 percent increases in the per-centages of pregnancies aff ected by hyper-tension (codes 642.3, 642.9) and abnormal glucose tolerance (code 648.8) (Table 2); for each of these, the sharpest increases were among women 35 and older (Figure 2).
E D I T O R I A L C O M M E N T
During the past 10 years, the vast majority of “pregnancy complications”, and those responsible for the greatest increases in numbers of medical visits, were either health conditions common in all female service members or indications for routine care during pregnancy, labor and delivery, or the postpartum period. Th e most frequently reported “complica-tion,” aff ecting 38 percent of all pregnan-cies, was reported with the diagnosis of “other current conditions”; this diagnosis code refers to conditions classifi ed under non-pregnancy-specifi c categories of the ICD-9. Th e diagnoses recorded during the same outpatient encounters as “other cur-rent conditions” generally refl ected the most common diagnoses among female service members overall (e.g., abdomi-nal symptoms, back pain, headache, and upper respiratory infections), plus positive Group B streptococcus urine cultures with-out symptoms of infection. Th e pregnancy-specifi c complications that accounted for the largest increases during the period in the percents of pregnancies aff ected by

December 2011 Vol. 18 No. 12 M S M R Page 5
T A B L E 2 . Conditions complicating pregnancy with the greatest change in the percentage of pregnancies affected between 2001-2005 and 2006-2010, active component, U.S. Armed Forces
aIntroduced into the International Classifi cation of Diseases (ICD-9) in October 2006
2001-2005(n=79,405)
2006-2010(n=76,909)
Difference between the periods
ICD-9 code Description No.
affected%
affectedNo.
affected%
affectedIncrease in %
affected648.9 Other current conditions complicating pregnancy classifi ed elsewhere 23,023 29.0 36,835 47.9 18.9646.8 Other specifi ed complications of pregnancy 12,559 15.8 25,948 33.7 17.9646.9 Unspecifi ed complication of pregnancy 5,260 6.6 12,909 16.8 10.2659.9 Unspecifi ed indication for care or intervention, labor/delivery 1,517 1.9 7,100 9.2 7.3646.6 Infections of genitourinary tract in pregnancy 7,920 10.0 12,236 15.9 5.9659.7 Abnormality in fetal heart rate or rhythm 13,748 17.3 17,788 23.1 5.8648.7 Bone/joint disorders of back/pelvis in pregnancy 2,382 3.0 6,417 8.3 5.3649.6 Uterine size date discrepancya 0 0.0 3,843 5.0 5.0645.1 Post term pregnancy 12,401 15.6 15,536 20.2 4.6646.1 Edema or excessive weight gain w/o hypertension 5,284 6.7 8,215 10.7 4.0642.9 Unspecifi ed hypertension complicating pregnancy 1,652 2.1 4,678 6.1 4.0648.2 Anemia complicating pregnancy childbirth or the puerperium 10,782 13.6 13,484 17.5 4.0649.0 Tobacco use disorder complicating pregnancya 0 0.0 3,011 3.9 3.9664.0 First-degree perineal laceration during delivery 14,122 17.8 16,318 21.2 3.4649.5 Spotting complicating pregnancya 0 0.0 2,485 3.2 3.2648.8 Abnormal glucose tolerance of mother 4,564 5.7 6,904 9.0 3.2655.8 Other known or suspected fetal abnormality 2,746 3.5 5,106 6.6 3.2649.1 Obesity complicating pregnancya 0 0.0 2,255 2.9 2.9642.3 Transient hypertension of pregnancy 4,091 5.2 6,110 7.9 2.8
them were “infections of the genitourinary tract”, “abnormalities in fetal heart rate or rhythm” and back pain in pregnancy. Uri-nary tract infections due to E. coli are com-mon during pregnancy.2 Irregular fetal heartbeats are frequently detected dur-ing routine prenatal care and labor and delivery; in 2008, fetal heart rate/rhythm abnormalities were diagnosed during 14.8 percent of 4.2 million delivery hospital stays in the United States.3
Increasing maternal ages during the period (see page 16) contributed to the overall increase in numbers of complica-tion-related medical encounters during 2001-2010. Th is report demonstrates that in 2010, service members 35 and older had an average of 16 complication-related vis-its per pregnancy compared to 11 visits among those younger than 35. In addition, the three specifi c diagnoses that contrib-uted to the largest increases in pregnancy-related medical encounters between the fi rst and last 5 years of the period were his-tory of cesarean delivery, gestational diabe-tes and advanced maternal age. Gestational diabetes and previous cesarean delivery
aff ected women 35 and older at consider-ably higher rates than their younger coun-terparts; the fi nding is likely both a cause and a consequence of closer medical super-vision of these pregnancies.
Increasing maternal age does not explain the notable increase in the num-ber of complication-related visits per preg-nancy that aff ected service members of all age groups. As this increase was observed in both military and non-military facilities, it was not likely driven by fi nancial incen-tives for reimbursement (determined by ICD-9 codes in non-military facilities) or concerns of obstetric malpractice (military physicians are protected from malpractice lawsuits). Th e increase may refl ect changes in standards of clinical care or in ICD-9 coding practices.
Th is report characterized complica-tions of pregnancy by summarizing the most frequently reported complicating conditions and the sources of the great-est increases in “morbidity burdens”. Th is report did not seek to measure or inter-pret increases in rates of relatively rare pregnancy complications. Future analyses
should explore rates and trends of standard indicators of maternal morbidity such as hemorrhage and severe preeclampsia.
Finally, this report documents that, during 2006-2010 compared to 2001-2005, 3-4 percent more pregnancies were complicated by gestational diabetes and unspecifi ed hypertension. Studies that do not rely on surveillance data may be neces-sary to determine if this trend refl ects a true increase in the rates of these complications or is the result of improved awareness of, and better documentation of care provided for, these conditions during pregnancy.
R E F E R E N C E S
1. Armed Forces Health Surveillance Center. Hospitalizations among members of the active component, U.S. Armed Forces, 2010. Medical Surveillance Monthly Report (MSMR). 2011 Apr; 18(4):8-15.2. Delzell JE Jr, Lefevre ML.Urinary tract infections during pregnancy. Am Fam Physician. 2000 Feb 1;61(3):713-21.3. Elixhauser A, Wier LM. Complicating conditions of pregnancy and childbirth, 2008. Agency for Healthcare Research and Quality. May 2011. Available at: http://www.hcup-us.ahrq.gov/reports/statbriefs/sb113.pdf.

M S M R Vol. 18 No.12 December 2011 Page 6
Urinary Stones, Active Component, U.S. Armed Forces, 2001-2010
u rinary stones, or renal calculi, are crystalline deposits of dietary minerals and acid salts that accu-
mulate in the kidneys. Th e stones vary in size, shape, and composition; however, the majority contain calcium, particularly cal-cium oxalate.1 Most stones pass out of the urinary tract without surgical interven-tion; however, depending on their size and location, urinary stones can trigger severe, undulating pain (“renal colic”). Evaluation, treatment, and lost work days are costly in terms of medical resource expenditures and military operational decrements.2
Risk factors for stone formation include advancing age, male gender, family history, dehydration, diet, chronic urinary tract infections, and history of previous stones.3-6 Recent increases in the prevalence of urinary stones in the U.S. population have been correlated with increasing preva-lences of obesity and type II diabetes.7,8 His-torically, urinary stones have aff ected men more than women; however, recent studies have described a “gender shift ” with nar-rowing of prevalence diff erences between women and men.9,10
Th is analysis estimates incidence rates and trends of urinary stones among active component members of the U.S. military and compares the experiences of females and males from 2001 through 2010. Th e report also enumerates and character-izes urinary stone-related medical evacua-tions from the combat theaters in Iraq and Afghanistan.
Urinary stones can cause debilitating morbidity that impairs the opera-tional eff ectiveness of aff ected members of the U.S. Armed Forces. Th is report describes a “gender shift ,” i.e., the narrowing of prevalence diff erences between men and women, similar to trends described in the U.S. civilian pop-ulation. Rates of incident diagnoses of urinary stones increased in the active component during the past decade – particularly among females. On aver-age, 60 service members were medically evacuated from combat zones each year during the period. Service members with a history of urinary stones should be counseled on reducing risk, particularly in the deployment setting.
M E T H O D S
Th e surveillance period was 1 January 2001 to 31 December 2010. Th e surveil-lance population included all individu-als who served in the active component of any branch of the U.S. Armed Forces at any time during the surveillance period. Health care encounters (hospitalizations and out-patient clinic visits) that were documented with records maintained in the Defense Medical Surveillance System were reviewed to identify those associated with diagnoses of urinary stones.
For this analysis, a case was defi ned by a diagnosis of ICD-9-CM: 592.x “calculus of kidney and ureter”, 594.x “calculus of lower urinary tract”, 788.0 “renal colic”, or 274.11 “uric acid nephrolithiasis [UAN]” in the primary (fi rst-listed) diagnostic position on a record of a hospitalization or ambu-latory visit. Each aff ected service member could be counted as an “incident case” only once per 365 days; service members were considered “recurrent” cases if they were incident cases more than once during the surveillance period. If service members had more than one case-defi ning encoun-ter during a calendar year, hospitalizations were prioritized over outpatient encounters as the case-defi ning events.
Medical evacuations (MEDEVACs) for urinary stones were ascertained from records of service members who were medically evacuated from the U.S. Central
Command (CENTCOM) area of responsi-bility (AOR) to a medical treatment facility outside of the CENTCOM AOR. Evacua-tions were included in analyses if aff ected service members had at least one inpatient or outpatient urinary stone-related medical encounter in a fi xed U.S. military medical facility within 10 days of their evacuation dates.
R E S U L T S
Incident diagnoses
During the 10 year surveillance period, 61,587 active component members received 84,055 incident diagnoses of uri-nary stones; most of the cases (n=79,138, 94% total) were treated during outpatient encounters (Table 1). Th e crude overall inci-dence rate during the period was 58.9 per 10,000 person-years (p-yrs); the annual incidence rate was 15.2 percent higher in 2010 than 2001 (64.6 and 56.1 per 10,000 p-yrs, respectively) (Table 1).
Most cases overall (86%) were reported as stones in the kidney or ureter (“upper calculus”). From the fi rst to the last year of the period, incident cases of “upper calculi” increased by 38 percent, while those doc-umented with other diagnoses (i.e., lower calculus, renal colic, uric acid nephrolithia-sis) decreased (data not shown).
Among racial/ethnic subgroups, crude overall incidence rates were highest among white, non-Hispanic (69.3 per 10,000 p-yrs) and lowest among black, non-His-panic (33.2 per 10,000 p-yrs) service mem-bers. During the period, annual incidence rates increased by a larger percentage among white, non-Hispanic (18.2%) than any other racial/ethnic subgroup members (Table 1).
Among the service branches, the high-est overall incidence rate (79.0 per 10,000 p-yrs) and the largest relative increase in annual rates (34%) aff ected Coast Guard members; the lowest incidence rate aff ected Marine Corps members (42.4 per 10,000 p-yrs) (Table 1).

December 2011 Vol. 18 No. 12 M S M R Page 7
T A B L E 1 . Numbers and rates of urinary stones, active component, U.S. Armed Forces, 2001-2010
F I G U R E 1 . Incidence rates of urinary stones by gender, active component, U.S. Armed Forces, 2001-2010
0.0
0.5
1.0
1.5
2.0
0.0
15.0
30.0
45.0
60.0
75.0
2001 2002 2003 2004 2005 2006 2007 2008 2009 2010
Mal
e:Fe
mal
e ra
tio
Inci
denc
e ra
te p
er 1
0,00
0 p-
yrs
Female
Male
Male:Female ratio
aRate per 10,000 person-years (p-yrs)bIncidence Rate Ratio
For the entire period, crude overall incidence rates were very similar among females (58.6 per 10,000 p-yrs) and males (59.0 per 10,000 p-yrs). However, among service members younger than 30 years, overall incidence rates were higher among females than males, while among those older than 30 years, rates were higher among males than females (Table 1).
Among males, annual rates declined from 2002 to 2005 and then slowly increased through the end of the period; in contrast, among females, annual rates increased con-sistently throughout the period. As a result, there was a change in the relationship between male and female incidence rates (“gender
shift ”) in 2005; i.e., prior to 2005, annual rates were higher among males than females, while aft er 2005, rates were consistently higher among females than males (Figure 1).
Among both males and females, rates of urinary stone diagnoses increased with increasing age (Table 1). However, dur-ing the surveillance period, annual rates increased by large percentages in every age group of females, but by relatively small percentages (or not at all) in vari-ous age groups of males (% diff erence in annual rates, 2001 to 2010, by age groups, range: females, 34.6 to 50.4%; males, -0.3 to 17.4%) (Table 1).
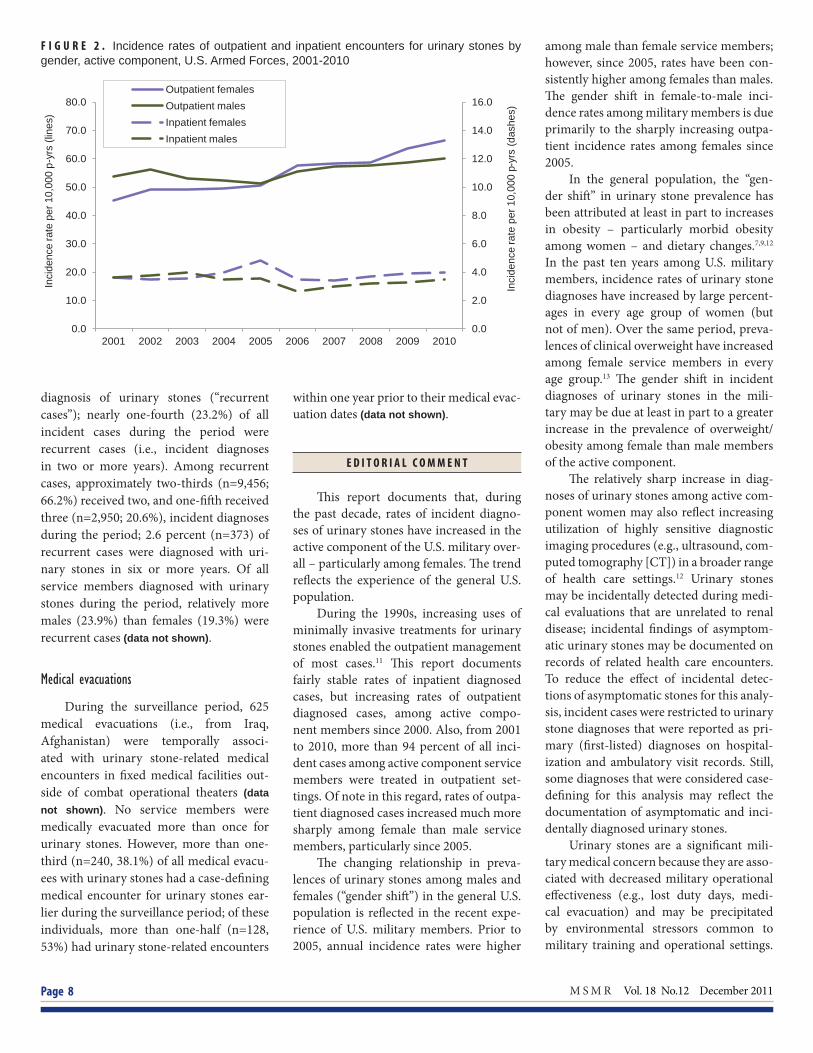
Among both males and females, annual rates of hospitalized cases were fairly stable throughout the period; of note, annual rates of hospitalized cases were con-sistently higher among females than males from 2004 through 2010 (Figure 2).
Among males, annual rates of out-patient diagnoses of urinary stones were stable from 2001 through 2005 and then slowly increased through 2010. Among females, rates slightly increased from 2001 through 2005 and then sharply increased (by approximately 30 percent) from 2005 through 2010. As result, rates of outpatient diagnoses were higher among females than males each year from 2006 through 2010 (Figure 2).
Recurrent diagnoses
During the period, 14,290 service members received more than one incident
No. Ratea IRRb 2001-2010 % change
Total 84,055 58.9 . 15.2 Inpatient encounters 4,917 3.4 . -2.5 Outpatient encounters 79,138 55.5 . 16.4 Gender Female 12,135 58.6 0.99 44.1 Male 71,920 59.0 Ref 11.0 Age group 17-19 2,336 17.1 Ref 9.4 20-29 38,984 47.1 2.76 9.3 30-39 27,545 82.6 4.84 20.2 40+ 15,190 117.2 6.87 16.2 Female age group 17-19 721 31.5 Ref 46.4 20-29 7,443 58.5 1.86 34.6 30-39 2,768 67.4 2.14 50.4 40+ 1,203 75.1 2.38 43.5 Male age group 17-19 1,615 14.2 Ref -0.3 20-29 31,541 45.1 3.18 4.5 30-39 24,777 84.8 5.98 17.4 40+ 13,987 123.2 8.70 14.4 Race-ethnicity White, non-Hispanic 62,529 69.3 2.08 18.2 Black, non-Hispanic 8,267 33.2 Ref 5.9 Hispanic 7,036 48.9 1.47 7.8 Asian/Pacifi c Islander 2,387 36.6 1.10 1.1 American Indian/Alaskan Native 1,451 60.9 1.83 9.7 Other 2,385 56.0 1.68 -21.3 Service Army 29,489 58.2 1.37 32.6 Navy 20,798 59.3 1.40 2.1 Air Force 22,867 66.0 1.56 10.1 Marine Corps 7,791 42.4 Ref 4.3 Coast Guard 3,110 79.0 1.86 34.1
M S M R Vol. 18 No.12 December 2011 Page 8
F I G U R E 2 . Incidence rates of outpatient and inpatient encounters for urinary stones by gender, active component, U.S. Armed Forces, 2001-2010
0.0
2.0
4.0
6.0
8.0
10.0
12.0
14.0
16.0
0.0
10.0
20.0
30.0
40.0
50.0
60.0
70.0
80.0
2001 2002 2003 2004 2005 2006 2007 2008 2009 2010
Inci
denc
e ra
te p
er 1
0,00
0 p-
yrs
(das
hes)
Inci
denc
e ra
te p
er 1
0,00
0 p-
yrs
(line
s)
Outpatient females Outpatient males Inpatient females Inpatient males
diagnosis of urinary stones (“recurrent cases”); nearly one-fourth (23.2%) of all incident cases during the period were recurrent cases (i.e., incident diagnoses in two or more years). Among recurrent cases, approximately two-thirds (n=9,456; 66.2%) received two, and one-fi ft h received three (n=2,950; 20.6%), incident diagnoses during the period; 2.6 percent (n=373) of recurrent cases were diagnosed with uri-nary stones in six or more years. Of all service members diagnosed with urinary stones during the period, relatively more males (23.9%) than females (19.3%) were recurrent cases (data not shown).
Medical evacuations
During the surveillance period, 625 medical evacuations (i.e., from Iraq, Afghanistan) were temporally associ-ated with urinary stone-related medical encounters in fi xed medical facilities out-side of combat operational theaters (data not shown). No service members were medically evacuated more than once for urinary stones. However, more than one-third (n=240, 38.1%) of all medical evacu-ees with urinary stones had a case-defi ning medical encounter for urinary stones ear-lier during the surveillance period; of these individuals, more than one-half (n=128, 53%) had urinary stone-related encounters
within one year prior to their medical evac-uation dates (data not shown).
E D I T O R I A L C O M M E N T
Th is report documents that, during the past decade, rates of incident diagno-ses of urinary stones have increased in the active component of the U.S. military over-all – particularly among females. Th e trend refl ects the experience of the general U.S. population.
During the 1990s, increasing uses of minimally invasive treatments for urinary stones enabled the outpatient management of most cases.11 Th is report documents fairly stable rates of inpatient diagnosed cases, but increasing rates of outpatient diagnosed cases, among active compo-nent members since 2000. Also, from 2001 to 2010, more than 94 percent of all inci-dent cases among active component service members were treated in outpatient set-tings. Of note in this regard, rates of outpa-tient diagnosed cases increased much more sharply among female than male service members, particularly since 2005.
Th e changing relationship in preva-lences of urinary stones among males and females (“gender shift ”) in the general U.S. population is refl ected in the recent expe-rience of U.S. military members. Prior to 2005, annual incidence rates were higher
among male than female service members; however, since 2005, rates have been con-sistently higher among females than males. Th e gender shift in female-to-male inci-dence rates among military members is due primarily to the sharply increasing outpa-tient incidence rates among females since 2005.
In the general population, the “gen-der shift ” in urinary stone prevalence has been attributed at least in part to increases in obesity – particularly morbid obesity among women – and dietary changes.7,9,12 In the past ten years among U.S. military members, incidence rates of urinary stone diagnoses have increased by large percent-ages in every age group of women (but not of men). Over the same period, preva-lences of clinical overweight have increased among female service members in every age group.13 Th e gender shift in incident diagnoses of urinary stones in the mili-tary may be due at least in part to a greater increase in the prevalence of overweight/obesity among female than male members of the active component.
Th e relatively sharp increase in diag-noses of urinary stones among active com-ponent women may also refl ect increasing utilization of highly sensitive diagnostic imaging procedures (e.g., ultrasound, com-puted tomography [CT]) in a broader range of health care settings.12 Urinary stones may be incidentally detected during medi-cal evaluations that are unrelated to renal disease; incidental fi ndings of asymptom-atic urinary stones may be documented on records of related health care encounters. To reduce the eff ect of incidental detec-tions of asymptomatic stones for this analy-sis, incident cases were restricted to urinary stone diagnoses that were reported as pri-mary (fi rst-listed) diagnoses on hospital-ization and ambulatory visit records. Still, some diagnoses that were considered case-defi ning for this analysis may refl ect the documentation of asymptomatic and inci-dentally diagnosed urinary stones.
Urinary stones are a signifi cant mili-tary medical concern because they are asso-ciated with decreased military operational eff ectiveness (e.g., lost duty days, medi-cal evacuation) and may be precipitated by environmental stressors common to military training and operational settings.

December 2011 Vol. 18 No. 12 M S M R Page 9
Particularly during physically rigorous operations in hot, dry environments (such as Iraq and Afghanistan), U.S. military members may be at high risk of dehydra-tion, decreased urine output, concentration of the urine, and urinary stone formation.14 In recent years, on average per year, more than 60 service members have been medi-cally evacuated from combat operational theaters in Iraq and Afghanistan; undoubt-edly, other urinary stone-related cases have been treated in theater hospitals and other fi eld medical facilities. Nearly thirty per-cent of medical evacuees for urinary stones reported urinary stone-related medical encounters within the previous two years. Because of the high recurrence rate and the debilitating morbidity that can result from urinary stones, service members with histories of urinary stones should be counseled and closely supervised to avoid
dehydration and to adhere to diets that reduce the risk of stone formation.
R E F E R E N C E S
1. Coe FL, Parks JH, Asplin JR. The pathogenesis and treatment of kidney stones. N Engl J Med. 1992;327(16):1141-1152.2. Coe FL, Parks JH. The fi nancial effects of kidney stone prevention. Kidney Int. 1996;50:1706-1712.3. Stamatelou KK, Francis ME, Jones CA, et al. Time trends in reported prevalence of kidney stones in the United States: 1976-1994. Kidney Intl. 2003;63:1817-1823.4. Moe OW. Kidney stones: pathophysiology and medical management. Lancet. 2006;367:333-344.5. Curhan GC, Willett WC, Rimm EB, Stampfer MJ. A prospective study of dietary calcium and other nutrients and the risk of symptomatic kidney stones. N Engl J Med. 1993;328:833–838. 6. Curhan GC, Willett WC, Rimm EB, Stampfer MJ. Family history and risk of kidney stones. J Am Soc Nephrol. 1997;8:1568-1573.
7. Taylor EN, Stampfer MJ, Curhan GC. Obesity, weight gain, and the risk of kidney stones. JAMA. 2005;293:455-462.8. Taylor EN, Stampfer MJ, Curhan GC. Diabetes mellitus and the risk of nephrolithiasis. Kidney Int. 2005;68:1230-1235.9. Scales CD Jr, Curtis LH, Norris RD, et al. Changing gender prevalence of stone disease. J Urol. 2007;177(3):979.10. Strope SA, Wolf JS Jr, Hollenbeck BK. Changes in gender distribution of urinary stone disease. J Urol. 2010;75:543-546. 11. Pearle MS, Calhoun EA, Curhan GC, Urologic Diseases of America Project. Urologic diseases in America project: urolithiasis. J Urol. 2005;173(3):848-857.12. Boyce CJ, Pickhardt PJ, Lawrence EM. Prevalence of urolithiasis in asymptomatic adults: objective determination using low dose noncontrast computerized tomography. J Urol. 2010 Mar;183(3):1017-21. Epub 2010 Jan 21.13. Armed Forces Health Surveillance Center. Diagnoses of overweight/obesity, active component, U.S. Armed Forces, 1998-2010. Medical Surveillance Monthly Report (MSMR). 2011;18(1):7-11.14. Evans K, Costabile RA. Time to development of symptomatic urinary calculi in a high risk environment. J Urol. 2005;173:858–861.

M S M R Vol. 18 No.12 December 2011 Page 10
the 5th most frequent diagnosis during hos-pitalizations for active component females (aft er hospitalizations for pregnancy, child-birth, episodic mood disorder, and adjust-ment reaction), and the 2nd most frequent diagnosis during ambulatory visits for neo-plasms.5,6 Fibroid symptoms may result in loss of duty days and the management and treatment of fi broids are an important bur-den on the resources of the Military Health System.
Th is report describes numbers, rates, trends, and demographic characteristics of incident diagnosed cases of uterine fi broids; health care burdens associated with the clinical management of uterine fi broids; and fi broid cases that were fi rst diagnosed during pregnancies of active component females of the U.S. Armed Forces from 2001 to 2010.
M E T H O D S
Th e surveillance period was 1 Janu-ary 2001 to 31 December 2010. Th e sur-veillance population included all females who served in the active component of any branch of the U.S. Armed Forces at any time during the surveillance period. Records of health care encounters (hos-pitalizations and outpatient clinic visits) in the Defense Medical Surveillance Sys-tem were searched to identify encounters associated with uterine fi broids (Table 1).
Uterine Fibroids, Active Component Females, U.S. Armed Forces, 2001-2010
uterine fi broids, or leiomyomas, are benign, oft en asymptomatic tumors of the uterus that occur
frequently in premenopausal women. Risk factors for fi broids include African Amer-ican heritage, early age of menarche, and increasing age before menopause.4 Parity, i.e., the number of pregnancies, is inversely related to the risk of developing fi broids.4 Because many fi broids remain unde-tected, the true prevalence is undoubtedly underestimated.
Symptomatic fi broids can cause appre-ciable morbidity and disability in aff ected women; common symptoms include heavy, painful menstrual bleeding, pelvic pain, urinary frequency, and reproductive diffi culties.
Courses of treatment of symptomatic fi broids vary according to the size, loca-tion, and number of fi broids, the sever-ity of symptoms, and the patient’s desire to retain reproductive ability. Th erapeutic options range from watchful waiting and drug therapy to surgical procedures such as hysterectomy (removal of the uterus) and myomectomy (removal of the fi broid). In the United States, fi broids are the most frequent indication for hysterectomy.1-3 Newer, minimally invasive treatments such as uterine artery embolization and guided focused ultrasound have also become avail-able as treatment options.
In the U.S. Armed Forces in 2010, “uterine leiomyoma” (ICD-9-CM: 218) was
Uterine fi broids are benign tumors of the uterus that can cause signifi cant morbidity in symptomatic women. From 2001 to 2010 there were 11,931 inci-dent cases (incidence rate: 57.6 per 10,000 person-years) of uterine fi broids among active component females. Th e incidence rates were highest among black, non-Hispanic females and increased with advancing age. Th e observed decline in the number and percentage of inpatient hysterectomies for fi broids may refl ect changes in overall treatment patterns during the period. Uterine fi broids commonly aff ect the health and military operational eff ectiveness of women on active duty; research to identify causes and preventive interven-tions is warranted.
In order to limit case-fi nding to symptom-atic fi broids, a case of uterine fi broids was defi ned as an individual with an inpatient or outpatient encounter with a case-defi n-ing code (ICD-9-CM: 218.xx) in the pri-mary (fi rst-listed) diagnostic position; or an inpatient or outpatient encounter with a case-defi ning code in the second diagnostic position and an associated symptom code in the primary (fi rst-listed) diagnostic posi-tion (Table 1). An individual could be an incident case once during the surveillance period; if an individual had a case-defi ning encounter for fi broids before the surveil-lance period, they were excluded from the analysis.
To estimate the health care burden associated with uterine fi broids, all inpa-tient and outpatient medical encounters with a case-defi ning code (ICD-9-CM: 218.xx) reported as primary (fi rst-listed) were identifi ed. Health care burdens were quantifi ed by the total number of medical encounters attributable to uterine fi broid diagnoses, number of individuals aff ected, and the total number of bed days during hospitalizations. Numbers and percent-ages of inpatient treatment procedures for
Case-defi ning codes Uterine leiomyoma 218.xxAssociated symptom codes Anemia due to blood loss
280.0, 285.1
Vaginal bleeding, menstrual bleeding disorders
623.8, 626.5, 626.6,626.8, 626.9
Pain associated with female genital organs
625.0, 625.3, 625.5, 625.9
Inpatient procedure codes Hysterectomy 683, 6831, 6839,
684, 6841, 6849, 6851, 6859, 686, 6879, 689
Myomectomy 6829
T A B L E 1 . ICD-9-CM case-defi ning codes for uterine fi broids and asso-ciated symptom and procedure codes

December 2011 Vol. 18 No. 12 M S M R Page 11
fi broids (e.g., hysterectomy, myomectomy) were calculated from procedures that were documented on records of hospitalizations for uterine fi broids (Table 1).
R E S U L T S
During the period there were 11,931 incident diagnoses of fi broids among active component females (incidence rate: 57.6 per 10,000 person-years [p-yrs]). Hospi-talized cases (n=975; rate=4.7 per 10,000 p-yrs) accounted for 8 percent of all inci-dent encounters (Table 2). Outpatient cases (n=10,956; rate=52.9 per 10,000 p-yrs) accounted for 91 percent of all incident encounters (Table 2). Th e overall inci-dence rate increased 9.2 percent from 2001 to 2010 (52.9 and 57.7 per 10,000 p-yrs, respectively).
Overall rates of incident diagnoses of uterine fi broids increased with advanc-ing age. Th e highest rate occurred in ser-vice women aged 40 years and older (262.8 per 10,000 p-yrs). Th e overall rate among
black, non-Hispanic women (125.9 per 10,000 p-yrs) was over four times that among white, non-Hispanic women (28.4 per 10,000 p-yrs) (Table 2). Compared to
those of all other race-ethnicities, black, non-Hispanic women had higher rates of uterine fi broid in every age group, and rate diff erences increased with increasing ages (Figure 1).
During the period, there were 3,052 hospitalizations of women for treat-ment of fi broids (i.e., the hospitalization record included a fi broid-specifi c code as the primary (fi rst-listed) diagnosis and a fi broid-related procedure code). Of these hospitalizations, nearly 90 percent had primary (fi rst-listed) procedure codes for hysterectomy (n=1,826; 59.8%) or myo-mectomy (n=819; 26.8%) (Figure 2). Of note in this regard, from 2001 to 2010, the per-centage of all inpatient fi broid-related pro-cedures that were hysterectomies sharply declined (2001: 76.5%; 2010: 48.9%), while those that were myomectomies increased (2001: 18.1%; 2010: 29.9%) (Figure 2).
From 2001 to 2006, the number of medical encounters for, individuals aff ected by, and hospital bed days associated with fi broids increased rapidly; however, from 2007 to 2010, these indicators of fi broid-related health care burdens increased only slightly (Figure 3). In 2001, there were 745 medical encounters for treatment of fi broids among 377 aff ected women (i.e., 2.2 encounters per case). Compared to 2001, in 2010 there were many more fi broid-related medical encounters (n=2,952) and aff ected
F I G U R E 1 . Incidence rates of uterine fi broids by age group and race/ethnicity, active component, U.S. Armed Forces, 2001-2010
aRate per 10,000 person-years (p-yrs)bIncidence Rate Ratio
No Rate IRR Total 11,931 57.6 . Inpatient encounters 975 4.7 . Outpatient encounters 10,956 52.9 . Age Group <20 57 2.5 Ref 20-24 608 8.0 3.2 25-29 1,382 30.6 12.3 30-34 2,245 84.1 33.7 35-39 3,427 167.0 67.0 40+ 4,212 262.8 105.5 Race-ethnicity White, non-Hispanic 2,950 28.4 Ref Black, non-Hispanic 7,419 125.9 4.4 Hispanic 711 32.1 1.1 Asian/Pacifi c Islander 334 30.9 1.1 American Indian/Alaskan Native 103 25.7 0.9 Other 414 55.1 1.9 Service Army 5,380 74.3 3.2 Navy 2,429 47.3 2.0 Air Force 3,599 53.3 2.3 Marine Corps 262 23.2 Ref Coast Guard 261 56.9 2.5
0.0
50.0
100.0
150.0
200.0
250.0
300.0
350.0
400.0
450.0
500.0
<20 20-24 25-29 30-34 35-39 40+
Inci
denc
e ra
te p
er 1
0,00
0 p-
yrs
Black, non-Hispanic Other Hispanic American Indian/Alaskan Native Asian/Pacific Islander White, non-Hispanic
T A B L E 2 . Numbers and rates of uterine fi broids (ICD-9-CM: 218.xx), active component, U.S. Armed Forces, 2001-2010

M S M R Vol. 18 No.12 December 2011 Page 12
F I G U R E 3 . Total medical encounters, individuals affected, and hospital bed days for uterine fi broids, active component females, U.S. Armed Forces, 2001-2010
F I G U R E 2 . Percentages of selected medical/surgical procedures (fi rst-listed on standardized records) during uterine fi broid-related hospitalizations, active component females, U.S. Armed Forces, 2001-2010
0
200
400
600
800
1,000
1,200
1,400
1,600
0
500
1,000
1,500
2,000
2,500
3,000
2001 2002 2003 2004 2005 2006 2007 2008 2009 2010
Hos
pita
l bed
day
s (b
oxes
)
Med
ical
enc
ount
ers/
indi
vidu
als
affe
cted
(bar
s)
Medical encounters
Individuals affected
Hospital bed days
through 2010. As in the general U.S. pop-ulation, incident diagnosis rates were rela-tively highest among older premenopausal and black, non-Hispanic active military women.
Of note in this regard, U.S. mili-tary women have “free” (i.e., no personal expense) access to health care, includ-ing periodic “well woman” examinations. Th us, in contrast to the general U.S. expe-rience, among women in active military service, fi broid case ascertainment is likely similar among those of all racial and ethnic backgrounds. Still, among military women, black, non-Hispanic females accounted for 62 percent of all incident cases, and dispari-ties in incidence rates between black, non-Hispanics and all other racial-ethnic group members increased with advancing age.
Overall, the incidence rates of newly diagnosed uterine fi broids increased dur-ing the surveillance period. Th is trend may refl ect an increase in incidental detections of asymptomatic fi broids during routine physical examinations or imaging studies. To reduce the impact of incidental detec-tion of asymptomatic fi broids on case counts in this analysis, incident cases were restricted to those diagnoses recorded in the primary (fi rst-listed) diagnostic posi-tion or the secondary position when a fi broid-associated symptom was reported in the primary position. Despite this meth-odological approach, an undetermined proportion of fi broid diagnoses that were case-defi ning for this analysis may have resulted from incidental detections.
During the surveillance period, there was a decrease in the number and percent-age of primary procedure codes indicative of hysterectomies among women hospital-ized for fi broids. Concurrently, there was an increase in myomectomies and other fi broid-related procedures. Decreasing trends in numbers of inpatient hysterecto-mies may refl ect changes in overall treat-ment patterns for uterine fi broids, e.g., increase in minimally invasive (laparo-scopic) hysterectomies in outpatient set-tings, or alternative treatments for fi broids. Further analyses are required to discern the impacts of changing treatment patterns for uterine fi broids on the experience of aff ected women in military service.
women (n=1,344), but a similar number of medical encounters per case (2.2 encoun-ters per case). Of note, there were more than twice as many hospital bed days attrib-utable to treatment of fi broids in 2010 than 2001 (hospital bed days, by year, 2001: 603; 2010: 1,336) (Figure 3).
E D I T O R I A L C O M M E N T
Th is report summarizes numbers, rates, and trends of incident diagnoses of uterine fi broids, and health care burdens associated with their treatment, among active component women from 2001
0.0
10.0
20.0
30.0
40.0
50.0
60.0
70.0
80.0
90.0
2001 2002 2003 2004 2005 2006 2007 2008 2009 2010
Per
cent
age
of in
patie
nt p
roce
dure
s
Hysterectomy
Myomectomy
Other

December 2011 Vol. 18 No. 12 M S M R Page 13
population trends. Am J Obstet Gynecol. 2011;205:492e1-5.2. Flynn M, Jamison M, Datta S, et al. Health care resource use for uterine fi broid tumors in the United States. Am J Obstet Gynecol. 2006;195:955-964.3. Whitman MK, Hillis SD, Jamieson DJ, et al. Inpatient hysterectomy surveillance in the United States, 2000-2004. Am J Obstet Gynecol. 2008;198:34e1-34e7.4. Laughlin SK, Schroeder JC, Baird DD. New directions in the epidemiology of uterine fi broids. Semin Reprod Med. 2010;28(3): 204-217.5. Armed Forces Health Surveillance Center. Hospitalizations among members of the active component, U.S. Armed Forces, 2010. Medical Surveillance Monthly Report (MSMR). 2011;18(4):8-15.6. Armed Forces Health Surveillance Center. Ambulatory visits among members of the active component, U.S. Armed Forces, 2010. Medical Surveillance Monthly Report (MSMR). 2011;18(4):16-21.
Th is analysis was limited because cases were not characterized by fi broid size, number, anatomic locations, or the natures or severities of associated symptoms. Such factors infl uence clinical management strategies (i.e., whether treatment is indi-cated and, if so, the type, such as surgery); in addition, they determine the extent of morbidity and disability of aff ected female service members. In spite of its limita-tions, this analysis provides an overview of the impact of fi broids on the military healthcare system. For example, during the 10-year surveillance period, over 22,124 medical encounters and 11,585 hospital bed days were attributable to the clinical management of uterine fi broids. Although the severity of disease in female service members was not measured in this report,
uterine fi broids undoubtedly cause symp-tomatic women appreciable morbidity and military operational disability.
Uterine fi broids commonly aff ect the health and military operational eff ective-ness of women in active military service. A mong women in service, those who are black, non-Hispanic are disproportionately aff ected by fi broids. Research to identify causes of and eff ective preventive interven-tions and treatments for uterine fi broids is indicated.
R E F E R E N C E S
1. Wechter ME, Stewart EA, Myers ER, et al. Leiomyoma-related hospitalization and surgery: prevalence and predicted growth based on

M S M R Vol. 18 No.12 December 2011 Page 14
Historical Snapshot: Dr. Anna Baetjer, Industrial Hygiene Pioneer, Military Occupational Health Advocate
in the United States prior to the 1930s, the physical and psychological haz-ards associated with most industrial
jobs and settings, and measures to ensure the health and safety of industrial workers, generated relatively little scientifi c or medi-cal interest. In the late 1930s, however, the American Industrial Hygiene Association was established, and the U.S. Public Health Service initiated industrial hygiene activi-ties throughout the country.
In the early 1940s, mobilization for and conduct of the Second World War required massive increases in the produc-tion of military equipment, supplies, and ammunition for the U.S. Armed Forces. Yet, as the industrial base of the U.S. Armed Forces was expanding, many workers in
manufacturing, transportation, and other industrial trades were leaving for mili-tary service. In response, women in huge numbers stepped forward to work in what had been male dominated occupations. By 1942, the U.S. War Department owned or operated more than 160 industrial plants, and as many as 70 percent of the workers at some of the plants were women.
In 1942, the Army Surgeon General’s Offi ce established an Industrial Medical Program and shortly thereaft er, a central Industrial Hygiene Laboratory; the Indus-trial Hygiene Laboratory was established at the Johns Hopkins School of Hygiene in Baltimore. Th e laboratory received invalu-able support from faculty and technical staff members of the university; together,
they visited military industrial sites, doc-umented hazards associated with various occupations and work areas, sampled air and chemicals to which workers were exposed, and recommended policies and practices to mitigate health threats. (In the nearly 70 years since its founding, the Industrial Hygiene Laboratory has increased in size and changed its name – from Army Envi-ronmental Hygiene Agency [USAEHA], to Army Center for Health Promotion and Preventive Medicine [USACHPPM], to the current Army Public Health Command [USAPHC] – to refl ect its continuously expanding missions).1
In the early 1940s, Doctor Anna Baetjer was a highly regarded researcher, teacher, and consultant in occupational
An 18-year-old woman operates a lathe without eye protection during World War II. The U.S. Army Ordi-nance Department proudly released this photo in 1942 with a caption stating that the “chips are fl ying”. Source: Anderson RS, ed. Special fi elds. In: Preventive Medicine in World War II. Vol 9. Washington, DC: DA Offi ce of The Surgeon General; 1969. Photograph: US Army Signal Corps, 1942.2

December 2011 Vol. 18 No. 12 M S M R Page 15
health on the faculty of the Johns Hopkins School of Hygiene. In addition, she was a strong advocate for the establishment of the Army’s Industrial Hygiene Labora-tory at the university. For more than 40 years, beginning with her support of the Army Laboratory during World War II, she advocated on behalf of military occu-pational health and industrial hygiene eff orts, taught and mentored generations of military occupational and environmental health professionals, led consultations and investigations of military industrial sites, and advised in the development of mili-tary occupational health and safety guide-lines, policies, and practices. Of particular note, at the request of the Offi ce of the Sec-retary of War, Doctor Baetjer studied the health eff ects of military industrial work on women and recommended policies aimed at protecting the health of female workers. Based on her pioneering research, in 1944, the U.S. War Department issued a ground-breaking policy regarding pregnancy
among civilian workers that limited work periods relative to weeks of pregnancy and during postpartum periods; required that job assignments not endanger the health of pregnant employees; and protected job security and seniority of pregnant employ-ees. Such a policy was unprecedented in American industrial employee relations. In 1946, Dr. Baetjer summarized her research fi ndings in the seminal treatise Women in Industry. Th eir Health and Effi ciency. Aft er the war, Dr. Baetjer expanded her teaching and research activities at Johns Hopkins, served as president of the American Indus-trial Hygiene Association, and advised the National Research Council and the Envi-ronmental Protection Agency. In addition, she remained a trusted adviser and consul-tant to the Army Environmental Hygiene Agency and Offi ce of the Surgeon General.1
Since 2001, there has been another massive shift in the roles of women in sup-port of U.S. war operations. In theaters of combat operations in Afghanistan and Iraq,
women have served in larger numbers, greater proportions, and more diverse military occupations – and have been exposed to more direct combat activities – than in any other U.S. wartime period. Following the lead of Dr. Baetjer and her colleagues during World War II, this (and several past) issues of the MSMR docu-ment the health of women during times of unprecedented military occupational activities in mentally and physically chal-lenging set tings.
R E F E R E N C E S
1. Baetjer AM. The U.S. Army Environmental Hygiene Agency. Med Bull US Army Eur. 1985 Jan;42(1):27-30.2. Gaydos JC. ch 1, Occupational health in the U.S. Army, 1775-1990, in Occupational Health: The Soldier and the Industrial Base. Washington, DC. Borden Institute. Offi ce of the Surgeon General, United States Department of the Army. 1993.

M S M R Vol. 18 No.12 December 2011 Page 16
No. % Total 156,314 100.0 Age group <20 6,570 4.2 20-24 74,426 47.6 25-29 43,966 28.1 30-34 21,115 13.5 35-39 8,748 5.6 40+ 1,489 1.0 Race/ethnicity White, non-Hispanic 74,349 47.6 Black, non-Hispanic 45,484 29.1 Other 36,481 23.3 Service branch Army 52,840 33.8 Navy 41,676 26.7 Air Force 47,816 30.6 Marine Corps 11,144 7.1 Coast Guard 2,838 1.8 Military status Enlisted (E) 137,220 87.8 Offi cer (O) 19,094 12.2
T A B L E 1 . Live births among active component women, by selected demographic and military characteristics, active component, U.S. Armed Forces, 2001-2010
F I G U R E 1 . Age-specifi c birth ratesa, active component, U.S. Armed Forces.
0.0
20.0
40.0
60.0
80.0
100.0
120.0
2001 2002 2003 2004 2005 2006 2007 2008 2009 2010
Live
birt
hs p
er 1
,000
per
son-
year
s 20-24
25-29
30-34
18-19
35-39
40-44
45-49
aNumber of live births divided by person-years of military service
in the general U.S. population, birth rates have been fairly stable during the past 10 years. As a result of delayed
childbearing, birth rates among women in their 30s and 40s have been increas-ing while birth rates in younger women have been decreasing.1 Among U.S. ser-vice members, the fertility rate (the average number of births per woman) diff ers by ser-vice branch due to the diff erent age compo-sitions of the services and perhaps diff erent deployment experiences. Th is report sum-marizes trends in births by age and service among active component females during the past 10 years.
M E T H O D S
Th e surveillance population consisted of all active component female service members 17 to 49 years of age with deliv-ery hospitalizations during 2001-2010. A delivery hospitalization was defi ned as an inpatient record with one of the follow-ing in any diagnostic position: ICD-9 code V27.0-V27.9 “outcome of delivery”, ICD-9 code 650 “normal delivery” or fi ft h-digit classifi cations of “delivered” or “postpar-tum condition” with an ICD-9 code in the range 640-679 “complications of preg-nancy”. Individuals were allowed one deliv-ery hospitalization every 280 days.
Summary measures were numbers of live births among members of the surveil-lance population, age-specifi c birth rates (calculated as live births per 1,000 person-years of active military service) and total fertility rate, an estimate of the number of children a cohort of 1,000 women would bear during their childbearing years, if all years were spent in active military service. Birth rates were summarized in relation to person-years of, rather than numbers of women in, military service because the U.S. military is a dynamic cohort – every
day, many women enter and many others leave service – and total person-years was considered a more consistent measure of pregnancy and delivery experiences across calendar years.
R E S U L T S
Among women who served in the active component from 1 January 2001 to 31 December 2010, there were 156,314 deliveries ending in live births (Table 1) and 9 stillbirths (removed from analysis to facilitate birth rate calculation). Th e annual number of births was stable, ranging from 14,933 (in 2009) to 16,383 (in 2003) (data not shown).
Th e majority of births (51.8%) were to women 18-24 years old (there were none among 17-year-olds) and one in 15 (6.6%) births were to those older than 34 (Table 1). Th e mean age at delivery increased monotonically from 24.9 years (in 2001 and 2002) to 26.0 years (in 2010) (data not
Brief Report Births, Active Component, U.S. Armed Forces, 2001-2010

December 2011 Vol. 18 No. 12 M S M R Page 17
aAn estimate of the number of children a cohort of 1,000 women would deliver if they experienced the observed age-specifi c birth rates throughout their reproductive lives.
F I G U R E 2 . Total fertility ratesa, by year and service branch, active component, U.S. Armed Forces, 2001-2010.
1,000
1,200
1,400
1,600
1,800
2,000
2,200
2001 2002 2003 2004 2005 2006 2007 2008 2009 2010
Live
birt
hs p
er 1
,000
wom
en
Marine Corps
Navy
Army
Air Force
Coast Guard
shown). Age-specifi c birth rates for the 10-year period were highest among women 20-24 (100.3 per 1,000 person-years [p-yrs]), 25-29 (92.4 per 1,000 p-yrs) and 30-34 (76.3 person 1,000 p-yrs) and lowest among women in their 40s (Figure 1). Th e 10-year birth rate among 18-19-year-old service members (37.4 per 1,000 p-yrs) was just slightly lower than that of women aged 35-39 (41.4 per 1,000 p-yrs). During the period, birth rates among 18-24-year-olds generally decreased, while rates among those aged 30-45 generally increased.
Th ere were more births during the period among members of the Army (33.8% of all births) and the Air Force
(30.6%) (Table 1); however, the highest total fertility rates were among women in the Marine Corps and Navy (Figure 2). In 2010, a hypothetical cohort of 1,000 female Marine Corps members would bear 2,008 children (i.e., average of 2 children per woman) during their lifetimes if they experienced the age-specifi c birth rates observed among Marine Corps women throughout their childbearing years. Sim-ilar cohorts of female sailors, soldiers and airmen would bear 1,828, 1,661 and 1,654 children, respectively. Th e Coast Guard had the lowest total fertility rate among the services in 2010 and during most years of the period.
E D I T O R I A L C O M M E N T
During 2001-2010, an average of 15,600 children were born to active com-ponent females each year. Th e highest birth rates were among those in their 20s, but the birth rates among women in their 30s and 40s increased. Women in the Marine Corps and Navy had higher total fertility rates than those in the other services. Of note, 20-24-year-old Marines had much higher age-specifi c birth rates than their same-aged counterparts in the other services.
An important limitation of this report is that it summarizes only births to women in active military service. Children who are born to women before and aft er they serve in the military are not accounted for in this report. Th e wars in Iraq and Afghanistan were ongoing during most of the surveil-lance period. Th is report did not explore the potiental impact of factors such as fre-quency and length of overseas deployment and policies regarding postpartum defer-ment from deployment.
During the past 10 years, there were no deliveries among 17-year-old service members. For purposes of birth rate cal-culations in this report, 17-year-olds were not considered at risk for birth. Although females may enter into military service at age 17, they are not allowed to be pregnant at the time of entry and those who become pregnant during their fi rst 180 days of ser-vice are usually separated.
R E F E R E N C E S
1. Hamilton BE, Martin JA, Ventura MA. Births: preliminary data for 2010. Natl Vital Stat Rep. 2011 Nov; 60(2):1-36. Available at: http://www.cdc.gov/nchs/data/nvsr/nvsr60/nvsr60_02.pdf

M S M R Vol. 18 No.12 December 2011 Page 18
Brief Report
as of 30 September 2011, women composed 14.5 percent (n=204,706) of the active components of the
U.S. Army, Navy, Marine Corps, and Air Force and 13.8 percent of the active duty members of the U.S. Coast Guard (Table 1).
Among the service branches, the Air Force (19.0%) and Marine Corps (6.8%) had the largest and smallest proportions of women among their active component members, respectively (Table 1). Women
T A B L E 1 . Profi le of women serving in the U.S. Armed Forces as of 30 September 2011
Total Army Navy Air Force Marine Corps Coast Guard All active component 1,453,429 561,435 320,139 328,821 201,025 42,009 Women 210,502 76,013 52,414 62,592 13,687 5,796 % of active component 14.5% 13.5% 16.4% 19.0% 6.8% 13.8% Men 1,242,927 485,422 267,725 266,229 187,338 36,213 % of active component 85.5% 86.5% 83.6% 81.0% 93.2% 86.2% Women only Military status Enlisted 171,261 60,253 43,894 50,302 12,360 4,452 % of all enlisted 14.2% 13.0% 16.4% 19.1% 6.9% 13.3% Offi cers, commissioned/warrant 39,241 15,760 8,520 12,290 1,327 1,344 % of all offi cers 15.9% 16.2% 16.0% 18.8% 6.1% 16.0% OEF/OIF/OND deployments (since 2001) Any deployment 50.6% 59.0% 49.1% 48.9% 36.5% 4.2% 1 29.3% 33.6% 29.7% 27.5% 23.4% 3.7% 2 13.8% 16.8% 13.3% 12.8% 9.3% 0.4% 3 or more 7.4% 8.5% 6.1% 8.6% 3.7% 0.1% Enlisted occupations % of women among all persons in occupational positions Health care specialists 30.5% 27.4% 19.6% 49.3% N/A 34.4% Functional support and administration 30.1% 32.6% 24.2% 36.0% 18.7% 31.0% Service and supply handlers 16.4% 17.7% 19.6% 17.1% 8.9% 1.1% Communications and intelligence specialists 14.3% 9.2% 21.7% 22.1% 8.3% 19.2% Other occupations enlisted 13.0% 13.5% 15.8% 14.5% 7.4% 13.8% Electronic equipment repairers 10.1% 11.4% 11.9% 9.3% 4.9% 4.9% Electrical/mechanical equipment repairers 8.5% 7.4% 13.0% 5.9% 4.7% 7.8% Infantry, gun crews, and seamanship specialists 2.8% 0.9% 14.6% 7.2% 0.5% 5.8% Offi cer occupations % of women among all persons in occupational positions Health care 39.2% 37.2% 37.5% 43.9% N/A 13.0% Administrators 26.6% 28.1% 21.2% 31.3% 17.7% 19.1% Supply, procurement and allied 19.1% 22.6% 13.8% 20.6% 9.9% 11.6% Other occupations 15.2% 13.9% 16.0% 17.7% 7.7% 17.6% Engineering and maintenance 10.9% 13.4% 5.4% 12.9% 4.6% 0.7% Tactical operations 5.2% 2.8% 7.9% 7.2% 2.4% 3.6%
accounted for approximately one-fifth (19.3%; n=2,596) of all U.S. military ser-vice academy cadets and midshipmen and nearly one-third (31%) of all cadets at the U.S. Coast Guard Academy (Table 2). Among the service academies, the U.S. Air Force Academy had relatively more women (22.0%) in 2011, and the largest absolute and relative increases (n=395, +70.7%) in women since 1994 (Table 2).
From 1994 to 2011, the absolute and relative numbers of women in the active component of the U.S. Armed Forces slightly increased (Table 2). Of note how-ever, in 2011 compared to 1994, there were more than six times as many women among the highest ranking offi cers (Gener-als/Admirals), more than 80 percent more women in the highest enlisted grade (E9), and more than 60 percent more women in military service academies (Table 2).
Numbers and Characteristics of Women in the Active Component, U.S. Armed Forces, 2011

December 2011 Vol. 18 No. 12 M S M R Page 19
In regard to military occupations, women account for nearly one-third of all enlisted health care and “administra-tive and functional support” specialists and approximately 40 percent of all health care offi cers. Of particular note, in the Air Force, women constitute 49 percent and 44 percent of all enlisted members and offi cers
in health care-related occupations, respec-tively (Table 1).
Of all female members of the active component in September 2011, approxi-mately one-half (50.6%) had deployed at least once in support of Operations Endur-ing Freedom, Iraqi Freedom, or New Dawn (Table 1).
Finally, over the last 10 years (2002 –2011), the median age of female active component members overall has increased from 24 years to 26 years; women in the Marine Corps are younger (median age: 23 years) than their coun-terparts in the other services (data not shown).
September 1994 September 2011 1994-2011No. % of all persons No. % of all persons No. increase Percent increase (%)
Active component 198,087 12.4 204,712 14.5 6,625 3.3 Offi cers, total 31,815 13.0 37,807 15.9 5,992 18.8 - General/Admiral (O7-O10) 11 1.2 71 7.3 60 545.5 - Colonel/Captain (O6) 590 4.8 1,372 11.3 782 132.5 Enlisted members, total 166,272 12.3 166,905 14.2 633 0.4 - Highest grade (E9) 405 3.3 755 7.3 350 86.4 - Next highest grade (E8) 1,775 5.9 2,541 9.3 766 43.2 Cadets/Midshipmen, total 1,601 13.0 2,596 19.3 995 62.1 - U.S. Military Academy 477 11.9 743 16.1 266 55.8 - U.S. Naval Academy 565 13.2 899 19.9 334 59.1 - U.S. Air Force Academy 559 14.0 954 22.0 395 70.7
T A B L E 2 . Proportions of women in certain categories of military service, 1994 vs 2011 (U.S. Coast Guard excluded)

M S M R Vol. 18 No.12 December 2011 Page 20
Deployment-related conditions of special surveillance interest, U.S. Armed Forces, by month and service, January 2003 - November 2011 (data as of 26 December 2011)
Deaths following motor vehicle accidents occurring in non-military vehicles and outside of the operational theater (per the DoD Medical Mortality Registry)
Reference: Armed Forces Health Surveillance Center. Motor vehicle-related deaths, U.S. Armed Forces, 2010. Medical Surveillance Monthly Report (MSMR). Mar 11;17(3):2-6.Note: Death while deployed to/within 90 days of returning from OEF/OIF/OND. Excludes accidents involving military-owned/special use motor vehicles. Excludes individuals medically evacuated from CENTCOM and/or hospitalized in Landstuhl, Germany within 10 days prior to death.
Note: Hospitalization (one per individual) while deployed to/within 90 days of returning from OEF/OIF/OND. Excludes accidents involving military-owned/special use motor vehicles. Excludes individuals medically evacuated from CENTCOM and/or hospitalized in Landstuhl, Germany within 10 days of another motor vehicle accident-related hospitalization.
Hospitalizations for motor vehicle accidents occurring in non-military vehicles and outside of the operational theater (ICD-9-CM: E810-E825; NATO Standard Agreement 2050 (STANAG): 100-106, 107-109, 120-126, 127-129)
0
5
10
15
20
25
Janu
ary
2003
April
200
3
July
200
3
Oct
ober
200
3
Janu
ary
2004
April
200
4
July
200
4
Oct
ober
200
4
Janu
ary
2005
April
200
5
July
200
5
Oct
ober
200
5
Janu
ary
2006
April
200
6
July
200
6
Oct
ober
200
6
Janu
ary
2007
April
200
7
July
200
7
Oct
ober
200
7
Janu
ary
2008
April
200
8
July
200
8
Oct
ober
200
8
Janu
ary
2009
April
200
9
July
200
9
Oct
ober
200
9
Janu
ary
2010
April
201
0
July
201
0
Oct
ober
201
0
Janu
ary
2011
April
201
1
July
201
1
Oct
ober
201
1
No.
of h
ospi
taliz
atio
ns
Motorcycle accident-related hospitalizations
Other MVA-related hospitalizations
9.0/mo 9.9/mo 8.0/mo 8.3/mo 6.9/mo 8.8/mo 9.7/mo 8.7/mo 6.3/mo
0
2
4
6
8
10
12
Janu
ary 2
003
Ap
ril 2
003
Ju
ly 20
03
Oct
ober
200
3
Janu
ary 2
004
Ap
ril 2
004
Ju
ly 20
04
Oct
ober
200
4
Janu
ary 2
005
Ap
ril 2
005
Ju
ly 20
05
Oct
ober
200
5
Janu
ary 2
006
Ap
ril 2
006
Ju
ly 20
06
Oct
ober
200
6
Janu
ary 2
007
April
200
7
July
2007
O
ctob
er 2
007
Janu
ary 2
008
April
200
8 Ju
ly 20
08
Oct
ober
200
8
Janu
ary 2
009
April
200
9 Ju
ly 20
09
Oct
ober
200
9
Janu
ary 2
010
April
201
0 Ju
ly 20
10
Oct
ober
201
0
Janu
ary 2
011
April
201
1 Ju
ly 20
11
Oct
ober
201
1
No. o
f dea
ths
Motorcycle accident-related deaths
Other MVA-related deaths
2.5/mo 2.2/mo 4.2/mo 3.3/mo 2.1/mo 2.6/mo 1.3/mo 1.9/mo 0.6/mo

December 2011 Vol. 18 No. 12 M S M R Page 21
Deployment-related conditions of special surveillance interest, U.S. Armed Forces, by month and service, January 2003 -November 2011 (data as of 22 December 2011)
Reference: Armed Forces Health Surveillance Center. Deriving case counts from medical encounter data: considerations when interpreting health surveillance reports. MSMR. Dec 2009; 16(12):2-8.aIndicator diagnosis (one per individual) during a hospitalization or ambulatory visit while deployed to/within 30 days of returning from OEF/OIF/OND. (Includes in-theater medical encounters from the Theater Medical Data Store [TMDS] and excludes 3,528 deployers who had at least one TBI-related medical encounter any time prior to OEF/OIF/OND).
Reference: Isenbarger DW, Atwood JE, Scott PT, et al. Venous thromboembolism among United States soldiers deployed to Southwest Asia. Thromb Res. 2006;117(4):379-83.bOne diagnosis during a hospitalization or two or more ambulatory visits at least 7 days apart (one case per individual) while deployed to/within 90 days of returning from OEF/OIF/OND.
Traumatic brain injury (ICD-9: 310.2, 800-801, 803-804, 850-854, 907.0, 950.1-950.3, 959.01, V15.5_1-9, V15.5_A-F, V15.52_0-9, V15.52_A-F, V15.59_1-9, V15.59_A-F)a
Deep vein thrombophlebitis/pulmonary embolus (ICD-9: 415.1, 451.1, 451.81, 451.83, 451.89, 453.2, 453.40 - 453.42 and 453.8)b
0
200
400
600
800
1000
1200
1400
1600
1800
Janu
ary
2003
Ap
ril 2
003
Ju
ly 20
03
Oct
ober
200
3
Janu
ary
2004
Ap
ril 2
004
Ju
ly 20
04
Oct
ober
200
4
Janu
ary
2005
Ap
ril 2
005
Ju
ly 20
05
Oct
ober
200
5
Janu
ary
2006
Ap
ril 2
006
Ju
ly 20
06
Oct
ober
200
6
Janu
ary
2007
Ap
ril 2
007
Ju
ly 20
07
Oct
ober
200
7
Janu
ary
2008
Ap
ril 2
008
July
2008
O
ctob
er 2
008
Janu
ary
2009
Ap
ril 2
009
July
2009
O
ctob
er 2
009
Janu
ary
2010
Ap
ril 2
010
July
2010
O
ctob
er 2
010
Janu
ary
2011
Ap
ril 2
011
July
2011
O
ctob
er 2
011
No. o
f cas
es
Marine Corps Air Force Navy Army
482.7/mo 621.2/mo 71.9/mo 85.8/mo 133.1/mo 259.3/mo 532.2/mo 604.1/mo 615.4/mo
0
10
20
30
40
Janu
ary
2003
Ap
ril 2
003
Ju
ly 20
03
Oct
ober
200
3
Janu
ary
2004
Ap
ril 2
004
Ju
ly 20
04
Oct
ober
200
4
Janu
ary
2005
Ap
ril 2
005
Ju
ly 20
05
Oct
ober
200
5
Janu
ary
2006
Ap
ril 2
006
Ju
ly 20
06
Oct
ober
200
6
Janu
ary
2007
Ap
ril 2
007
Ju
ly 20
07
Oct
ober
200
7
Janu
ary
2008
Ap
ril 2
008
July
2008
O
ctob
er 2
008
Janu
ary
2009
Ap
ril 2
009
July
2009
O
ctob
er 2
009
Janu
ary
2010
Ap
ril 2
010
July
2010
O
ctob
er 2
010
Janu
ary
2011
Ap
ril 2
011
July
2011
O
ctob
er 2
011
No. o
f cas
es
Marine Corps Air Force Navy Army
18.8/mo 20.4/mo 12.2/mo 15.7/mo 13.9/mo 17.9/mo 22.8/mo 17.9/mo 20.5/mo

M S M R Vol. 18 No.12 December 2011 Page 22
Deployment-related conditions of special surveillance interest, U.S. Armed Forces, by month and service, January 2003 - November 2011 (data as of 22 December 2011)
Amputations (ICD-9-CM: 887, 896, 897, V49.6 except V49.61-V49.62, V49.7 except V49.71-V49.72, PR 84.0-PR 84.1, except PR 84.01-PR 84.02 and PR 84.11)a
Reference: Army Medical Surveillance Activity. Deployment-related condition of special surveillance interest: amputations. Amputations of lower and upper extremities, U.S. Armed Forces, 1990-2004. MSMR. Jan 2005;11(1):2-6.aIndicator diagnosis (one per individual) during a hospitalization while deployed to/within 365 days of returning from OEF/OIF/OND.
Heterotopic ossifi cation (ICD-9: 728.12, 728.13, 728.19)b
Reference: Army Medical Surveillance Activity. Heterotopic ossifi cation, active components, U.S. Armed Forces, 2002-2007. MSMR. Aug 2007; 14(5):7-9.bOne diagnosis during a hospitalization or two or more ambulatory visits at least 7 days apart (one case per individual) while deployed to/within 365 days of returning from OEF/OIF/OND.
0.0
5.0
10.0
15.0
20.0
25.0
30.0
35.0
40.0
Janu
ary
2003
Ap
ril 2
003
Ju
ly 20
03
Oct
ober
200
3
Janu
ary
2004
Ap
ril 2
004
Ju
ly 20
04
Oct
ober
200
4
Janu
ary
2005
Ap
ril 2
005
Ju
ly 20
05
Oct
ober
200
5
Janu
ary
2006
Ap
ril 2
006
Ju
ly 20
06
Oct
ober
200
6
Janu
ary
2007
Ap
ril 2
007
Ju
ly 20
07
Oct
ober
200
7
Janu
ary
2008
Ap
ril 2
008
July
2008
O
ctob
er 2
008
Janu
ary
2009
Ap
ril 2
009
July
2009
O
ctob
er 2
009
Janu
ary
2010
Ap
ril 2
010
July
2010
O
ctob
er 2
010
Janu
ary
2011
Ap
ril 2
011
July
2011
O
ctob
er 2
011
No. o
f cas
es
Marine Corps Air Force Navy Army
7.3/mo 16.3/mo 7.0/mo 13.0/mo 17.1/mo 12.8/mo 13.2/mo 9.1/mo 19.5/mo
0
5
10
15
20
Janu
ary
2003
Ap
ril 2
003
Ju
ly 20
03
Oct
ober
200
3
Janu
ary
2004
Ap
ril 2
004
Ju
ly 20
04
Oct
ober
200
4
Janu
ary
2005
Ap
ril 2
005
Ju
ly 20
05
Oct
ober
200
5
Janu
ary
2006
Ap
ril 2
006
Ju
ly 20
06
Oct
ober
200
6
Janu
ary
2007
Ap
ril 2
007
Ju
ly 20
07
Oct
ober
200
7
Janu
ary
2008
Ap
ril 2
008
Ju
ly 20
08
Oct
ober
200
8
Janu
ary
2009
Ap
ril 2
009
July
2009
O
ctob
er 2
009
Janu
ary
2010
Ap
ril 2
010
July
2010
O
ctob
er 2
010
Janu
ary
2011
Ap
ril 2
011
July
2011
O
ctob
er 2
011
No.
of c
ases
Marine Corps Air Force Navy Army
5.3/mo 7.3/mo 3.2/mo 1.1/mo 5.7/mo 8.4/mo 10.4/mo 10.4/mo 10.6/mo

December 2011 Vol. 18 No. 12 M S M R Page 23
Deployment-related conditions of special surveillance interest, U.S. Armed Forces, by month and service, January 2003 - November 2011 (data as of 22 December 2011)
Reference: Army Medical Surveillance Activity. Deployment-related condition of special surveillance interest: severe acute pneumonia. Hospitalizations for acute respiratory failure (ARF)/acute respiratory distress syndrome (ARDS) among participants in Operation Enduring Freedom/Operation Iraqi Freedom, active components, U.S. Armed Forces, Janu-ary 2003-November 2004. MSMR. Nov/Dec 2004;10(6):6-7.aIndicator diagnosis (one per individual) during a hospitalization while deployed to/within 30 days of returning from OEF/OIF/OND.
Severe acute pneumonia (ICD-9: 518.81, 518.82, 480-487, 786.09)a
Leishmaniasis (ICD-9: 085.0 to 085.9)b
Reference: Army Medical Surveillance Activity. Deployment-related condition of special surveillance interest: leishmaniasis. Leishmaniasis among U.S. Armed Forces, January 2003-November 2004. MSMR. Nov/Dec 2004;10(6):2-4.bIndicator diagnosis (one per individual) during a hospitalization, ambulatory visit, and/or from a notifi able medical event during/after service in OEF/OIF/OND.
0
1
2
3
4
5
Janu
ary
2003
Ap
ril 2
003
Ju
ly 20
03
Oct
ober
200
3
Janu
ary
2004
Ap
ril 2
004
Ju
ly 20
04
Oct
ober
200
4
Janu
ary
2005
Ap
ril 2
005
Ju
ly 20
05
Oct
ober
200
5
Janu
ary
2006
Ap
ril 2
006
Ju
ly 20
06
Oct
ober
200
6
Janu
ary
2007
Ap
ril 2
007
Ju
ly 20
07
Oct
ober
200
7
Janu
ary
2008
Ap
ril 2
008
July
2008
O
ctob
er 2
008
Janu
ary
2009
Ap
ril 2
009
July
2009
O
ctob
er 2
009
Janu
ary
2010
Ap
ril 2
010
July
2010
O
ctob
er 2
010
Janu
ary
2011
Ap
ril 2
011
July
2011
O
ctob
er 2
011
No. o
f cas
es
Marine Corps Air Force Navy Army
0.6/mo 0.8/mo 0.8/mo 1.7/mo 0.6/mo 0.7/mo 0.9/mo 1.0/mo 0.6/mo
0
50
100
150
Janu
ary
2003
Ap
ril 2
003
Ju
ly 20
03
Oct
ober
200
3
Janu
ary
2004
Ap
ril 2
004
Ju
ly 20
04
Oct
ober
200
4
Janu
ary
2005
Ap
ril 2
005
Ju
ly 20
05
Oct
ober
200
5
Janu
ary
2006
Ap
ril 2
006
Ju
ly 20
06
Oct
ober
200
6
Janu
ary
2007
Ap
ril 2
007
Ju
ly 20
07
Oct
ober
200
7
Janu
ary
2008
Ap
ril 2
008
July
2008
O
ctob
er 2
008
Janu
ary
2009
Ap
ril 2
009
July
2009
O
ctob
er 2
009
Janu
ary
2010
Ap
ril 2
010
July
2010
O
ctob
er 2
010
Janu
ary
2011
Ap
ril 2
011
July
2011
O
ctob
er 2
011
No. o
f cas
es
Marine Corps Air Force Navy Army
5.4/mo 51.8/mo 48.9/mo 8.2/mo 4.6/mo 5.3/mo 13.9/mo 4.0/mo 3.2/mo

Medical Surveillance Monthly Report (MSMR)Armed Forces Health Surveillance Center11800 Tech Road, Suite 220 (MCAF-CS)Silver Spring, MD 20904
T H E M E D I C A L S U R V E I L L A N C E M O N T H L Y R E P O R T ( M S M R ) , in continuous publication since 1995, is produced by the Armed Forces Health Surveillance Center (AFHSC). Th e MSMR provides evidence-based estimates of the incidence, distribution, impact and trends of illness and injuries among United States military members and associated populations. Most reports in the MSMR are based on summaries of medical administrative data that are routinely provided to the AFHSC and integrated into the Defense Medical Surveillance System for health surveillance purposes.
All previous issues of the MSMR are available online at www.afh sc.mil. Subscriptions (electronic and hard copy) may be requested online at www.afh sc.mil/msmrSubscribe or by contacting AFHSC at (301) 319-3240. E-mail: msmr.afh [email protected]
Submissions: Suitable reports include surveillance summaries, outbreak reports and cases series. Prospective authors should contact the Editor at msmr.afh [email protected]
All material in the MSMR is in the public domain and may be used and reprinted without permission. When citing MSMR articles from April 2007 to current please use the following format: Authors (or if none listed, Armed Forces Health Surveillance Center). Title. Medical Surveillance Monthly Report (MSMR). Year Month;Volume(No):pages. For citations before April 2007: Army Medical Surveillance Activity. Title. Medical Surveillance Monthly Report (MSMR). Year Month; Volume(No): pages.
Opinions and assertions expressed in the MSMR should not be construed as refl ecting offi cial views, policies, or positions of the Department of Defense or the United States Government.
ISSN 2158-0111 (print)ISSN 2152-8217 (online)
Director, Armed Forces Health Surveillance Center CAPT Kevin L. Russell, MD, MTM&H, FIDSA (USN)
EditorFrancis L. O’Donnell, MD, MPH
Contributing Former EditorJohn F. Brundage, MD, MPH
Writer-Editor Ellen R. Wertheimer, MHSDenise S. Olive, MS
Contributing Editor Leslie L. Clark, PhD, MS
Visual Information Specialist Jennifer L. Bondarenko
Data AnalysisVicki N. Jeff riesKathleen M. Shannon, MPHStephen B. Taubman, PhD
Editorial Oversight COL Robert J. Lipnick, MSS, ScD (USA) Mark V. Rubertone, MD, MPH Joel C. Gaydos, MD, MPH